DOI:10.32604/cmc.2022.017701
| Computers, Materials & Continua DOI:10.32604/cmc.2022.017701 | |
| Article |
An Integrated Deep Learning Framework for Fruits Diseases Classification
1Department of Computer Science, HITEC University Taxila, Taxila, Pakistan
2College of Computer Science and Engineering, University of Ha'il, Ha'il, Saudi Arabia
3Department of Computer Science, Bahria University, Islamabad
4College of Computer Engineering and Sciences, Prince Sattam Bin Abdulaziz University, Al-Khraj, Saudi Arabia
5Department of Computer Science and Engineering, Soonchunhyang University, Asan, Korea
6Faculty of Applied Computing and Technology, Noroff University College, Kristiansand, Norway
*Corresponding Author: Yunyoung Nam. Email: ynam@sch.ac.kr
Received: 08 February 2021; Accepted: 04 April 2021
Abstract: Agriculture has been an important research area in the field of image processing for the last five years. Diseases affect the quality and quantity of fruits, thereby disrupting the economy of a country. Many computerized techniques have been introduced for detecting and recognizing fruit diseases. However, some issues remain to be addressed, such as irrelevant features and the dimensionality of feature vectors, which increase the computational time of the system. Herein, we propose an integrated deep learning framework for classifying fruit diseases. We consider seven types of fruits, i.e., apple, cherry, blueberry, grapes, peach, citrus, and strawberry. The proposed method comprises several important steps. Initially, data increase is applied, and then two different types of features are extracted. In the first feature type, texture and color features, i.e., classical features, are extracted. In the second type, deep learning characteristics are extracted using a pretrained model. The pretrained model is reused through transfer learning. Subsequently, both types of features are merged using the maximum mean value of the serial approach. Next, the resulting fused vector is optimized using a harmonic threshold-based genetic algorithm. Finally, the selected features are classified using multiple classifiers. An evaluation is performed on the PlantVillage dataset, and an accuracy of 99% is achieved. A comparison with recent techniques indicate the superiority of the proposed method.
Keywords: Fruit diseases; data augmentation; deep learning; classical features; features fusion; features selection
Agricultural imaging is an important research domain in image processing and computer vision [1]. Fruit plants contribute significantly to the economic growth of any country [2,3]. They not only provide food and raw materials, but also contribute to the employment of the local population [4]. Fruit plants that contribute primarily to production include citrus fruits, apples, grapes, and peaches. Citrus fruits are beneficial to human health as they are abundant in vitamin C [5]. Fruit diseases affect the production of fruits; the reduction in fruit productivity inevitably affects the overall economy of a country. Therefore, it is important to detect and recognize these diseases at the early stage to overcome major losses. The most typical citrus fruit diseases include downy, greening, canker, and black spots. Main leaf diseases that affect apple production are frog eye spots, cedar rust, mosaics, gray spots, and scabs. The detection and identification of fruit diseases at the early stage can improve fruit quality and production [6]. The manual detection process incurs considerable time and energy; therefore, computerized techniques must be introduced.
Recently, the automated recognition of fruit diseases has garnered significant interest in the field of computer vision. The primary procedures of these automated systems are preprocessing, segmentation, feature extraction, feature selection, and classification [7]. Researchers have primarily focused on enhancing the efficiency of the system using different techniques in these procedures. Researchers have utilized different segmentation methods such as K-means clustering [8], snake segmentation [9], globally adaptive thresholding [10], and genetic cellular neural network-based segmentation [11] to identify the infected regions in fruit plant diseases.
Feature extraction is crucial in fruit disease classification. During feature extraction, handcrafted features and deep CNN features are extracted for disease identification. The important handcrafted features for fruit plant and leaf disease recognition are color and texture features [12]. In [13], researchers utilized color features for disease recognition. For texture feature extraction, researchers utilized the local binary pattern (LBP) [14] and color texture features [15]. Additionally, deep-learning-based features have garnered significant attention for the classification of different fruit diseases [16,17]. Deep CNN features can improve recognition accuracy. Some deep-feature-based systems are used for recognizing plant leaf diseases [18,19]. Furthermore, researchers have proposed feature selection techniques to select the best features. The computational time can be minimized using the best feature selection techniques.
Herein, we present a framework for the classification of fruit plant diseases. We evaluated our technique on 16 classes of the Plant Village database, which comprises different fruit plants such as apple, blueberry, cherry, orange, peach, grapes, and strawberry. In the proposed framework, we extracted the LBP, color, and deep ResNet50 features and then combined them to obtain a single vector using the maximum mean value serial approach. Subsequently, the combined vector was optimized using a modified genetic algorithm (GA) and fed to the ensemble subspace discriminant (ESD) classifier for disease recognition.
The remainder of this paper is organized as follows: The existing studies (related studies) are discussed in Section 2. In Section 3, the proposed framework is described based on different visualizations and mathematical modeling, and the results are presented in Section 4. Finally, the conclusions are presented in Section 5.
Researchers have introduced several automated systems to detect and recognize diseases in fruit plants and leaves [20,21]. These systems utilize handcrafted and deep CNN features. Sharif et al. [5] developed a system for recognizing diseases in citrus fruits based on two phases. In the first phase, the lesion area was detected in the citrus fruits and leaves. To detect the lesion, they utilized an optimized weight-based segmentation method. In the next step, they combined the color, texture, and geometric features. Feature selection was performed using skewness, entropy, and PCA-based methods. Subsequently, the selected feature vector was fed to a support vector machine (SVM), which achieved a 97% recognition accuracy for citrus diseases and 90.4% on a private dataset. In [22], a grape leaf disease detection method based on a back-propagation neural network was introduced. First, images denoised using a wavelet transform-based Wiener filtering technique, and the infected region was segmented using the Otsu segmentation method. Subsequently, the features were calculated from the perimeter, circularity, area, shape complexity, and rectangularity.
Liu et al. [23] presented a CNN-based methodology for the recognition of apple leaf diseases. They trained the AlexNet model on 13689 images of apple leaves and achieved a 97.62% accuracy. Khan et al. [6] presented a method for classifying different fruit diseases. They utilized the features from pretrained Caffe AlexNet and VGG-16 networks. In another study [24], researchers developed a system for the segmentation and recognition of grape leaf disease. In this system, a haze reduction and enhancement technique was first introduced. Subsequently, LAB color transformation was performed to select the best channel. During feature extraction, the features were calculated based on the geometric, color, and texture features. The extracted features were combined using canonical correlation analysis, and the best feature set was selected by implementing neighborhood component analysis. This method yielded accuracies of 90% and 92% for segmentation and classification, respectively.
Khan et al. [25] proposed a technique for identifying apple leaf diseases. Initially, the images were enhanced using a hybrid method. This hybrid method combines de-correlation as well as three-dimensional (3D) Gaussian, 3D median, and 3D box filtering. They extracted and combined the LBP, color, and color histogram-based features and optimized them using a GA. Chao et al. [26] introduced a method for identifying apple leaf diseases based on deep CNN models. They combined DenseNet and Xception models using global average pooling layers. They extracted the features from the CNN models and fed them to an SVM for classification. Additionally, researchers [27] have implemented a transfer learning technique for the detection of apple diseases, where they utilized a global average pooling layer for feature collection from the VGG-16 network. Adeel et al. [4] introduced a deep CNN-based methodology for the detection of grape leaf diseases. They implemented the transfer learning technique on pretrained networks such as AlexNet and ResNet101 and selected the best features using the Yager entropy and kurtosis. In [28], a leaf generative adversarial network (GAN) was introduced for grape disease recognition, where grape leaf images in four different diseases were generated.
All of the abovementioned techniques focused on the classification of fruit diseases using deep learning. Challenges in deep learning during training have been discussed, and they were solved using data augmentation techniques in a few studies. Furthermore, few researchers have highlighted the issue of irrelevant features, which can be resolved using feature selection techniques. Nonetheless, issues in the classification phase persist.
In this section, we present the proposed framework for the classification of fruit plant diseases from leaf images with visual and technical details. The primary procedures of the proposed framework are dataset collection, data augmentation to increase the number of images per class, as well as extraction of features that include LBPs [29], robust color features, and deep ResNet50 [30] features. Subsequently, these extracted features are combined using a maximum mean value serial approach and optimized using a modified GA. Finally, the optimized feature vector is fed to multiple classifiers for image recognition. Fig. 1 illustrates the main flow diagram of this process. The details of each procedure are provided below.

Figure 1: Flow of the proposed fruit diseases classification framework
In this study, the PlantVillage database [31] was utilized to prepare a dataset for the evaluation of the proposed technique. The PlantVillage dataset comprises 54303 leaf images and 38 classes. In this study, we utilized 16 classes of healthy and diseased fruit plants. The images were captured from apple, blueberry, cherry, grape, orange, peach, and strawberry leaves. All images of this dataset were resized to 256 × 256 pixels. Sample images of this dataset are shown in Fig. 2.

Figure 2: Sample images of the Plantvillage dataset
In this study, we performed data augmentation to increase the amount of data of classes comprising few images to balance the dataset. For the augmentation, image flips were performed to convert the original image into a new angle. Initially, the apple scab class contained 630 images; however, the number of images increased to 1260 after augmentation. The original apple cedar rust class contained 276 images, which to 550 images after augmentation. Meanwhile, the grape healthy and peach healthy classes contained 423 and 360 images, respectively, which increased to 846 and 720 images after augmentation, respectively. The number of healthy strawberry classes increased from 456 to 912 images. Mathematically, the horizontal and vertical flip operations are defined as follows:
where
Feature extraction is an important aspect in computer vision and image processing. Features are extracted to represent the image information. The extraction of robust features enables image to be classified correctly. In this study, we focused on both classical and deep learning features, i.e., LBP, color, and deep features extracted through the ResNet50 CNN pretrained model. A mathematical description of each method is provided below.
3.3.1 Local Binary Patterns (LBP) Features
LBP features are used extensively to perform texture analysis on image datasets. They estimate the texture information of an image based on its neighboring pixels. Suppose
where h denotes the neighboring pixel, and r is the neighborhood radius. The extracted feature set size of the LBP features was
Color features [32] are vital to the recognition of diseases using RGB images. We utilized three color spaces, namely RGB, HSV, and LAB, to extract the color features from the database. First, we separated each channel of the color space and then converted it into a histogram. Subsequently, for each channel, we calculated five parameters including the mean, standard deviation, variance, kurtosis, and skewness. This calculation was performed for all nine channels of the three color spaces. The computed parameters were combined serially to obtain a vector
where
where
In this study, we utilized the ResNet50 [30] model for deep feature extraction. This model, which was established using the residual learning technique, comprised 50 layers and 16 bottleneck residual blocks. Three convolutional operations of size

Figure 3: An architecture of ResNet50 deep learning model
After extracting the features, we combined all features in a single vector using a new approach known as the “maximum mean value serial approach.” Three feature vectors, including LBP, color, and ResNet50 features, were combined into a single vector to obtain a new feature set of size
Consider, we have three feature vectors
where
A GA is a feature optimization technique inspired by biological evolution theory [33]. The GA belongs to the evolutionary class of algorithms. In this study, using the GA, the best features were selected from the combined feature vector
Initialization: The GA performs an initialization using a set of individuals, known as a population. The population was set to 20, which is the possible number of solutions. The number of generations was set to 500, signifying that this algorithm performed 500 iterations to evaluate the fitness function. The mutation rate and crossover rate were set to 0.01 and 0.8, respectively.
Selection: The most important step in the GA is the selection of the best features. In this study, we applied the roulette-wheel method for parent selection. The probability-based roulette wheel selection is mathematically defined as:
where,
Crossover: This step generates a better individual by swapping the genes of two parents. In this study, we utilized a single-point crossover rate of 0.8. A single-point crossover randomly selects a point from both parents. A high crossover rate may cause a premature convergence of the GA. In mathematical form, it can be defined as:
Mutation: Mutation maintains genetic diversity and avoids the premature convergence of the GA. In this process, one or more genes are flipped based on the defined mutation rate. In our method, a uniform mutation rate of 0.01 was utilized.
Fitness Function: The fitness function is a key parameter for selecting the best features. The fitness function verifies the quality of the solution; hence, a good fitness function yields more optimized results. In this method, the “fitcknn” function is used as the fitness function. This function returns the K-nearest neighbor (KNN) classification model based on the input features. The Euclidean distance is used in this fitness function for the KNN classification model. The Euclidean distance is formulated in mathematical form as follows:
To calculate the error rate, we utilized the “kfoldLoss” function. This function returns the loss of a cross-validated classification model. The classification error for the loss function of the KNN model is expressed as:
After the completion of all iterations, a new optimized feature vector is obtained; subsequently, it is passes into a harmonic-mean-based threshold function. Mathematically, the function is expressed as follows:
The final selected features represented by

4 Experimental Setup and Results
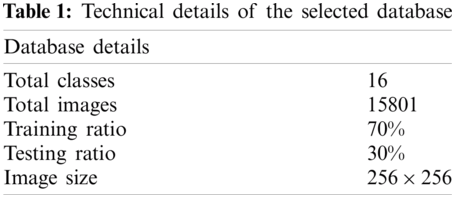
The proposed framework was evaluated on 16 classes of the publicly available PlantVillage dataset. A brief description is provided in Tab. 1. In the preprocessing step, we performed data augmentation to increase the number of images per class. Different features, including handcrafted and deep features, were extracted and combined; subsequently, the fused vector was optimized using the GA. The handcrafted features included LBP and color features, and for deep feature extraction, we utilized the ResNet50 model. In the training phase of the model, a 70:30 approach was used. Extensive experiments were performed on different cross-validations, including 5-, 10-, 15-, and 20-fold cross-validations. Multiple classifiers were selected for a fair comparison, including the linear SVM, quadratic SVM, cubic SVM, medium Gaussian SVM, coarse Gaussian SVM, medium KNN, cosine KNN, weighted KNN, ensemble bagged trees (EBT), and ESD. Each classifier was evaluated using different performance measures such as accuracy, false-negative rate (FNR), precision, sensitivity, F1 score, and time.
4.1 Results for 5-Fold Cross-Validation
In the first experiment, the optimized feature set was fed to the classifiers using five-fold cross-validation for evaluation. The best accuracy was 99%, achieved using the ESD classifier, as shown in Tab. 2. Other measures such as precision, sensitivity, F1 score, and FNR calculated using the ESD were 95.5%, 95.5%, 95.5%, and 1%, respectively. The accuracy was verified, as shown in Fig. 4. The computational time for the ESD was 746.3 s. The best computational time was 68.2 s, which was achieved on the EBT classifier. However, the accuracy achieved using the EBT was 95%. The worst performance observed in the five-fold cross-validation was an accuracy of 89.7%, which was calculated using the C-KNN classifier.
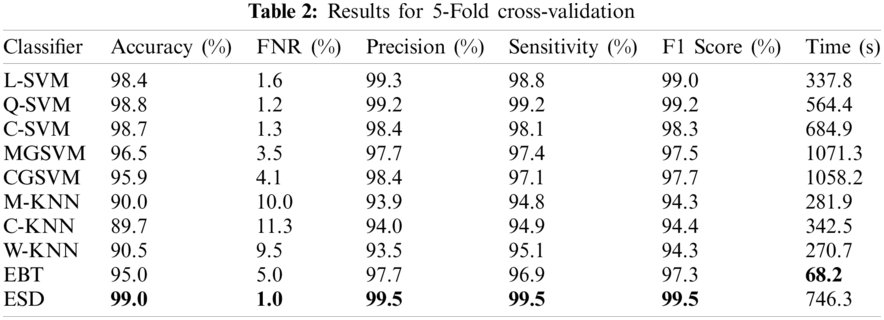

Figure 4: Confusion matrix for ESD classifier using 5-fold cross-validation
4.2 Results for 10-Fold Cross-Validation
Next, we used 10-fold cross-validation to evaluate the proposed framework. The maximum accuracy achieved on the Q-SVM and ESD was 99%, as shown in Tab. 3. The FNR for both classifiers was 1%, and the highest precision was 99.7%, which was achieved using the Q-SVM. The accuracy was verified, as shown in Fig. 5. The computational times for the Q-SVM and ESD were 729.6 and 993.3 s, respectively. The sensitivity and F1 score were 99.4% and 99.5%, respectively, achieved using the ESD classifier. The best computational time was 82.9 s, which was achieved using the EBT classifier with a 95.1% accuracy. The C-KNN recorded the worst accuracy of 90.1%.


Figure 5: Confusion matrix for ESD classifier using 10-fold cross-validation
4.3 Results for 15-Fold Cross-Validation
For the 15-fold cross-validation, the best results were obtained using the ESD classifier. The best accuracy, FNR, precision, sensitivity, and F1 score obtained using the ESD were 99%, 1%, 99.7%, 99.5%, and 99.6%, respectively, as shown in Tab. 4. This accuracy was further verified, as shown in Fig. 6. However, the computational time of the ESD was 1709.5 s. The Q-SVM and C-SVM yielded good accuracies of 98.9% and 98.8%, respectively. However, the Q-SVM and C-SVM incurred 1339.9 and 1678.9 s for recognition, respectively. The C-KNN recorded the worst accuracy of 90.1%. The best computational time afforded by the EBT was 218.2 s.


Figure 6: Confusion matrix for ESD classifier using 15-fold cross-validation
4.4 Results for 20-Fold Cross-Validation
The final experiment was performed using a 20-fold cross-validation. The maximum accuracy achieved in this experiment was 99% for the ESD classifier, whereas the FNR, precision, sensitivity, F1 score, and computational time were 1%, 99.5%, 99.4%, 99.4%, and 2130.9 s, respectively, as shown in Tab. 5. In addition, this accuracy was verified, as shown in Fig. 7. The accuracies of the Q-SVM and C-SVM were 98.9% and 98.9%, respectively, indicating good performances. However, those classifiers required 1870.8 and 2151.9 s, respectively. The best computational time was achieved by the EBT, with a 95.3% accuracy. Meanwhile, the C-KNN classifier recorded the worst accuracy of 90.3%.
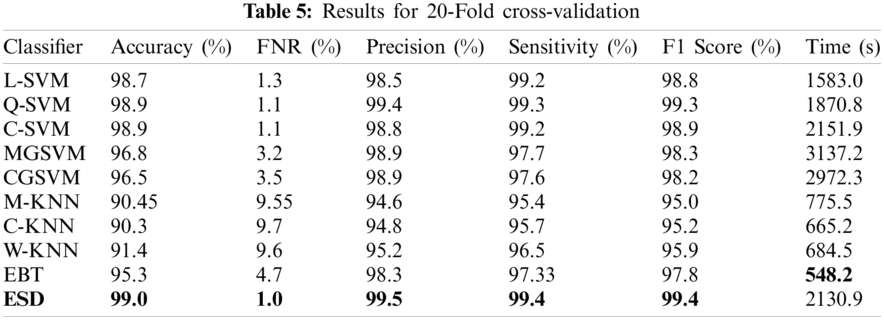

Figure 7: Confusion matrix for ESD classifier using 20-fold cross-validation
Additionally, we compared the proposed framework with previous fruit plant disease detection techniques. Specifically, we compared our technique with methods evaluated on only four to eight classes, as presented in Tab. 6. Khan et al. [6] performed experiments on six classes of diseases and achieved a 98.6% accuracy. The authors of [7] evaluated their model on eight classes and obtained an accuracy of 82%. Meanwhile, the authors of [20,21] used four and five classes, respectively, to verify their methodology and achieved accuracies of 97% and 97.8%, respectively. In this study, we evaluated our framework on 16 classes comprising different diseases and healthy images and achieved an accuracy of 99%.

A new framework for the classification of fruit plant diseases from leaf images was presented herein. The primary steps of the proposed framework were dataset collection, data increase, LBP extraction, color based on mean value, ResNet50 features, feature fusion, feature optimization using improved GA, and classification. We evaluated our technique by conducting extensive experiments, which yielded promising results. The maximum accuracy achieved was 99% using the ESD and Q-SVM classifiers, whereas the precision, sensitivity, and F1 score were calculated to be 99.7%, 99.5%, and 99.6%, respectively. We analyzed all the results and concluded that our proposed framework is superior to the other compared methods. Furthermore, we concluded that the selection of features through the threshold function further minimized the computational time while maintaining the classification accuracy. In future studies, we will consider more fruit classes and implement new optimization techniques to improve the computational time.
Funding Statement: This research was supported by X-mind Corps program of National Research Foundation of Korea (NRF) funded by the Ministry of Science, ICT (No. 2019H1D8A1105622) and the Soonchunhyang University Research Fund.
Conflicts of Interest: The authors declare that they have no conflicts of interest to report regarding the present study.
1. Y. D. Zhang, Z. Dong, X. Chen, W. Jia, S. Du et al., “Image based fruit category classification by 13-layer deep convolutional neural network and data augmentation,” Multimedia Tools and Applications, vol. 78, no. 6, pp. 3613–3632, 2019. [Google Scholar]
2. H. T. Rauf, B. A. Saleem, M. I. U. Lali, M. A. Khan, M. Sharif et al., “A citrus fruits and leaves dataset for detection and classification of citrus diseases through machine learning,” Data in Brief, vol. 26, no. 5, pp. 104340, 2019. [Google Scholar]
3. G. Manogaran, M. Alazab, K. Muhammad and V. H. C. De Albuquerque, “Smart sensing based functional control for reducing uncertainties in agricultural farm data analysis,” IEEE Sensors Journal, vol. 5, pp. 1–9, 2021. [Google Scholar]
4. A. Adeel, M. A. Khan, T. Akram, A. Sharif, M. Yasmin et al., “Entropy controlled deep features selection framework for grape leaf diseases recognition,” Expert Systems, vol. 2, no. 7, pp. 1–23, 2020. [Google Scholar]
5. M. Sharif, M. A. Khan, Z. Iqbal, M. F. Azam, M. I. U. Lali et al., “Detection and classification of citrus diseases in agriculture based on optimized weighted segmentation and feature selection,” Computers and Electronics in Agriculture, vol. 150, pp. 220–234, 2018. [Google Scholar]
6. M. A. Khan, T. Akram, M. Sharif, M. Awais, K. Javed et al., “CCDF: Automatic system for segmentation and recognition of fruit crops diseases based on correlation coefficient and deep CNN features,” Computers and Electronics in Agriculture, vol. 155, pp. 220–236, 2018. [Google Scholar]
7. J. G. A. Barbedo, “Plant disease identification from individual lesions and spots using deep learning,” Biosystems Engineering, vol. 180, pp. 96–107, 2019. [Google Scholar]
8. V. Singh and A. K. Misra, “Detection of plant leaf diseases using image segmentation and soft computing techniques,” Information Processing in Agriculture, vol. 4, pp. 41–49, 2017. [Google Scholar]
9. Z. Iqbal, M. A. Khan, M. Sharif, J. H. Shah, M. H. ur Rehman et al., “An automated detection and classification of citrus plant diseases using image processing techniques: A review,” Computers and Electronics in Aagriculture, vol. 153, pp. 12–32, 2018. [Google Scholar]
10. M. S. Kim, A. M. Lefcourt, Y. R. Chen and Y. Tao, “Automated detection of fecal contamination of apples based on multispectral fluorescence image fusion,” Journal of Food Engineering, vol. 71, pp. 85–91, 2005. [Google Scholar]
11. J. Li, X. Rao and Y. Ying, “Detection of common defects on oranges using hyperspectral reflectance imaging,” Computers and Electronics in Agriculture, vol. 78, pp. 38–48, 2011. [Google Scholar]
12. S. Zhang, H. Wang, W. Huang and Z. You, “Plant diseased leaf segmentation and recognition by fusion of superpixel, K-means and PHOG,” Optik, vol. 157, pp. 866–872, 2018. [Google Scholar]
13. B. J. Samajpati and S. D. Degadwala, “Hybrid approach for apple fruit diseases detection and classification using random forest classifier,” in 2016 Int. Conf. on Communication and Signal Processing (ICCSPMelmaruvathur, India, pp. 1015–1019, 2016. [Google Scholar]
14. Z. Guo, L. Zhang and D. Zhang, “A completed modeling of local binary pattern operator for texture classification,” IEEE Transactions on Image Processing, vol. 19, pp. 1657–1663, 2010. [Google Scholar]
15. R. Pydipati, T. Burks and W. Lee, “Identification of citrus disease using color texture features and discriminant analysis,” Computers and Electronics in Agriculture, vol. 52, pp. 49–59, 2006. [Google Scholar]
16. M. B. Tahir, M. A. Khan, K. Javed, S. Kadry, Y. D. Zhang et al., “Recognition of apple leaf diseases using deep learning and variances-controlled features reduction,” Microprocessors and Microsystems, vol. 7, pp. 104027, 2021. [Google Scholar]
17. I. M. Nasir, A. Bibi, J. H. Shah, M. A. Khan, M. Sharif et al., “Deep learning-based classification of fruit diseases: An application for precision agriculture,” Computers, Materials & Continua, vol. 66, pp. 1949–1962, 2021. [Google Scholar]
18. N. Muhammad, S. Rubab N. Bibi, O. Y. Song, M. A. Khan et al., “Severity recognition of aloe vera diseases using AI in tensor flow domain,” Computers, Materials & Continua, vol. 66, pp. 2199–2216, 2021. [Google Scholar]
19. J. Hang, D. Zhang, P. Chen, J. Zhang and B. Wang, “Classification of plant leaf diseases based on improved convolutional neural network,” Sensors, vol. 19, pp. 4161, 2019. [Google Scholar]
20. R. Thapa, K. Zhang, N. Snavely, S. Belongie and A. Khan, “The plant pathology challenge 2020 data set to classify foliar disease of apples,” Applications in Plant Sciences, vol. 8, pp. e11390, 2020. [Google Scholar]
21. T. Akram, M. Sharif and T. Saba, “Fruits diseases classification: Exploiting a hierarchical framework for deep features fusion and selection,” Multimedia Tools and Applications, vol. 79, pp. 25763–25783, 2020. [Google Scholar]
22. J. Zhu, A. Wu, X. Wang and H. Zhang, “Identification of grape diseases using image analysis and BP neural networks,” Multimedia Tools and Applications, vol. 79, pp. 14539–14551, 2020. [Google Scholar]
23. B. Liu, Y. Zhang, D. He and Y. Li, “Identification of apple leaf diseases based on deep convolutional neural networks,” Symmetry, vol. 10, pp. 11, 2018. [Google Scholar]
24. A. Adeel, M. A. Khan, M. Sharif, F. Azam, J. H. Shah et al., “Diagnosis and recognition of grape leaf diseases: An automated system based on a novel saliency approach and canonical correlation analysis based multiple features fusion,” Sustainable Computing: Informatics and Systems, vol. 24, pp. 100349, 2019. [Google Scholar]
25. M. A. Khan, M. I. U. Lali, M. Sharif, K. Javed, K. Aurangzeb et al., “An optimized method for segmentation and classification of apple diseases based on strong correlation and genetic algorithm based feature selection,” IEEE Access, vol. 7, pp. 46261–46277, 2019. [Google Scholar]
26. X. Chao, G. Sun, H. Zhao, M. Li and D. He, “Identification of apple tree leaf diseases based on deep learning models,” Symmetry, vol. 12, pp. 1065, 2020. [Google Scholar]
27. Q. Yan, B. Yang, W. Wang, B. Wang, P. Chen et al., “Apple leaf diseases recognition based on an improved convolutional neural network,” Sensors, vol. 20, pp. 3535, 2020. [Google Scholar]
28. B. Liu, C. Tan, S. Li, J. He and H. Wang, “A data augmentation method based on generative adversarial networks for grape leaf disease identification,” IEEE Access, vol. 8, pp. 102188–102198, 2020. [Google Scholar]
29. T. Ojala, M. Pietikainen and T. Maenpaa, “Multiresolution gray-scale and rotation invariant texture classification with local binary patterns,” IEEE Transactions on Pattern Analysis and Machine Intelligence, vol. 24, no. 20, pp. 971–987, 2002. [Google Scholar]
30. K. He, X. Zhang, S. Ren and J. Sun, “Deep residual learning for image recognition,” in Proc. of the IEEE Conf. on Computer Vision and Pattern Recognition, Las Vegas, Nevada, pp. 770–778, 2016. [Google Scholar]
31. S. P. Mohanty, D. P. Hughes and M. Salathé, “Using deep learning for image-based plant disease detection,” Frontiers in Plant Science, vol. 7, no. 11, pp. 1419, 2016. [Google Scholar]
32. A. Majid, M. A. Khan, M. Yasmin, A. Rehman, A. Yousafzai et al., “Classification of stomach infections: A paradigm of convolutional neural network along with classical features fusion and selection,” Microscopy Research and Technique, vol. 83, no. 7, pp. 562–576, 2020. [Google Scholar]
33. S. Sayed, M. Nassef, A. Badr and I. Farag, “A nested genetic algorithm for feature selection in high-dimensional cancer microarray datasets,” Expert Systems with Applications, vol. 121, no. 2, pp. 233–243, 2019. [Google Scholar]
 | This work is licensed under a Creative Commons Attribution 4.0 International License, which permits unrestricted use, distribution, and reproduction in any medium, provided the original work is properly cited. |