DOI:10.32604/cmc.2022.021943
| Computers, Materials & Continua DOI:10.32604/cmc.2022.021943 | |
| Article |
Comparative Study of Transfer Learning Models for Retinal Disease Diagnosis from Fundus Images
1Department of ICT Convergence, Soonchunhyang University, Asan, 31538, Korea
2Department of Ophthalmology, Soonchunhyang University Bucheon Hospital, Soonchunhyang University College of Medicine, Bucheon, 420-767, Korea
3Department of Computer Science and Engineering, Soonchunhyang University, Asan, 31538, Korea
*Corresponding Author: Yunyoung Nam. Email: ynam@sch.ac.kr
Received: 21 July 2021; Accepted: 25 August 2021
Abstract: While the usage of digital ocular fundus image has been widespread in ophthalmology practice, the interpretation of the image has been still on the hands of the ophthalmologists which are quite costly. We explored a robust deep learning system that detects three major ocular diseases: diabetic retinopathy (DR), glaucoma (GLC), and age-related macular degeneration (AMD). The proposed method is composed of two steps. First, an initial quality evaluation in the classification system is proposed to filter out poor-quality images to enhance its performance, a technique that has not been explored previously. Second, the transfer learning technique is used with various convolutional neural networks (CNN) models that automatically learn a thousand features in the digital retinal image, and are based on those features for diagnosing eye diseases. Comparison performance of many models is conducted to find the optimal model which fits with fundus classification. Among the different CNN models, DenseNet-201 outperforms others with an area under the receiver operating characteristic curve of 0.99. Furthermore, the corresponding specificities for healthy, DR, GLC, and AMD patients are found to be 89.52%, 96.69%, 89.58%, and 100%, respectively. These results demonstrate that the proposed method can reduce the time-consumption by automatically diagnosing multiple eye diseases using computer-aided assistance tools.
Keywords: Multiclass classification; deep neural networks; glaucoma; age-related macular degeneration; diabetic retinopathy; transfer learning; quality evaluation
Diabetic retinopathy (DR), glaucoma (GLC), and age-related macular degeneration (AMD) are leading causes of vision loss worldwide, and their effects will continue to increase in the absence of rapid detection [1–3]. DR, GLC, and AMD are common causes of blindness with different damage areas such as retinal, vascular, optic nerve, and macular. An estimated 64.3, 425, and 11.26 million people had GLC, DR, and AMD, respectively in 2013–2020 [4–6]; these numbers are predicted to increase to 112 (GLC), 642 (DR), and 18.57 (AMD) million by 2040. Ocular fundus imaging plays a crucial role in the diagnosis and tracking of ophthalmologic diseases. The number of patients is rapidly increasing, causing a burden on clinics by requiring numerous ophthalmologists, specialized equipment, and health care services. This burden can be alleviated by using an automated system. In recent days, deep learning techniques have been applied for automatic detection of eye diseases [7–9]. The detection results indicated high sensitivity and specificity in diagnosis.
Although deep learning techniques have advanced to state-of-the-art levels in fundus image classification, a large amount of training data and computational time remain a constraint in the classification process.
Transfer learning is the process of learning a new task through the transfer of knowledge from a previous task that has already been learned. It helps achieve better performance with less training time and an acceptable performance when working with limited data. In order to alleviate the aforementioned constraints, transfer learning algorithm plays an important role in the application of the features learned on one task to another (fundus images). Transfer learning can be employed to use the features acquired from previously trained neural networks on general images as knowledge in fundus image classification. Recently, one or two eye disease categories have been introduced by applying transfer learning as feature extraction and classifiers [10–12].
The deep neural network (DNN) contains large layers and filters to calculate and distinguish various features of fundus images for identifying each eye disease. However, blurry, uneven illumination and excessively dark or bright pixels damage the fundus image and become hurdles for the automatic diagnosis systems, resulting in misdiagnosis or the inability to detect the disease. Therefore, the image quality becomes a critical property of fundus images and an indispensable initialization process in fundus image classification. In previous studies, integrated quality evaluations had not been conducted to eliminate poor quality images prior to the eye disease diagnosis process. Only quality appraisals or fundus classifications have been performed separately. Therefore, this is a new study on integrated quality assessment in multiclass fundus image classification.
The aim of this study is to explore the usefulness of transfer learning techniques in identifying major ophthalmologic diseases, namely, DR, GLC, and AMD in normal eyes. In this study, image-preprocessing techniques are applied to prepare images before feeding to a neural network. Transfer learning techniques transfer the learned features trained on one task (thousands of general images) to classify the second task (fundus images). Finally, the results with and without the quality evaluation are compared.
Various DNNs have been used in automatic fundus-photograph classification systems to detect eye diseases. A combination of different layers and operations establishes a convolutional neural network (CNN) architecture. Shankar et al. [13] developed a DNN named synergic deep learning to classify various severity levels of DR fundus images. Gómez-Valverde et al. [12] proposed a CNN that contains 13 layers for training and grading five levels of fundus images (no DR, mild DR, moderate DR, severe DR, and proliferative DR). Wan et al. [14] employed deep learning with transfer learning by using four different CNN models for training and extracting feature images to classify DR. The results of DR image classification showed the highest accuracy of 95.68% among the four models in their study. van Grinsven et al. [15] applied data augmentation to prevent overfitting when training fundus images using their proposed CNN model. The result of detecting hemorrhage in DR achieved an area under the receiver operating characteristic curve (AUC) of 0.972.
GLC is the second major cause of vision loss [16]. Ophthalmologists have used fundus photographs to examine changes in the optic disc, while GLC was present. Automated systems have been proposed to detect GLC in fundus images to obtain an accurate diagnosis by using a deep learning approach. Raghavendra et al. [17] proposed a DNN architecture contain 18 layers to distinguish between normal/healthy eye (NR) and GLC. The proposed DNN model showed an accuracy of 98.13%. In [18], transfer learning techniques were applied to assess only one eye disease, AMD or NR; and result achieved an AUC of 0.995 for glaucoma and non-glaucoma, which demonstrated that the diagnosis system performed adequately.
3.1 Original Fundus Image Dataset
In this study, retinal images were obtained from [19], in which, a new retinal image dataset, called the Diabetic Retinopathy Image Database (DRIMDB), was created. All retinal images of the DRIMDB were graded by an expert into three classes: 125 as good, 69 as bad, and 22 as outliers. The images classified as good qualified for automatic retinal image analysis. Images of all three grades were captured by using a Canon CF-60UVi Fundus Camera at a 60-degree field of view and stored in JPEG format with a resolution of 570 × 760 pixels. The performance of our proposed quality evaluation was assessed on the DRIMDB dataset, excluding outliers.
Fundus images of eye diseases were obtained from the Soonchunhyang Bucheon Hospital (SCH-BH) dataset. Ophthalmologists classified all fundus images of the dataset into four classes: DR, AMD, GLC, and NR. From among a total of 1304 digital fundus images in the SCH-BH database, 312 were classified as DR, 254 as GLC, 119 as AMD, and 619 as NR. Furthermore, images were acquired by using a Kowa VX-10 digital fundus camera (Kowa Company. Ltd., Aichi, Japan) at a 60-degree field of view and a resolution of 8575 × 5695 pixels and 24 bits per pixel (standard RGB). The institutional review board approved this work (approval no. SCHBC 2019-02-008-002).
3.2 Datasets and Image Preprocessing
Fundus images of the DRIMDB were processed to resize the original image to a resolution of 299 × 299 pixels, which is a suitable size for inputting into the Inception-v3 model [20]. As datasets are small, data augmentation has become a popular technique for producing various images in experiments to make the model more generalized [21]. In this study, images were subjected to data augmentation techniques, such as horizontal flip, vertical flip, zoom-in, zoom-out, and contrast, for which the alpha parameter was 0.58–1.06. From among a total of 2910 augmentation images, 1875 were good, and 1035 were bad. Furthermore, 80% of the augmented images were used for training and 20% for validation to perform the quality evaluation.
Before images were input into the DNN model, each eye-disease fundus image was resized to 256 × 256 pixels to decrease the computation time. Moreover, another preprocessing technique, contrast limited adaptive histogram equalization (CLAHE), was applied to the resized images. In the CLAHE process, fundus images were converted to CIELAB color space to extract lightness using an open-source library feature [22]. CLAHE was performed within a clip limit of 2 and a slicing grid of eight kernel sizes.
The processed images from the SCH-BH fundus dataset were utilized for the experimentation and evaluation of the classification system. The size of the training and validation images was increased by random augmentation, such as horizontal flip, vertical flip, and brightness shift in the range of 0.5–1.25 [23]. The augmentation-brightness process was repeated twice for DR and five times for AMD for each image to balance the data in each class. Each augmented image had the same label (DR, GLC, AMD, or NR) as the original input image from the source.
3.3 The Proposed Deep Learning Model for Fundus Images Quality Evaluation
The proposed deep learning model was based on the addition of four layers to the Inception-v3 model. The Inception-v3 model comprises 48 layers, pre-trained on thousands of general images (1000 categories) from the ImageNet dataset. This structure was modified because the original structure was developed to classify 1000 categories. To employ Inception-v3 networks with quality evaluation (good and bad grade), four layers, namely, AveragePooling2D with a downscale of 8 × 8, Dropout (30%), Flatten, and Dense (2 nodes), were added, as shown in Fig. 1.
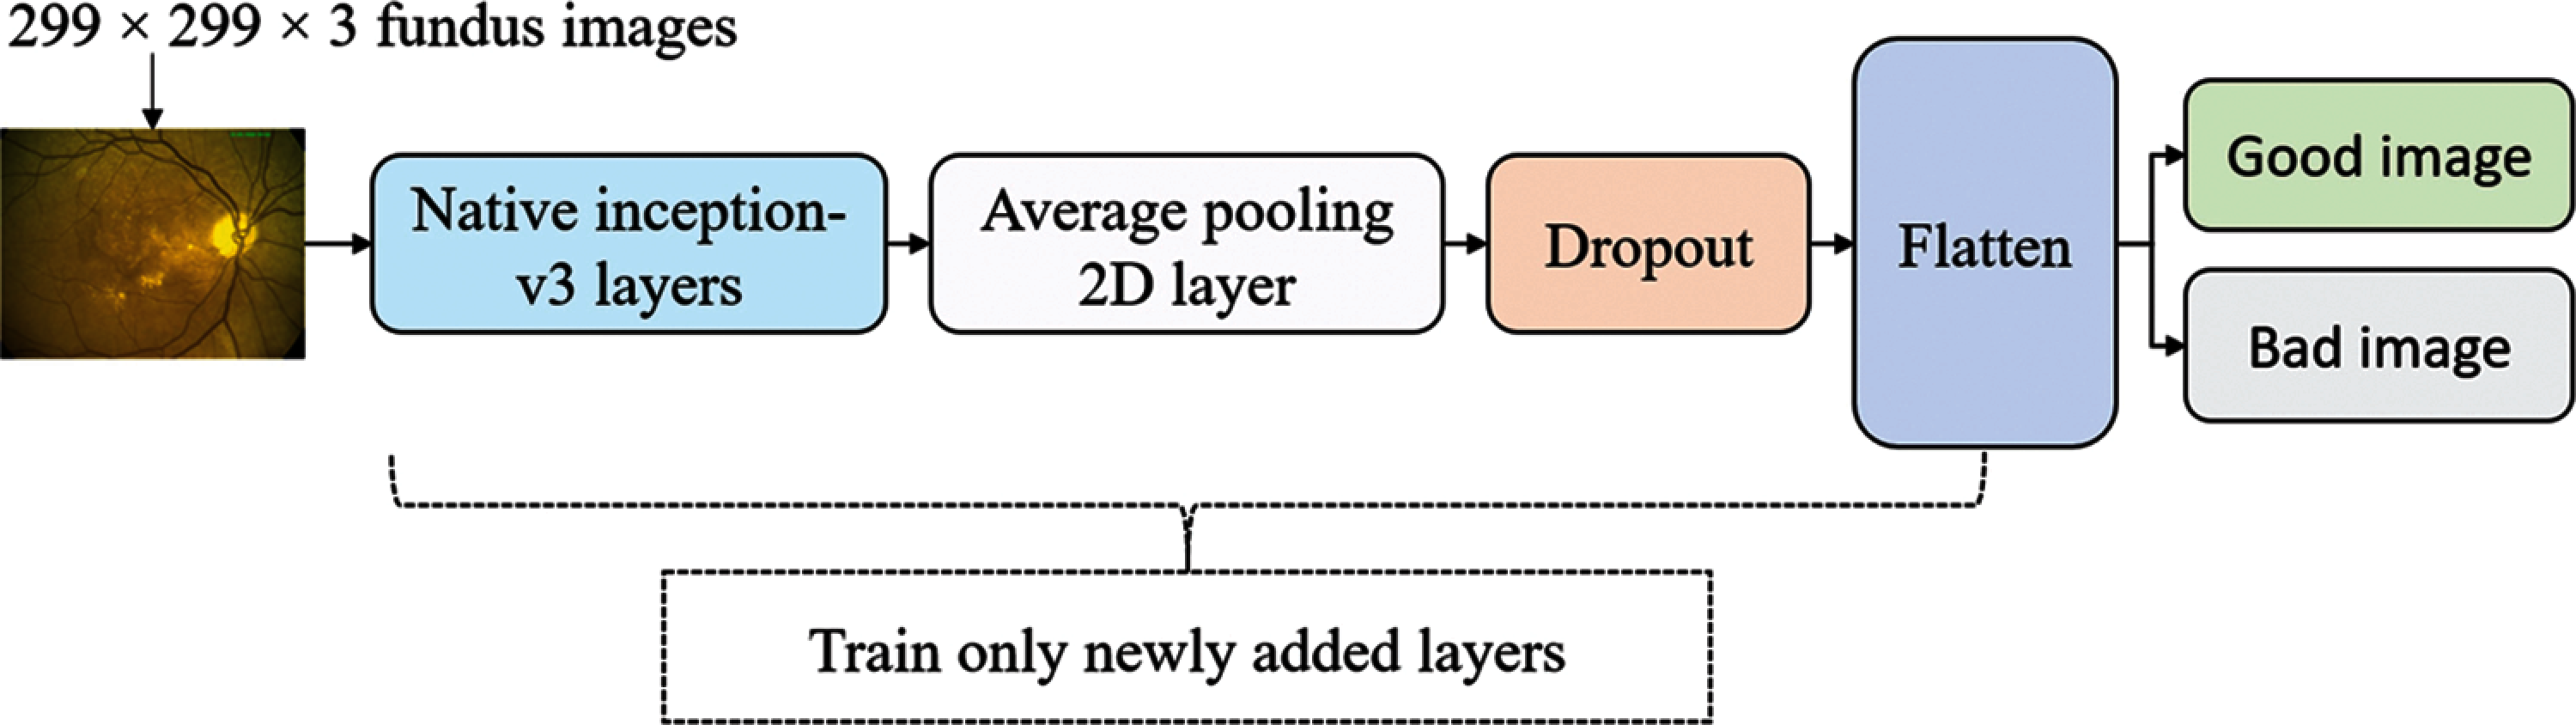
Figure 1: Inception-v3 model with attaching new layers
3.4 Deep Learning Model and Transfer Learning
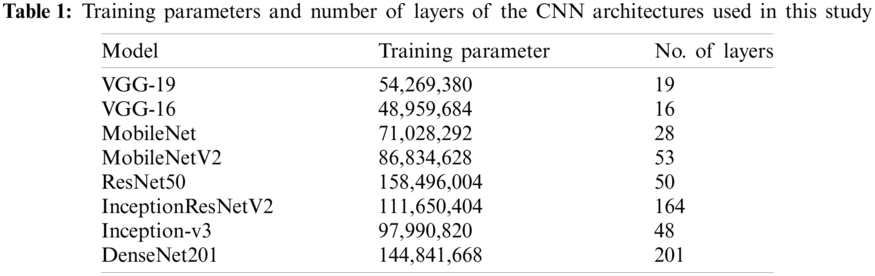
To improve fundus image classification, various CNN architectures were used for comparison: VGG-19, VGG-16, MobileNet, MobileNet-V2, ResNet-50, InceptionResNet-V2, Inception-v3, and DenseNet-201. These architectures are commonly used to classify general images or medical images, and their results are comparable to those of other architectures (AlexNet and GoogLeNet) selected for the experiment [24–26]. Five layers (Flatten:1 and Dense:4) were added to each CNN architecture as the classification layer to create a novel architecture for classifying fundus images. VGG-19, VGG-16, MobileNet, MobileNet-V2, ResNet-50, InceptionResNet-V2, Inception-v3, and DenseNet-201 were trained on a large general dataset (ImageNet database) for classifying 1000 categories of images, and the knowledge previously learned is the feature extraction for a new dataset, SCH-BH. Pre-training of deep learning trains only the newly added classification layers freezes all extraction layers, and uses previous work as knowledge for grading fundus images (see Fig. 2); this takes less time than training all neural network layers. VGG-19 and VGG-16 architecture, as implemented here, comprises 19 layers with 54,269,380 training parameters and 16 layers with 48,959,684 training parameters, respectively. MobileNet and MobileNetV2 consist of 28 layers with 71,028,292 training parameters and 53 layers with 86,834,628 training parameters, respectively. The number of layers and parameters of Inception-v3 is similar to that of MobileNetV2, which contains 48 layers with 97,990,820 parameters. ResNet50 integrates 158,496,004 training parameters, which are larger than those of the other models used in this study. DenseNet201 is a larger layer with more training parameters than the models used, with 201 layers and 144,841,668 total training parameters. Tab. 1 shows the total number of training parameters and the number of layers of each CNN architecture with the same input image size used in this study.
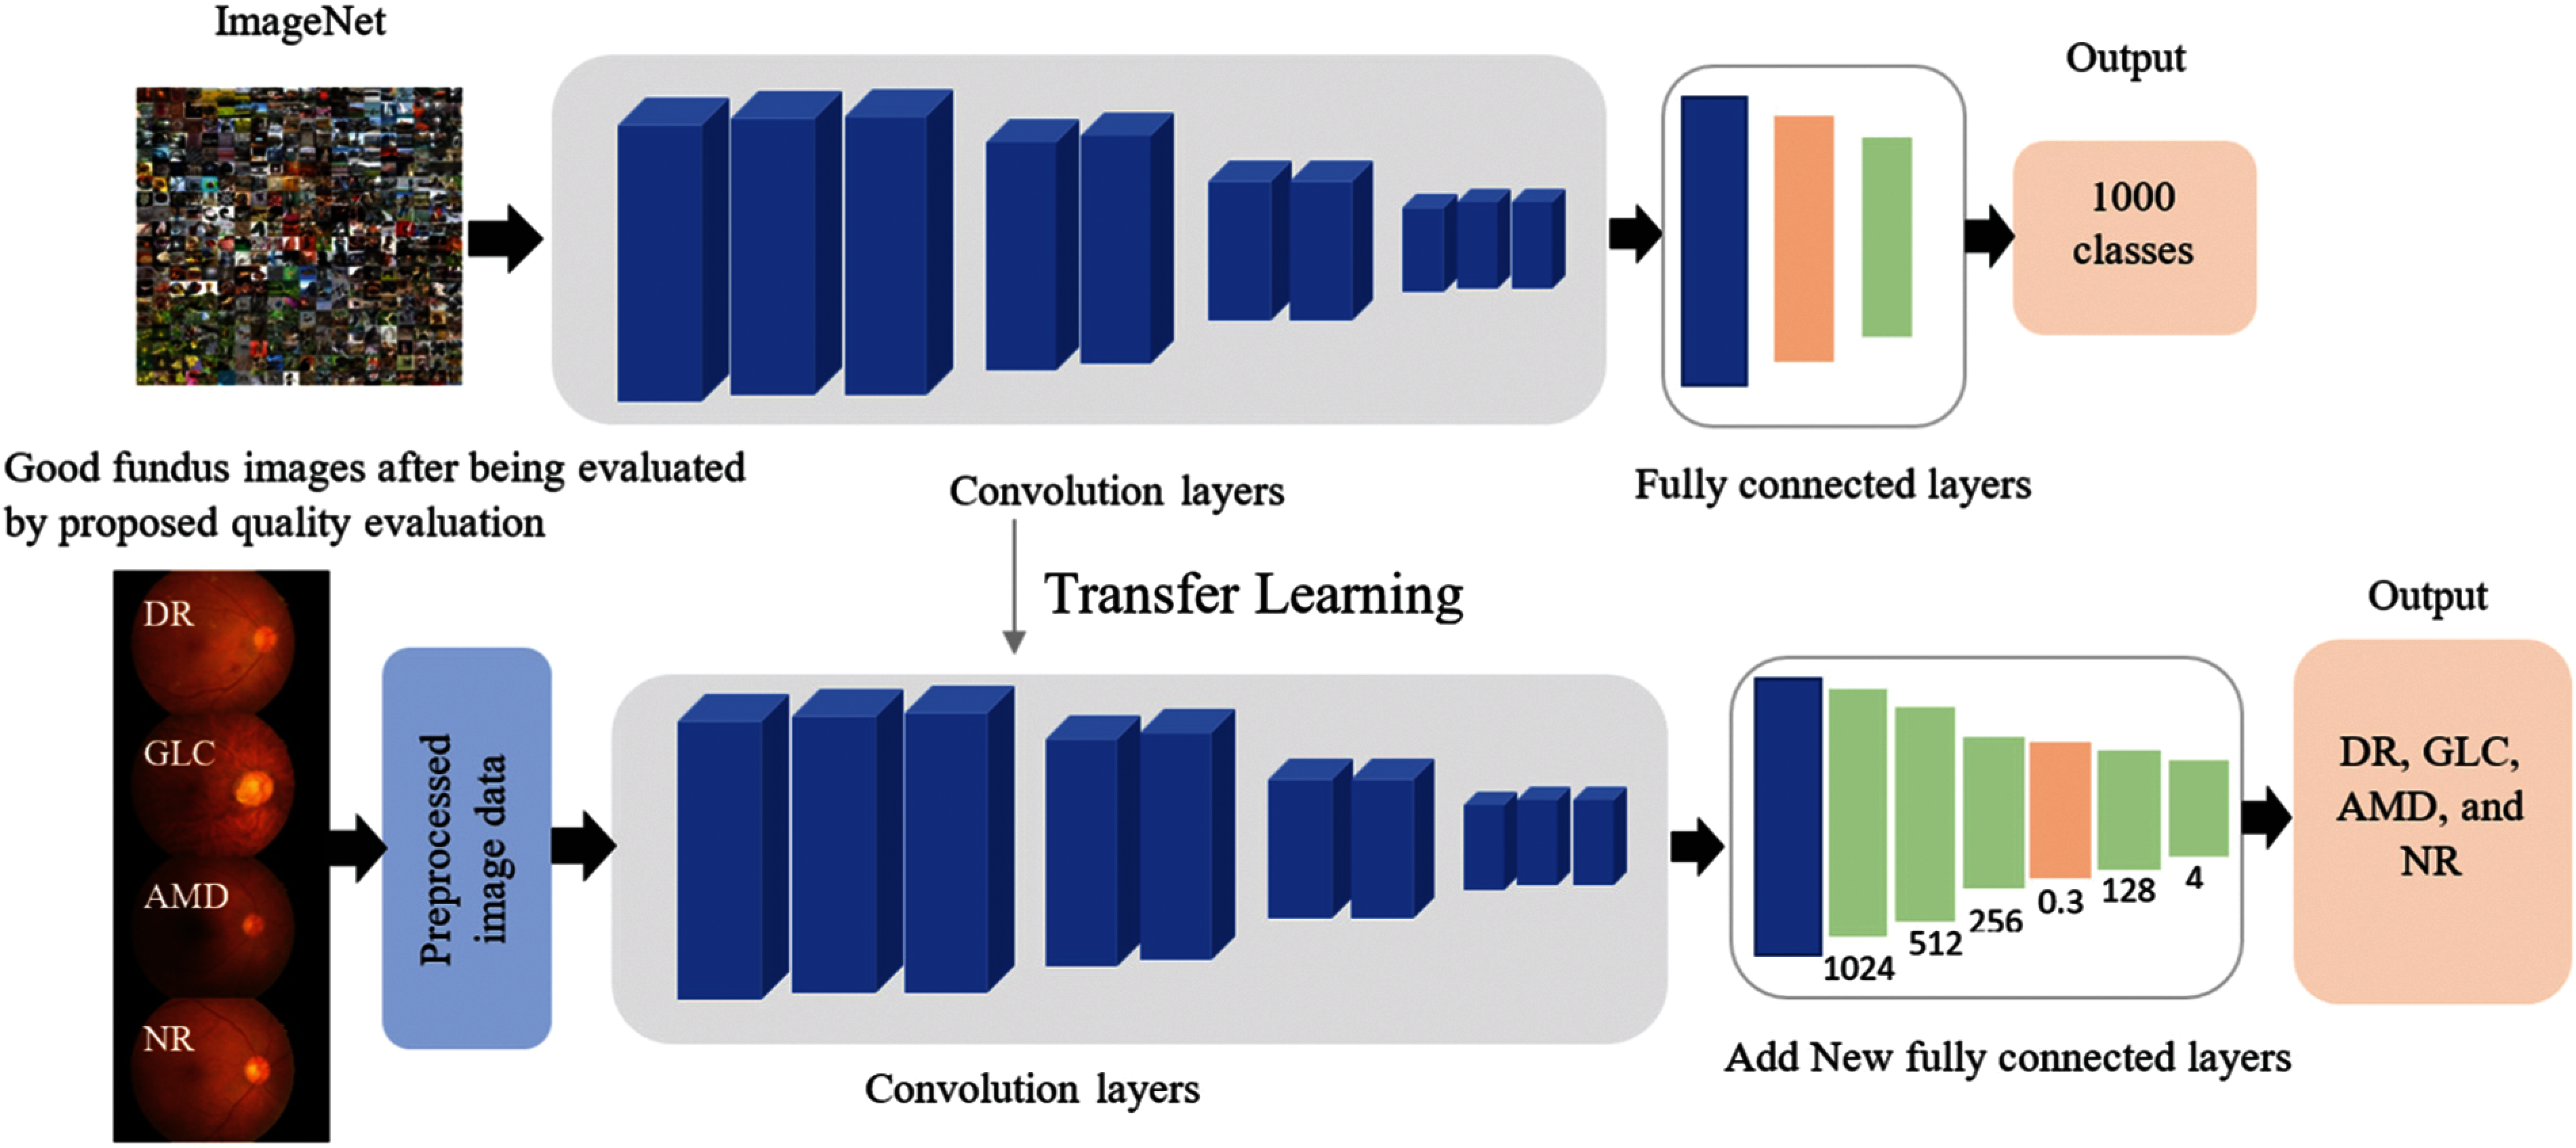
Figure 2: Transfer learning for fundus images classification
Five layers are added to each of the CNN architectures as follows:
o The native output parameters of the CNN architecture were converted to data in a one-dimensional array for input to the next layer by using flattening, which is connected to the ultimate classification layers.
o Three Dense layers with rectified linear (ReLu) activation functions were fused to perform a matrix-vector multiplication and produce an output with 1024, 512, and 256 dimensions, respectively.
o The output of the previous layer (256 dimensions) is randomized, and 30% of the layer's neurons are rejected to prevent overfitting.
o After the Dropout layer, the Dense layer with ReLu was applied to produce an output of 128 dimensions.
o Finally, the Dense layer is implemented with the softmax activation function to construct an output array of four dimensions, which indicate the probability of DR, GLC, AMD, and NR.
3.5 Model Training and Selection
In this experiment, two tasks were performed sequentially: first, fundus image quality evaluation was performed, and images were segregated into good and bad quality; second, the good quality images were used in fundus classification to diagnose three eye diseases.
3.5.1 Fundus Image Quality Evaluation Training
The implemented model is trained by fine-tuning the pre-trained Inception-v3 network. Transfer learning is applied, and the original weight of the pretraining is fine-tuned for two classes of quality classification. The training is conducted only on the four newly added layers. Furthermore, the augmentation images are split into 80% training, and 20% for validation, and the hyperparameters are set with a batch size of 32 images and 50 epochs. This evaluation is conducted to assess the grade of the fundus image (SCH-BH dataset) to distinguish between good and poor quality.
3.5.2 Fundus Images Evaluation Training
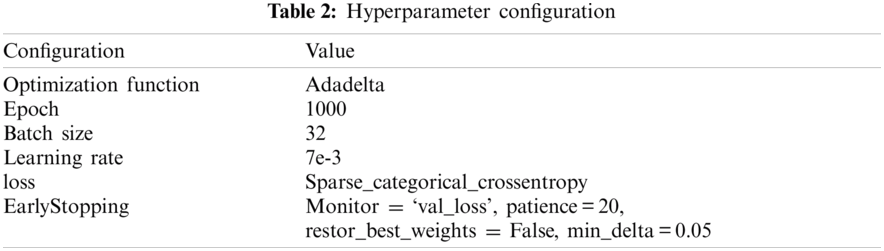
Each CNN model was trained and evaluated on two levels: the overall image of the SCH-BH and the good images after applying the quality assessment. The model was trained by fine-tuning the pre-trained CNN models. The CNN models are VGG-19, VGG-16, MobileNet, MobileNet-V2, ResNet-50, InceptionResNet-V2, Inception-v3, and DenseNet-201. There are many possible techniques for splitting the data during the testing and training phases. According to Breiman et al. [27], the K-fold cross-validation technique performed better than leave-one-out. Therefore, 5-fold cross-validation was applied where the given dataset was split into five sections/folds, and testing was set at some point of each fold. In the first iteration, the first fold was used to test the model, and the rest were used to train the model. In the second iteration, the second fold was used as the testing set, while the rest served as the training set. The operation was repeated until each fold of the five folds completed the testing set. Furthermore, the hyperparameter for training was 1000 epochs with a batch size of 32 images. Early stopping was monitored on validation loss during training to avoid overfitting of the training deep learning model; the training stopped if the validation loss did not improve by 0.05 for 20 epochs. A summary of the hyperparameter configuration of the training CNN network is presented in Tab. 2. This process was repeated for each architecture (VGG-19, VGG-16, MobileNet, MobileNet-V2, ResNet-50, InceptionResNet-V2, Inception-v3, and DenseNet-201), pre-training, early stopping, cross-validation fold, and hyperparameter settings.
In order to perform the classification, TensorFlow [28] and Scikit-Learn [29] were employed to train and evaluate the proposed fundus image classification system. Each model was trained on a Windows 10 operating system with an Intel(R) Xeon (R) Silver 4114@2.20 GHz CPU, 192GB RAM, NVIDIA TITAN RTX 119 GB GPU.
Accuracy, sensitivity, and specificity are statistical analyses that are widely used to evaluate the performance of a diagnostic system [30]. The area under macro average of ROC curve (macro-AUC) and confusion matrices (overall classes) were calculated by using Python with 3.7.9 version and scikit-learn 0.24.1. The output prediction of one fundus image from the classification is the probability of DR, GLC, AMD, or NR. The confusion matrices of each class were extracted to assess the performance of each class of multiclass classification. The confusion matrices provide the number of true positives (TP), false positives (FP), true negatives (TN), and false negatives (FN).
4.1 Fundus Image Quality Evaluation
The fundus image quality evaluation was trained on an open dataset (DRIMDB), which obtained a better performance in training with an accuracy of 97.93% and validation accuracy of 96.97%. The quality of images in the SCH-BH dataset was evaluated using our proposed fundus image quality evaluation method before performing disease classification. Of the 1340 images processed through the quality assessment system, the proposed method distinguished 1207 as good quality or suitable images (DR: 295, GLC: 217, AMD: 114, NR: 581) and 97 as bad or of unsuitable grading. Images classified as good by our proposed algorithm contain normal color, sufficient features, and proper structure, which made them acceptable for analysis [31]. The features, such as blood vessels, optic disc, and macula, on good images, are clearly expressed, as illustrated in Fig. 3. The bad quality or ungradable fundus images are in four ungradable categories [32], blurry, lash artifact, poor optic disc visibility, and uneven illumination as shown in Fig. 4. The ungradable predicted images, as shown in Figs. 4a–4c, which are blurry images, lash artifact, and poor optic disc visibility, affect the presentation of features in fundus photographs, especially blood vessels, optic disc, and sight-threatening features. The demonstration of features helps identify various eye diseases. Fig. 4d shows uneven illumination; some parts of the fundus images are dark, making all of the information insufficient for identification.
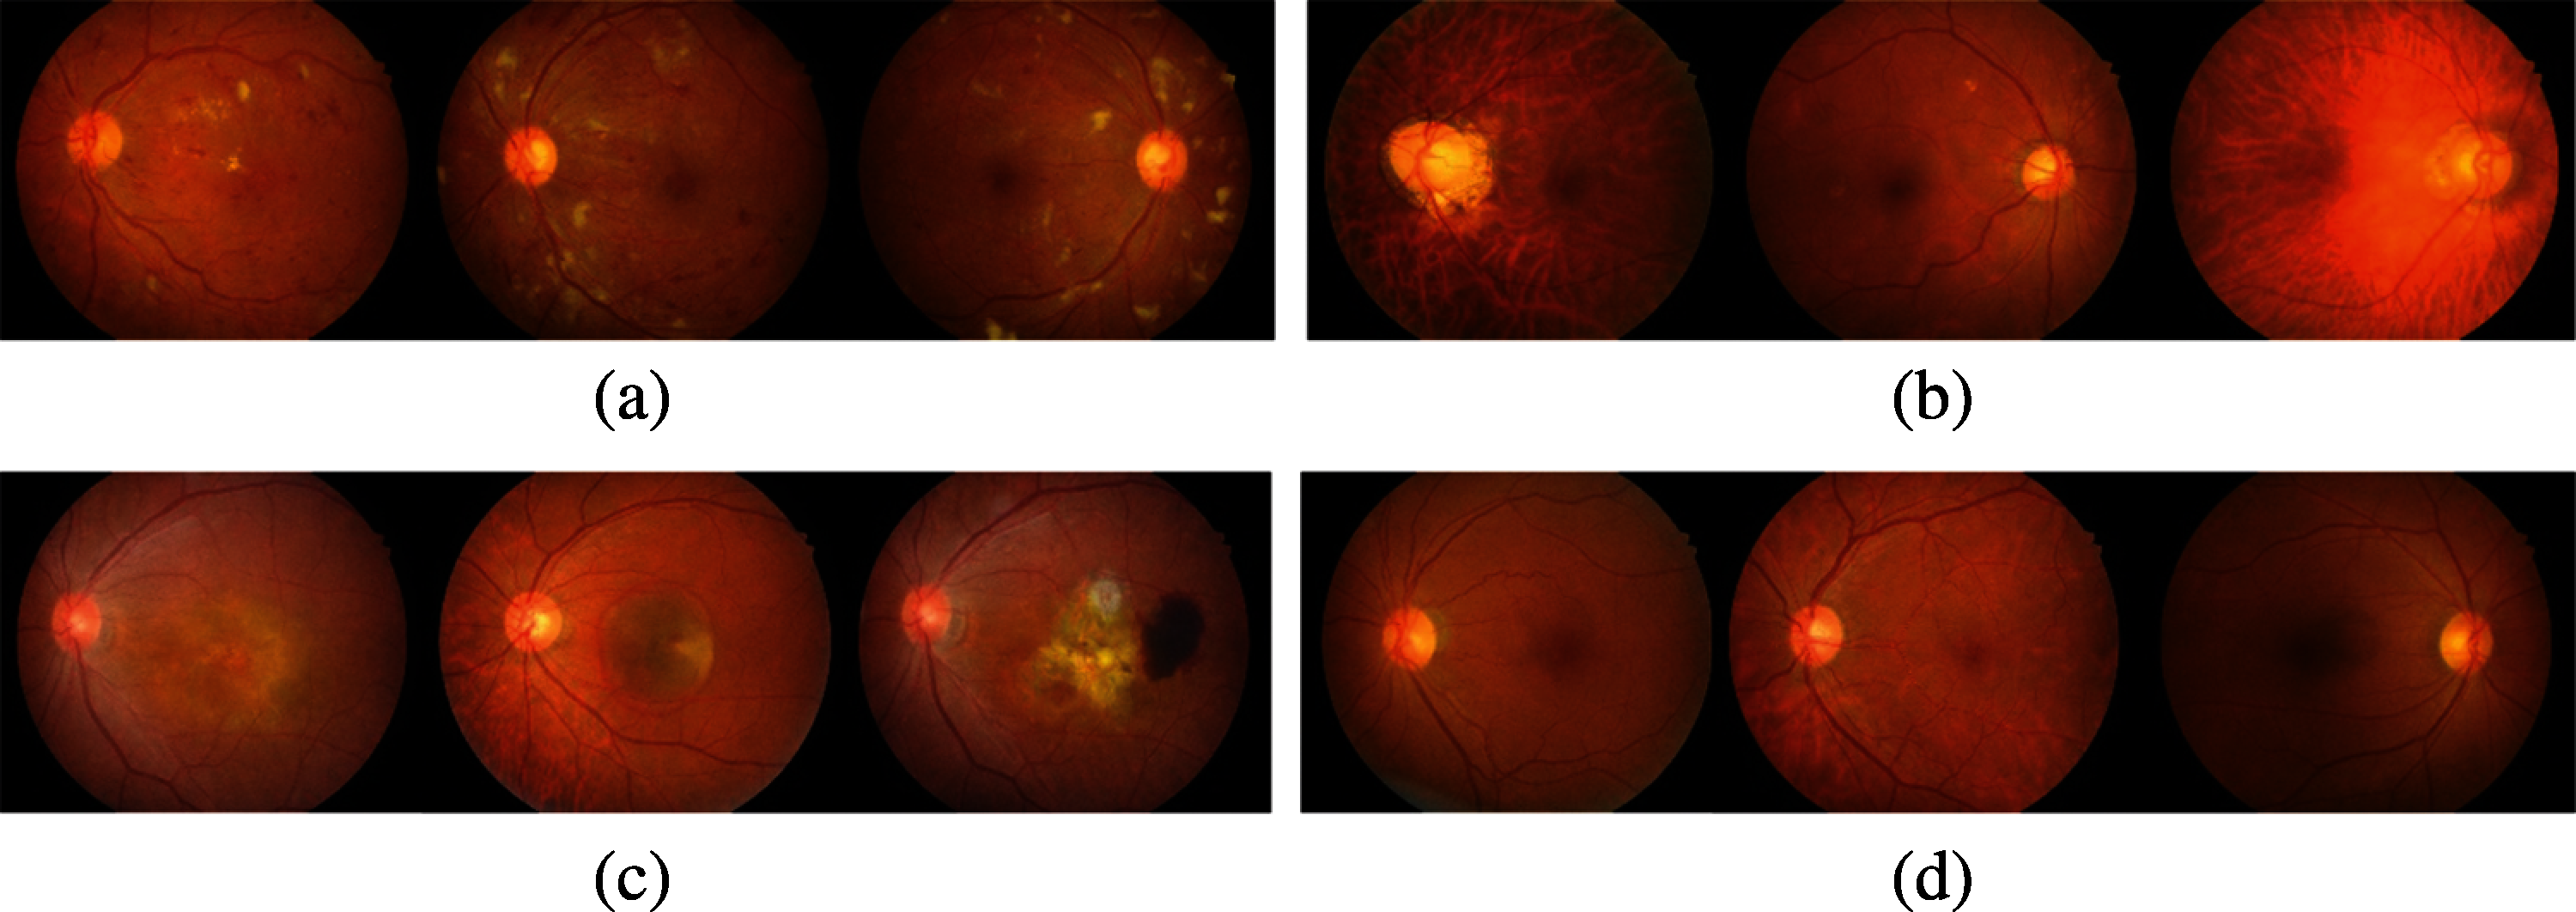
Figure 3: Example of good quality images assessed by the proposed method. (a) DR class (b) GLC class (c) AMD class (d) normal class
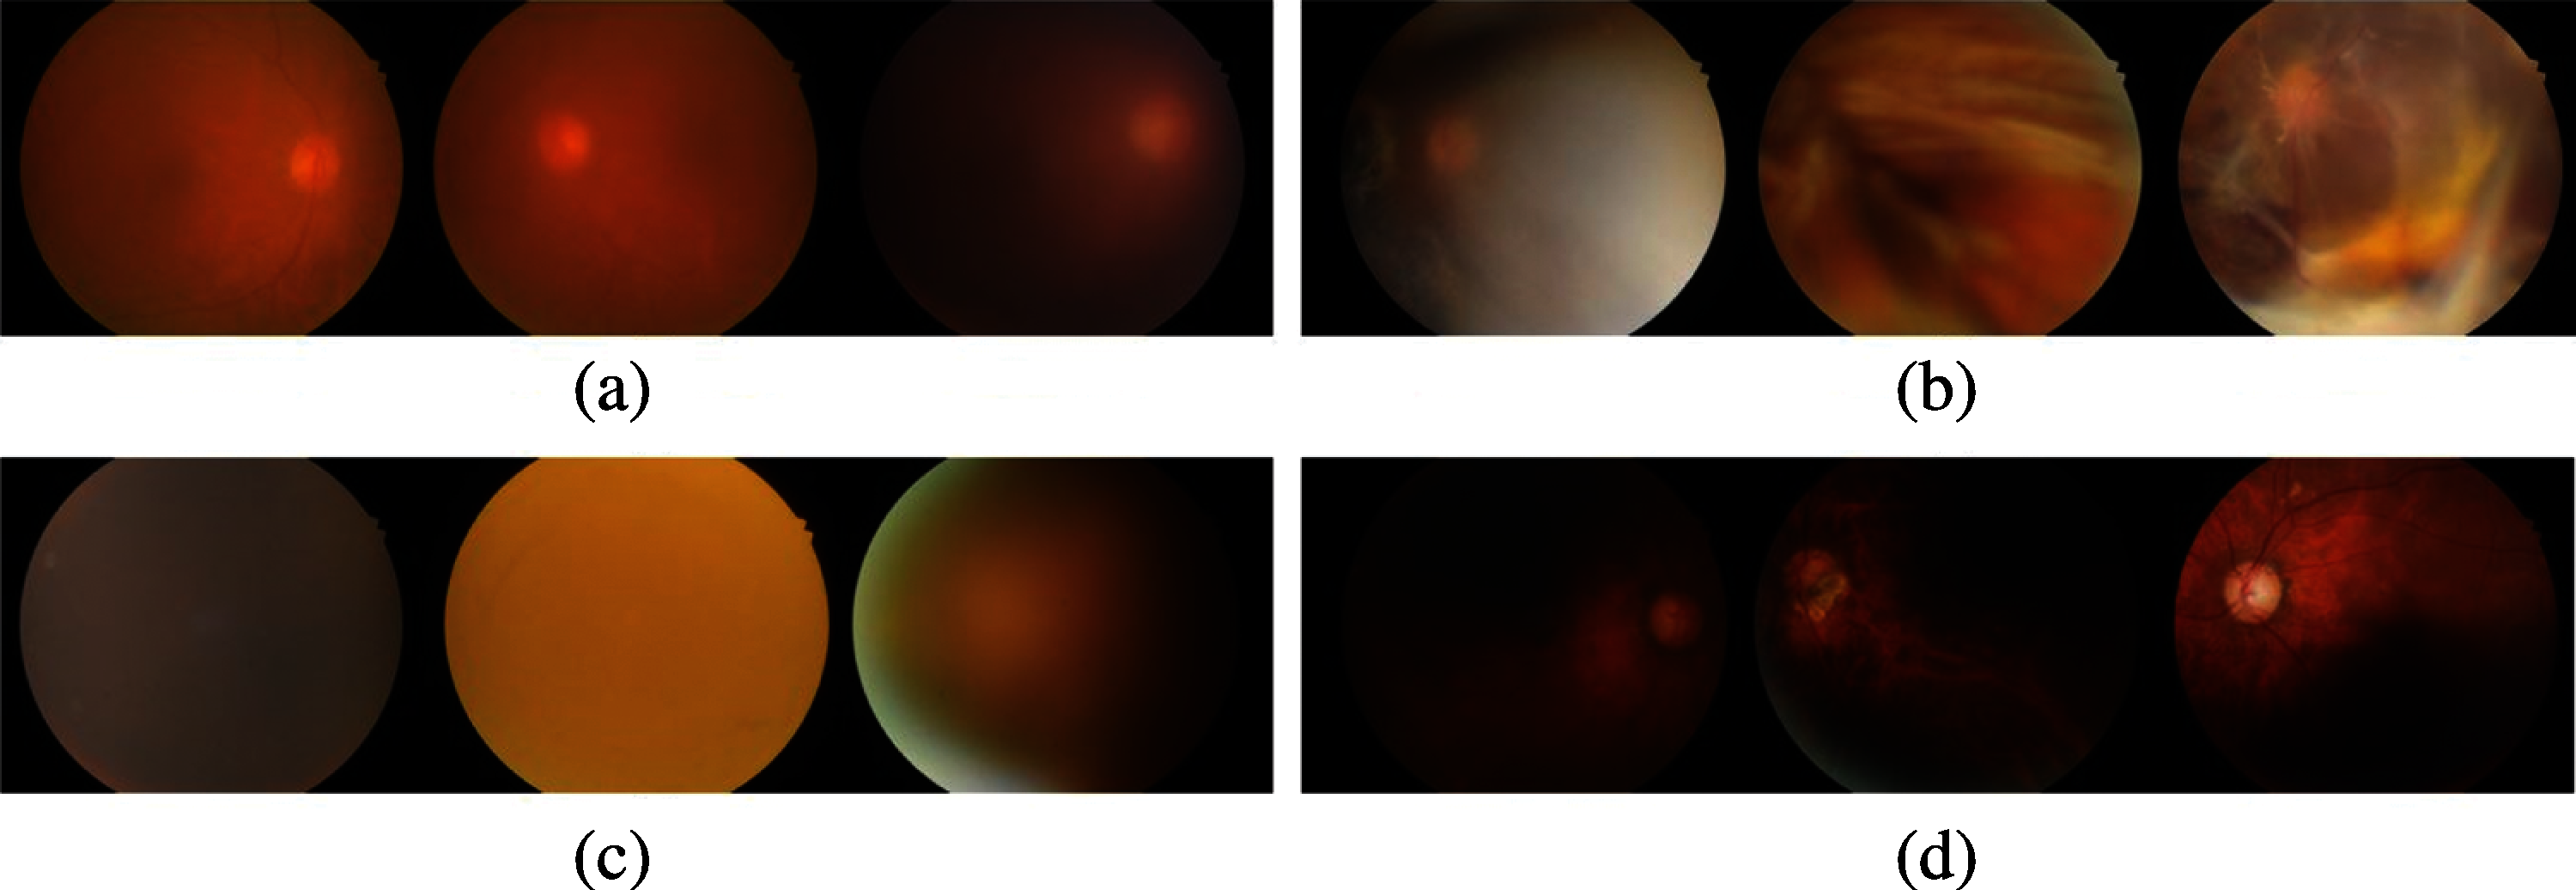
Figure 4: Example of poor-quality images assessed by the proposed method. (a) blurry images (b) lash artifact (c) poor optic disc visibility (d) uneven illumination
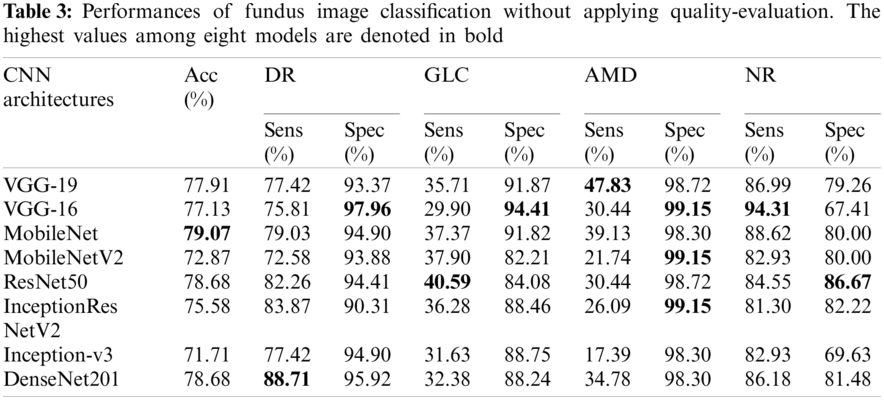
4.2 Fundus Image Assessment Without Initial Fundus Image Quality Evaluation
Fundus images of the SCH-BH dataset were used to improve multiclass classification. Tab. 3 shows the performance of the different CNN architectures without quality evaluation in terms of accuracy, sensitivity, and specificity. MobileNet, ResNet-50, and DenseNet-201 models are the top-three models, outperforming five of the CNN models evaluated. MobileNet achieved 79.07% accuracy with 79.03% sensitivity and 94.90% specificity for DR, 37.37% sensitivity and 91.82% specificity for GLC, 39.13% sensitivity and 98.30% specificity for AMD, and 88.62% sensitivity and 80.00% specificity for the NR class. ResNet-50 achieved 78.68% accuracy, 82.26% sensitivity, and 94.41% specificity for DR, 40.59% sensitivity and 84.08% specificity for GLC, 30.44% sensitivity and 98.72% specificity for AMD, and 84.55% sensitivity and 86.67% specificity for NR. For DenseNet-201%, 78.68% accuracy, 88.71% sensitivity, and 95.92% specificity for DR, 32.38% sensitivity and 88.24% specificity for GLC, 34.78% sensitivity and 98.30% specificity for AMD, and 86.18% sensitivity and 81.48% specificity for the NR class. Moreover, we also evaluated the models’ performances by utilizing the ROC curve (see Fig. 4), along with the macro-AUC values. A comparison of the macro-AUC values showed that the VGG-19 with a macro-AUC of 0.94 performs better than other deep learning architectures.
4.3 Fundus Images Evaluation with Initial Quality Fundus Evaluation (Quality Images Filtering)
All the qualified images that were evaluated by our proposed method were utilized to assess the performance of the eight CNN architectures. Tab. 4 shows the performance of the different CNN architectures with quality evaluation in terms of accuracy, sensitivity, and specificity. Fig. 5 illustrates the macro-ROC curve and AUC values of all models. The AUC was 0.99, 0.96, and 0.95 of DenseNet-201, ResNet-50, and MobileNet, respectively. These are the top three models in terms of AUC values.
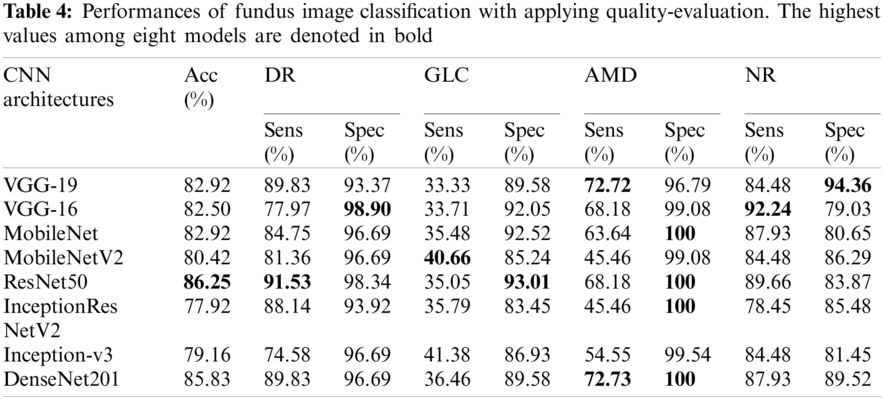
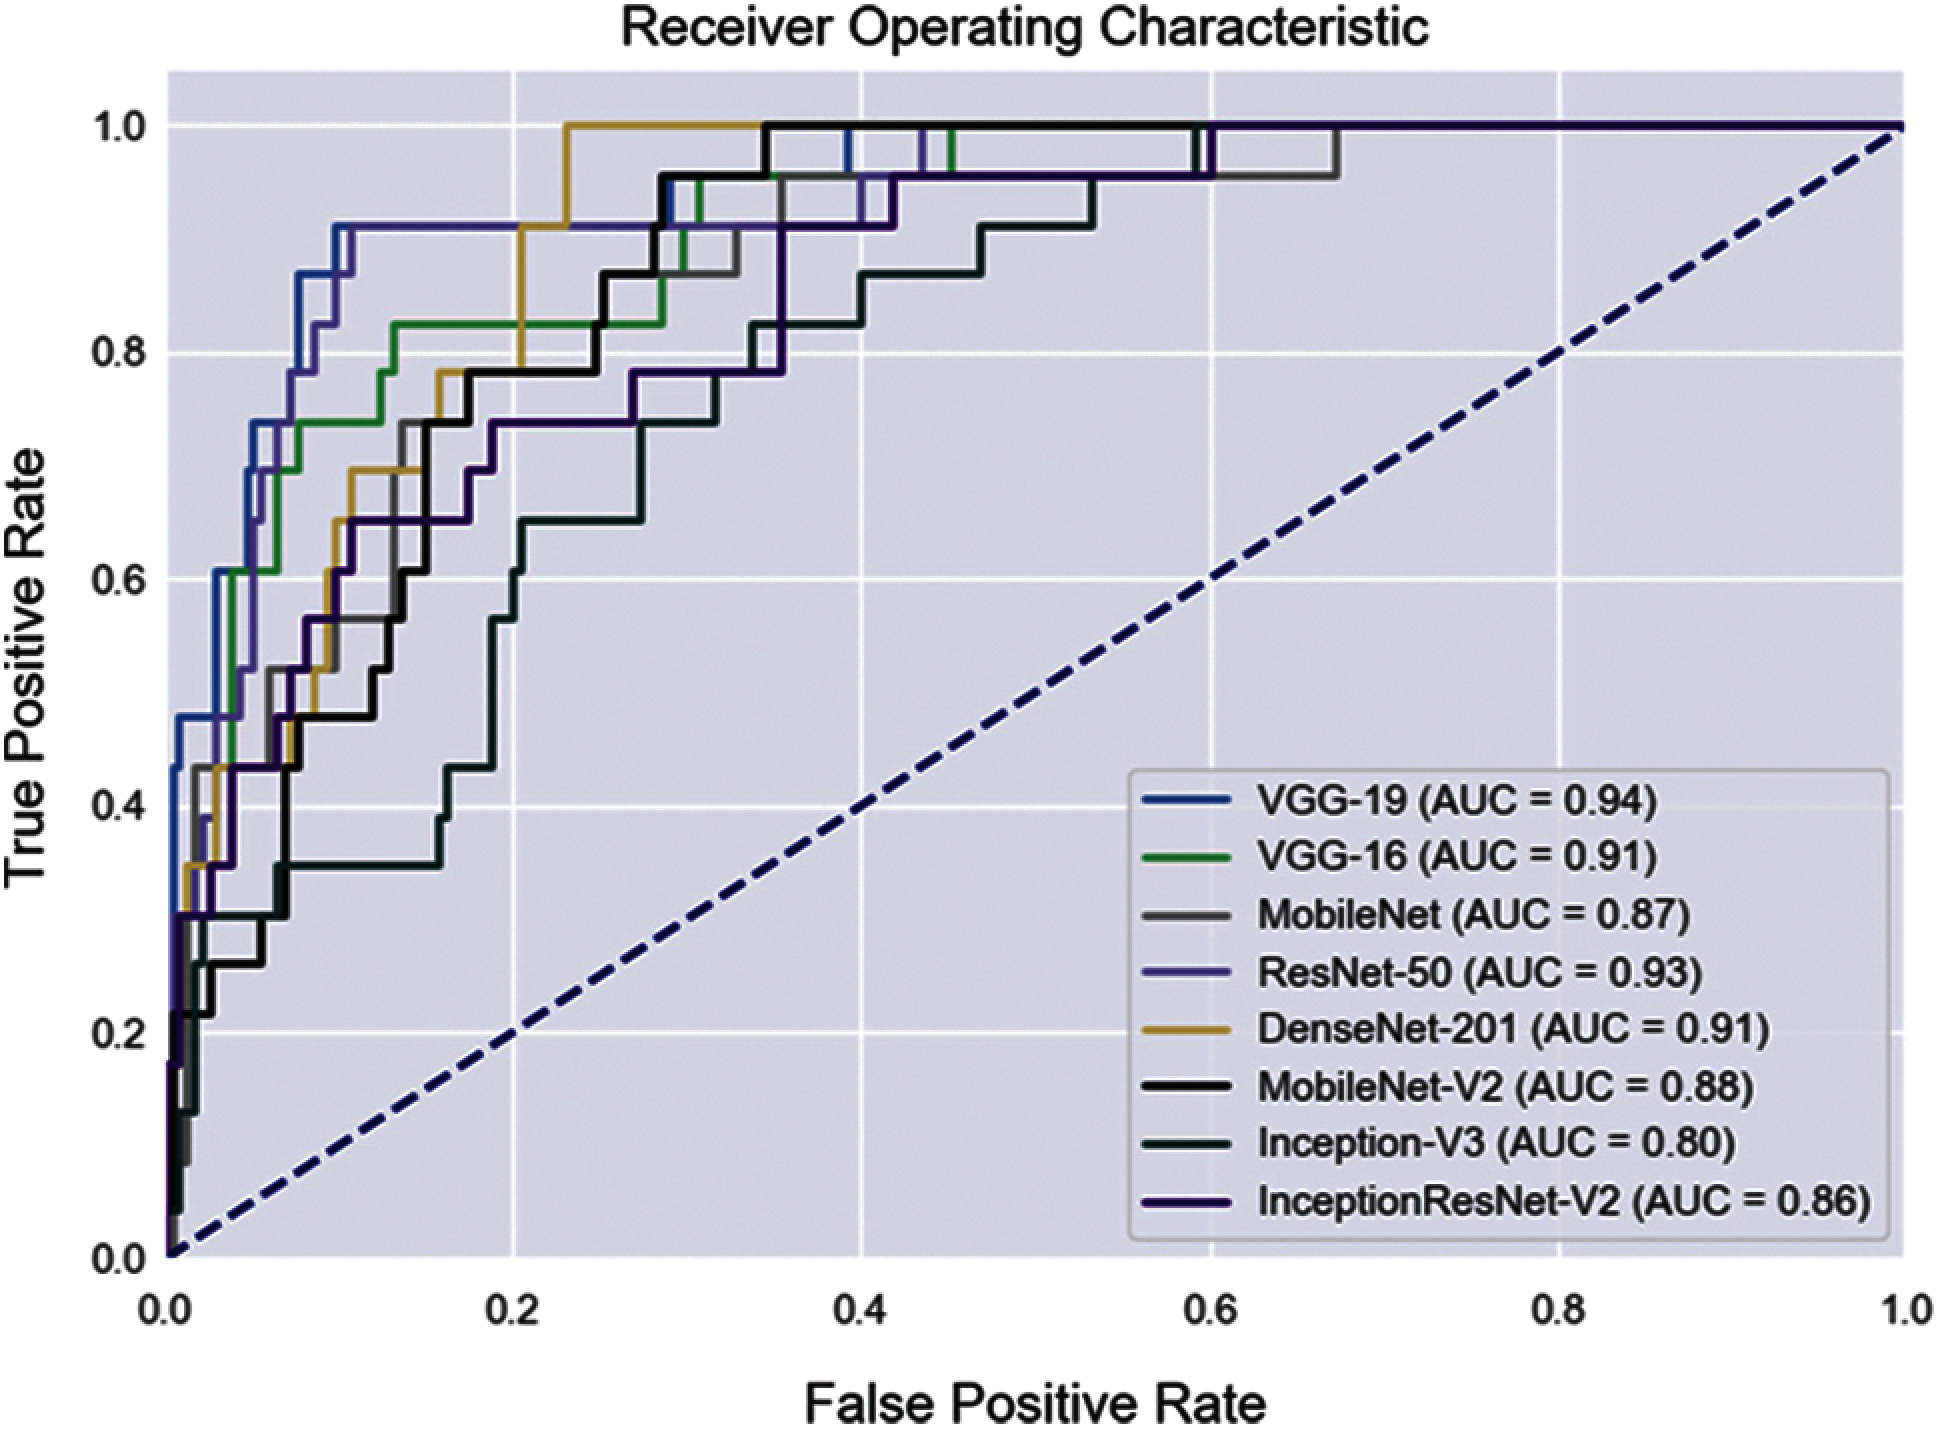
Figure 5: ROC curves of fundus image evaluation without applying QET
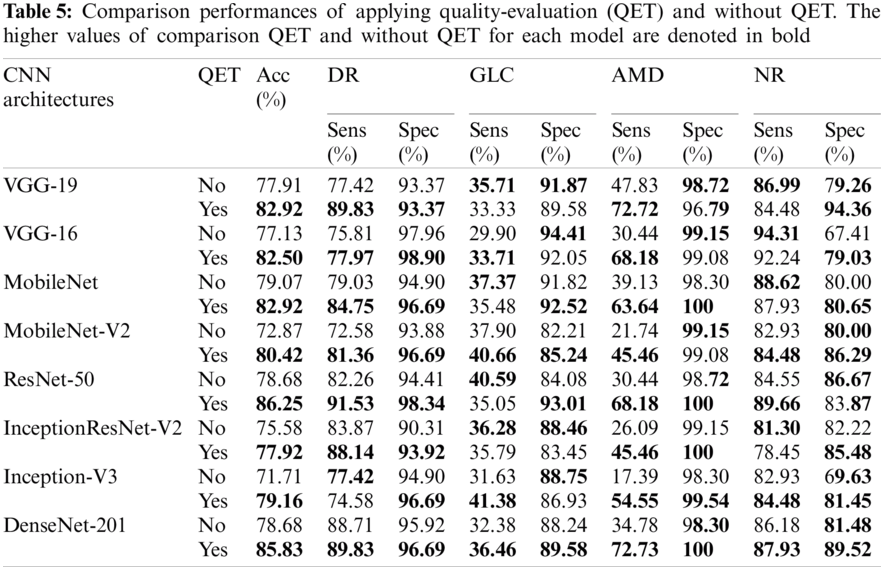
In addition, Tab. 5 shows a comparison of the performance between applying quality evaluation and without applying. The performance of top-three models (MobileNet, ResNet50, and DenseNet201) of implementing quality assessment outperform fundus classification without performing quality assessment (except sensitivity for NR of MobileNet, and sensitivity for GLC and specificity for NR of ResNet50 model). The ResNet-50 achieved an average accuracy of 86.25% of the fuse quality evaluation, this accuracy being higher than the accuracy of multi-class classification with none assessing (78.68%). The multiclass classification with excluding filtering got an average accuracy of 77.91%, 77.13%, 79.07%, 72.87%, 78.68%, 75.58%, 71.71%, and 78.68% of VGG-19, VGG-16, for MobileNet, MobileNet-V2, ResNet-50, InceptionResNet-V2 model, Inception-V3, and DenseNet-201, respectively. For multi-class classification with filtering unacceptable images achieved average accuracy of 82.90%, 82.50%, 82.92%, 80.42%, 86.25%, 77.92%, 79.16%, 85.83% of VGG-19, VGG-16, among MobileNet, MobileNet-V2, ResNet-50, InceptionResNet-V2, Inception-V3, and DenseNet-201 model, respectively.
The evaluation of the quality of fundus is proposed to assess the appropriate images for eye-diseases analysis. Poor quality images can be detected and excluded by the proposed method (as shown in the Results section), allowing deep learning to be used to analyze fundus images. By comparing macro-AUC values without QET (Fig. 5) and the macro-AUC values with QET (Fig. 6), it is found that the macro-AUC value of each CNN architecture is higher with QET.
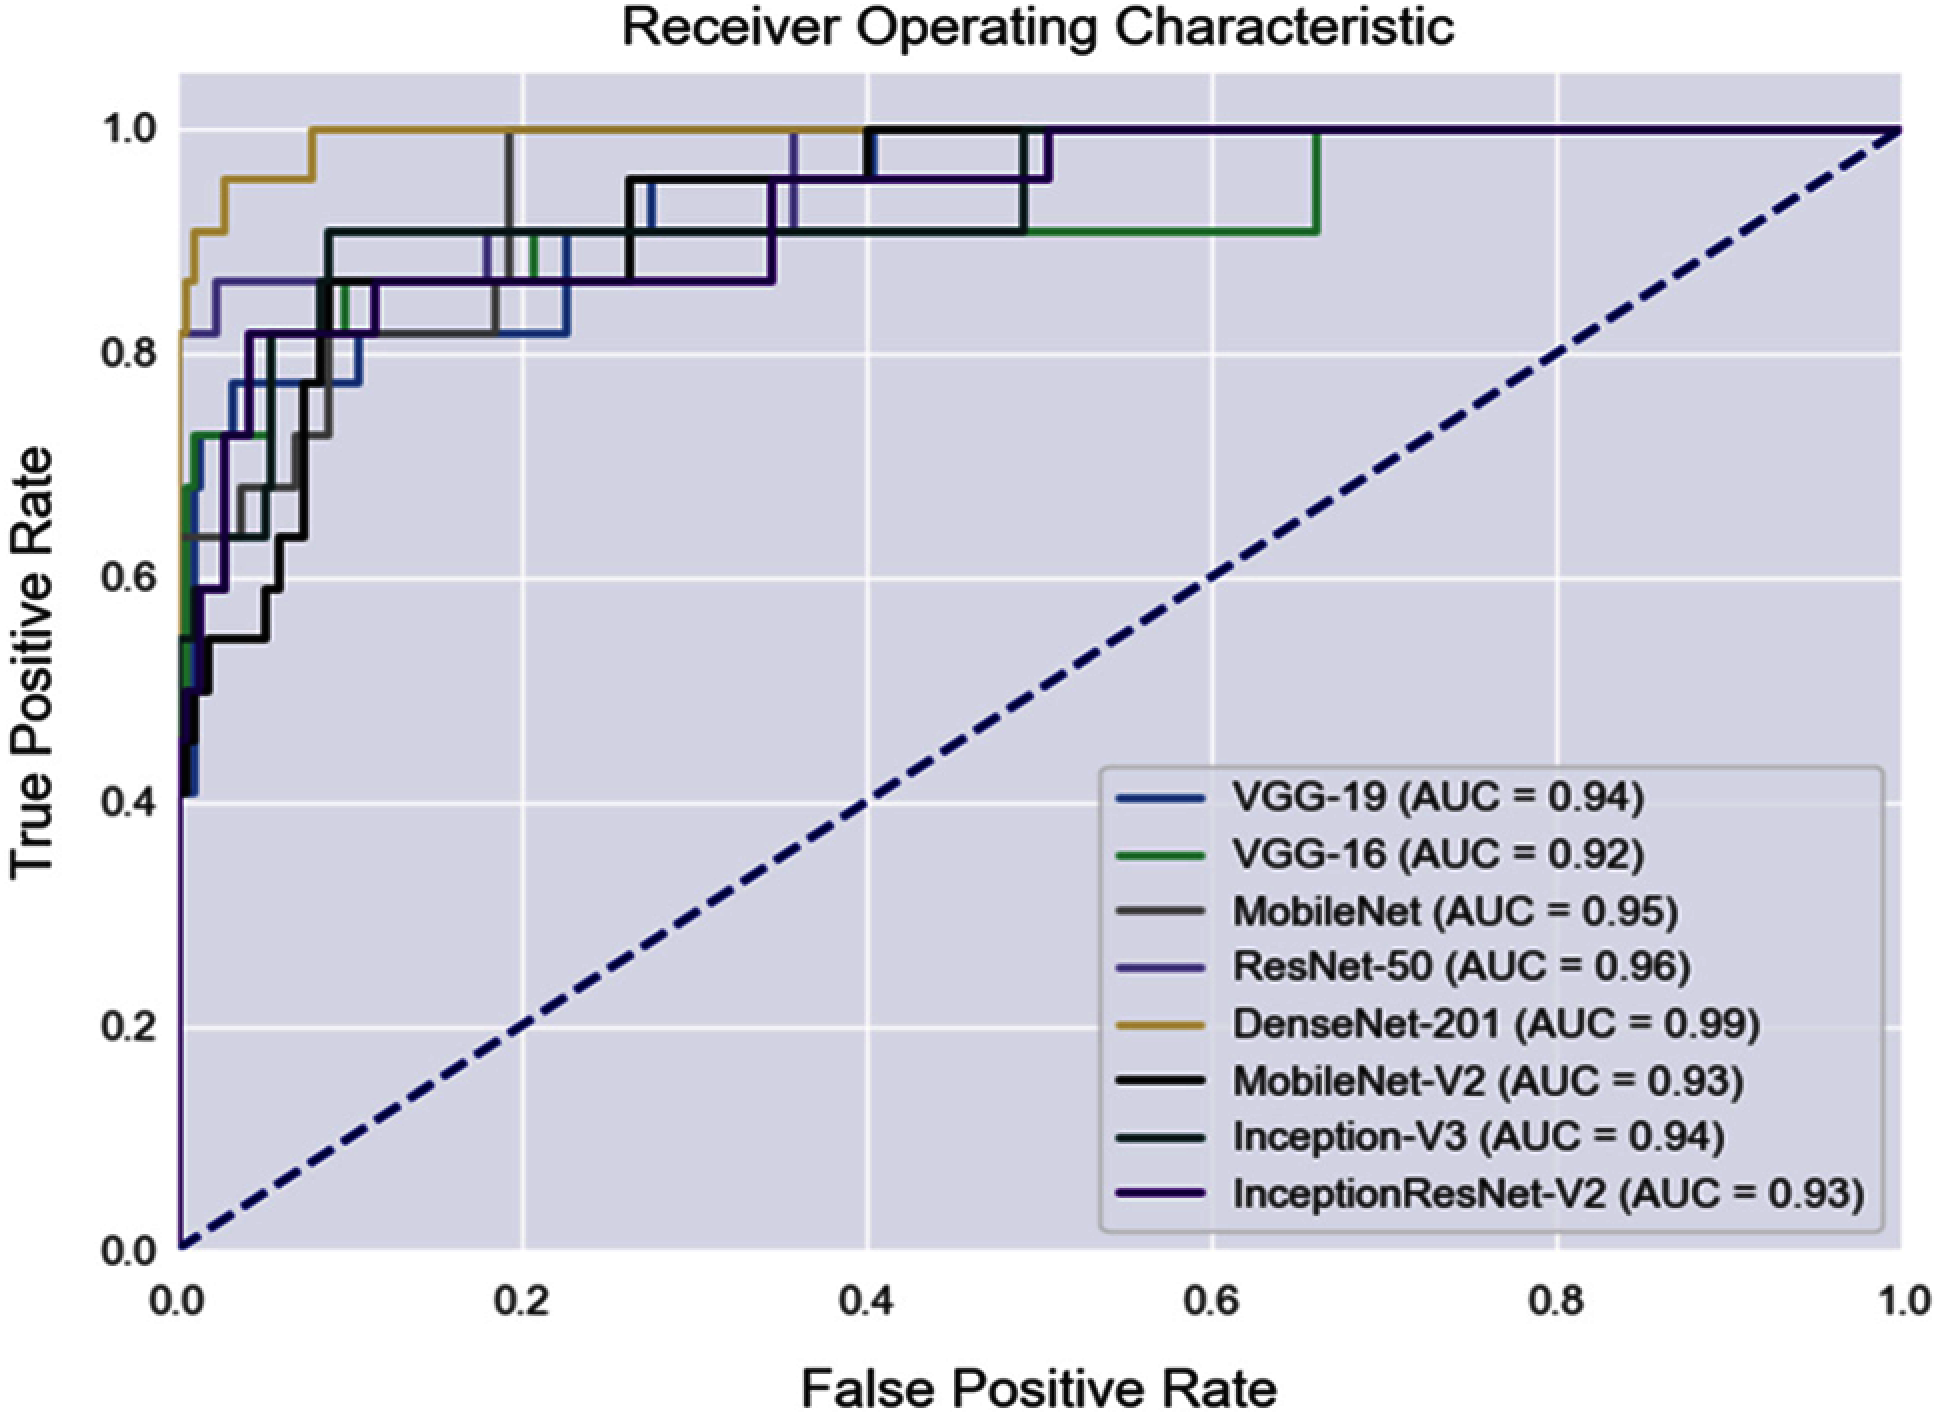
Figure 6: ROC curves of fundus image evaluation with applying QET
This study is the first to simultaneously provide integrated quality assessment in multiclass fundus image classification and three eye disease classifications. The previous studies have only studied quality appraisals or fundus classification separately. Chea et al. [33] evaluated eye diseases based on deep learning technique (none transfer learning) for multiclass classification on a public dataset and obtained an average accuracy of 85.79% (on the ResNet-50 model), which outperforms other deep learning models (ResNet-101, ResNet-152, VGG-16, VGG-19) used with the manual filtering of different publishing datasets. This study obtained an average accuracy of 86.25% on the ResNet-50 model, which is higher than other models (VGG-19, VGG-16, MobileNet, MobileNet-V2, InceptionResNet-V2, Inception-v3, and DenseNet-201) on the SCH-BH dataset. ResNet-50 outperforms the others because it is an excellent model for image classification [34] and can learn and extract meaningful features of images. The feature extraction layers of ResNet-50 also perform well on fundus image classification.
To assess the effectiveness of suitable-image assessment for fundus classification, the comparison performances between initial quality evaluation and native (without assessing quality) were examined. The results demonstrated that integrating quality evaluation in the fundus image classification system obtained better performance than without assessed quality for almost all CNN architectures used. DenseNet-201, without quality evaluation, achieved an overall accuracy of 78.68%, a sensitivity of 88.71% and a specificity of 95.92% for DR, a sensitivity of 32.38% and a specificity of 88.24% for GLC, the sensitivity of 34.78%, and specificity of 98.30% for AMD, and a sensitivity of 86.18% and a specificity of 81.48% for NR. For the same model, with quality assessment, the overall accuracy was 85.83%, 89.83% sensitivity and 96.69% specificity for DR, 36.46% sensitivity and 89.58% specificity for GLC, 72.73% sensitivity and 100% specificity for AMD, and 87.93% sensitivity and 89.52% specificity for NR (Tab. 5). Therefore, quality assessment is possible by screening good images for the fundus diagnosis system. Poor quality/bad images affect the fundus diagnosis system, which can result in misdiagnosis. Thus, quality assessment contributes to improving the performance of multiclass fundus classification.
DNNs were trained using large datasets to achieve better classification performance [35,36]. Even with a limited number of fundus images, the classification was still highly accurate based on the training technique. Transfer learning technique transfers learned features trained on one task (thousands of general images) to classify the second task (fundus images). Training on the second task requires a significant training time with a small dataset. Vujosevic et al. [37] compared the classification performance of native and transfer learning and demonstrated that the transfer learning technique was better than native. The transfer learning technique contributes to an accurate evaluation.
In conclusion, this study presents a multiclass classification of fundus images for detecting eye diseases (DR, GLC, and AMD) and healthy eyes (NR) based on a transfer learning approach. This study aims to propose an integrated quality evaluation with multiclass classification to eliminate bad quality images before performing fundus image classification, which can improve the classification performance. Integration quality evaluation in fundus classification can improve AUC performance from 0.91 to 0.99 on the DenseNet-201 model.
Funding Statement: This work was supported by the National Research Foundation of Korea (NRF) grant funded by the Korea government (MSIT) (No. NRF-2021R1A2C1010362) and the Soonchunhyang University Research Fund.
Conflicts of Interest: The authors declare that they have no known competing financial interests or personal relationships that could have appeared to influence the work reported in this paper.
1. F. Arcadu, F. Benmansour, A. Maunz, J. Willis, Z. Haskova et al., “Deep learning algorithm predicts diabeticretinopathy progression in individual patients,” NPJ Digital Medicine, vol. 2, no. 1, pp. 1–9, 2019. [Google Scholar]
2. Y. Zheng, M. He and N. Congdon, “The worldwide epidemic of diabetic retinopathy,” Indian Journal of Ophthalmology, vol. 60, no. 5, pp. 428–431, 2012. [Google Scholar]
3. I. Pearce, R. Simó, M. Lövestam-Adrian, D. T. Wong and M. Evans, “Association between diabetic eye disease and other complications of diabetes: Implications for care. A systematic review,” Diabetes, Obesity and Metabolism, vol. 21, no. 3, pp. 467–478, 2019. [Google Scholar]
4. S. J. Seo, Y. H. Lee, S. Y. Lee, H. W. Bae, S. Hong et al., “Estimated prevalence of glaucoma in South Korea using the national claims database,” Journal of Ophthalmology, vol. 2016, pp. 1–7, 2016. [Google Scholar]
5. A. Grzybowski, P. Brona, G. Lim, P. Ruamviboonsuk, G. S. W. Tan et al., “Artificial intelligence for diabetic retinopathy screening: A review,” Eye, vol. 34, no. 3, pp. 451–460, 2020. [Google Scholar]
6. D. S. Boyer, U. Schmidt-Erfurth, M. L. Campagne, E. C. Henry and C. Brittain, “The pathophysiology of geographic atrophy secondary to age-related macular degeneration and the complement pathway as a therapeutic target,” Retina (Philadelphia, Pa.), vol. 37, no. 5, pp. 819–835, 2017. [Google Scholar]
7. C. Lam, D. Yi, M. Guo and T. Lindsey, “Automated detection of diabetic retinopathy using deep learning,” AMIA Summits on Translational Science Proceedings, vol. 2018, pp. 147–155, 2018. [Google Scholar]
8. S. Keel, J. Wu, P. Y. Lee, J. Scheetz and M. He, “Visualizing deep learning models for the detection of referable diabetic retinopathy and glaucoma,” JAMA Ophthalmology, vol. 137, no. 3, pp. 288–292, 2019. [Google Scholar]
9. C. González-Gonzalo, V. Sánchez-Gutiérrez, P. Hernández-Martínez, I. Contreras and Y. T. Lechanteur, “Evaluation of a deep learning system for the joint automated detection of diabetic retinopathy and age-related macular degeneration,” Acta Ophthalmologica, vol. 98, no. 4, pp. 368–377, 2020. [Google Scholar]
10. T. Pratap and P. Kokil, “Computer-aided diagnosis of cataract using deep transfer learning,” Biomedical Signal Processing and Control, vol. 53, no. 5, pp. 101533, 2019. [Google Scholar]
11. R. Asaoka, H. Murata, K. Hirasawa, Y. Fujino, M. Matsuura et al., “Using deep learning and transfer learning to accurately diagnose early-onset glaucoma from macular optical coherence tomography images,” American Journal of Ophthalmology, vol. 198, no. 9422, pp. 136–145, 2019. [Google Scholar]
12. J. J. Gómez-Valverde, A. Antón, G. Fatti, B. Liefers and A. Herranz., “Automatic glaucoma classification using color fundus images based on convolutional neural networks and transfer learning,” Biomedical Optics Express, vol. 10, no. 2, pp. 892–913, 2019. [Google Scholar]
13. K. Shankar, A. R. W. Sait, D. Gupta, S. K. Lakshmanaprabu, A. Khanna et al., “Automated detection and classification of fundus diabetic retinopathy images using synergic deep learning model,” Pattern Recognition Letters, vol. 133, no. 3, pp. 210–216, 2020. [Google Scholar]
14. S. Wan, Y. Liang and Y. Zhang, “Deep convolutional neural networks for diabetic retinopathy detection by image classification,” Computers & Electrical Engineering, vol. 72, pp. 274–282, 2018. [Google Scholar]
15. M. J. J. P. van Grinsven, B. van Ginneken, C. B. Hoyng, T. Theelen and C. I. Sanchez, “Fast convolutional neural network training using selective data sampling: Application to hemorrhage detection in color fundus images,” IEEE Transactions on Medical Imaging, vol. 35, no. 5, pp. 1273–1284, 2016. [Google Scholar]
16. F. Cordeiro, K. Tian, S. Shibata-Germanos and M. Pahlitzsch, “Current perspective of neuroprotection and glaucoma,” Clinical Ophthalmology, vol. 9, pp. 2109–18, 2015. [Google Scholar]
17. U. Raghavendra, H. Fujita, S. V. Bhandary, A. Gudigar, J. H. Tan et al., “Deep convolution neural network for accurate diagnosis of glaucoma using digital fundus images,” Information Sciences, vol. 441, pp. 41–49, 2018. [Google Scholar]
18. R. Hemelings, B. Elen, J. Barbosa-Breda, S. Lemmens, M. Meire et al., “Accurate prediction of glaucoma from colour fundus images with a convolutional neural network that relies on active and transfer learning,” Acta Ophthalmologica, vol. 98, no. 1, pp. e94–e100, 2020. [Google Scholar]
19. U. Şevik, C. Köse, T. Berber and H. Erdöl, “identification of suitable fundus images using automated quality assessment methods,” Journal of Biomedical Optics, vol. 19, no. 4, pp. 046006, 2014. [Google Scholar]
20. J. Jiang, J. Liu, C. Qin and D. Wang, “Extraction of urban waterlogging depth from video images using transfer learning,” Water, vol. 10, no. 10, pp. 1485, 2018. [Google Scholar]
21. S. H. Wang and Y. D. Zhang, “Densenet-201-based deep neural network with composite learning factor and precomputation for multiple sclerosis classification,” ACM Transactions on Multimedia Computing, vol. 16, no. 2s, pp. 1–9, 2020. [Google Scholar]
22. G. Bradski and A. Kaehler, “Image Transforms,” in Learning OpenCV: Computer Vision with the OpenCV Library, 1st ed., Sebastopol, CA, USA: O'Reilly Media, pp. 186–189, 2008. [Google Scholar]
23. Z. Li, C. Guo, D. Nie, D. Lin, Y. Zhu et al., “Deep learning for detecting retinal detachment and discerning macular status using ultra-widefield fundus images,” Communications Biology, vol. 3, no. 1, pp. 1–10, 2020. [Google Scholar]
24. K. Wang, X. Zhang, S. Huang, F. Chen, X. Zhang et al., “Learning to recognize thoracic disease in chest x-rays with knowledge-guided deep zoom neural networks,” IEEE Access, vol. 8, pp. 159790–159805, 2020. [Google Scholar]
25. S. Gheisari, S. Shariflou, J. Phu, P. J. Kennedy, A. Agar et al., “A combined convolutional and recurrent neural network for enhanced glaucoma detection,” Scientific Reports, vol. 11, no. 1, pp. 1–11, 2021. [Google Scholar]
26. J. Ma, Y. Song, X. Tian, Y. Hua, R. Zhang et al., “Survey on deep learning for pulmonary medical imaging,” Frontiers of Medicine, vol. 14, no. 4, pp. 450–469, 2020. [Google Scholar]
27. L. Breiman and P. Spector, “Submodel selection and evaluation in regression. the x-random case,” International Statistical Review/Revue Internationale de Statistique, vol. 60, no. 3, pp. 291–319, 1992. [Google Scholar]
28. M. Abadi, P. Barham, J. Chen, Z. Chen and A. Davis, “Tensorflow: A system for large-scale machine learning,” In Proc. of 12th USENIX Symposium on Operating Systems Design and Implementation, Savannah, GA, USA,pp. 265–283, 2016. [Google Scholar]
29. F. Pedregosa, G. Varoquaux, A. Gramfort, V. Michel and B. Thirion, “Scikit-learn: Machine learning in python,” The Journal of Machine Learning Research, vol. 12, pp. 2825–2830, 2011. [Google Scholar]
30. D. Chavarría-Bolaños, L. Rodríguez-Wong, D. Noguera-González, V. Esparza-Villalpando, M. Montero-Aguilar et al., “Sensitivity, specificity, predictive values, and accuracy of three diagnostic tests to predictinferior alveolar nerve blockade failure in symptomatic irreversible pulpitis,” Pain Research and Management, vol. 2017, no. 4, pp. 1–8, 2017. [Google Scholar]
31. F. Shao, Y. Yang, Q. Jiang, G. Jiang and Y. Ho, “Automated quality assessment of fundus images via analysis of illumination, naturalness and structure,” IEEE Access, vol. 6, pp. 806–817, 2018. [Google Scholar]
32. J. M. P. Dias, C. M. Oliveira and L. A. S. Cruz, “Retinal image quality assessment using generic image quality indicators,” Information Fusion, vol. 19, pp. 73–90, 2014. [Google Scholar]
33. N. Chea and Y. Nam, “Classification of fundus images based on deep learning for detecting eye diseases,” Computers, Materials & Continua, vol. 67, no. 1, pp. 411–426, 2021. [Google Scholar]
34. B. A. Albert, “Deep learning from limited training data: Novel segmentation and ensemble algorithms applied to automatic melanoma diagnosis,” IEEE Access, vol. 8, pp. 31254–31269, 2020. [Google Scholar]
35. C. Zheng, X. Xie, Z. Wang, W. Li, J. Chen et al., “Development and validation of deep learning algorithms for automated eye laterality detection with anterior segment photography,” Scientific Reports, vol. 11, no. 1, pp. 1–8, 2021. [Google Scholar]
36. M. Christopher, A. Belghith, C. Bowd, J. A. Proudfoot, M. H. Goldbaum et al., “Performance of deep learning architectures and transfer learning for detecting glaucomatous optic neuropathy in fundus photographs,” Scientific Reports, vol. 8, no. 1, pp. 1–13, 2018. [Google Scholar]
37. S. Vujosevic, S. J. Aldington, P. Silva, C. Hernandez, P. Scanlon et al., “Screening for diabetic retinopathy: New perspectives and challenges,” The Lancet Diabetes & Endocrinology, vol. 8, no. 4, pp. 337–347, 2020. [Google Scholar]
 | This work is licensed under a Creative Commons Attribution 4.0 International License, which permits unrestricted use, distribution, and reproduction in any medium, provided the original work is properly cited. |