DOI:10.32604/cmc.2022.021626
| Computers, Materials & Continua DOI:10.32604/cmc.2022.021626 | |
| Article |
Leveraging Active Decremental TTL Measuring for Flexible and Efficient NAT identification
1National University of Defense Technology, Changsha, 410073, China
2Department of Computer Science, University of Victoria, Canada
*Corresponding Author: Zhiping Cai. Email: zpcai@nudt.edu.cn
Received: 08 July 2021; Accepted: 09 August 2021
Abstract: Malicious attacks can be launched by misusing the network address translation technique as a camouflage. To mitigate such threats, network address translation identification is investigated to identify network address translation devices and detect abnormal behaviors. However, existing methods in this field are mainly developed for relatively small-scale networks and work in an offline manner, which cannot adapt to the real-time inference requirements in high-speed network scenarios. In this paper, we propose a flexible and efficient network address translation identification scheme based on actively measuring the distance of a round trip to a target with decremental time-to-live values. The basic intuition is that the incoming and outgoing traffic from a network address translation device usually experiences the different number of hops, which can be discovered by probing with dedicated time-to-live values. We explore a joint effort of parallel transmission, stateless probes, and flexible measuring reuse to accommodate the efficiency of the measuring process. We further accelerate statistical counting with a new sublinear space data structure Bi-sketch. We implement a prototype and conduct real-world deployments with 1000 volunteers in 31 Chinese provinces, which is believed to bring insight for ground truth collection in this field. Experiments on multi-sources datasets show that our proposal can achieve as high precision and recall as 95% with a traffic handling throughput of over 106 pps.
Keywords: Network address translation; NAT security; NAT identification; active measurement
As a widely adopted protocol, network address translation (i.e., NAT), also known as IP masquerading, provides transparent routing to hosts by mapping IP addresses from one realm to another [1]. Based on NAT, only a single IP address is required to represent a group of devices (e.g., PC, mobile phone), which in return makes every single device behind one NAT anonymous. Hence, NAT is an attractive technique that often being misused by malicious users who want to hide the real identity [2]. As reported, approximately 19% of the infected hosts reside in NATed domains [3]. Meanwhile, unauthorized NAT devices may be a significant security problem [4] and the malicious hosts hidden behind the NAT devices will be continuous threats to network security [2,5]. In order to detect these threats, it is essential to effectively identify NAT usage during network services [3,4]. There are several techniques developed for analyzing the NAT usage situation. Some propose to identify NAT usage depending on periodically observed fields, such as IP ID or TCP options [6]. Differences in the OS fingerprints of the same IP from multi-round of scanning indicate the NAT usage [7]. Meanwhile, the frequency of accessing web services from the same address is introduced to make the inference in by analyzing offline traffic [8]. However, involving long-term measuring for the single IP results in considerable storage and computing costs. Considering these limitations, we point out that these efforts predominately are designed to work offline for small-scale networks, thus cannot scale to large-scale NAT identification in real-time. In fact, it is essential for NAT identification to work online in real-time. On one hand, the adoption of 100 Gbps networks is nowadays pervasive [9]. In these settings, the peak traffic can easily reach a throughput of 2,000 Gbps for large Internet exchange points [10]. An effective identification method is expected to respond to these inputs flexibly. On the other hand, the mobility of end devices leads to instability of the NAT traffic [11,12]. Furthermore, the network types (NAT/not NAT) of a mobile terminal change rapidly during moving. For the detection of malicious behaviors behind NAT, effective identification should perceive such dynamics and fluctuations timely.
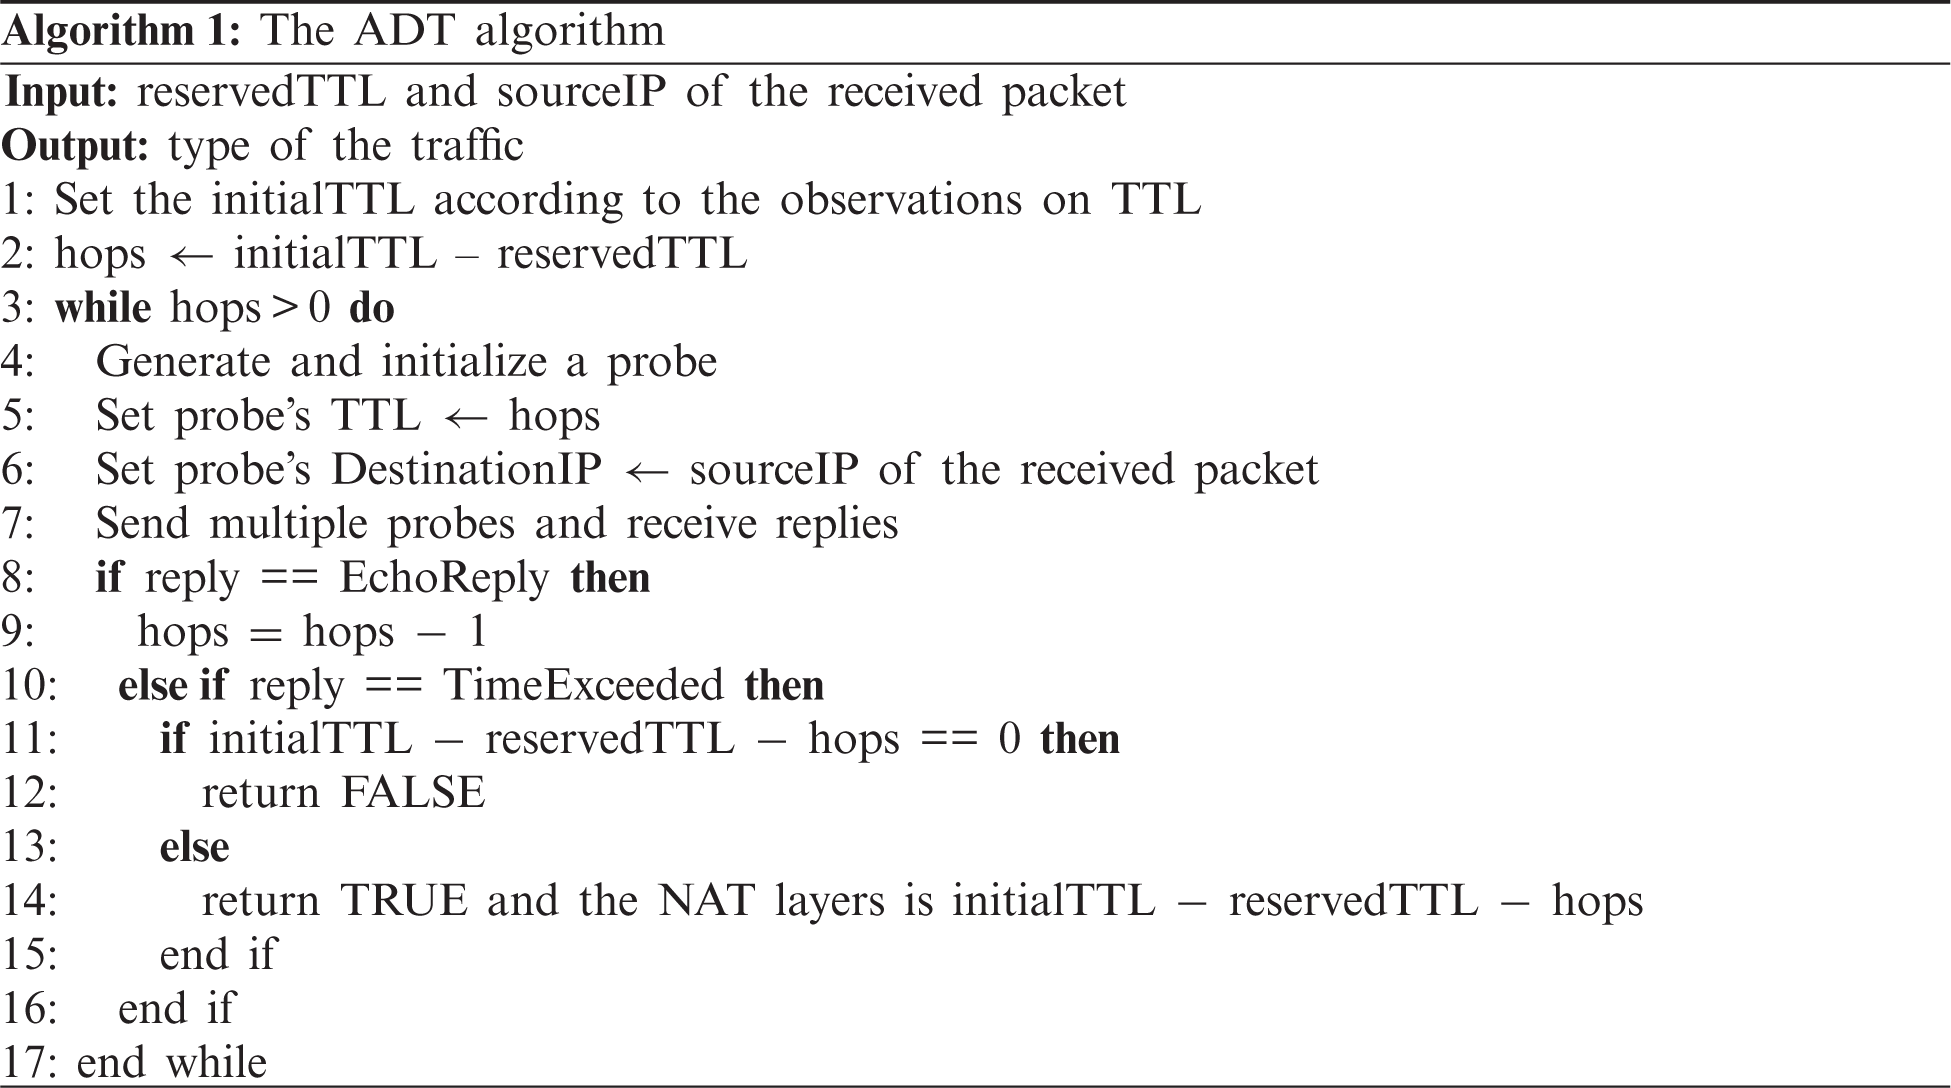
In this work, we propose a flexible and efficient NAT identification scheme that can adapt to large-scale networks and fluctuated traffic. Our basic insight is that the hops he to an end device in NAT environment is in fact further than reaching out to the IP address it uses. To this end, we design an Active Decremental TTL-based (ADT) algorithm whose probes are composed of a series of ICMP packets with decremental TTL values (i.e., he, he −1, etc.). Compared with the ADT algorithm, the existing traceroute tools will send abundant small TTL (e.g., 1, 2) probes in the initial stage which undoubtedly cause the waste of upload bandwidth.
Given that the amount of incoming traffic is large, we carefully adopt several mechanisms including parallel transmission, stateless probes, measuring reuse and data approximation to implement the scheme. For computing statistics during identification requires tremendous query operations, we design a new sublinear space data structure (i.e., Bi-sketch) to avoid excessive intermediate information storage, simplify the counting process, and attain efficiency. Compared with Count-Min Sketch [13] and MV Sketch [14], Bi-sketch solves the statistical challenge for inferring multi-type real-time data streams.
Note that existing techniques test their proposals on offline datasets due to the lack of NAT labeled traffic. To fill this gap, we implement a prototype and deploy it in real-world networks during the evaluation. In summary, we make the following contributions:
• We implement a comprehensive NAT identification scheme integrating the proposed Active Decremental TTL-based (ADT) algorithm and several innovative mechanisms (i.e., parallel transmission, stateless probes, measuring reuse and data approximation).
• We propose a new sketch structure (i.e., Bi-sketch) to accelerate statistic computation with its error bound theoretically proved.
• Targeted at the lack of NAT labeled traffic datasets, we design a lightweight prototype by recruiting around 1000 volunteers from 31 Chinese provinces.
Time to live (TTL), as a field of IP header, is a mechanism that limits the lifespan or lifetime of packets in a network [15]. Our scheme is based on three observations on the IP TTL field.
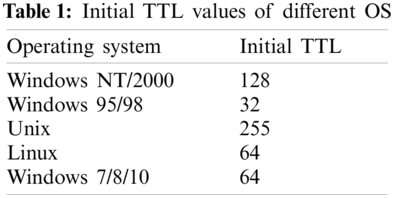
2.1.1 Characteristic Initial TTL
As shown in Tab. 1, This characteristic initial TTL of individual operating system implementations of TCP/IP is well known and can be used as part of a fingerprint to identify the operating system, meaning that we can identify the host running operating system merely by examining its traffic [16].
NAT devices or gateways reduce the TTL of packets that they forward [17]. The TTL field is set by the sender and reduced by every router on the route to its destination. If the TTL field reaches zero before the datagram arrives at its destination, then the datagram is discarded, and a Time−Exceeded packet is sent back to the sender [15].
More than 90% hosts can be reached within 18 hops and the max hops of a normal route path will be less than 32 hops [18].
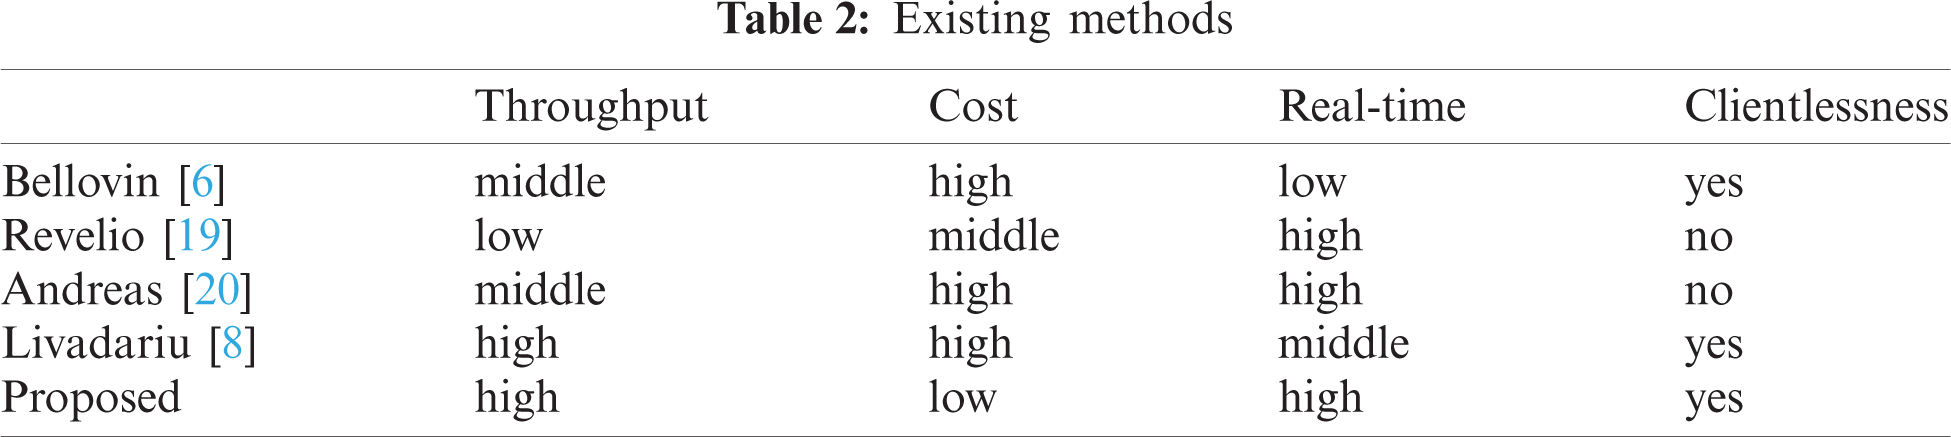
Time to live (TTL), as a field of IP header, is a mechanism that limits the lifespan or lifetime of packets in a network [15]. Our scheme is based on three observations on the IP TTL field. Currently, there are several methods to identify NAT usage. In this section, we first characterize existing methods regarding four principal properties that indicate how well they work (i.e., throughput, cost, real-time and clientlessness). Notification, our purpose is large-scale NAT identification for network threats in the introduction rather than the continuous NAT research without time and cost constraints. Thus, throughput is undoubtedly essential and ground truth should be given appropriately. For large-scale networks, excessive storage and query costs are unacceptable. Extensive client-side participation is also unrealistic in large-scale networks (i.e., clientlessness). In order to detect malicious traffic in time, real-time identification will be necessary. It is desired that a method fulfills all of these properties in order to be comprehensive and to be widely applicable. Then we review existing methods for inferring NAT usage from the literatures and compare them regarding their properties. Moreover, we summarize all the methods in Tab. 2 for comparison.
Based on the observation that on many operating systems, the IP header's ID field is a simple counter [6], Bellovin and Steven M propose a technique for detecting NATs and counting the number of active hosts behind NATs. They find that when receiving packets from the same host behind NAT, the IP header's ID field shows a linearly increasing relationship. However, not all NAT routers and terminals use simple counters in the ID fields [21], and high detection cost and non-real-time measurements are the weaknesses of this method.
NAT Revelio [19] detects the NAT444 at the ISP by deploying the client on the user's host and the server on the public network. When the client accesses the network, it will send a probe message to the server. At the same time, the author used NAT Revelio to detect the deployment of CGN (Carrier Grade NAT) in the United States and Europe [22]. However, this method requires the participation of the client, and its low throughput is also fatal in large-scale NAT identification.
Muller et al. [20] intelligently introduced routing information for detecting Large Scale NAT (LSN) and Carrier Grade NAT (CGN). By using TCP, UDP echo-reply, and traceroute tools, the author proposes to detect NAT based on the routing information and IP address of the replying packets. However, this method has the following problems: 1) The TCP-based version of the algorithm requires superuser privileges on the client-side, which is not acceptable for most of the volunteers running the test. 2) TCP, UDP echo-reply, or traceroute tools all need to save the intermediate state and keep the measurement interval. Further, the participation of the client-side is unrealistic in the real network. Besides, the intermediate state reservation will lead to huge storage and query costs. Thus, the Andreas Muller method is suitable for discovery of NAT middleboxes rather than real-time NAT identification in network security or network management scenarios.
Using passive measurement, Livadariu [8] classifies traffic datasets and detects the deployment of CGN at the autonomous domain (AS) level by two methods. The first method infers/24 blocks used for CGN by analyzing traffic with client identifiers. The second method achieves the same goal by investigating how frequently the same IP address accesses a web service. These two methods are very suitable for NAT detection in a static traffic data set, but for real-time traffic, these methods must store packets of several entire streams as input. It requires a lot of storage costs as the buffer when processing real-time backbone network traffic. Besides, for large-scale traffic analysis, it is almost impossible to verify the results and provide the ground truth.
As is shown in Tab. 2, methods based on the long-term IP header observation cannot meet the real-time requirement. The client-side participation techniques are not applicable for large-scale NAT identification in real time. Passive measurement methods suffer from huge traffic storage costs and non-comprehensive evaluation due to the lack of ground truth. Obviously, existing methods cannot meet all the requirements at the same time, but we adopt several innovative mechanisms to address the problems.
We first present the design of the active decremental TTL-based (ADT) algorithm and its initial assumption intuitively. Then, we implement a comprehensive NAT identification scheme integrating innovative and efficient mechanisms. Furthermore, we give the details of the sublinear space data structure (i.e., Bi-sketch) and its theoretical error bound.
3.1 ADT Algorithm for NAT identification
In general, the detection of NAT should rely on different behavior patterns of NAT gateway and the host behind NAT, those complex detecting mechanisms will confuse the network in large-scale real-time NAT identification. In order to reduce the impact on the network, we use the Active Decremental TTL-based algorithm to build the NAT traffic analyzer. This algorithm can not only identify the NAT usage, but also measure the hops between the end hosts and the NAT devices or gateways.
The initial assumption of our ADT algorithm is that we are able to trace the real hops and compare them with the packet hops when our scheme sniffed a packet as Fig. 1. Suppose a host uses the Windows OS and is 10 hops away from the measurement server, the host would then generate IP packets with a TTL value of 128. The TTL value decrements to 118 and then is inferred to be 128 closest to 118 + 32 when the packet arrives at the measurement server and the public IP source address of NAT devices or gateways can be extracted. However, the measurement server finds that the hops to the public source IP are 9 rather than 10 hops as predicted, revealing the existence of the NAT router.
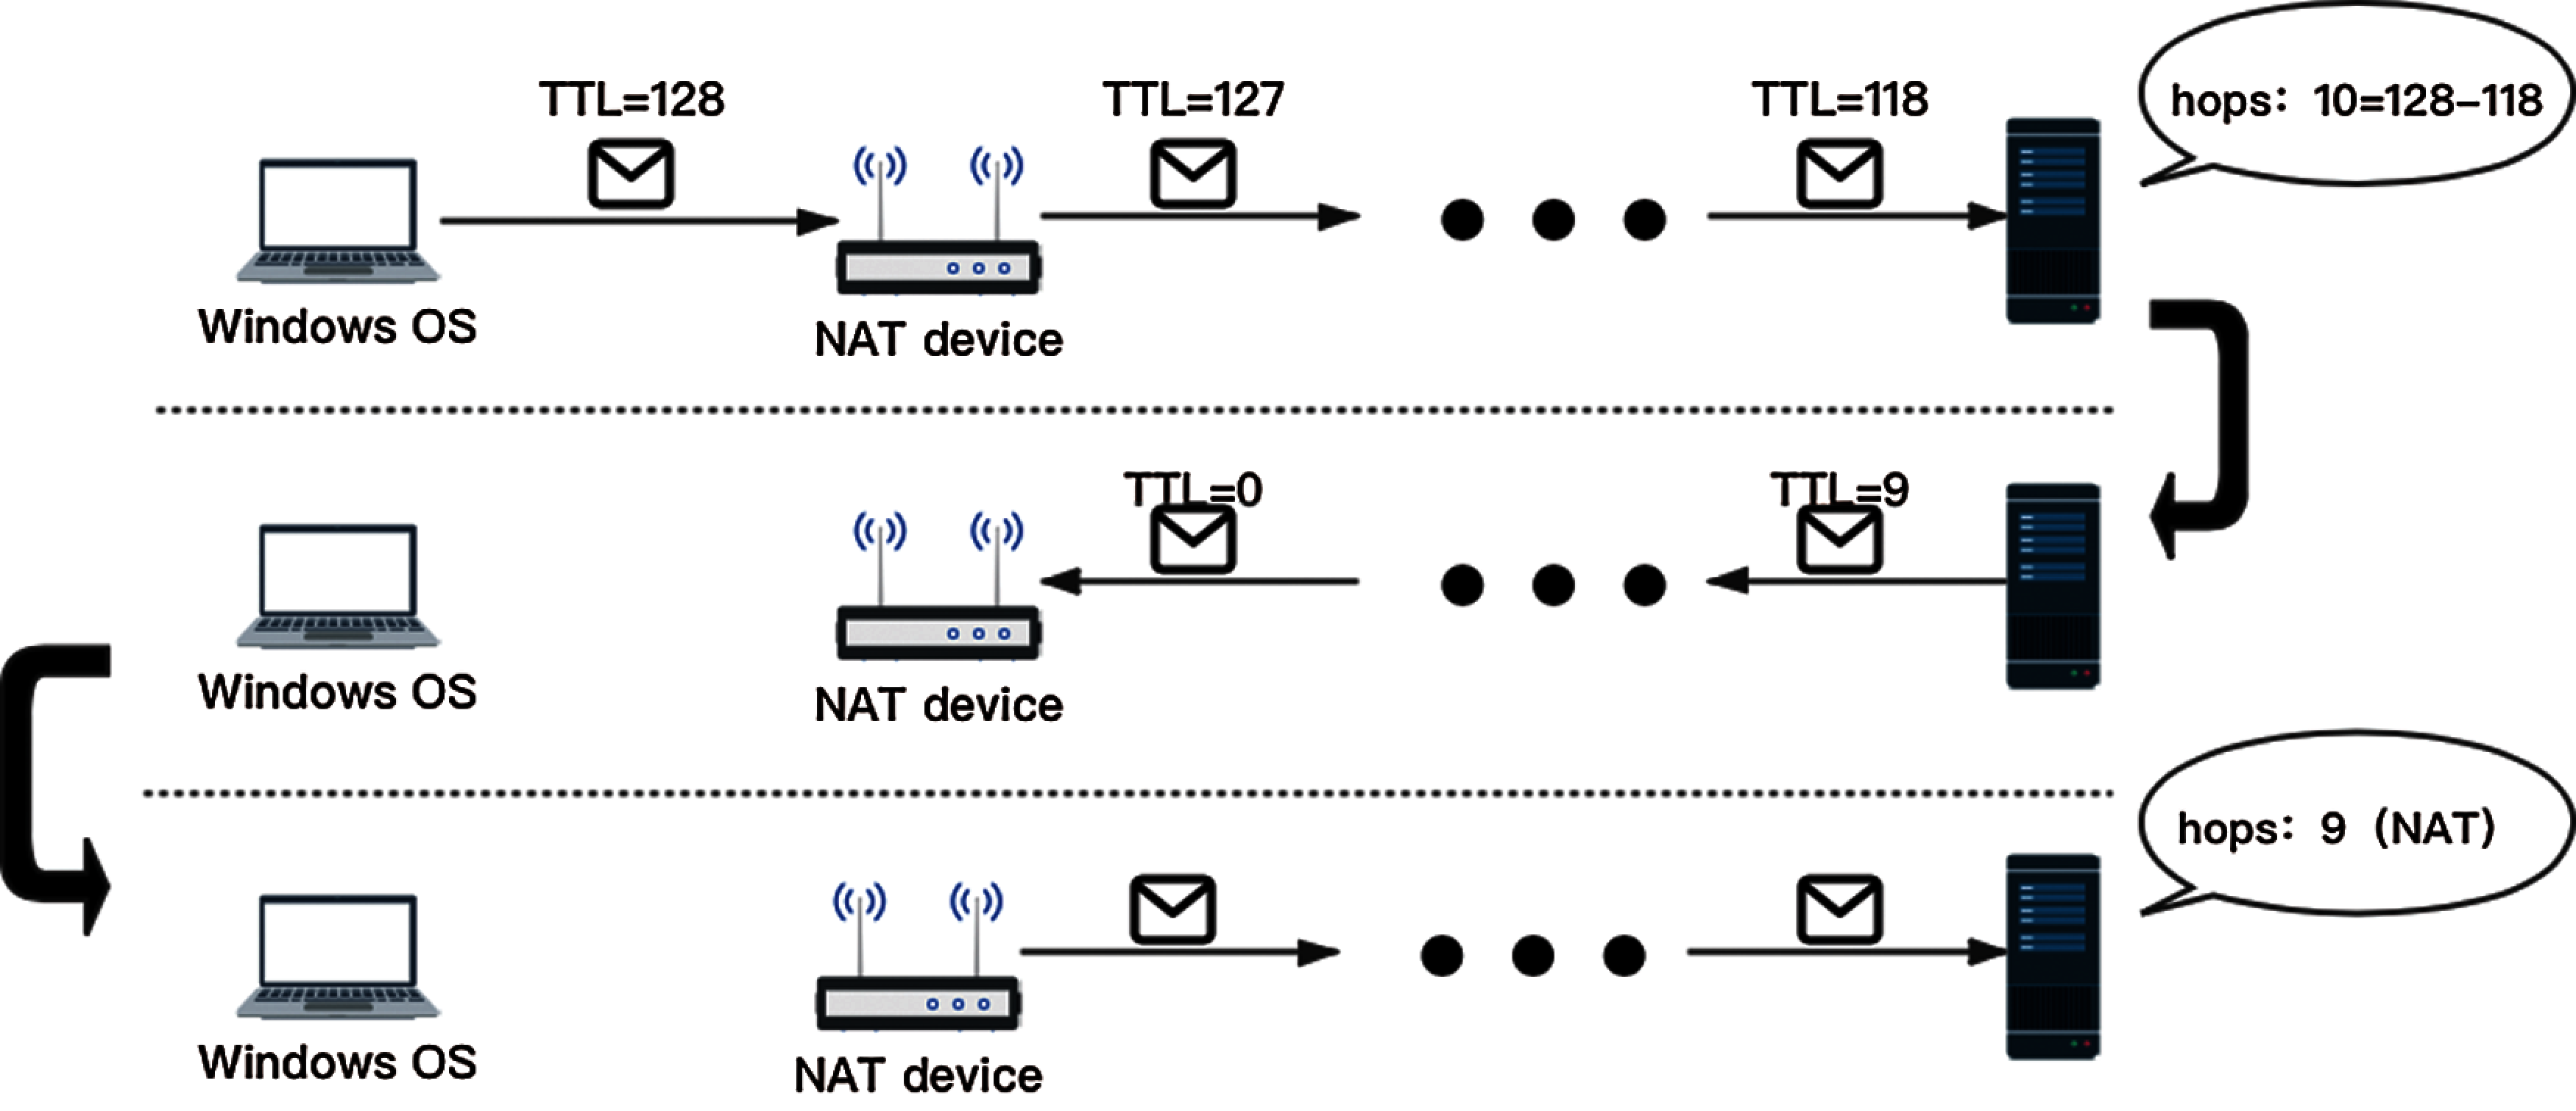
Figure 1: Intuitive NAT identification with ADT algorithm
The initial TTL values of the packets and efficient hop trace are indispensable. There are methods for obtaining the initial TTL of the target hosts, such as OS fingerprint from the Nmap tool [23]. However, long time-consuming, and huge probing traffic of OS fingerprint is intolerable for large-scale networks. To address these challenges, we directly infer the initial TTL of packets which is closest to the reversed TTL + 32 according to the observations on initial TTL value of different OS in 2.1.
To further reduce bandwidth usage, the TTL values of probes are initially set to difference between initial TTL and reserved TTL and actively decrement instead of naively increasing. Suppose a host is 10 hops away from the measurement server, most small TTL (e.g., 1, 2, 3) probes are unnecessary and will get the Time−Exceeded replies [16].
3.2 Design for an Efficient Implementation
There are several mechanisms of the NAT traffic analyzer for the flexible and efficient identification: 1) parallel transmission. To avoid blocking and deadlock, the analyzer directly processes link-layer frames rather than network sockets. 2) stateless probes. As shown in Fig. 3, intermediate information will be kept both in ICMP options and payload and only probe replies are handled. 3) measuring reuse. Already stored results can infer the old stream packets due to hosts are fixed in one stream. 4) data approximation. We improve the counting efficiency by using a new sketch structure for data approximation and reduce the storage costs in the meantime.
As one of the most used Internet protocols, ICMP itself can carry a large amount of routing and terminal information as the probing protocol. We can even set the options in the ICMP packets to achieve our measurement purpose. Thus, when it sniffs packets from the targeted network, the analyzer runs as follows:
(1) After the Sniffer, Filter, Classifier in Fig. 2, all the packets will be divided into new stream packets, old stream packets and replying probe ICMP packets to exploit measuring reuse. The old stream packets and ICMP packets are handled by the OutputHandler (i.e., Bi-sketch) in 3.2.4. The information of new stream packets, such as TTL and IP addresses, is used to create ICMP probes.
(2) In the Generation module, the destination address of the ICMP probe is set to the source address of the new stream packet. Then, the probes are created based on ADT algorithm and handled by the next step.
(3) The Transmission will send the ICMP probes in parallel. Then the replies of these probes will back to the analyzer and processed as Step (1).
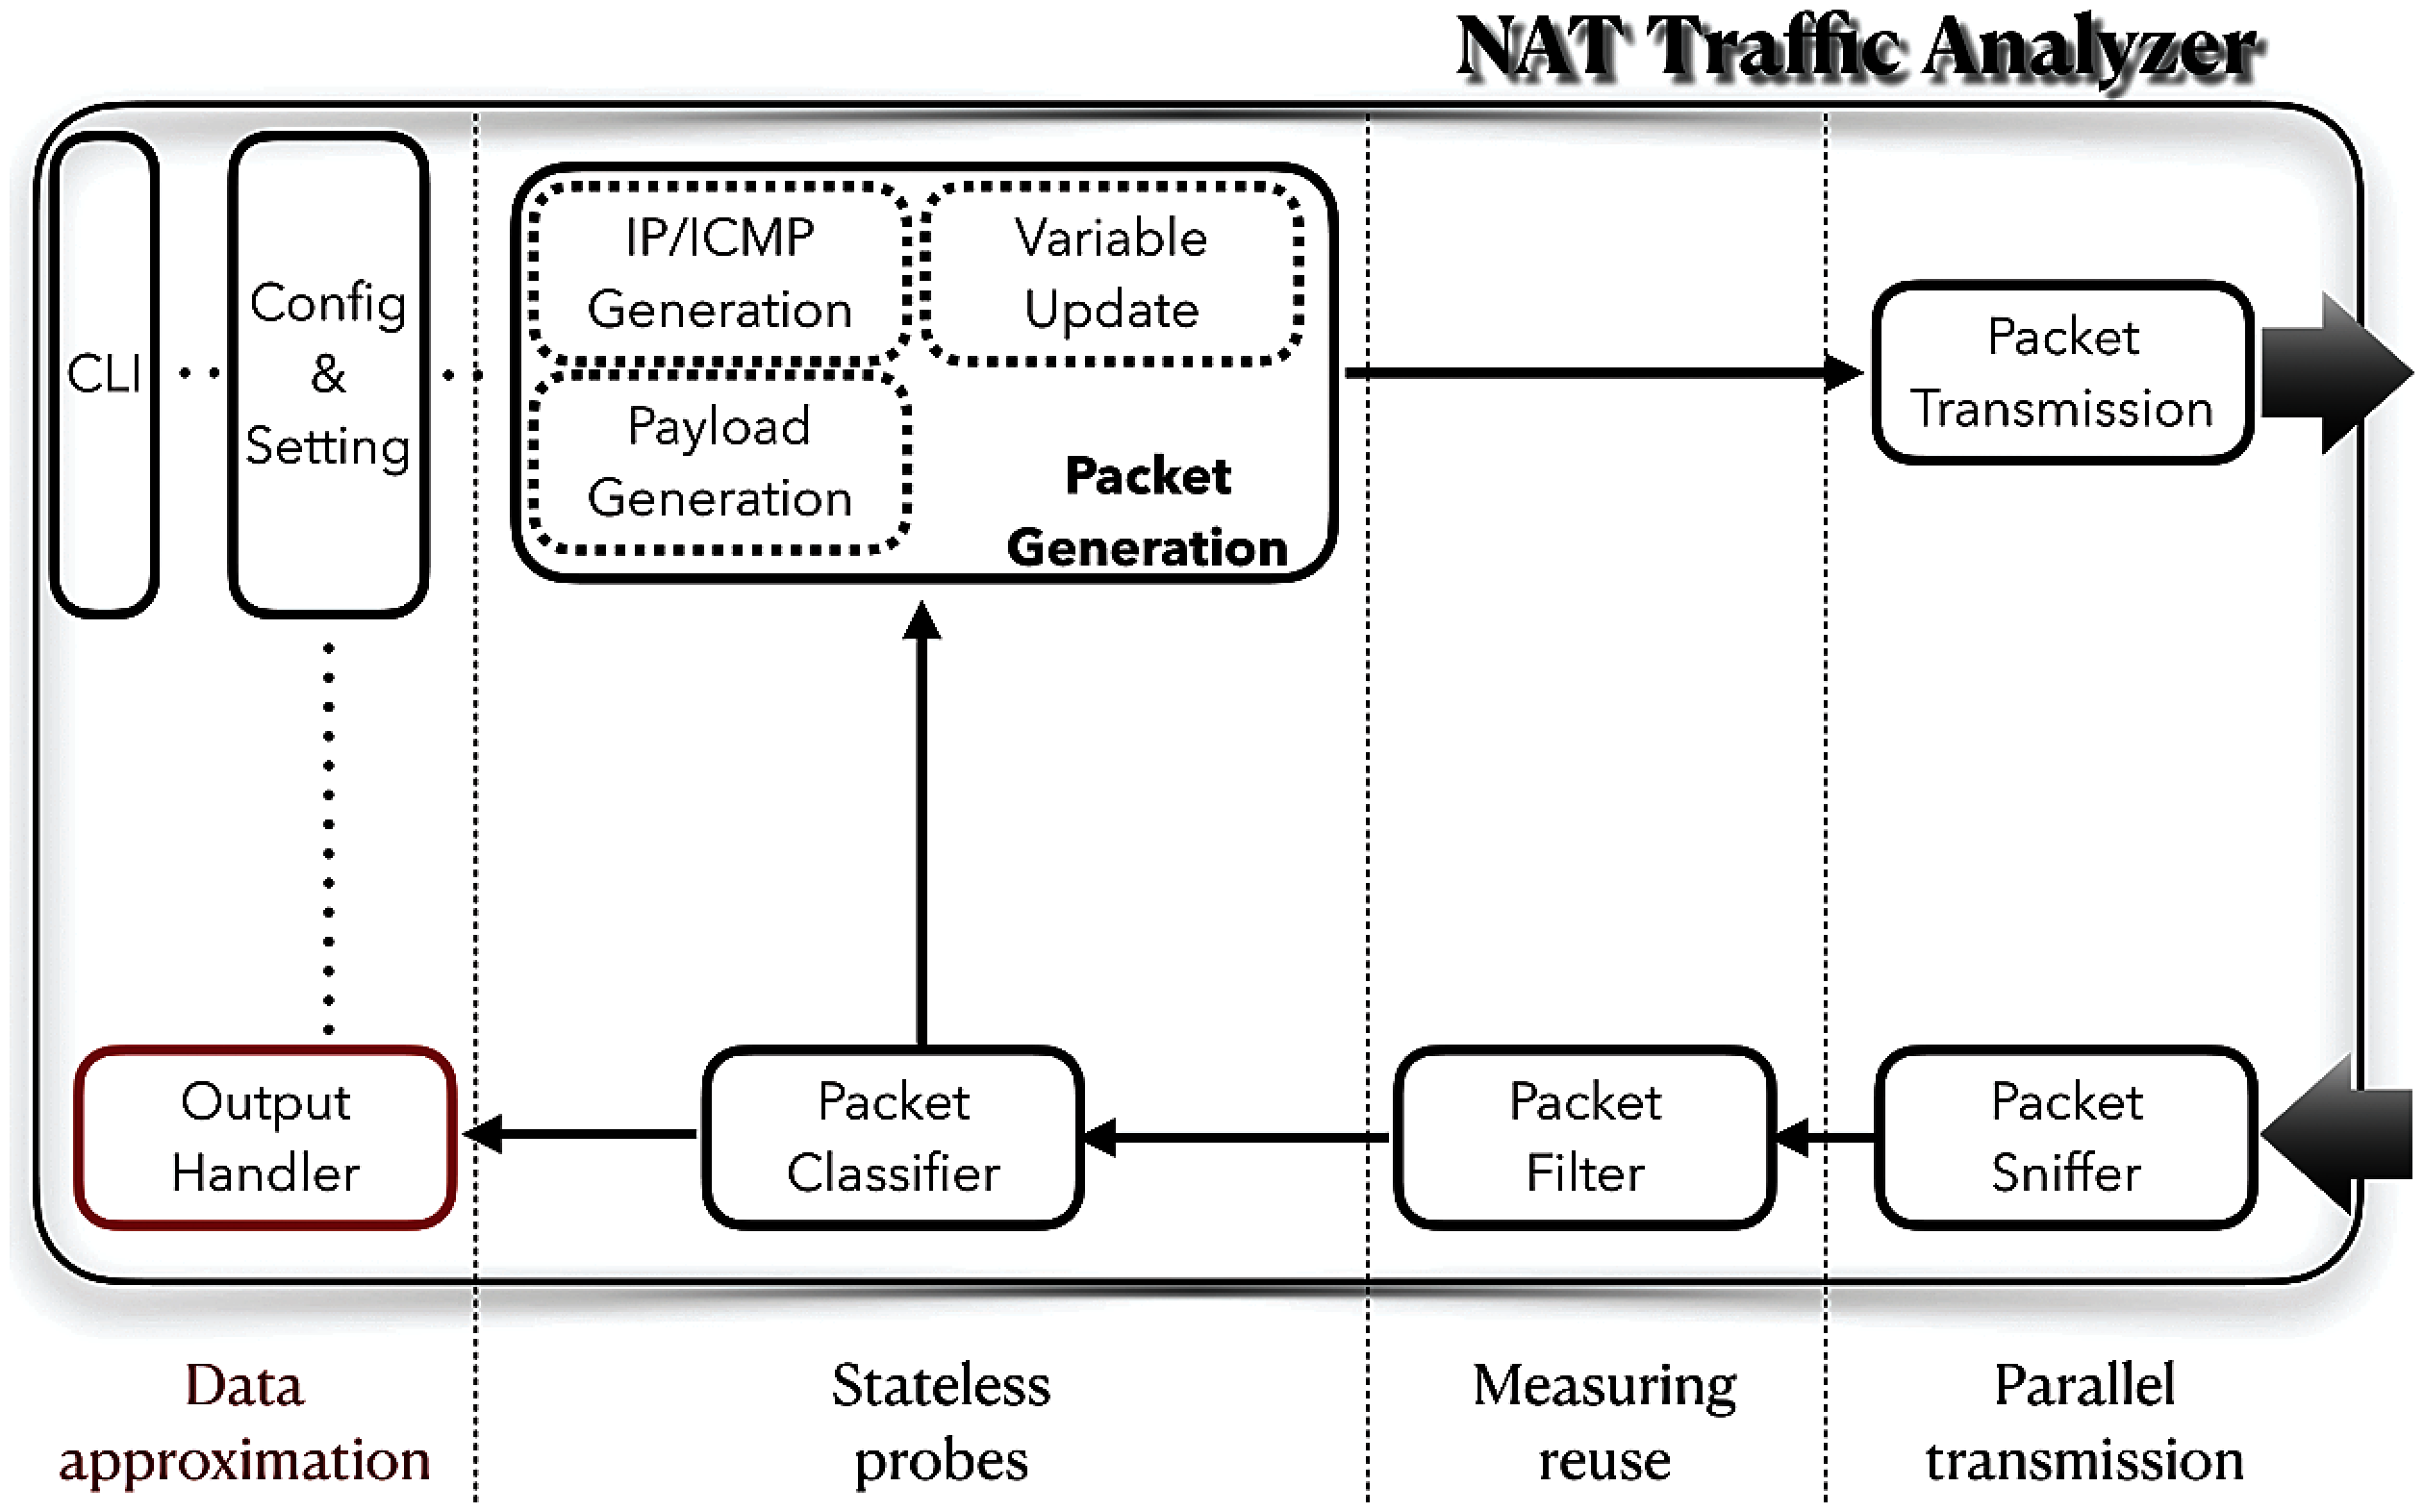
Figure 2: An efficient NAT traffic analyzer
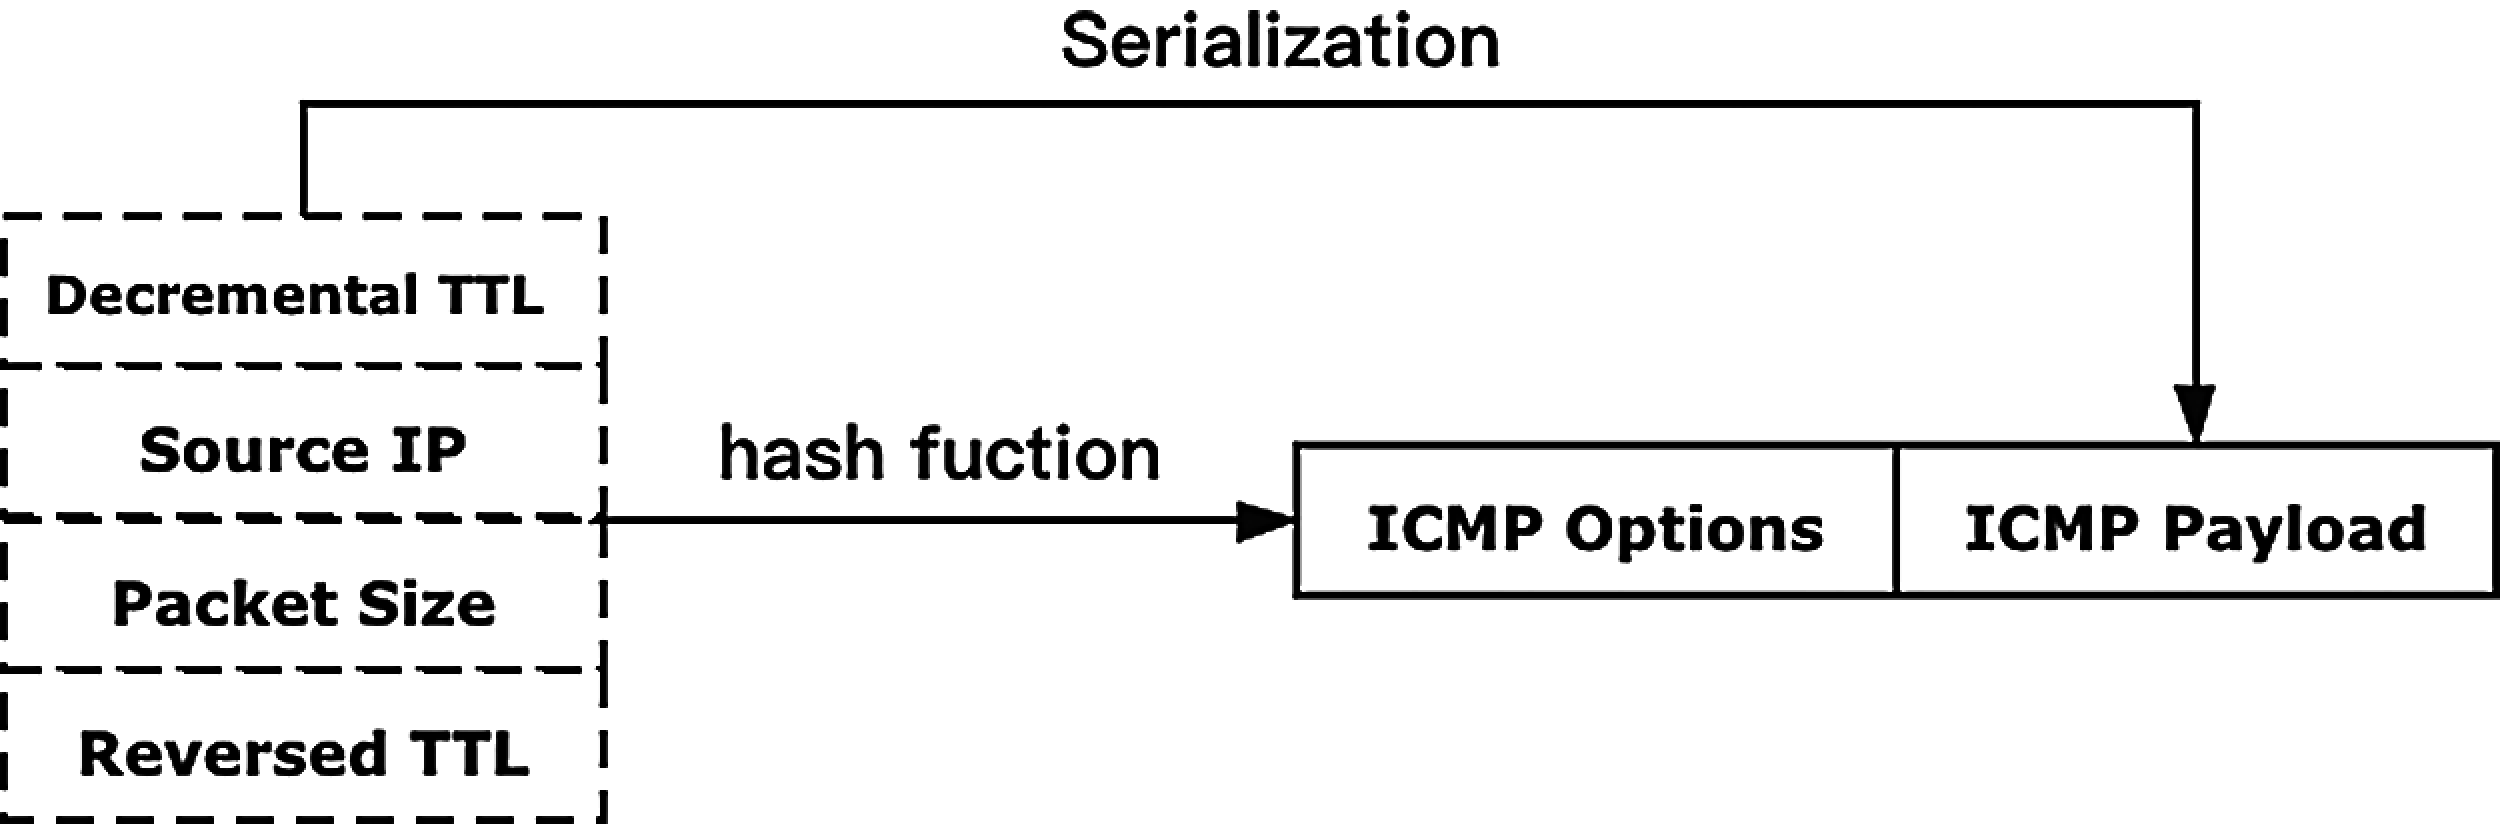
Figure 3: Source IP, size and reversed TTL of the packets are the characteristics of traffic, and the series of probes have the active decremental TTL which are the intermediate information
Scanning of hosts on the Internet to infer NAT usage inevitably keeps the intermediate states. Local storage of intermediate states will cause a lot of storage and query costs, further reducing efficiency. Thus, the probes keeping the intermediate state, so-called stateless probes, is an intuitive idea. As shown in Fig. 3, the ICMP options and payload both keep the intermediate information to ensure that the replies do not lose it. However, real-world networks are complex and unexpected. We consider the following network anomalies: 1) the routers along the path do not reply to ICMP probes. 2) the probe replies out-of-order arrived at the analyzer. 3) forward and backward path asymmetry. 4) packet loss. For our scheme's robustness, we exploit the previous and next hop replies for inferring the not replying as shown in Fig. 4. Besides, the same TTL multiple probes can be the guarantee of replies. Intuitively, even if the path asymmetry causes the hops differences, multiple replies can be seen as votes for the most common hops to reduce the errors.
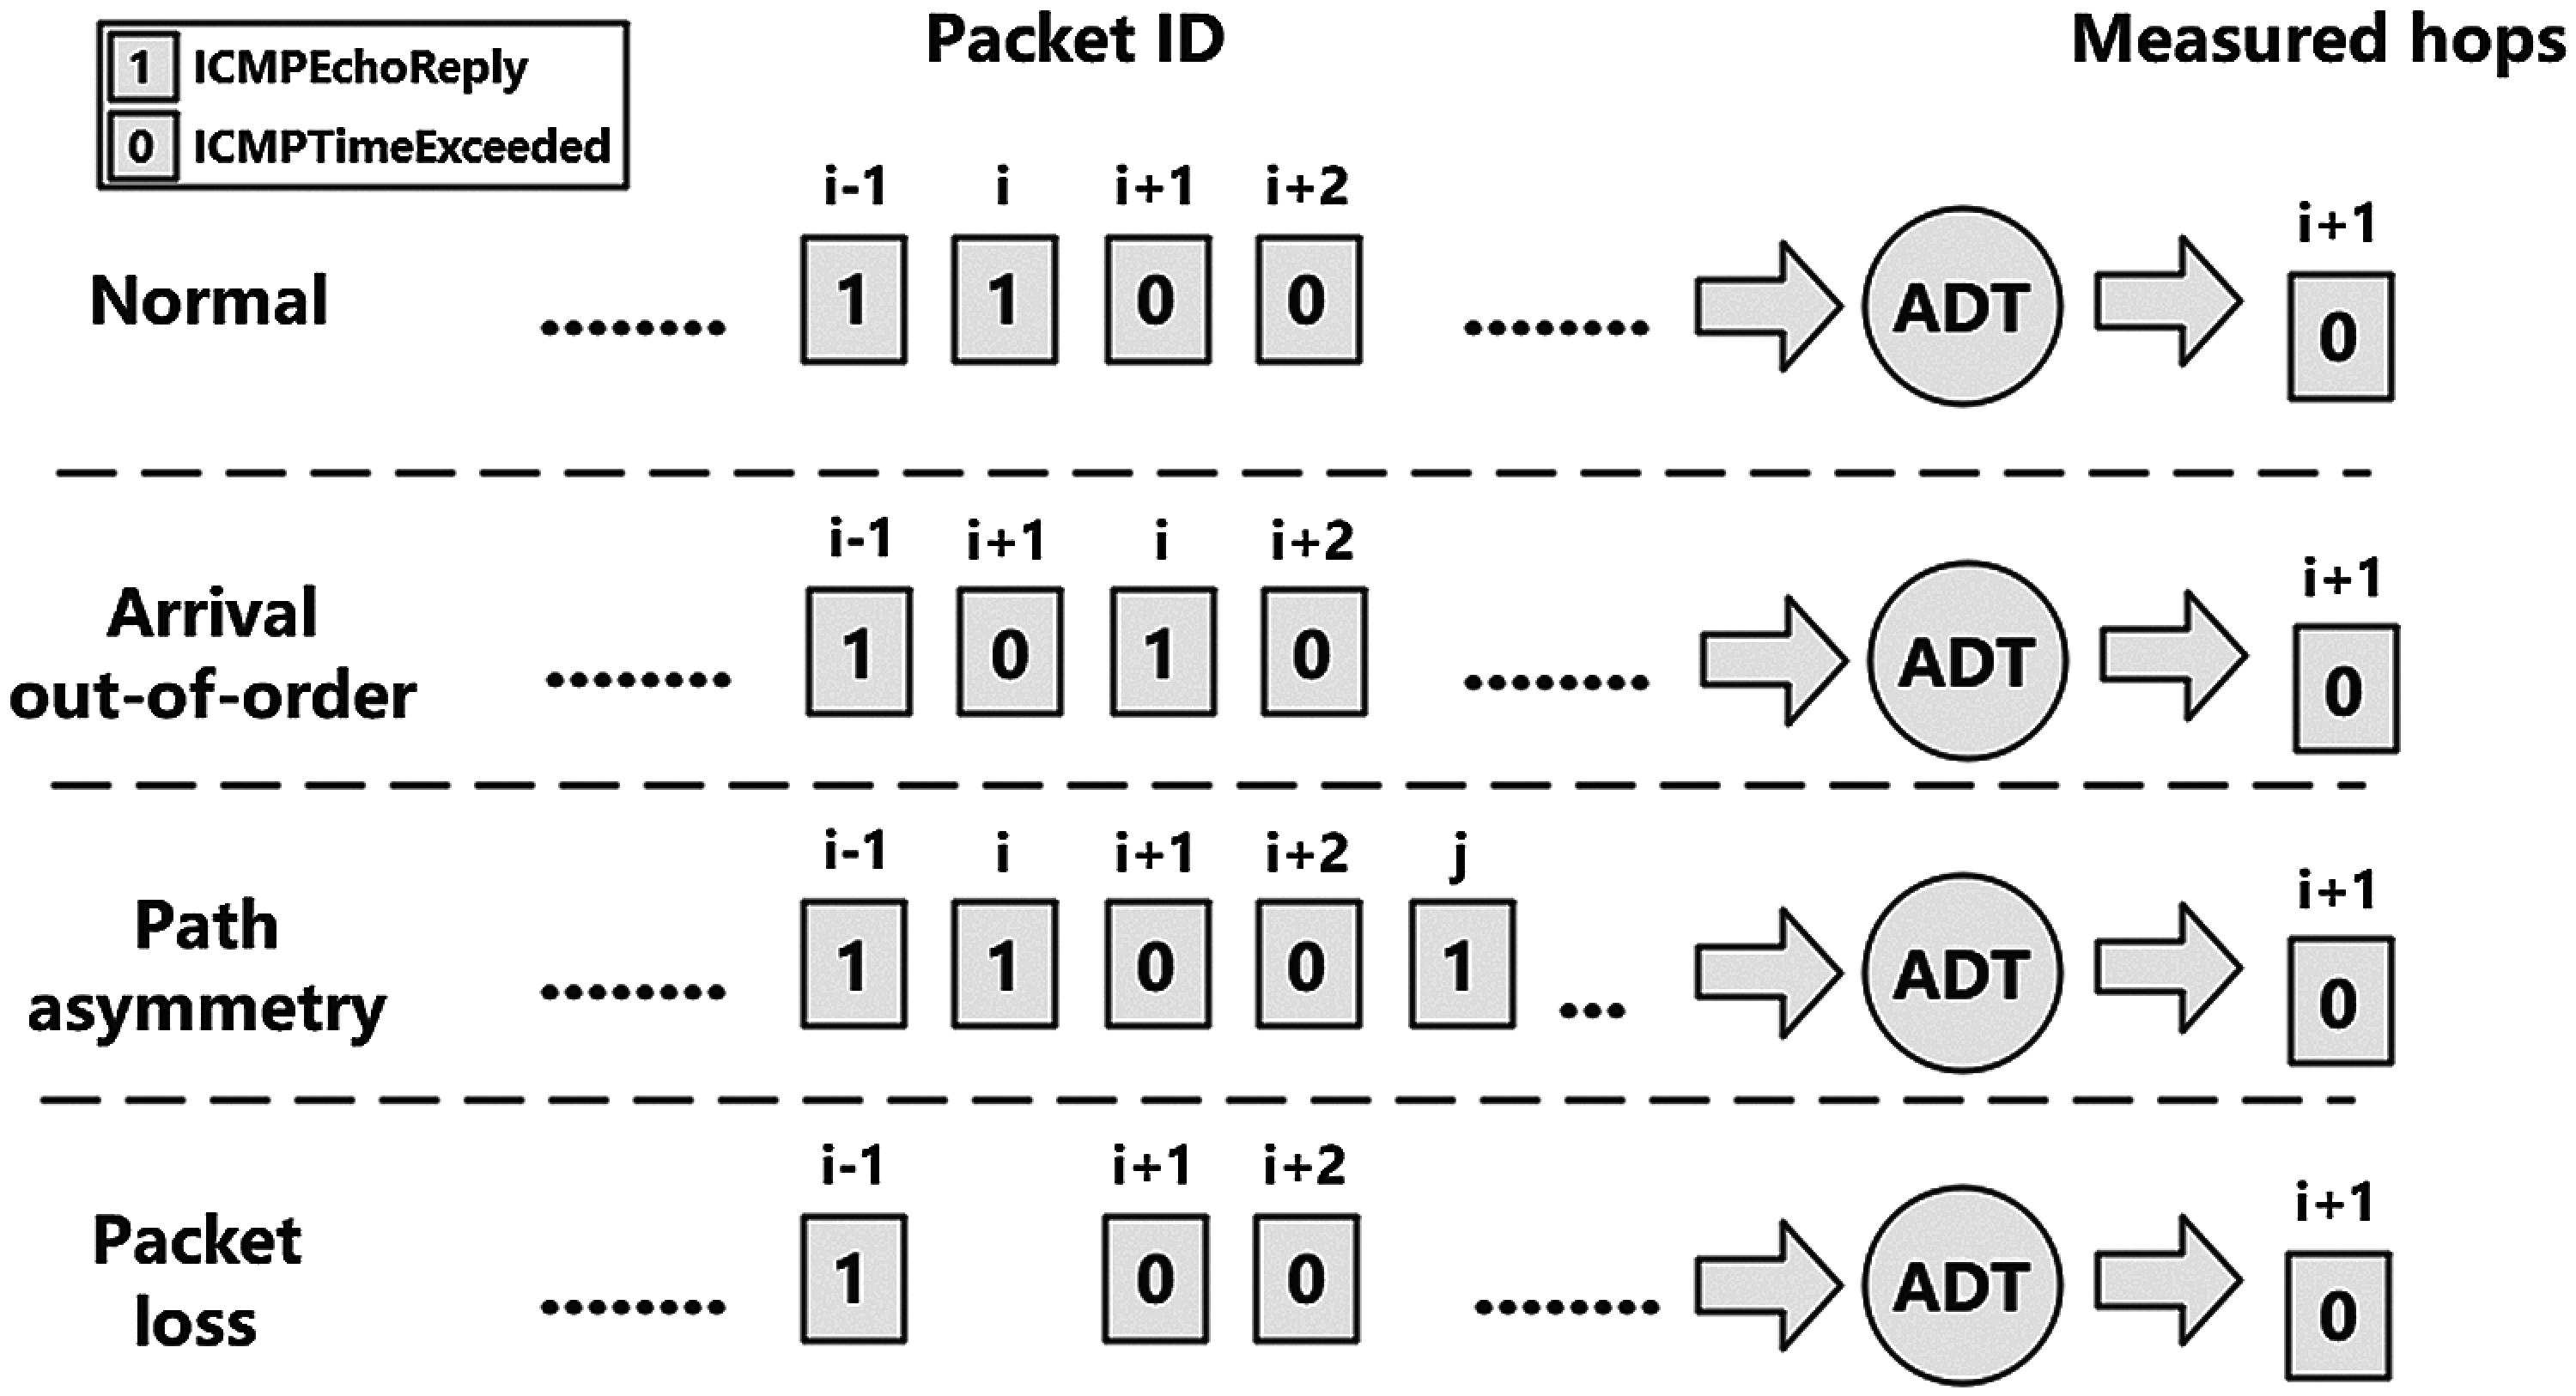
Figure 4: The network anomalies and the ADT algorithm's countermeasures
We cannot deny that the errors caused by network anomalies cannot be completely eliminated. Thus, we further describe the errors in 5.2, and we experimentally characterize the analyzer's performance in 5. Additionally, there are also some decent works [24,25] for network optimization to reduce network anomalies which will support our methods.
3.2.3 Flexible Measuring Reuse
In the previous subsections, we introduce the parallel transmission and stateless probe mechanisms of the NAT traffic analyzer. However, is it necessary to analyze every packet of real-time large traffic on the real network and under such high load? A straightforward idea is using the measuring results that are already stored.
Based on the observation that two hosts are fixed in one stream, such as a TCP handshake, we only need to analyze the quintuple, including the source address, the destination address, the source port, the destination port, and the transport layer protocol of the packets to identify a stream as shown in Fig. 5. Therefore, the introduction of the Bloom filter can reduce a lot of meaningless analysis.
Bloom filter [26] is a space-efficient probabilistic data structure, conceived by Burton Howard Bloom in 1970, that is used to test whether an element is a member of a set. Bloom filters use multiple hash functions and a small amount of storage space to analyze large amounts of data. Because the cost of the hash function is low, and all data can be stored in RAM, even in the Cache, the Bloom filter can reduce numerous unnecessary operations without additional performance loss.
Inevitably, the false positive rate of the Bloom filter will increase as the number of packets increases. A reasonable method is to refresh the bloom filter at certain intervals. According to the formula
However, considering practicality, it is meaningless for network management and network security to only know the types (NAT/non-NAT) of each packet or each stream, and necessary statistical information is the real demand. Naively, directly storing the identification results will result in a lot of query costs. For example, assuming the types (NAT/non-NAT) of n streams have been identified and the new results of m packets have arrived, the cost of querying and storing to the corresponding streams will be
To address the statistics challenge of real-time large traffic, we propose the Bi-Sketch in Fig. 6 based on Count-Min Sketch [13] and MV Sketch [14]. Compared with other traffic sketch algorithms, Bi-Sketch addresses the statistical challenge for counting multi-type real-time data streams The data approximation is presented in Fig. 7. First, like Count-Min Sketch, all packets will be mapped to the bucket through r hash functions in Bi-sketch and the sizes will be added to the corresponding
Given parameters
In fact, it is non-trivial, if not impossible, to attain the ground truth of NAT label for large-scale network traffic as it requires intensive involvements of the target (source of the traffic) for manual annotation. This further highlights the necessity of an effective measurement technique. To overcome the lack of ground truth for evaluation purposes, we implement a relatively light-weight prototype for demonstration purposes by building a server for centralized traffic analysis and recruiting distributed mobile terminals as end devices. The workflow is shown in Fig. 8.
To attain traffic type ground truth, we design an annotation module for the participated devices to detect and report. Specifically, we refer to the Session Traversal Utilities for NAT (STUN) protocol [27], which can differentiate address translation types (e.g., Open Internet, Cone, Symmetric, UDP Blocked), to classify NAT traffic.
Based on STUN, we can acquire whether the mobile terminal is on the Open Internet (non-NAT) or in other types (NAT) when it accesses the public STUN server. Note that merely obtaining the traffic type is not enough, meanwhile, we also require the hops of the end devices to the NAT gateways to evaluate the identification precision. For this, a terminal first obtains its public IP address by accessing some domain names. Then, existing tools, such as traceroute, are used to measure the hops away from the NAT gateway easily.
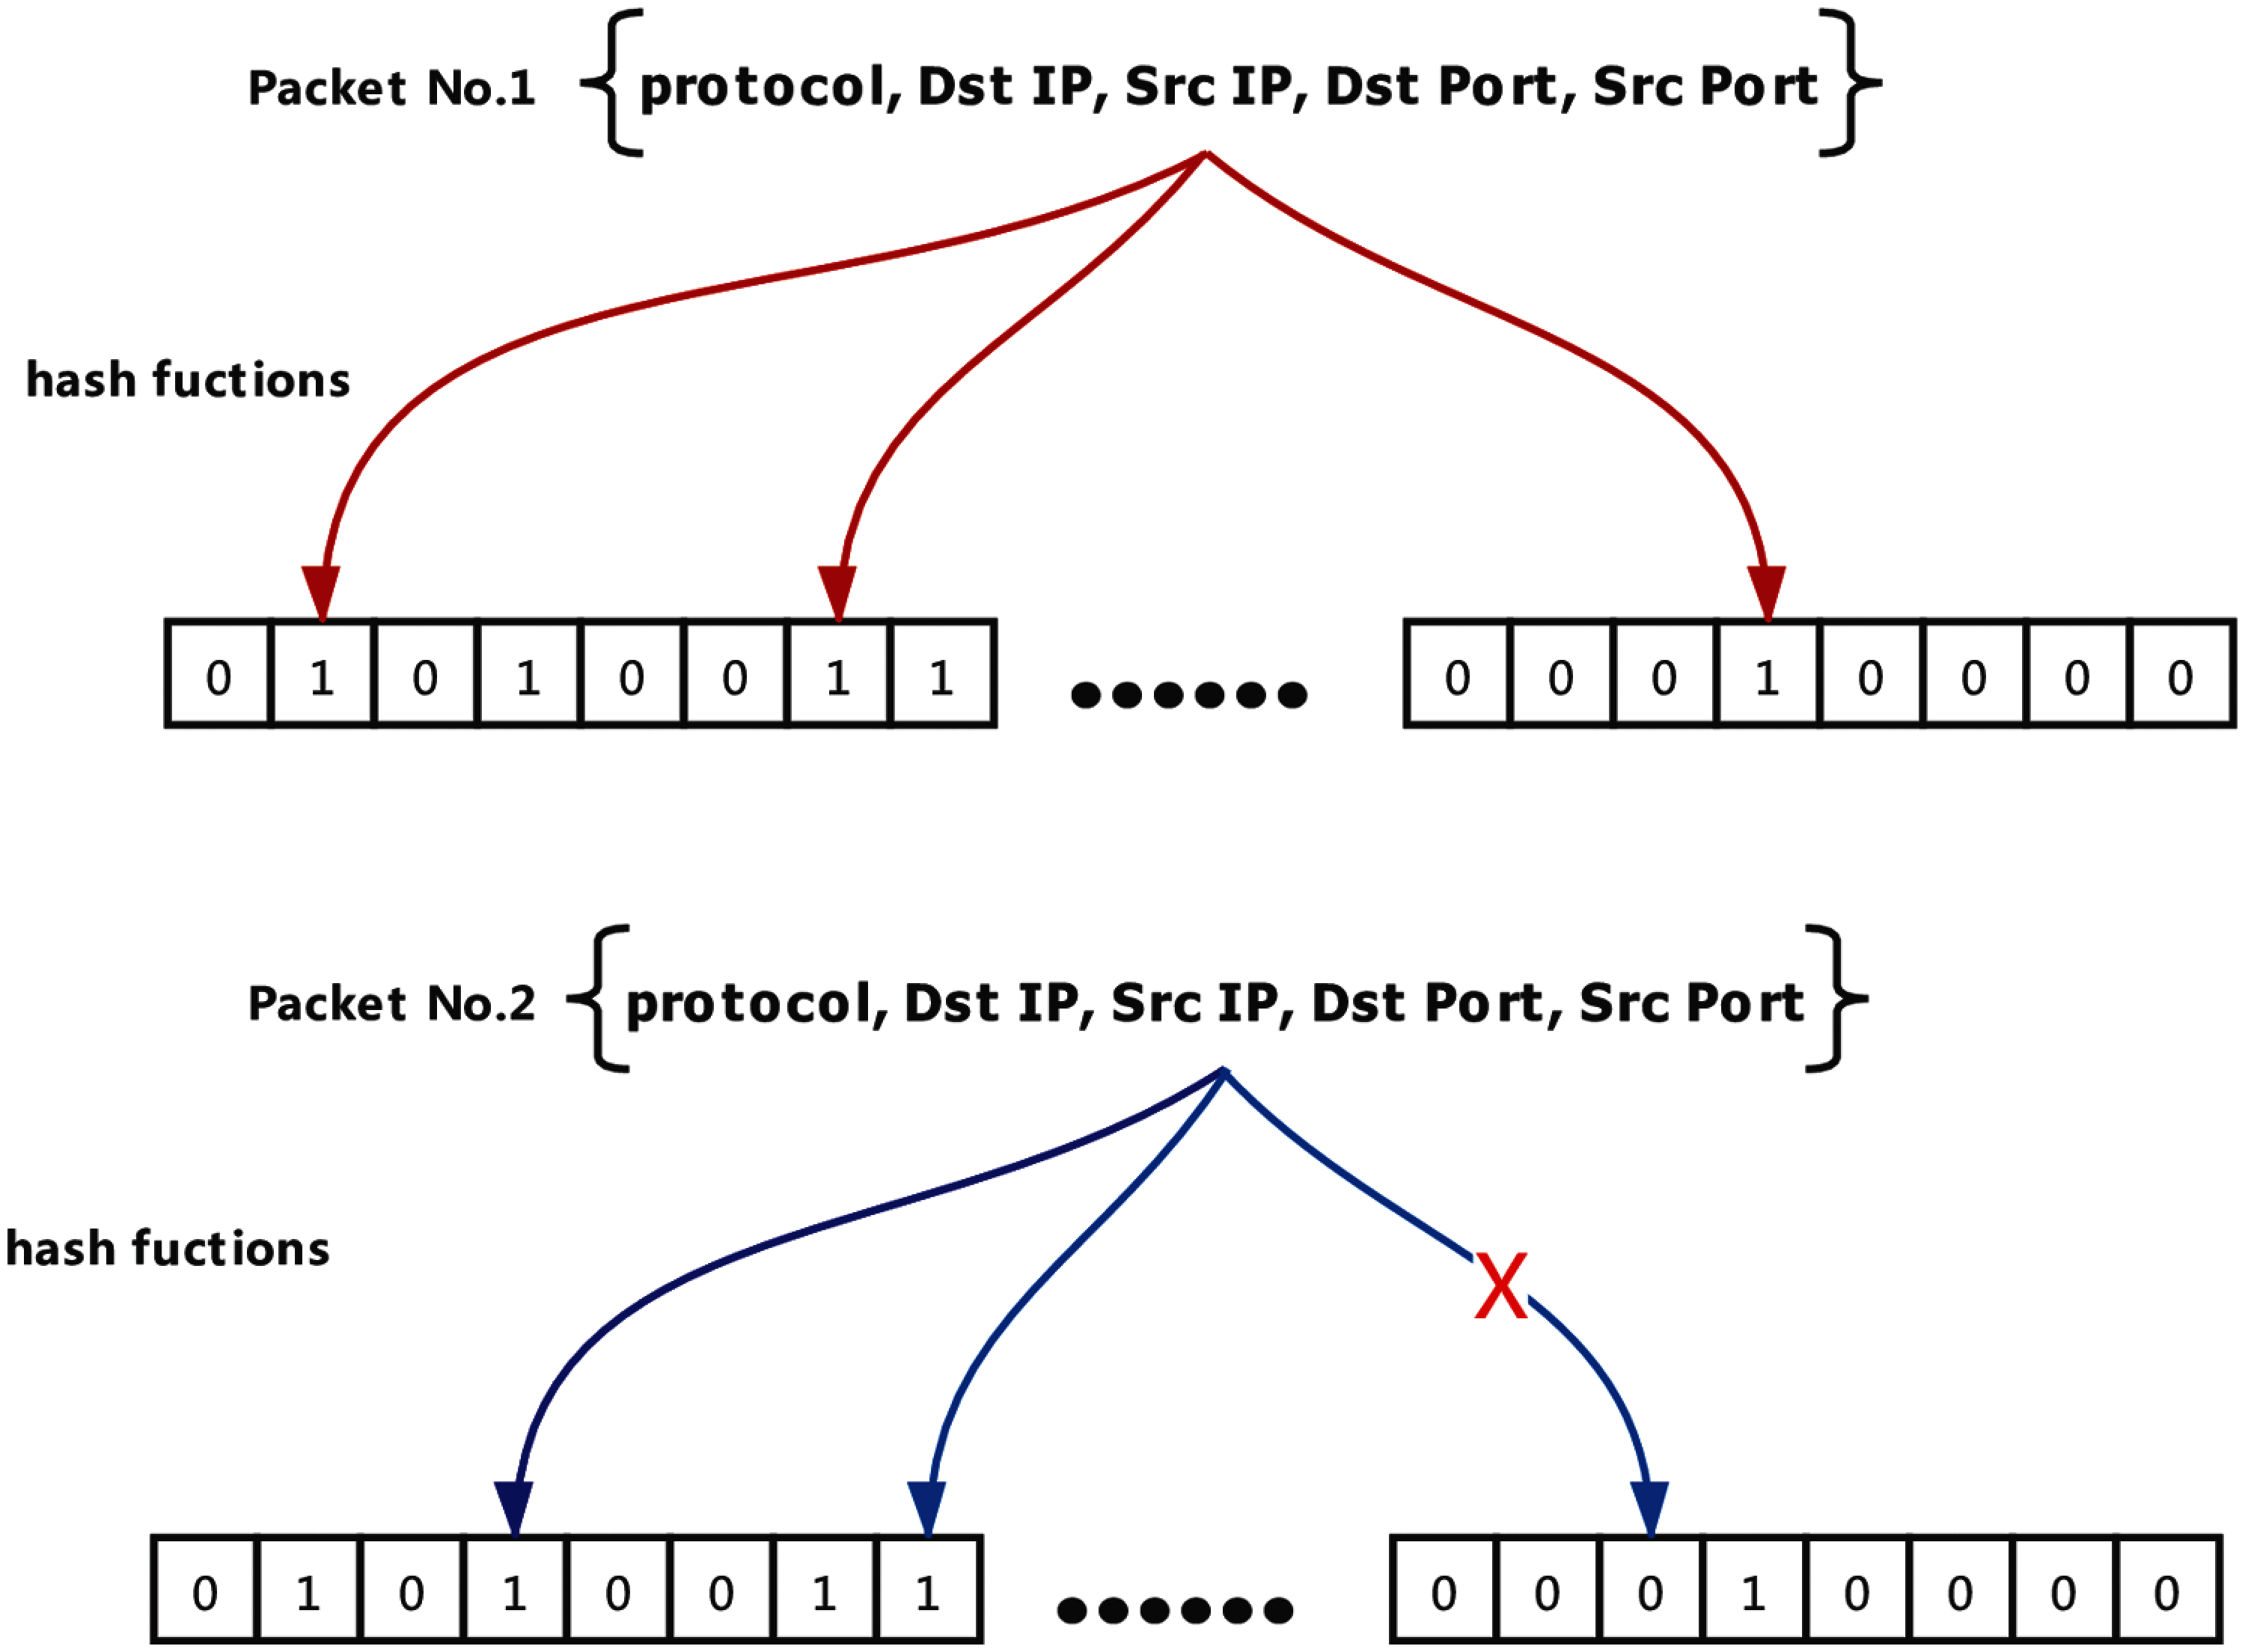
Figure 5: Packet No. 1 passes all the hash function tests, which indicates that one packet of this session may have been detected. Packet No. 2 fails which means that this packet needs to be analyzed
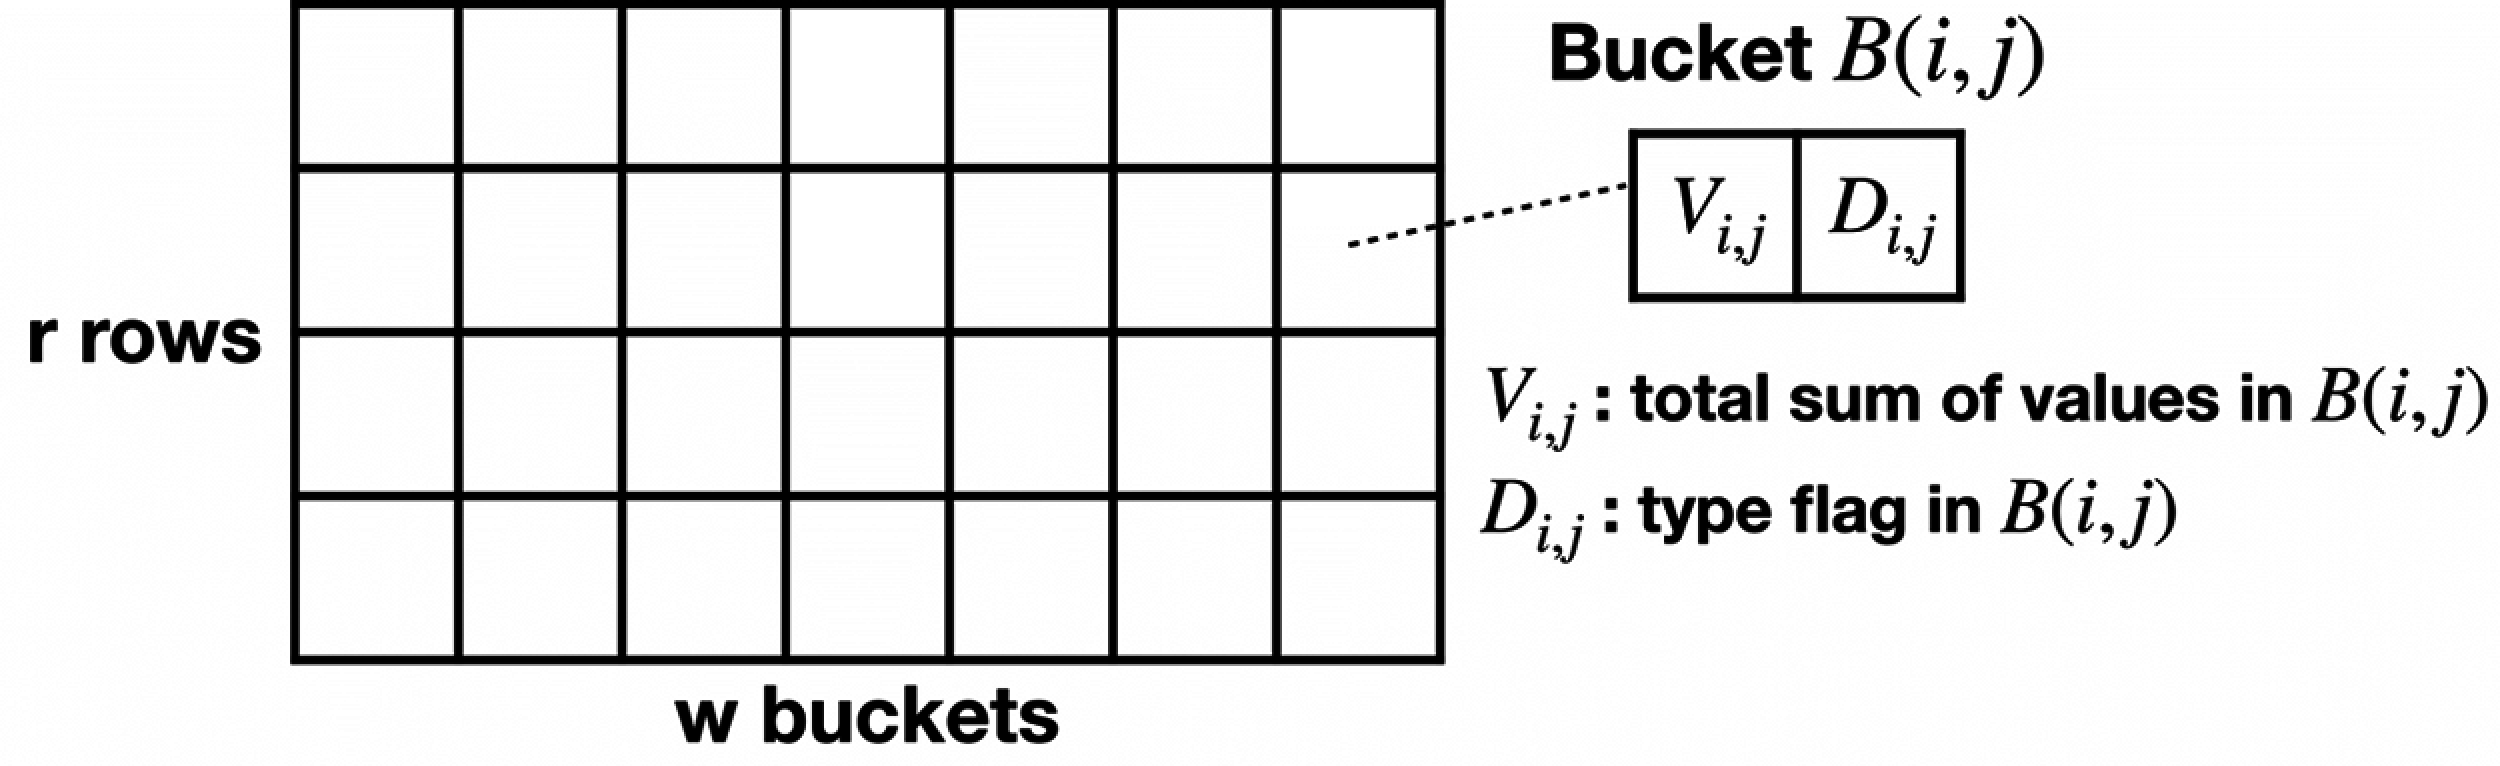
Figure 6: Data structure of Bi-Sketch
The diversity of mobile terminal operating systems, such as iOS and Android, poses new challenges for implementing the client-side prototype during real-world deployment. Obviously, developing dedicated software or plug-ins for each operating system is inflexible. Fortunately, we are aware that most Chinese users have the WeChat, which is known as a social platform/software, installed on their mobile devices [28]. To this end, we propose to deploy the client-side prototype on the WeChat applet. Since the WeChat applet is embedded in the software, no additional downloading or installation is required for the clients. Meanwhile, due to its portability and compatibility, the clients only need to start the measurement and wait for around 10 s to acquire the current network status. Finally, the collected data will be uploaded to and aggregated in the centralized server.
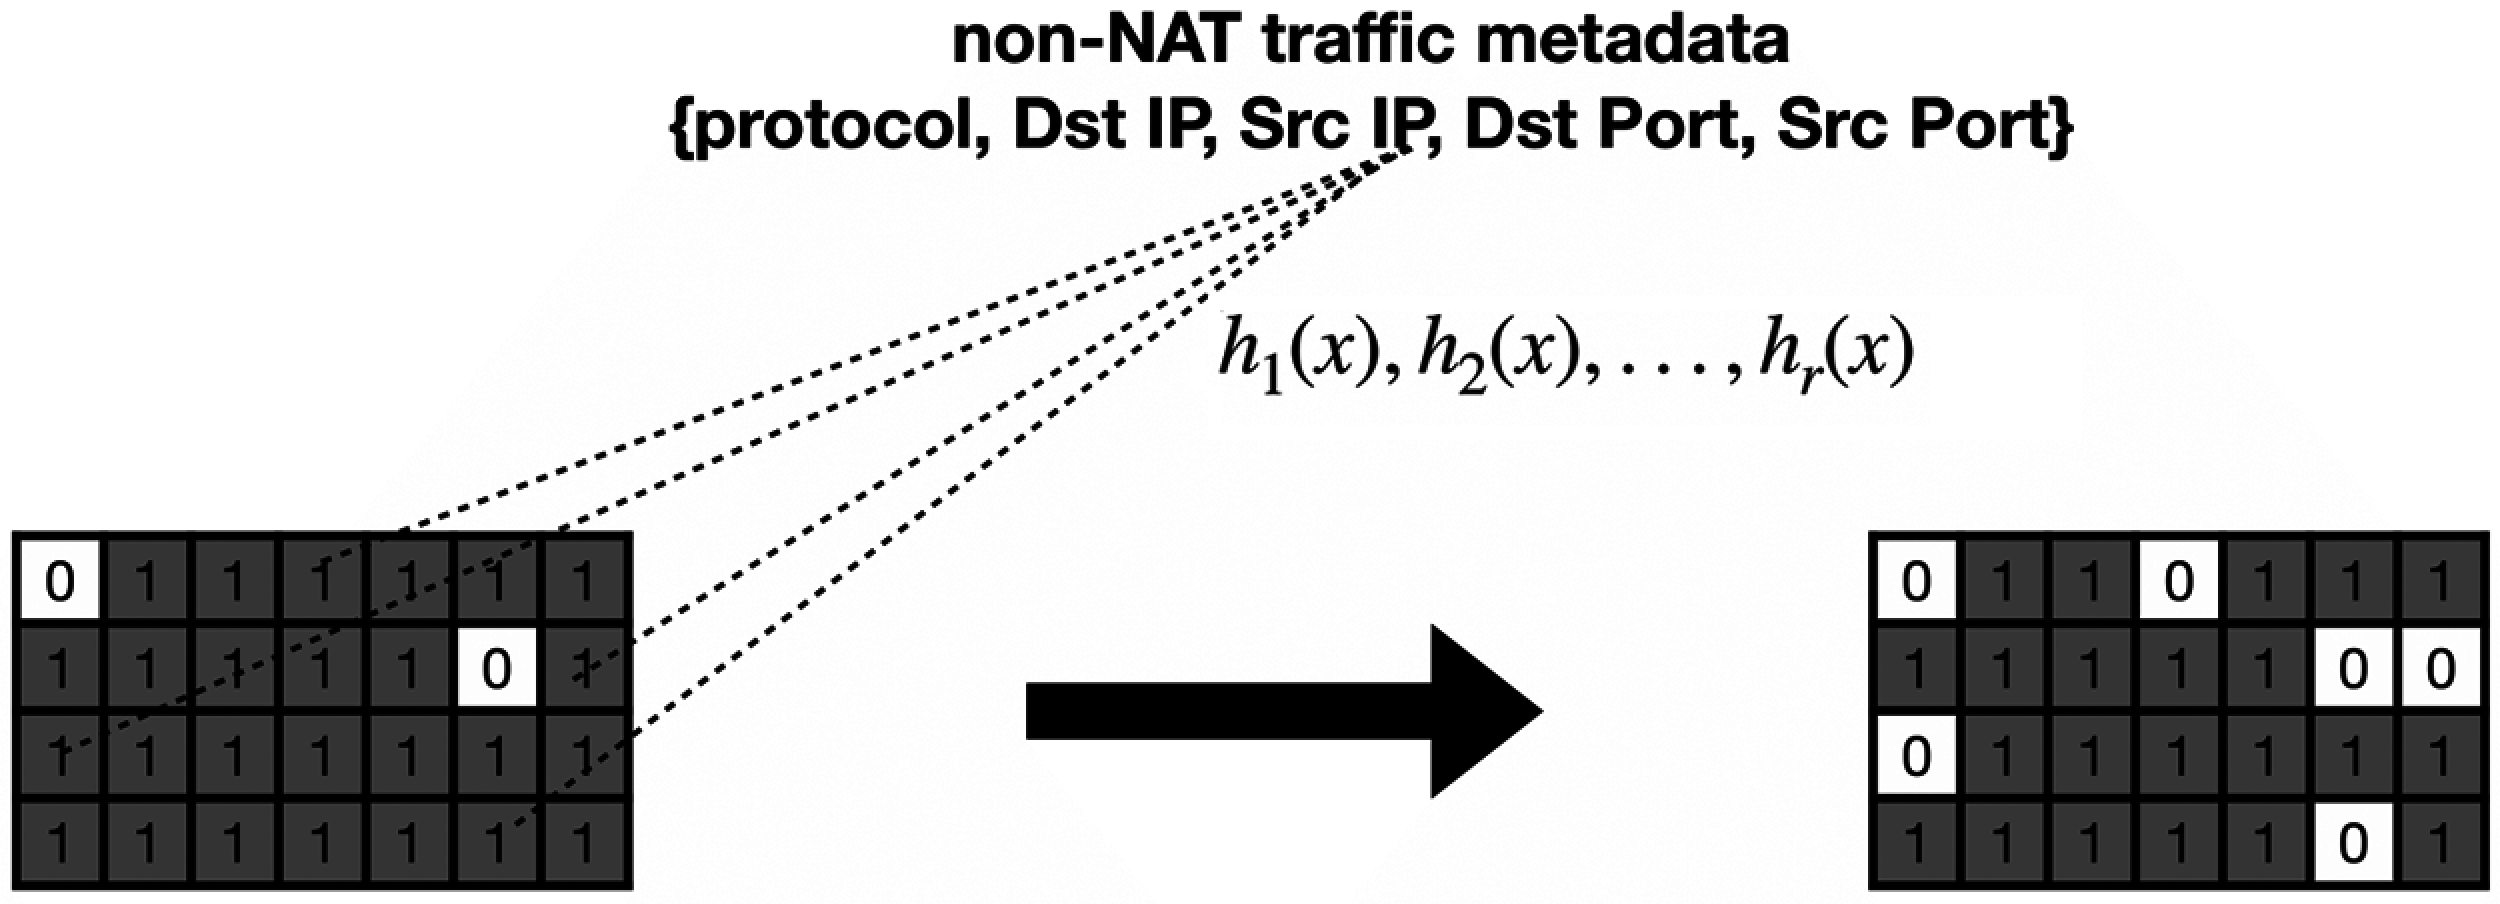
Figure 7: The revision of
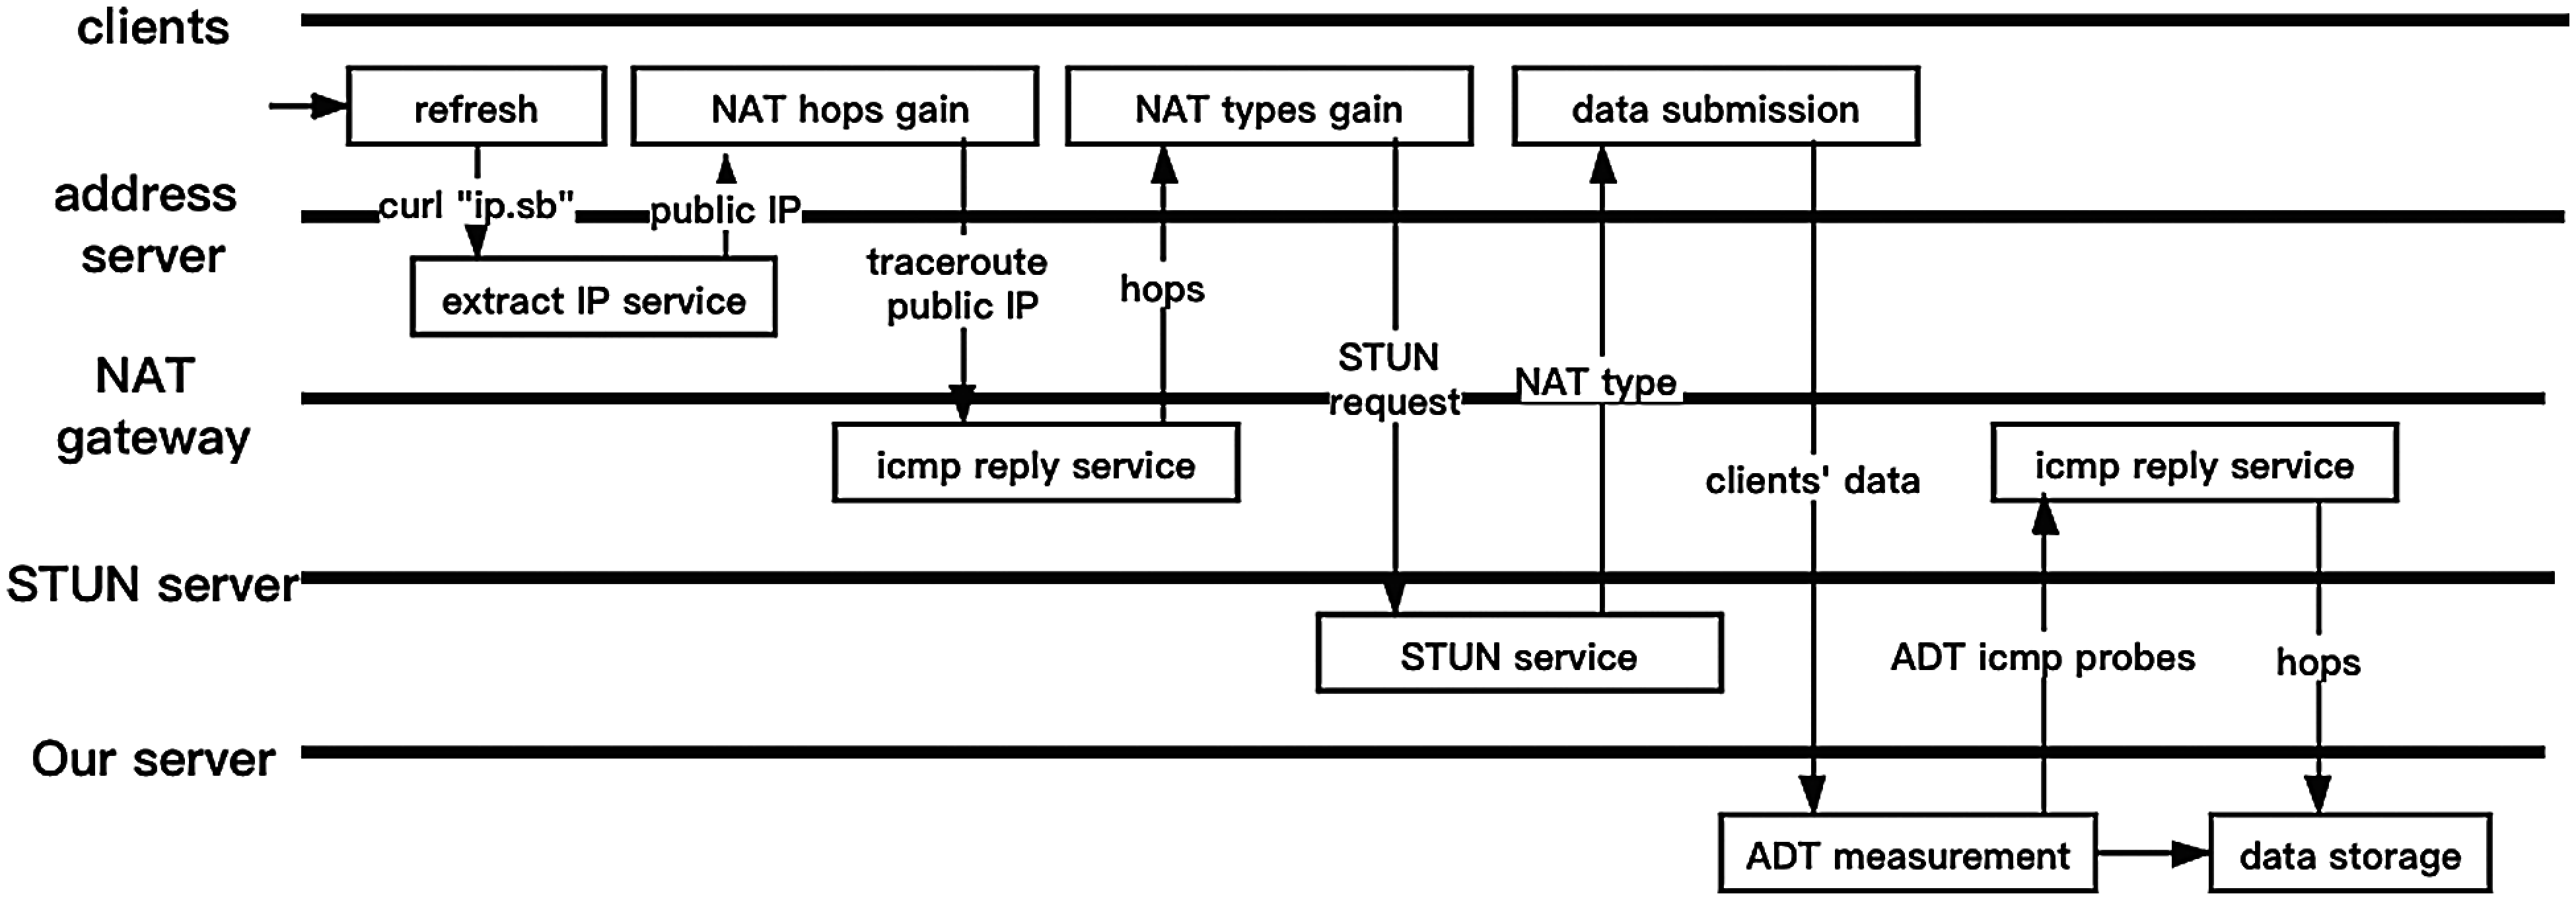
Figure 8: Workflow of NAT identification prototype
We recruit 1000 volunteers from 31 provinces in China for traffic data annotation. The geo-distribution of their devices and the corresponding traffic types (w.r.t., STUN) are depicted in Fig. 9. Again, we emphasize that this relatively small-scale deployment is for the purpose of ground truth collection, which is not applied on real backbone networks directly.
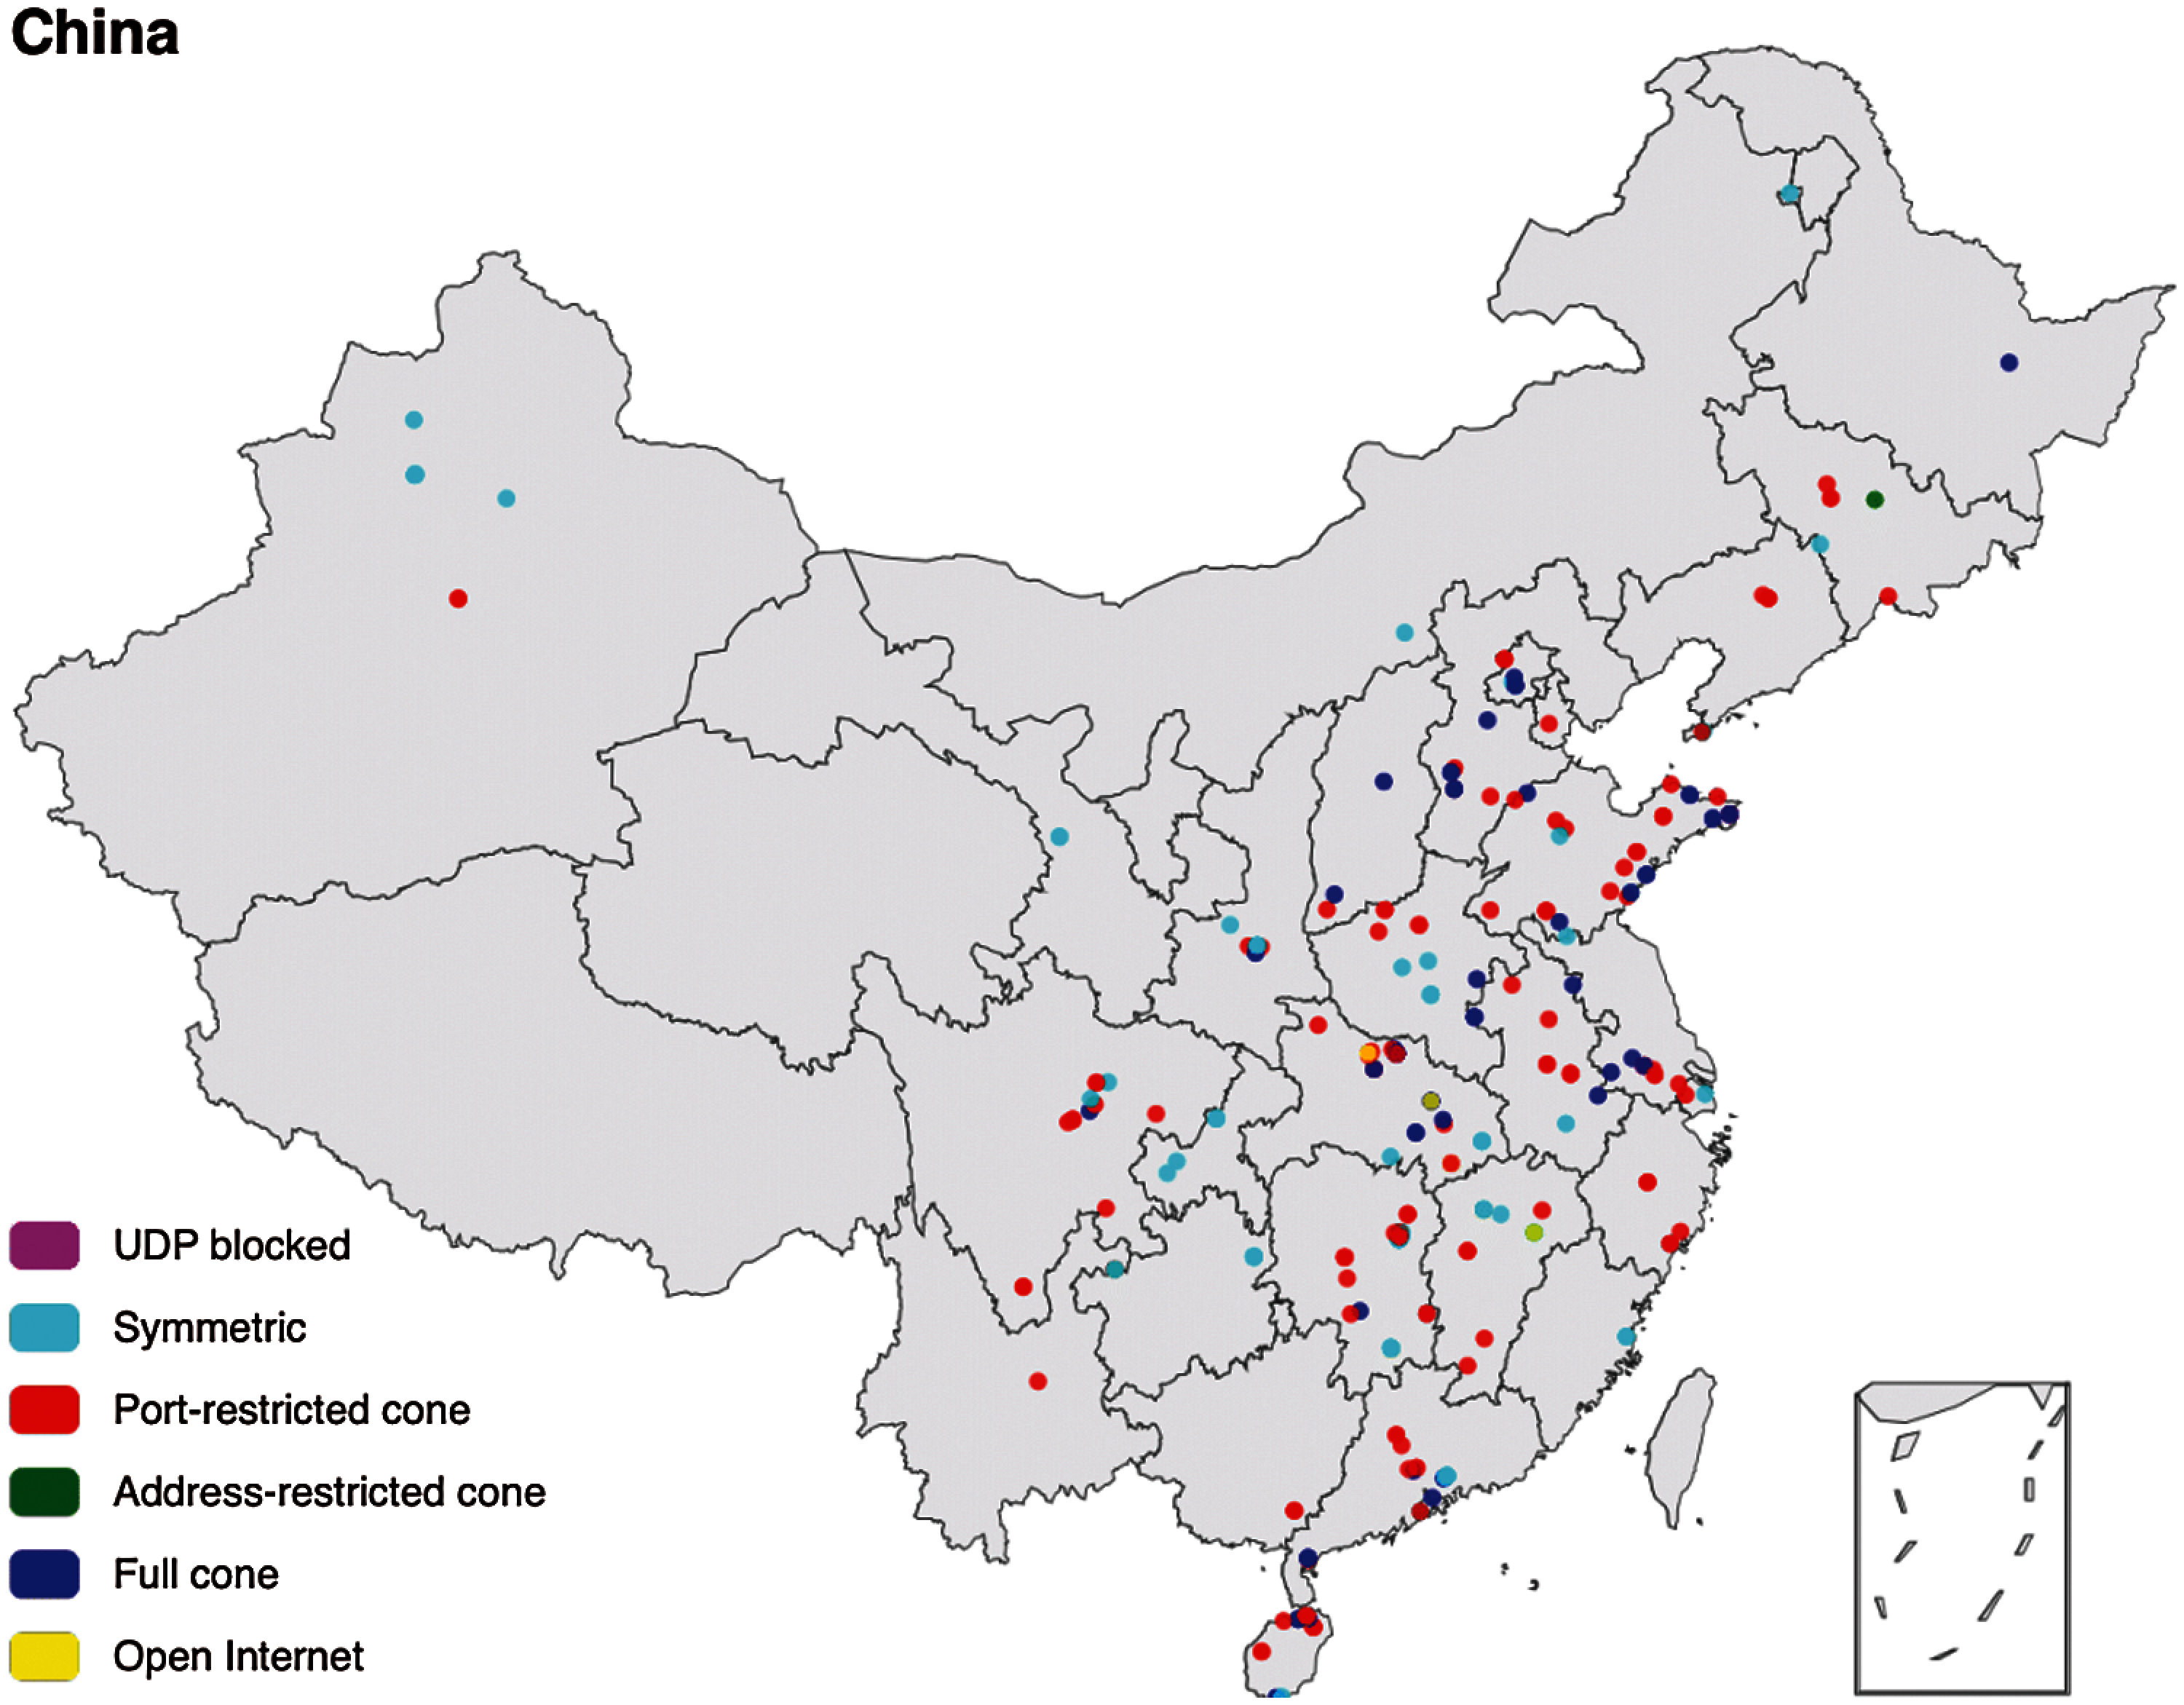
Figure 9: Volunteers from all over china were invited to participate in evaluation
Recall that our scheme is designed for flexible and efficient NAT identification. To test the effectiveness and performance, we use precision and recall for qualifying identification accuracy and use the throughput of handling incoming traffic for gauging its efficiency.
Only several ICMP probes are enough in our scheme [29,30], the number of which is related to the hops between the end hosts and NAT gateways. Besides, the probes are sent in parallel, and the extra transmission overhead is small. Therefore, the scheme delay will not be evaluated separately.
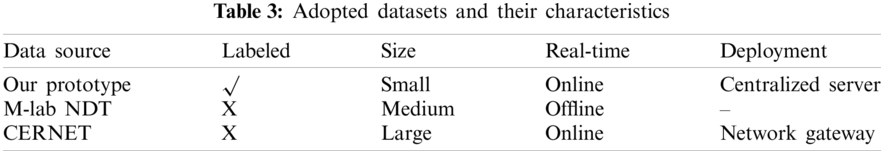
By jointly considering the requirements of evaluating different performance aspects, we conduct experiments based on three sources of data (as shown in Tab. 3). On one hand, since estimating identification accuracy needs the ground truth regarding the NAT type and online measuring, we use the collected data of our prototype for this purpose. On the other hand, an appropriate efficiency test should be provided with sufficient and controllable traffic, so we introduce the M-lab NDT [8,31] to support extensive simulations. The NDT dataset is a single stream performance measurement of a connection's capacity and reports uploading/downloading speeds. Finally, we attempt to observe the effectiveness via deploying our scheme on a large-scale network. For this part, we collect the results of NAT identification at a Border Gateway of CERNET in Jiangsu Province. Wherein, both IPv4 and IPv6 traffic are analyzed.
Considering the difficulty of large-scale accuracy evaluation, we finally design a relatively light weight prototype whose components are all under our control. Besides, we also introduce the evaluation metrics of performance on precision rate and recall rate.
For fine-grained evaluation and analysis of the causes of errors, each data from volunteers is assigned the universally unique identifier (UUID). Then, not only the statistics of the data set are evaluated, but the errors of each sample will be also observed as shown in Fig. 10. In summary, the precision rate and recall rate of the hops between NAT gateways and the end devices are both over 95%, using the ADT NAT identification scheme. However, there are still some errors between the real hops and the ADT measured results. It is found that the ADT measured results are usually larger than the real hops. For the explanation of this phenomenon, we analyze the ADT replies and find that the multiple routers not replying the probes causes the oversized ADT measured results. For example, both the real NAT gateway and the NO.1 router in Fig. 11 do not reply to the ADT probes. Then the NO.1 router, closest to the NO.2 router which replies to the Time−Exceeded, will be recognized as the NAT gateway which causes 1 hop error.
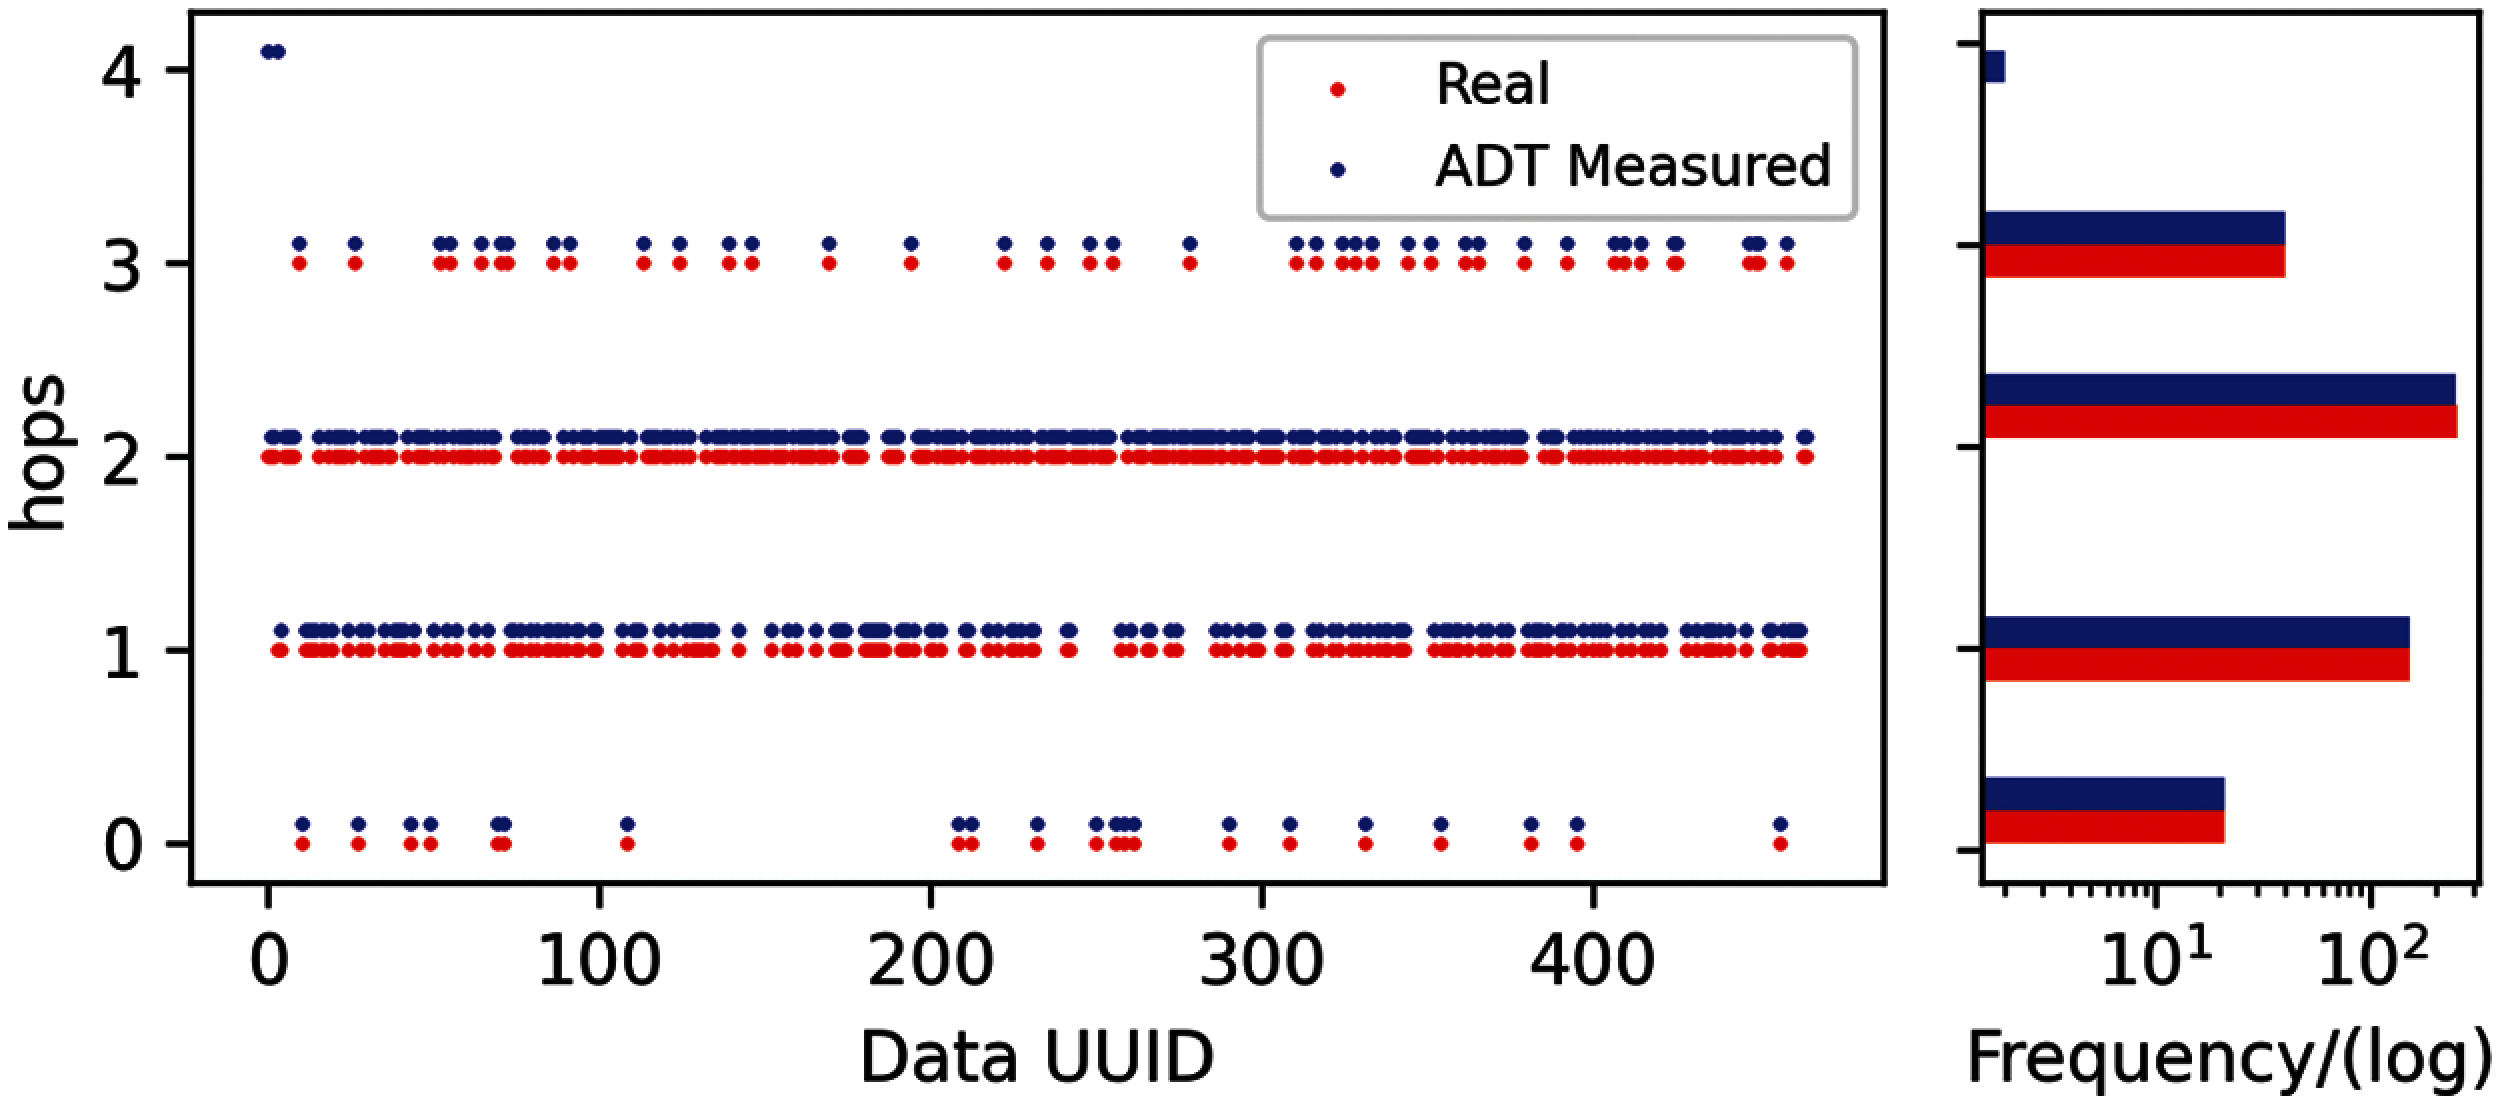
Figure 10: The NAT identification Result on Prototype
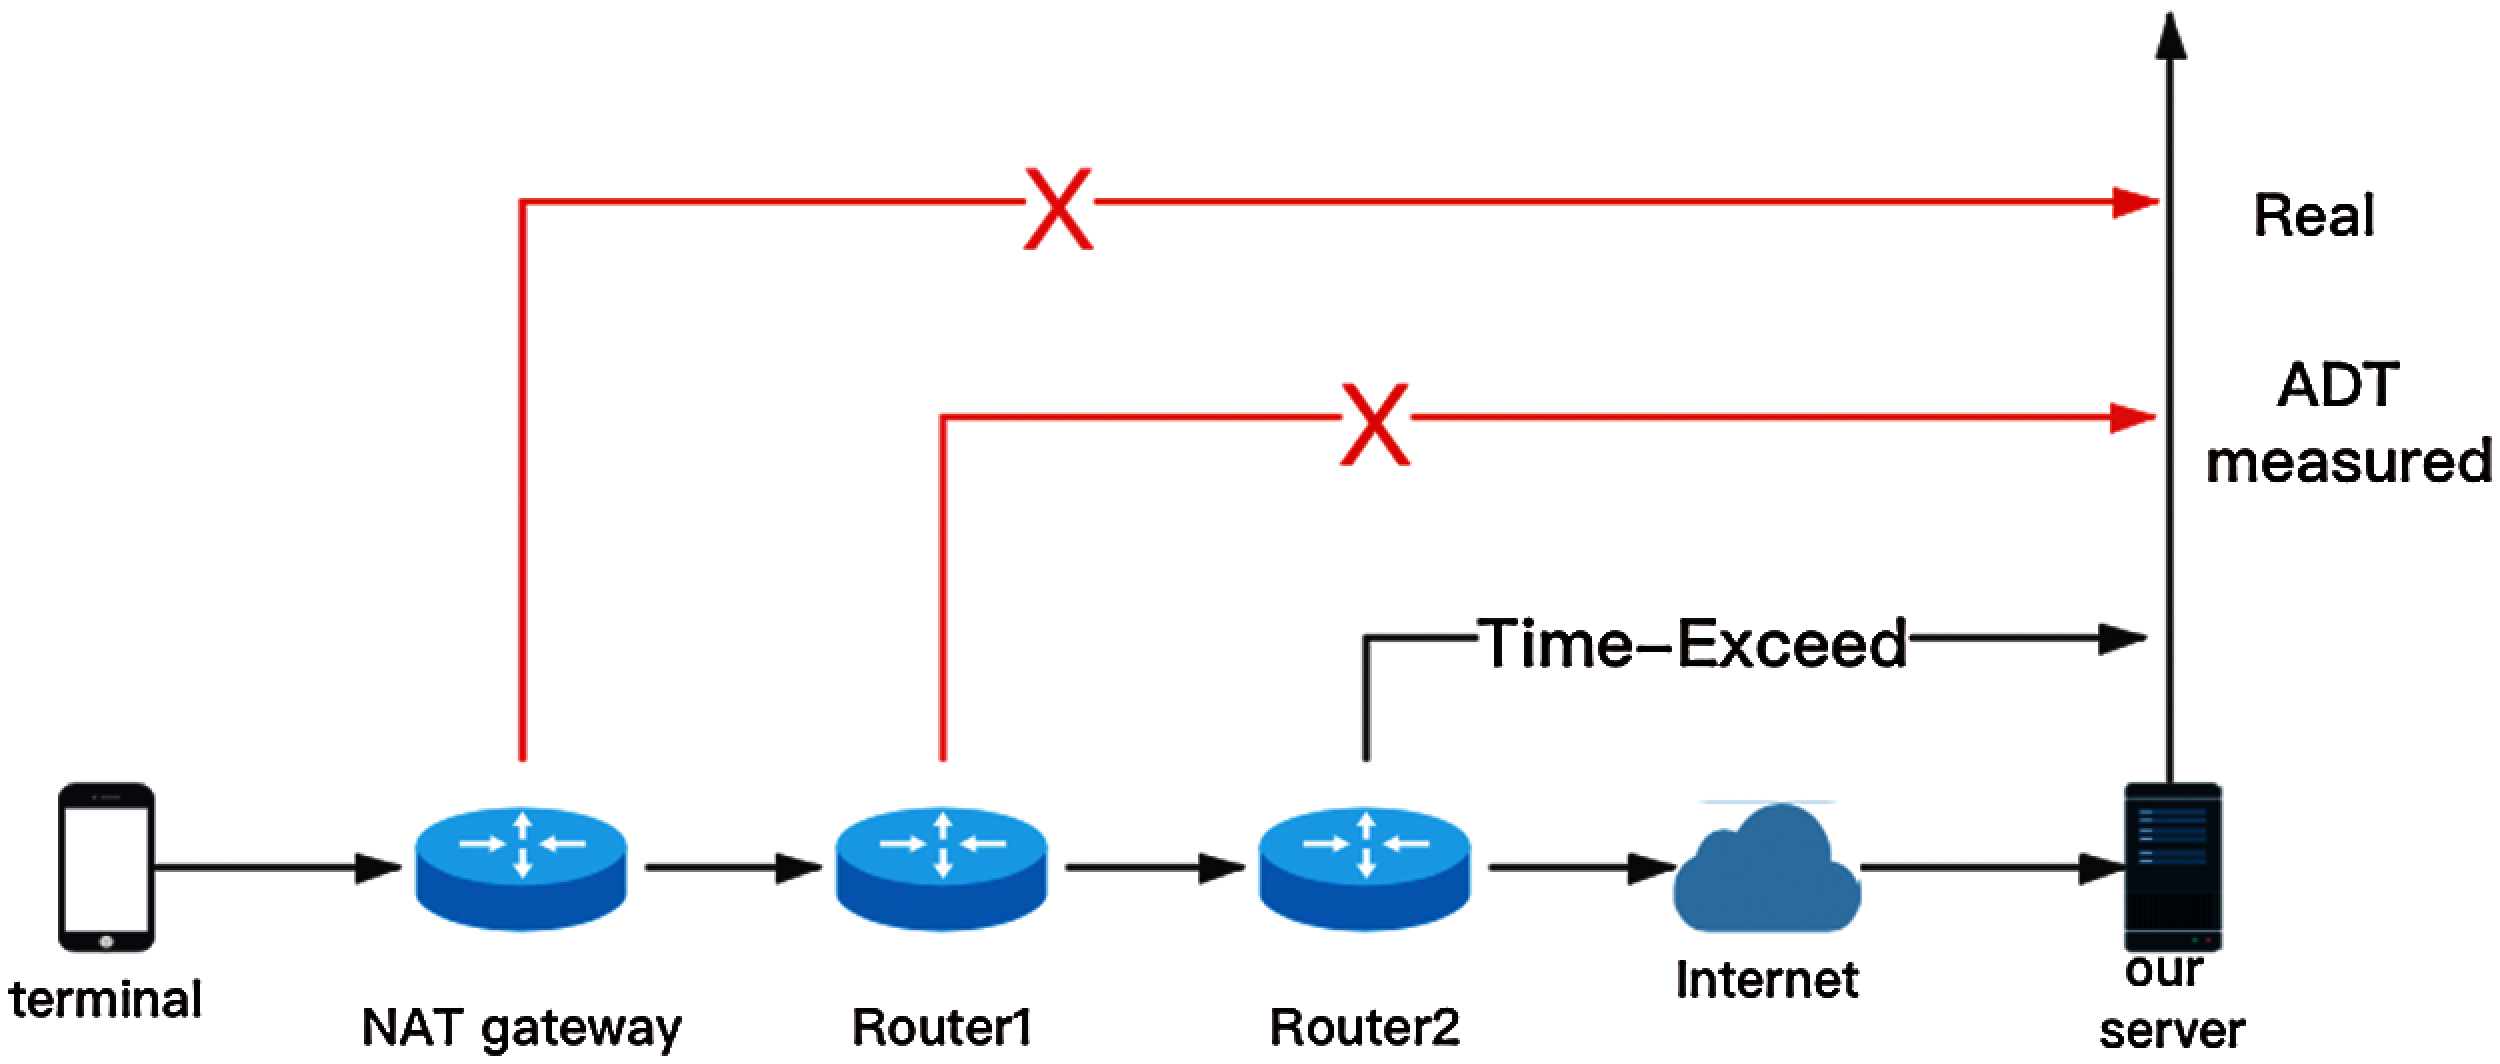
Figure 11: Cause of the oversized ADT measured results
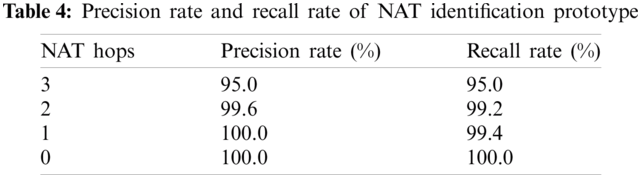
According to the dataset from the prototype deployment in Tab. 4, the error of the ADT NAT identification scheme does not exceed 5% and all the 0 hop away from NAT gateways (non-NAT) can be correctly identified. Besides, there is only 1 hop difference between the real hops and the ADT measured results. From the perspective of whether the ADT algorithm can identify the NAT devices, the method achieves an 100% precision rate and up to 99% recall rate, which shows the high performance of our work on the NAT identification.
To cope with the continuous high load in large-scale networks, high throughput is also an important indicator of the NAT identification scheme. The requirement on throughput majorly includes two aspects.
First, considering the continuous high load of large-scale networks, the throughput and capacity of the NAT identification scheme should keep stable rather than fluctuate sharply. In other words, huge memory usage should be avoided as much as possible. Therefore, we adopt about 1 billion packets from the M-lab NDT dataset [31] as the benchmark for the evaluation. The result, shown in Fig. 12, indicates that the throughput of this scheme could keep about 1 M pps capacity even under more than the max input load. Note that the receiving capacity is the bottleneck of the NAT identification scheme due to the tiny upload bandwidth usage of the ADT probes.
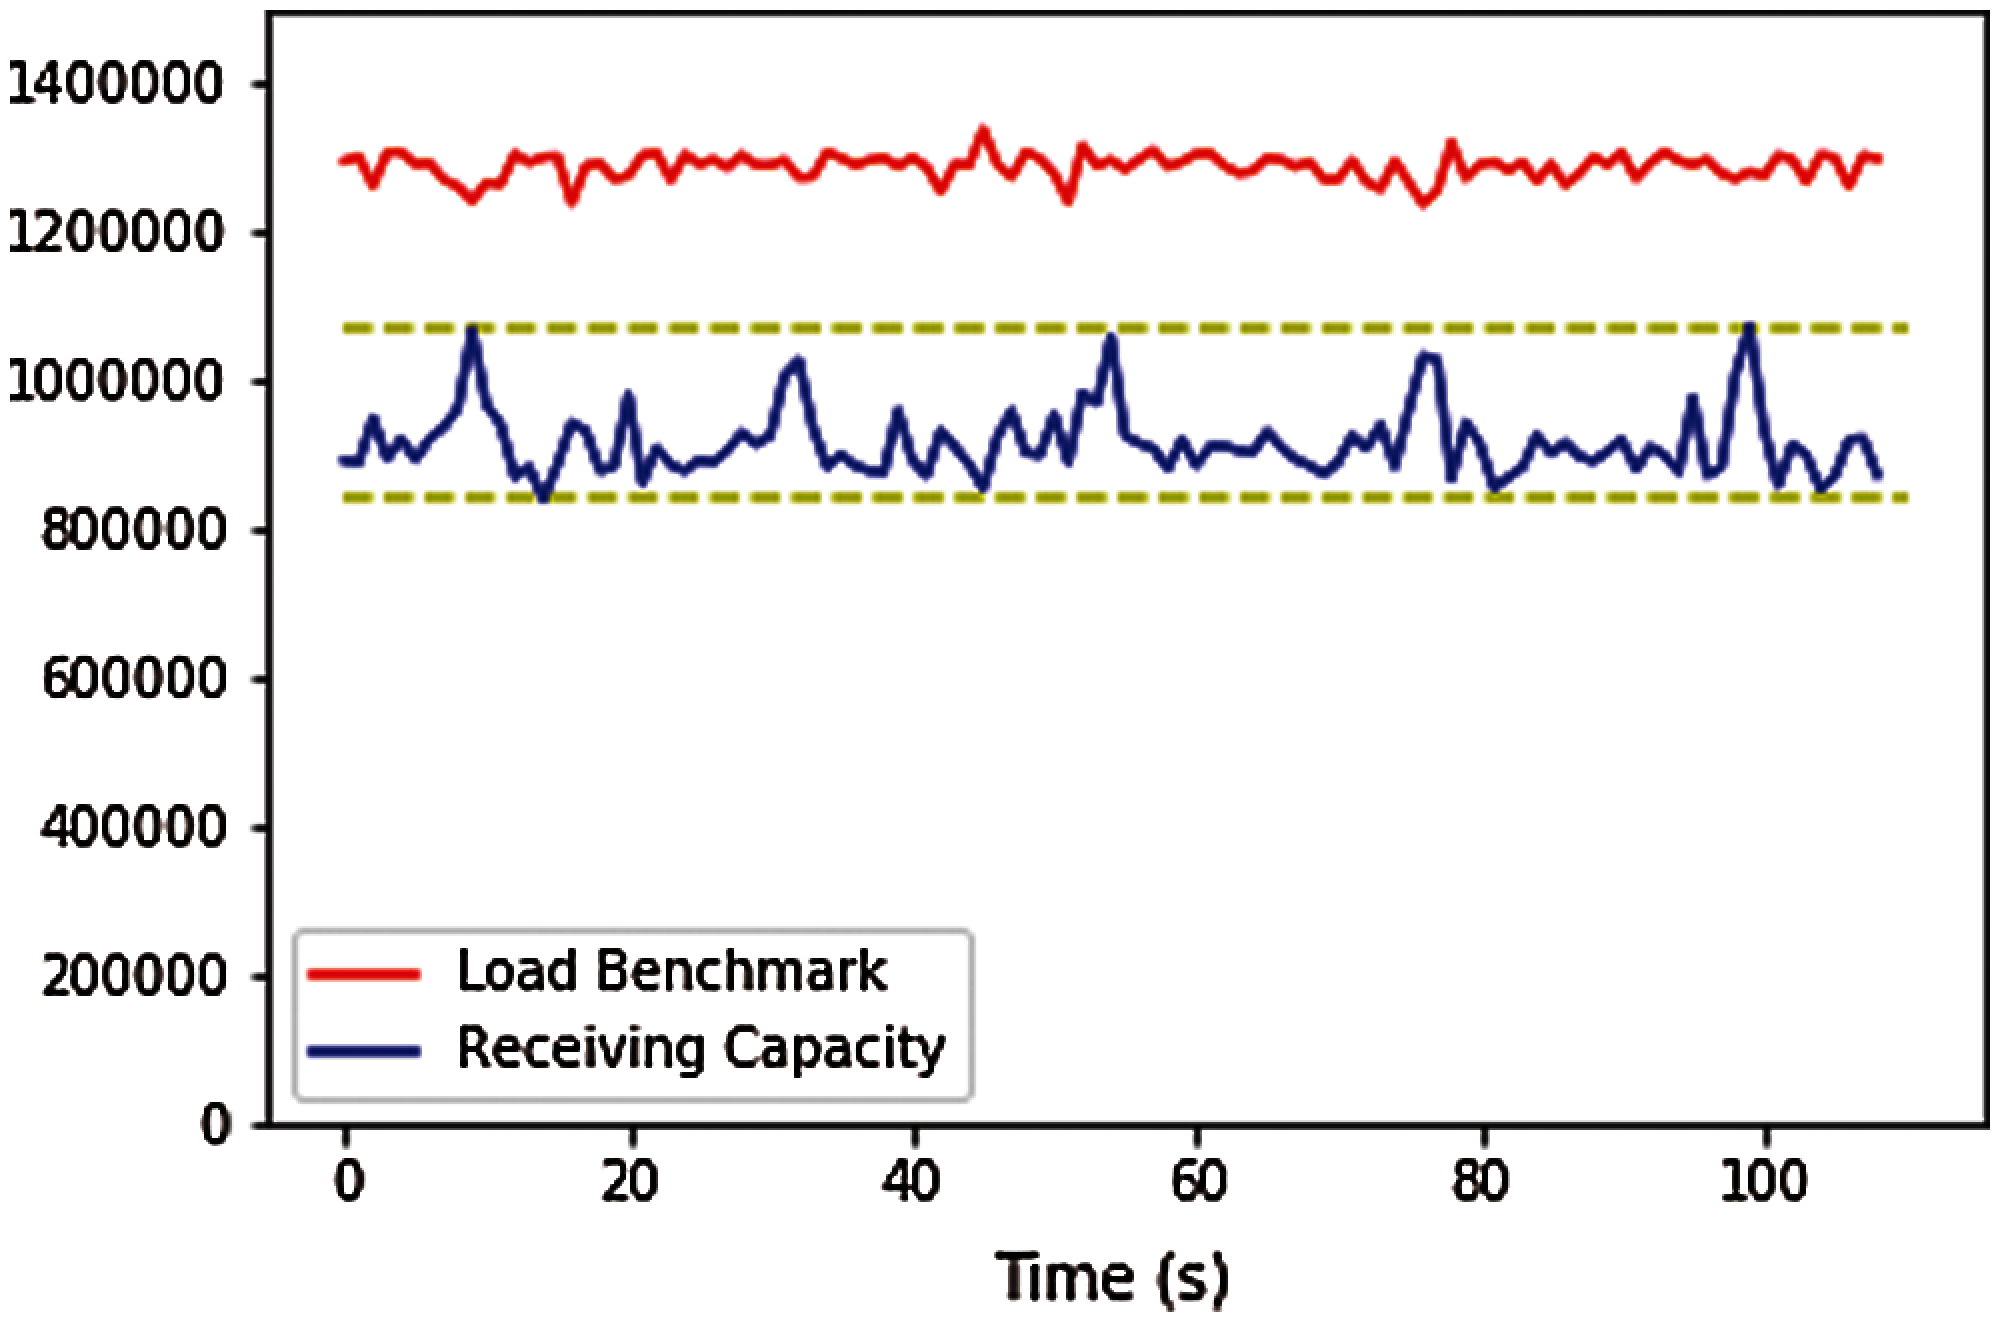
Figure 12: The receiving capacity of the NAT identification scheme
Second, it is intolerable that lots of active probes occupy bandwidth and reduce the quality of service on the Internet. Therefore, we evaluate the size of the probe traffic under different loads and the impact of active measurement on the network. The result, shown in Fig. 13, demonstrates that the scheme does not exploit all the input traffic but the packets of the new streams for probing, which could avoid the bandwidth waste. Generally, even under the max load, the uploading probe traffic will not exceed 1 MB/s, which owes to the adopted bloom filter [26] and the small size of the ICMP packet.
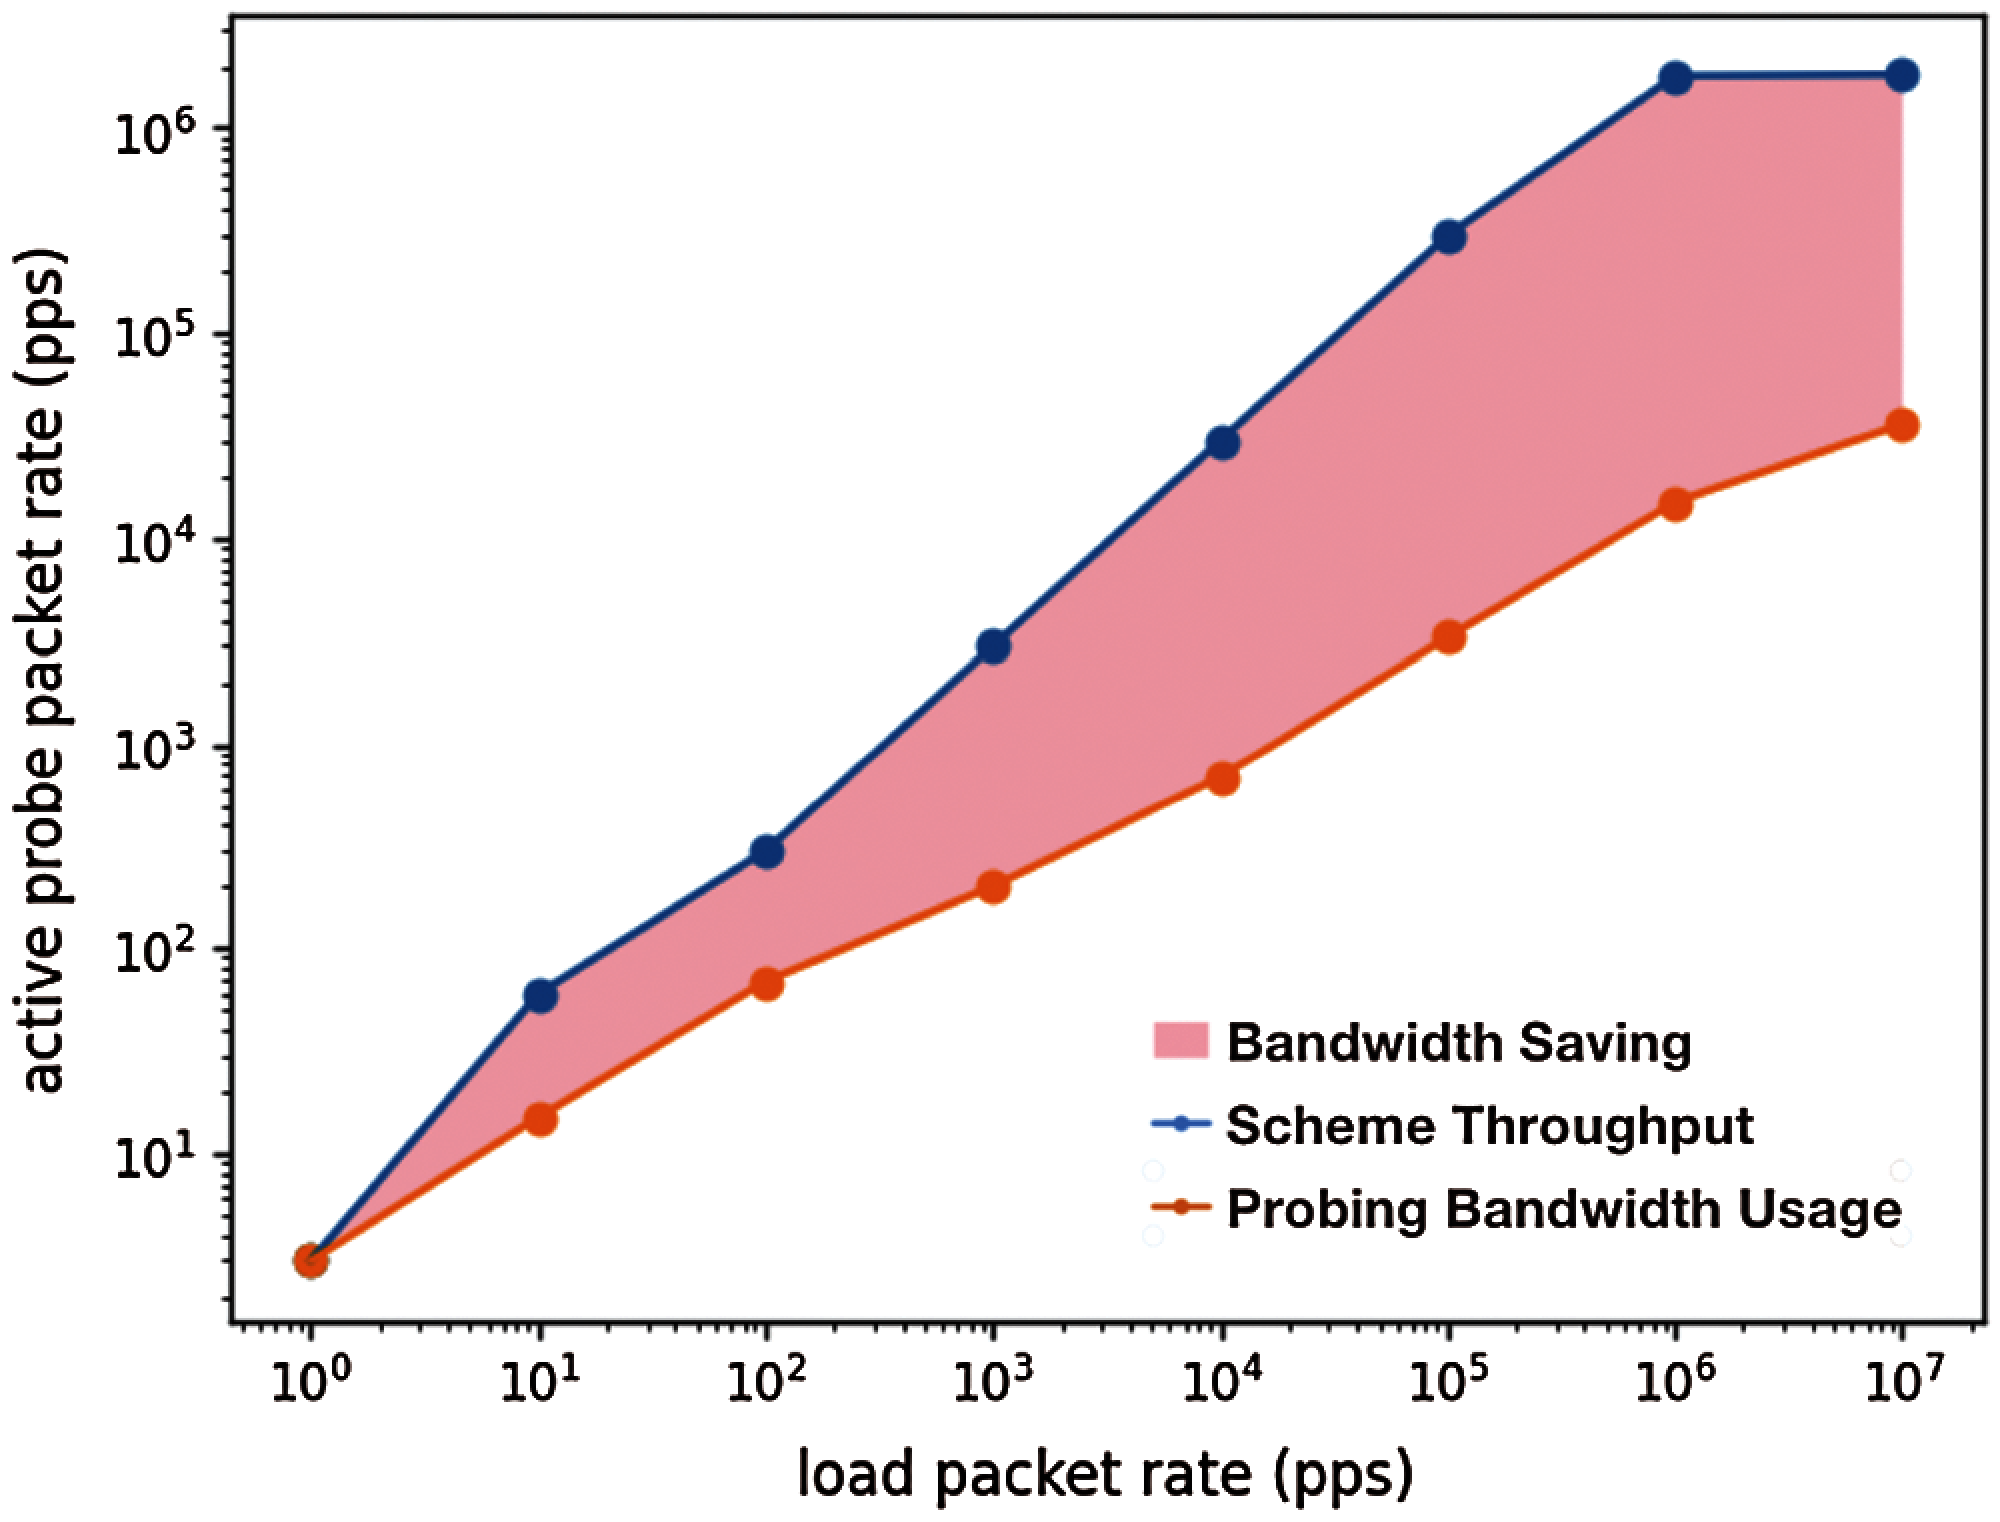
Figure 13: Bloom filter reduces huge upload bandwidth usage of active probe
Note that the scheme is deployed for throughput evaluation on an Ubuntu 16.04 platform with 4 core CPU and 8G RAM. Therefore, the NAT identification scheme takes into account high throughput and low cost, which means that the applicable scope of the proposed method includes the traffic analysis on the gateways of the backbone networks. Thus, we present the experiment in a real laboratory bed.
5.4 Real Large-Scale Network Deployment
CERNET is the first nationwide education and research computer network in China. According to reports, the bandwidth of CERNET backbone has been up to 2.5 Gbps by the end of 2000. More than 2,000 education and research institutions, 1.2 million PCs and 20 million end users have connected to the CERNET. In order to demonstrate the feasibility of large-scale NAT identification, we deployed the scheme at a Border Gateway of CERNET in Jiangsu Province. The traffic's IP address range is 121.248.192.0/20, 202.119.112.0/20, 219.230.160.0/20, 222.193.96.0/20, 2001:250:5005::/48 and 2001:DA8:1004::/48. The NAT identification lasts from November 26, 2020 to December 2, 2020. About 500gigabytes traffic data is collected at intervals 14:00-15:00 every day.
Due to the security configuration of NAT gateways, about 30% of the traffic cannot be identified for the host not replying to ICMP probes. Therefore, the ADT NAT identification scheme, deployed on the CERNET, successfully identified about 70% of the traffic both in IPv4 and IPv6. As shown in Fig. 14, among the identified traffic, 74.1% of the IPv4 traffic on average is intranet or NAT traffic, and this proportion drops to 15.6% in the IPv6 traffic. Besides, we notice that about 10% of IPv6 traffic addresses are distributed in the fe80::/10 block, known as Link-local address. There is no such Link-local address traffic in the IPv4 dataset. We suppose this may be an IPv6 router misconfiguration problem.
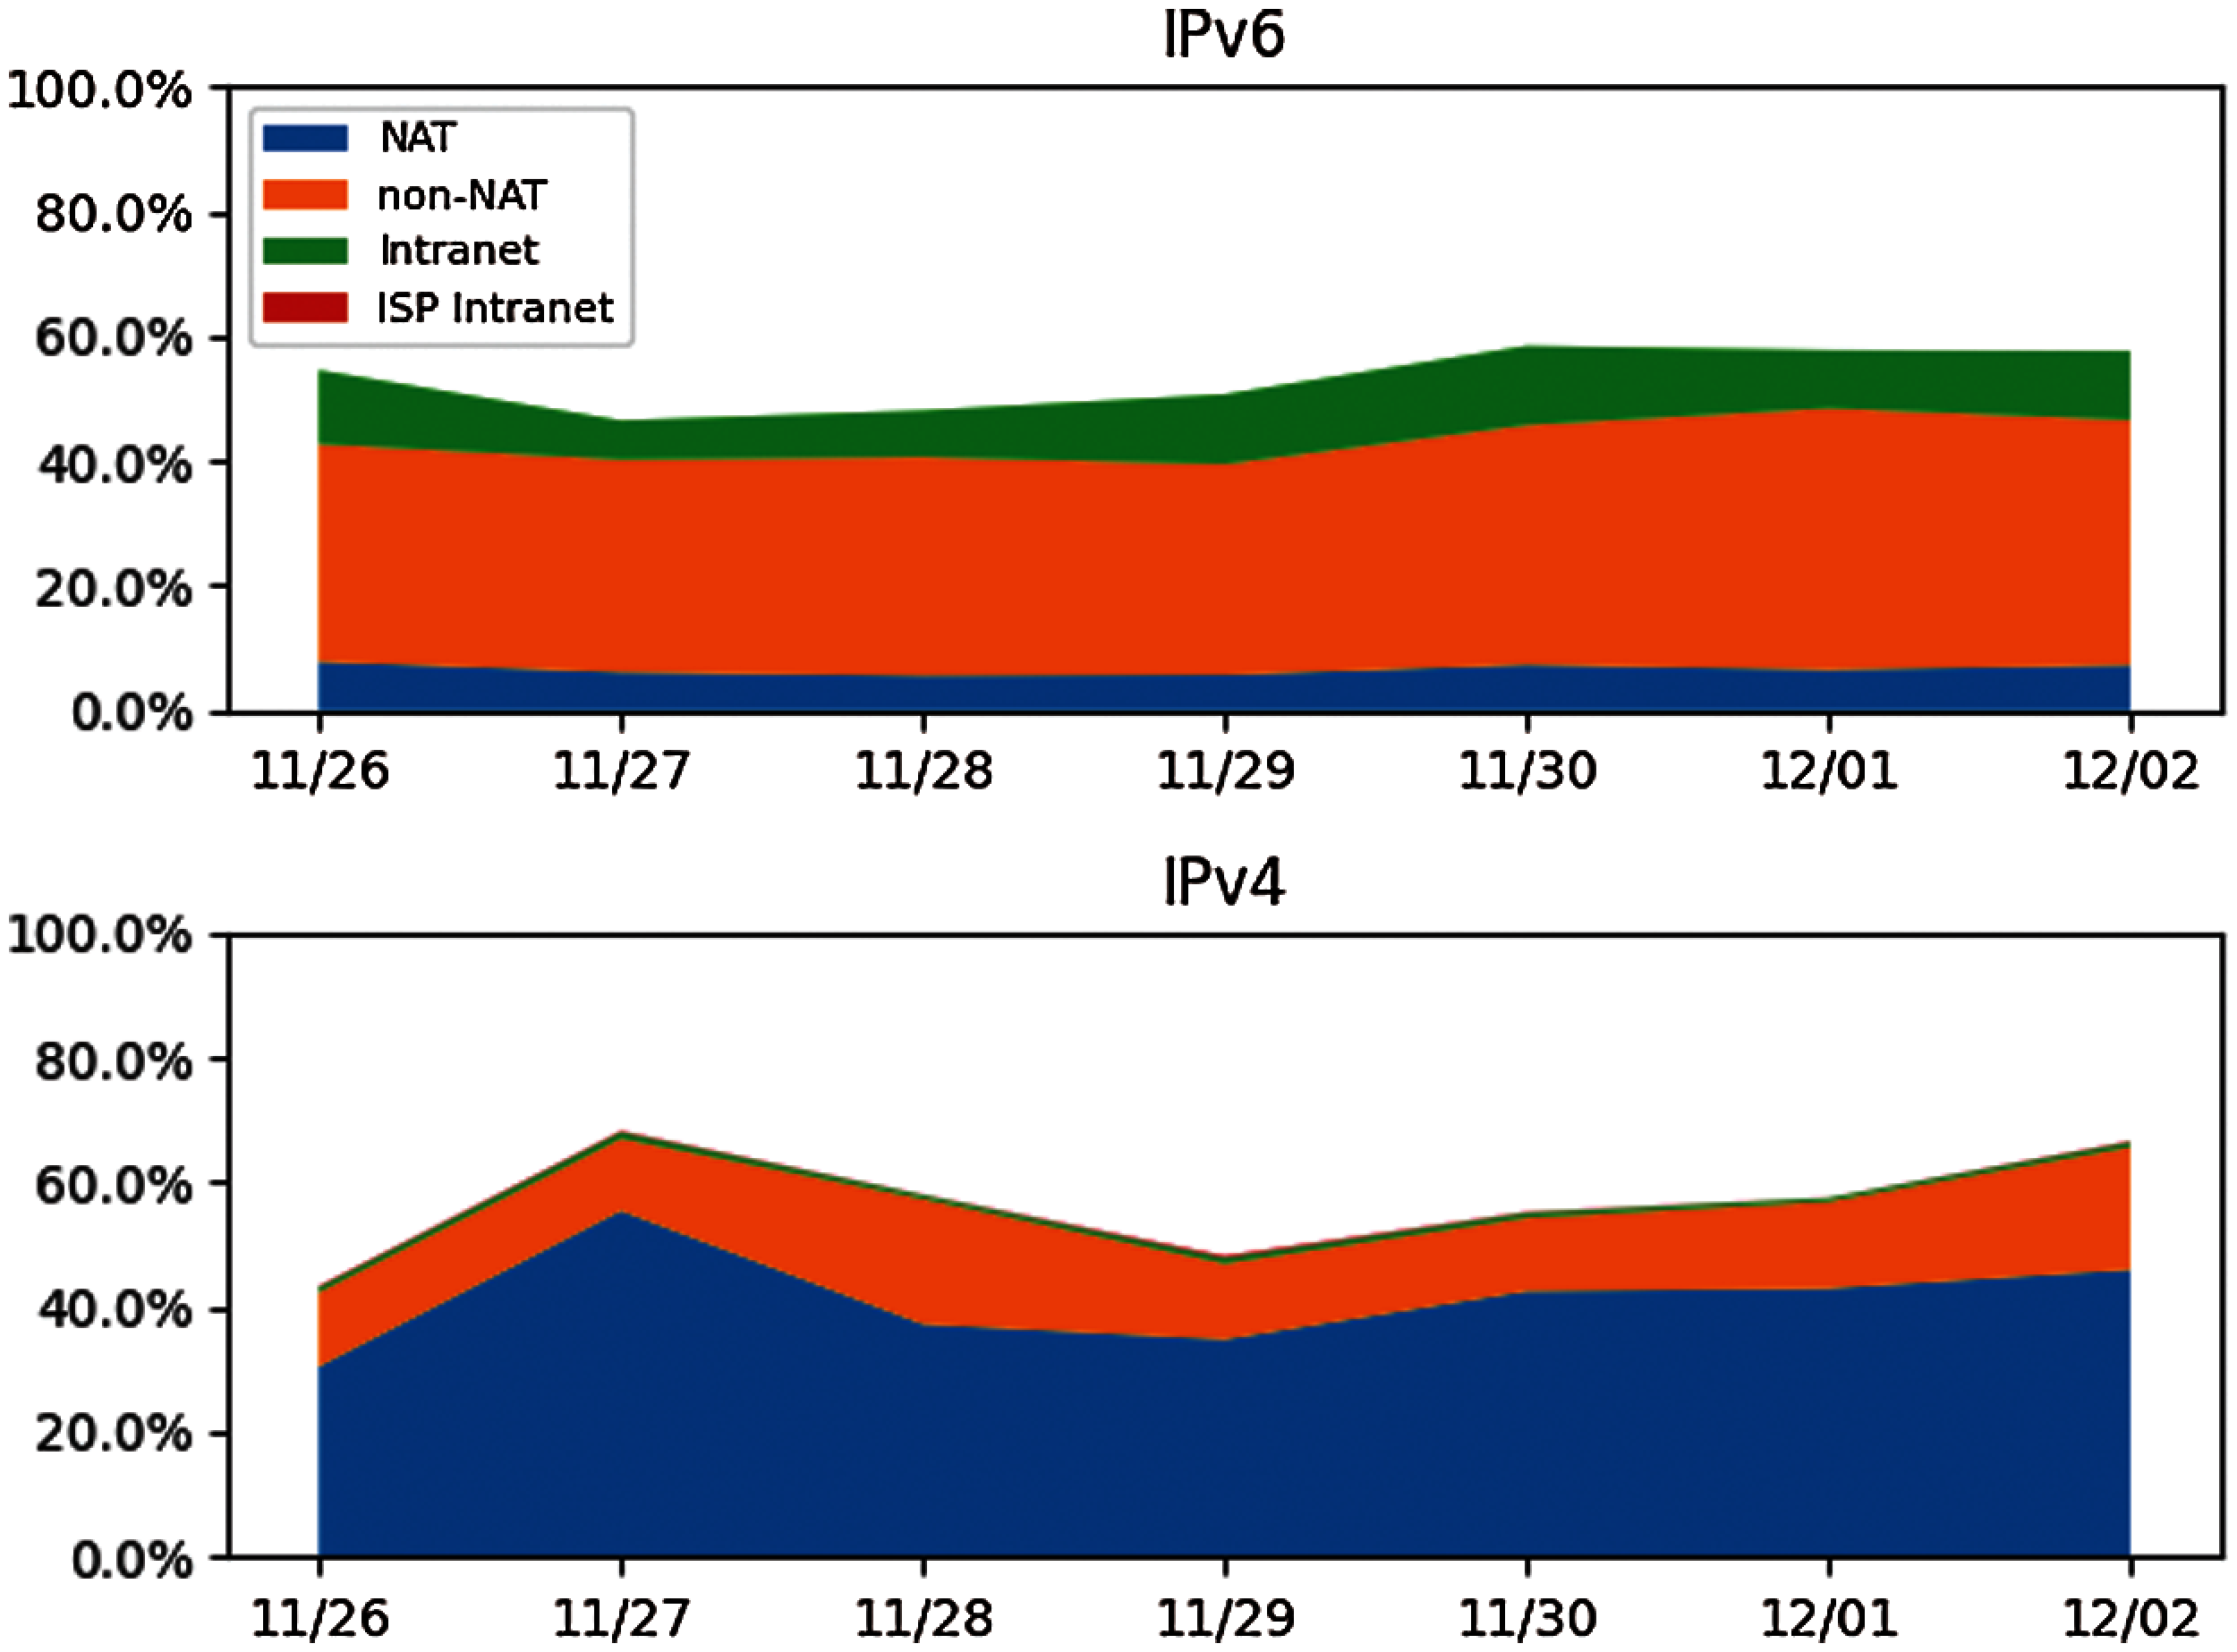
Figure 14: The proportion of NAT traffic is usually changing
In this work, we introduce an active decremental TTL-based (i.e., ADT) algorithm and implement a real-time NAT identification scheme that can identify the NAT usage and measure the hops between the end devices and the NAT gateways. This work is practical and efficient for large-scale network security and network management scenarios. For flexible and efficient NAT identification, we innovatively adopt several mechanisms including parallel transmission, stateless probes, measuring reuse and data approximation. Besides, we provide our new sketch structure (i.e., Bi-sketch) for data approximation with its error bound theoretically proved. To solve the lack of NAT labeled dataset and comprehensively evaluate the ADT algorithm with ground truth, we also implement a light-weight prototype and conduct real-world deployments. Experiments indicate that our scheme outperformed the existing NAT usage identification methods in multiple metrics.
Acknowledgement: Tao Yang and Chengyu Wang contribute equally to the article. The authors thank those who contributed to write this article and give some valuable comments.
Funding Statement: The work is supported by the National Key Research and Development Program of China (2018YFB1800202) and the NUDT Research Grants (No. ZK19-38).
Conflicts of Interest: The authors declare that they have no conflicts of interest to report regarding the present study.
1. P. Srisuresh, and M. Holdrege, “RFC 2663: IP network address translator (NAT) terminology and considerations, internet engineering task force,” 1999. [Online]. Available: http://www.rfc-editor.org/rfc/rfc2663.txt. [Google Scholar]
2. Y. Gokcen, V. A. Foroushani and A. N. Z. Heywood, “Can we identify NAT behavior by analyzing traffic flows?” in Proc. of the IEEE Security and Privacy Workshops, California, USA, pp. 132–139, 2014. [Google Scholar]
3. M. Abu Rajab, F. Monrose and A. Terzis, “On the impact of dynamic addressing on malware propagation,” in Proc. of the 4th ACM Workshop on Recurring Malcode, Virginia, USA, pp. 51–56, 2006. [Google Scholar]
4. R. Li, H. Zhu, Y. Xin, Y. Yang and C. Wang, “Remote NAT detect algorithm based on support vector machine,” in Proc. of the Int. Conf. on Information Engineering and Computer Science, Wuhan, China, pp. 1–4, 2009. [Google Scholar]
5. Y. Ishikawa, N. Yamai, K. Okayama and M. Nakamura, “An identification method of PCs behind NAT router with proxy authentication on HTTP communication,” in Proc. of the IEEE/IPSJ Int. Symposium on Applications and the Internet, Bavaria, Germany, pp. 445–450, 2011. [Google Scholar]
6. S. M. Bellovin, “A technique for counting NATed hosts,” in Proc. of the 2nd ACM SIGCOMM Workshop on Internet Measurment, Marseille, France, pp. 267–272, 2002. [Google Scholar]
7. T. Kohno, A. Broido and K. C. Claffy, “Remote physical device fingerprinting,” IEEE Transactions on Dependable and Secure Computing, vol. 2, no. 2, pp. 93–435, 2005. [Google Scholar]
8. Livadariu, K. Benson, A. Elmokashfi, A. Dhamdhere and A. Dainotti, “Inferring carrier-grade NAT deployment in the wild,” in Proc. INFOCOM, Hawaii, USA, pp. 2249–2257, 2018. [Google Scholar]
9. J. Crichigno, E. Kfoury, E. Bou-Harb, N. Ghani, Y. Prieto et al., “A flow-based entropy characterization of a NATed network and its application on intrusion detection,” in Proc. of the IEEE Int. Conf. on Communications (ICCShanghai, China, pp. 1–7, 2019. [Google Scholar]
10. N. V. Verde, G. Ateniese, E. Gabrielli, L. V. Mancini and A. Spognardi, “No NAT'd user left behind: fingerprinting users behind nat from netflow records alone,” in Proc. of the 34th Int. Conf. on Distributed Computing Systems, Madrid, Spain, pp. 218–227, 2014. [Google Scholar]
11. M. Chen, X. Wang, M. He, L. Jin, K. Javeed et al.., “A network traffic classification model based on metric learning,” Computers, Materials & Continua, vol. 64, no. 2, pp. 941–959, 2020. [Google Scholar]
12. C. Du, S. Liu, L. Si, Y. Guo and T. Jin, “Using object detection network for malware detection and identification in network traffic packets,” Computers, Materials & Continua, vol. 64, no. 3, pp. 1785–1796, 2020. [Google Scholar]
13. G. Cormode and S. Muthukrishnan, “An improved data stream summary: The count-min sketch and its applications,” Journal of Algorithms, vol. 55, no. 1, pp. 58–75, 2005. [Google Scholar]
14. L. Tang, Q. Huang and P. P. Lee, “Mv-sketch: A fast and compact invertible sketch for heavy flow detection in network data streams,” in Proc. INFOCOM, Paris, France, pp. 2026–2034, 2019. [Google Scholar]
15. J. Postel, “RFC 0791: Internet protocol, internet engineering task force,” 1981. [Online]. Available: http://www.rfc-editor.org/rfc/rfc791.txt. [Google Scholar]
16. R. Li, M. Sosnowski and P. Sattler, “An overview of os fingerprinting tools on the internet,” Network, vol. 14, no. 1, pp. 73, 2020. [Google Scholar]
17. R. Braden, “RFC 1122: Requirements for internet hosts-communication layers, internet engineering task force,” 1989. [Online]. Available: http://www.rfc-editor.org/rfc/rfc1122.txt. [Google Scholar]
18. A. Fei, G. Pei, R. Liu and L. Zhang, “Measurements on delay and hop-count of the internet,” in Proc. GLOBECOM, Citeseer, Sydney, Australia, 1998. [Google Scholar]
19. A. Lutu, M. Bagnulo, A. Dhamdhere and K. C. Claffy, “Nat revelio: Detecting nat444 in the isp,” in Proc. of the Int. Conf. on Passive and Active Network Measurement, Crete, Greece, pp. 149–161, 2016. [Google Scholar]
20. A. Muller, F. Wohlfart and G. Carle, “Analysis and topology-based traversal of cascaded large-scale NATs,” in Proc. of the 2013 Workshop on Hot Topics in Middleboxes and Network Function Virtualization, California, USA, pp. 43–48, 2013. [Google Scholar]
21. K. Keys, Y. Hyun, M. Luckie and K. Claffy, “Internet-scale ipv4 alias resolution with midar,” IEEE/ACM Transactions on Networking, vol. 21, no. 2, pp. 383–399, 2012. [Google Scholar]
22. A. M. Mandalari, A. Lutu, A. Dhamdhere, M. Bagnulo and K. C. Claffy, “Tracking the big nat across Europe and the us,” arXiv preprint, 2017. [Online]. Available: https://arxiv.org/abs/1704.01296. [Google Scholar]
23. F. S. Duarte, F. Sikansi, F. M. Fatore, S. G. Fadel and F. V. Paulovich, “Nmap: A novel neighborhood preservation space-filling algorithm,” IEEE Transactions on Visualization and Computer Graphics, vol. 20, no. 12, pp. 2063–2071, 2014. [Google Scholar]
24. C. Huang, G. Huang, W. Liu, R. Wang and M. Xie, “A parallel joint optimized relay selection protocol for wake-up radio enabled WSNs,” Physical Communication, vol. 47, pp. 320, 2021. [Google Scholar]
25. T. Li, W. Liu, A. Liu, M. Dong, K. Ota et al., “BTS: A blockchain-based trust system to deter malicious data reporting in intelligent internet of things,” IEEE Internet of Things Journal, vol. 58, pp. 1, 2021. [Google Scholar]
26. B. H. Bloom, “Space/time trade-offs in hash coding with allowable errors,” Communications of the ACM, vol. 13, no. 7, pp. 422–426, 1970. [Google Scholar]
27. J. Rosenberg, R. Mahy, P. Matthews and D. Wing, “RFC 5389: Session traversal utilities for NAT, internet engineering task force,” 2008. [Online]. Available: http://www.rfc-editor.org/rfc/rfc5389.txt. [Google Scholar]
28. L. Hao, F. Wan, N. Ma and Y. Wang, “Analysis of the development of wechat mini program,” Journal of Physics: Conference Series, vol. 1087, no. 6, pp. 14, 2018. [Google Scholar]
29. B. Hou, C. Hou, T. Zhou, Z. Cai and F. Liu, “Detection and characterization of network anomalies in large-scale RTT time series,” IEEE Transactions on Network and Service Management, vol. 18, no. 1, pp. 793–806, 2021. [Google Scholar]
30. Y. Tao, G. Hu, B. Hou, Z. Cai, J. Xia et al., “An alias resolution method based on delay sequence analysis,” Computers, Materials & Continua, vol. 63, no. 3, pp. 1433–1443, 2020. [Google Scholar]
31. “Measurement Lab, The M-lab NDT dataset, Measurement Lab Organization,” 2021. [Online]. Available: https://measurementlab.net/tests/ndt. [Google Scholar]
Obviously, the number of buckets in a row is:
Due to the random and uncertain arrival time of measurement results, the effect of the second correction should be saved in bucket
Therefore, let
Let
Hash collision is inevitable for large-scale data. There will be cases where the hash values of
Therefore, we can give the estimates of NAT traffic through Bi-Sketch, and the estimate has the following guarantees:
Given parameters
Set
Define the variable
by pairwise independence of
We can conclude that with probability at least
 | This work is licensed under a Creative Commons Attribution 4.0 International License, which permits unrestricted use, distribution, and reproduction in any medium, provided the original work is properly cited. |