DOI:10.32604/cmc.2022.021522
| Computers, Materials & Continua DOI:10.32604/cmc.2022.021522 | |
| Article |
Artificial Intelligence Based Optimal Functional Link Neural Network for Financial Data Science
1Department of Computer and Self Development, Preparatory Year Deanship, Prince Sattam bin Abdulaziz University, AlKharj, Saudi Arabia
2Department of Information Systems, College of Computer and Information Sciences, Princess Nourah bint Abdulrahman University, Saudi Arabia
3Department of Computer Science, King Khalid University, Muhayel Aseer, Saudi Arabia & Faculty of Computer and IT, Sana’a University, Sana’a, Yemen
4Department of Computer Science, College of Computer, Qassim University, Saudi Arabia
5Department of Natural and Applied Sciences, College of Community-Aflaj, Prince Sattam bin Abdulaziz University, Saudi Arabia
*Corresponding Author: Manar Ahmed Hamza. Email: ma.hamza@psau.edu.sa
Received: 04 July 2021; Accepted: 05 August 2021
Abstract: In present digital era, data science techniques exploit artificial intelligence (AI) techniques who start and run small and medium-sized enterprises (SMEs) to have an impact and develop their businesses. Data science integrates the conventions of econometrics with the technological elements of data science. It make use of machine learning (ML), predictive and prescriptive analytics to effectively understand financial data and solve related problems. Smart technologies for SMEs enable allows the firm to get smarter with their processes and offers efficient operations. At the same time, it is needed to develop an effective tool which can assist small to medium sized enterprises to forecast business failure as well as financial crisis. AI becomes a familiar tool for several businesses due to the fact that it concentrates on the design of intelligent decision making tools to solve particular real time problems. With this motivation, this paper presents a new AI based optimal functional link neural network (FLNN) based financial crisis prediction (FCP) model for SMEs. The proposed model involves preprocessing, feature selection, classification, and parameter tuning. At the initial stage, the financial data of the enterprises are collected and are preprocessed to enhance the quality of the data. Besides, a novel chaotic grasshopper optimization algorithm (CGOA) based feature selection technique is applied for the optimal selection of features. Moreover, functional link neural network (FLNN) model is employed for the classification of the feature reduced data. Finally, the efficiency of the FLNN model can be improvised by the use of cat swarm optimizer (CSO) algorithm. A detailed experimental validation process takes place on Polish dataset to ensure the performance of the presented model. The experimental studies demonstrated that the CGOA-FLNN-CSO model has accomplished maximum prediction accuracy of 98.830%, 92.100%, and 95.220% on the applied Polish dataset Year I-III respectively.
Keywords: Data science; small and medium-sized enterprises; business sectors; financial crisis prediction; intelligent systems; artificial intelligence; decision making; machine learning
Financial data science is the application of data science approaches to solve the problems related finance. The data science encompasses skills from computer science, mathematics, statistics, information visualization, graphic design, complex systems, communication and business. It is generally based on scientific techniques and methods in extracting useful patterns from both structured and unstructured data. It generally includes predictive modeling, clustering, data wrangling, visualization and dimensionality reduction. On the other hand, small and medium sized enterprises (SMEs) are a major portion of the global economy [1,2]. In China, SMEs are the basis of economic development and turned into a significant factor for social growth [3]. The Chinese management has executed several rules for supporting the development of private businesses, with increased credit and reduction in fees & taxes. Nonetheless, prediction of financial status is considered a crucial problem for SMEs. For huge enterprises, certified audited financial statement is utilized for evaluating the credit threat and assist financial decision making like permitting loans [4].
For SMEs, because of the absence of reliable data and other aspects, assessing credit risk is complex and expensive for the banks. Although bank utilizes relationships long to collect soft data on time for handling credit data scarcity, SME frequently faces higher cost while accessing finance as a result of data opacity and higher bankruptcy threat [5]. Furthermore, related to huge companies, SME is highly susceptible to the modifications of outside platform [6]. Because of the large effect of business crisis on the economy and society (global debt), at present, it has been a stimulating concept of research for precise analysis of the significances of bankruptcy and finds a way to evade it. For reducing the impact of this crisis, businesses might employ for economic help or funds from financial institutions, when decision maker in the financial system tries to find these businesses which are feasible to state bankruptcy in the upcoming years. Hence, business crises or bankruptcy predictive aim is for assessing the financial health and upcoming efficiency of a business. Fig. 1 shows the combination of Artificial Intelligence (AI) and IoT from SMEs [7].
Financial crisis prediction (FCP) for SMEs contains major importance in making financial decisions. A company state of minimum/maximum organization is involved with shareholders, local community, and organizational candidates, but, it causes the financial global economy and policymakers. Henceforth, maximum social and financial expenses through business bankrupt have been stimulated with several developers for understanding better bankruptcy reason and lastly, finding the distress of business. Economical centres and organizations have shown high consideration to predict the economical error of a firm. FCP is the most substantial application which assists an economical firm to make an optimum decision. It is due to the inferior decision acquired from the whole organizations that result in economic problem/bankruptcy and influence the clients, shareholders, vendors, etc. The current growth in Information Technology (IT) initiates to accomplish different data are depending upon the threat levels of a firm in many conditions. During the estimation of high data, several clients are based on analyst decisions. But, the factor that affects the efficiency analyses.

Figure 1: Integration of AI and IoT in SMEs
1.1 Role of AI and Feature Selection Techniques in FCP
AI and Statistical methods have been employed to find the essential factors of FCP. Now, AI modules are utilized in different categories [8]. It is utilized to construct the approaches to validate the methods either the economical centre suffers from many challenges/not. The main concept of this module is that economical features are extracted from general financial statements such as financial proportion captures high data about organization state which is appropriate for FCP [9]. It is referred to as a complex operation that examines the related economic data and other data’s from the organization's strategic competency to process data for emerging the productive module. Moreover, the AI and database modules, Data Mining (DM) approaches are utilized in different areas.
On the other hand, Feature Selection (FS) is determined as a significant preprocessing stage in DM. It is mostly proposed to filter the repeating and irregular features from actual data. Now, it is recognized that various mathematical models and estimations are employed to handle the FCP. Depending upon the evaluation state, FS modules are categorized as filter relied upon, wrapper, and embedded. In spite of utilizing the wrapper methods, it experiences several challenges such as learner constraints, maximum processing complexity, etc. Incorporated modules contain difficulty compared to wrapper modules as FS subsets based on learning modules. Because of the presence of limitations, it was employed by filter modules. It is employed to compute the feature subset by permanent values rather than selected features and learners. The problem of detecting an optimal feature from the accessible features is called as NP hard problem [10]. Various techniques are utilized to find the partial solution with constrained period. Some of the ML methods such as ACO and GA are utilized to select desirable features, and it isn’t appropriate for the business sectors, particularly FCP.
This paper presents a new AI based optimal functional link neural network (FLNN) based FCP model for SMEs. The proposed model involves preprocessing, feature selection, classification, and parameter tuning. Primarily, the financial data of the SMEs are gathered and then preprocessed to improve the data quality. In addition, a novel chaotic grasshopper optimization algorithm (CGOA) based feature selection technique is applied for the optimal selection of features. Besides, functional link neural network (FLNN) model is employed for the classification of the feature reduced data. At the same time, the efficiency of the FLNN model can be improvised by the use of cat swarm optimizer (CSO) algorithm. A detailed experimental validation process takes place on Polish dataset to ensure the performance of the presented model. In short, the paper's contributions can be summarized as follows.
• Propose a CGOA-FLNN-CSO technique to predict the financial status of SMEs. The CGOA-FLNN-CSO technique integrates preprocessing, CGOA based feature selection, FLNN based classification, and CSO based parameter tuning.
• Designs a new CGOA technique to select optimal set of features to reduce the computational complexity and enhance the FCP performance.
• Derive a new FLNN-CSO technique for the classification process, which includes an optimal hyperparameter process using CSO algorithm to boost the predictive performance.
• Validate the predictive performance of the proposed technique on Polish dataset and compares the results with the recent state of art methods.
The upcoming sections of the paper are planned as follows. Section 2 briefs the existing works related to the FCP. Followed Section 3 elaborates the proposed model and Section 4 offers detailed performance validation. Lastly, Section 5 concludes the study.
This section offers a comprehensive review of FCP models that existed in the literature. Gregova et al. [11] designed LR, RF, NN modules for identifying the higher prediction accuracy of the financial distress if it comes from business enterprises working in the particular Slovak platform. The result indicates that entire module demonstrates higher discrimination accuracy and equivalent efficacy; NN method generated optimal outcomes estimated by the whole efficiency features. The purpose of this research is to experimentally examine the determinant of financial distress amongst SMEs in the global financial and post crises period [12]. Various statistical approaches like multiple binary LR, have been utilized for analyzing a longitudinal cross sectional panel dataset of 3,865 Swedish SMEs functioning in 5 businesses in 2008 2015 period.
In Lu et al. [13], the financial crises of the enterprise in t period is forecasted with the financial index data of non-financial industry. Later they utilized the combined ML methods for selecting the financial crises enterprise, and the challenge of failure of classifier in unbalanced instance is resolved by sampling and bagging methods. Shang et al. [14] select multiple financial indicators depending upon big data mining in IoT. The rules among the entire financial indicators have been created for selecting descriptive financial risk indicators. Later the common fuzzy selection set was defined using parallel mining, FCM, and parallel rules, therefore attaining the fuzzy association rule fulfills the minimal fuzzy reliability. Metawa et al. [15] presented a novel optimum FS based classification module for FCP. The presented FCP technique includes preprocessing, classification, and FS. Firstly, the financial data of the enterprise is gathered using IoT devices like laptops and smartphones. Later, the PIO based FS method is employed for selecting an optimum set of features. Then, the XGB based classification optimized using JO method named JO XGB is utilized for classifying the financial data. In Ptak-Chmielewska [16], compared the efficiency of LDA and SVM predictions. An instance of SME was utilized in the empirical analyses, financial ratios have been used and non-financial aspects have been considered.
Perboli et al. [17] focuses on mid and long term bankruptcy predictions (up to months) targeting small or medium enterprises. The main involvement of this research is a significant development of the predictive accuracy in the short term (twelve months) by ML methods, related with the advanced when creating precise mid and long term predictions. Malakauskas et al. [18] utilized data on 12.000 SMEs for estimating binomial classifications for financial distress prediction by LR, ANN, and RF methods. Traditional financial ratios have been utilized for estimating the early single period predictor that was improved using age factor, time, and credit history for retrieving multi period modules. Luo et al. [19], proposed a new predictive architecture that utilizes external public credit data. This method could be gathered from publicly accessible websites. Records on 15,605 instance companies have been gathered from around 300,000 businesses. Amongst them, 8183 have defaulted. The empirical data have been employed for constructing predictive modules by LR, Light GBM, and CART module.
3 The Proposed FCP Model for SME
Fig. 2 demonstrates the overall working process of the proposed CGOA-FLNN-CSO model. The proposed model incorporates different processes such as CGOA based feature selection, FLNN based classification, and CSO based parameter tuning. The detailed working of these processes are offered in the succeeding sections.

Figure 2: Overall process of CGOA-FLNN-CSO model
3.1 Design of CGOA Based FS Technique
GOA is initially projected in [20] as the novel nature inspired and population based methods that implement the behavior of grasshopper swarms in nature. The two important stages of optimization contain exploitation & exploration of the search space; the grasshopper involves two stages in the food search via this social interaction. The major features of the swarm in the larval phase are slow motion and smaller phases of the grasshopper. However, longer range and abrupt motion is the important feature of the swarm in adulthood.
Depending upon the aforementioned descriptions of grasshopper, three evolution operators have existed in the location upgrading of individual in swarms, the social interactions operator (Si), the gravity force operator (Gi), and the wind advection operator (Ai), as shown in Eq. (1).
whereas
where
whereas
But, the gravity operator isn’t deliberated and they consider that the wind direction is often on the way to target. Later the Eq. (1) turn into:
where
where
The generation of early population in the search space plays a major part in GOA. From the stated survey, they have examined that several chaoses based GOA method is investigated for resolving global optimization problems. In this study, they presented chaotic initiation of maps in the GOA optimization procedure for accelerating its global convergence speed. The chaotic map is utilized for balancing efficient exploitation & exploration and decrease repulsion or attraction forces among grasshoppers in the optimization procedure [22]. The application of chaotic series rather than arbitrary series in GOA is certainly an essential approach. Henceforth, it could execute downright search at high speed compared to stochastic search which is depending mainly on likelihoods. Some of the functions (chaotic maps) and variables (early condition) are essential for longer series. Additionally, a large number of different series could be generated with differing their early condition. Moreover, this chaotic sequence is reproducible and deterministic. The logistic maps are the most optimum chaos based method that scientists have focused on global search. It is defined by Eq. (6).
whereas
In this process, huge number of manifold periodic components would be placed in the thinner
An important factor of CGOA-FS method is assessing the quality of the chosen subset. As the presented CGOA-FS method is a wrapper based technique, then a learning method (viz., classification) must be included in the evaluation procedure. In this study, an FLNN classifier is used as an evaluator, and the classifier accuracy of the chosen features is included in the presented fitness function. If the chosen features in a subset are appropriate, the attained classifier accuracy would be improved. Having a higher classifier accuracy is the main aim of the CGOA-FS technique. Another significant aim is decreasing the number of chosen features. When the number of features chosen is minimum, then improved solution can be obtained. In the presented CGOA-FS technique, these two contradictory aims are considered. Eq. (7) displays the FF which assumes classification accuracy and the number of chosen features while calculating a feature subset of the entire methods [23]. As the number of chosen features is to be minimized, they utilized classification error rate (the accompaniment of the classification accuracy).
where
The ANN is a network of connected components which is stimulated using the study of biological nervous system. It is an effort to implement a machine which works in the same way as the human brain system. This artificial machine mimics the functions such as biological neurons are named as nodes/neurons. These nodes/units are the components of the NN. This method executes difficult problems in a nonlinear platform. It can classify patterns by arranging the patterns to one group/other. Several variations of ANN amongst MLP is the best known kind. It consists of hidden, input, and output layers that are interconnected among each other via weight values. The hidden layer could be more than one layer. Many hidden layers aids in higher order statistics for a huge number of inputs. The higher order FFNN is a single layer module of ANN with consumed input capability. It has summing and product units. The modern unit aids in better estimate capability for classification accuracy. The HONN executes nonlinear mapping by tuning single layer of weight. ANN such as MLP could not conquer the problem of slow learning, particularly while handling high complex nonlinear issues. This makes the requirement to HONN.
FLNN is the subdivision of FFNN without hidden layer. It carries nonlinearity to its input structure with the expansion unit [24]. The extended input to the network decreased the computation cost, it enhanced the approximation efficiency as related to BP. Different from MLP the FLNN module could be trained faster without compromising computation performance. While the inherited features of invariance drive the FLANN for selecting the desirable signals that produce optimal systems identification. Fig. 3 shows the second order FLNN architecture that has

Figure 3: Structure of FLNN
3.3 Algorithmic Design of CSO-FLNN Model
In order to properly tune the parameters of the FLNN model, CSO algorithm is applied to it and thereby enhances the predictive performance. The CSO technique is simulated as resting and tracing performances of cats. The cats appear that exists lazy and spend one of their time resting. Therefore, it is continually monitoring the surroundings cleverly and purposely and if it can be obvious a target, it starts moving to it rapidly. So, the CSO technique is exhibited depends on composing of 2 important behaviors of cats. The CSO technique has 2 modes such as tracing and seeking modes. All cats signify the solution set that has their individual place, fitness value, and flag. The place is composed of
This technique proceeds the subsequent steps for searching for better solutions:
1. To identify the upper and lower bounds to the solution sets.
2. Arbitrarily create
3. Arbitrarily classified the cats as seeking and tracing modes based on MR. The MR was mixture ratio that is selected from interval of
4. Estimate the fitness value of every cat based on domain identified FF. Then, an optimum cat was selected and stored as memory.
5. The cats then move to either seeking or tracing mode.
6. Next, the cats endure seek or trace mode, for next iteration, arbitrarily reallocate the cats as to seek or trace modes according to MR.
7. Verify the end criteria; when fulfilled; end the program; then, repeat Step 4 to Step 6.
Seeking Mode. This mode reproduces the resting performance of cats, in which 4 basic parameters role vital plays: seeking memory pool (SMP), seeking range of selected dimension (SRD), counts of dimension to change (CDC), and self-position considering (SPC). These values are each tuned and determined as the user with trial and error model. SMP identifies the size of seeking memory to cats, for instance, it determined the count of candidate places where among them is going that exists selected as cat. Thus, for instance, when the SPC flag is fixed to true, afterward to all cats, it can be required for generating (SMP-1) number of candidates in its place SMP number as the present place was regarded as among them. The seeking mode steps are as follows:
(1) Create up to SMP copies of present place of
(2) In order to all copies, arbitrarily elect up to CDC dimensional that exists mutated. Also, arbitrarily add or subtract SRD values in the present values that exchange the old places as depicted from the subsequent formula:
where
(3) Estimate the fitness value to every candidate place.
(4) According to probabilities, elect most candidate points that exist the next place to the cat where candidate point with superior FS have further chance to be elected as demonstrated in Eq. (10). But, when every fitness value is equivalent, afterward the set every electing probability of all the candidates point to be one.
When the objective is to minimize, next
Tracing Mode. This mode replicas the trace performance of cats. In the initial iteration, arbitrary velocity values are provided to every dimension of cat place. But, to later steps, velocity values require that exists efficient. Moving cats from this mode are as follows:
(1) Upgrade velocities
(2) When the velocity value outranged the maximal value, afterward it can be equivalent to maximal velocity.
(3) Upgrade place of
The proposed technique has 2 essential processes involving inner parameter optimization and outer efficiency estimation. In the inner parameter optimization method, the penalty parameter C and kernel bandwidths γ of ELM was determined dynamically employing the ISSO approach utilizing 5_fold CV analysis. Next, the achieved optimum parameters pair (C, γ) is inputted as to KELM forecast method for performing the classifier task from outer loop utilizing a 10_fold CV approach. The classifier error rate is employed as FF.
where
The proposed model is simulated using Python 3.6.5 tool. The FCP performance of the proposed model takes place on Polish dataset with 3 years of data [26] as shown in Tab. 1. The Polish Year-I dataset includes 7027 samples with 64 attributes and 2 classes. Next, the Polish Year-I dataset contains 10173 samples with 64 attributes and 2 classes. Then, the Polish Year-III dataset comprises 10503 samples with 64 attributes and 2 classes.
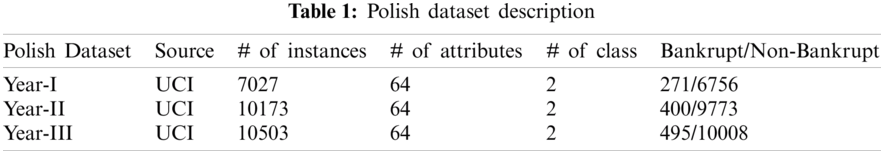
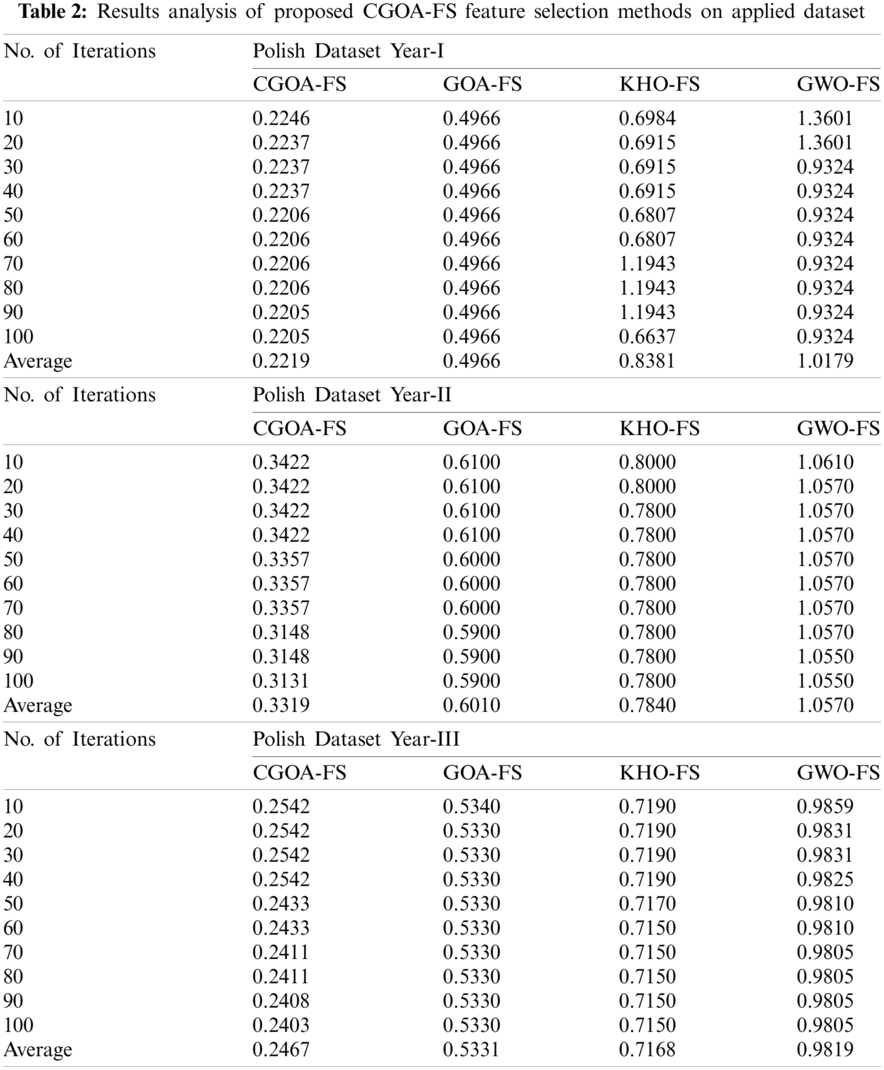
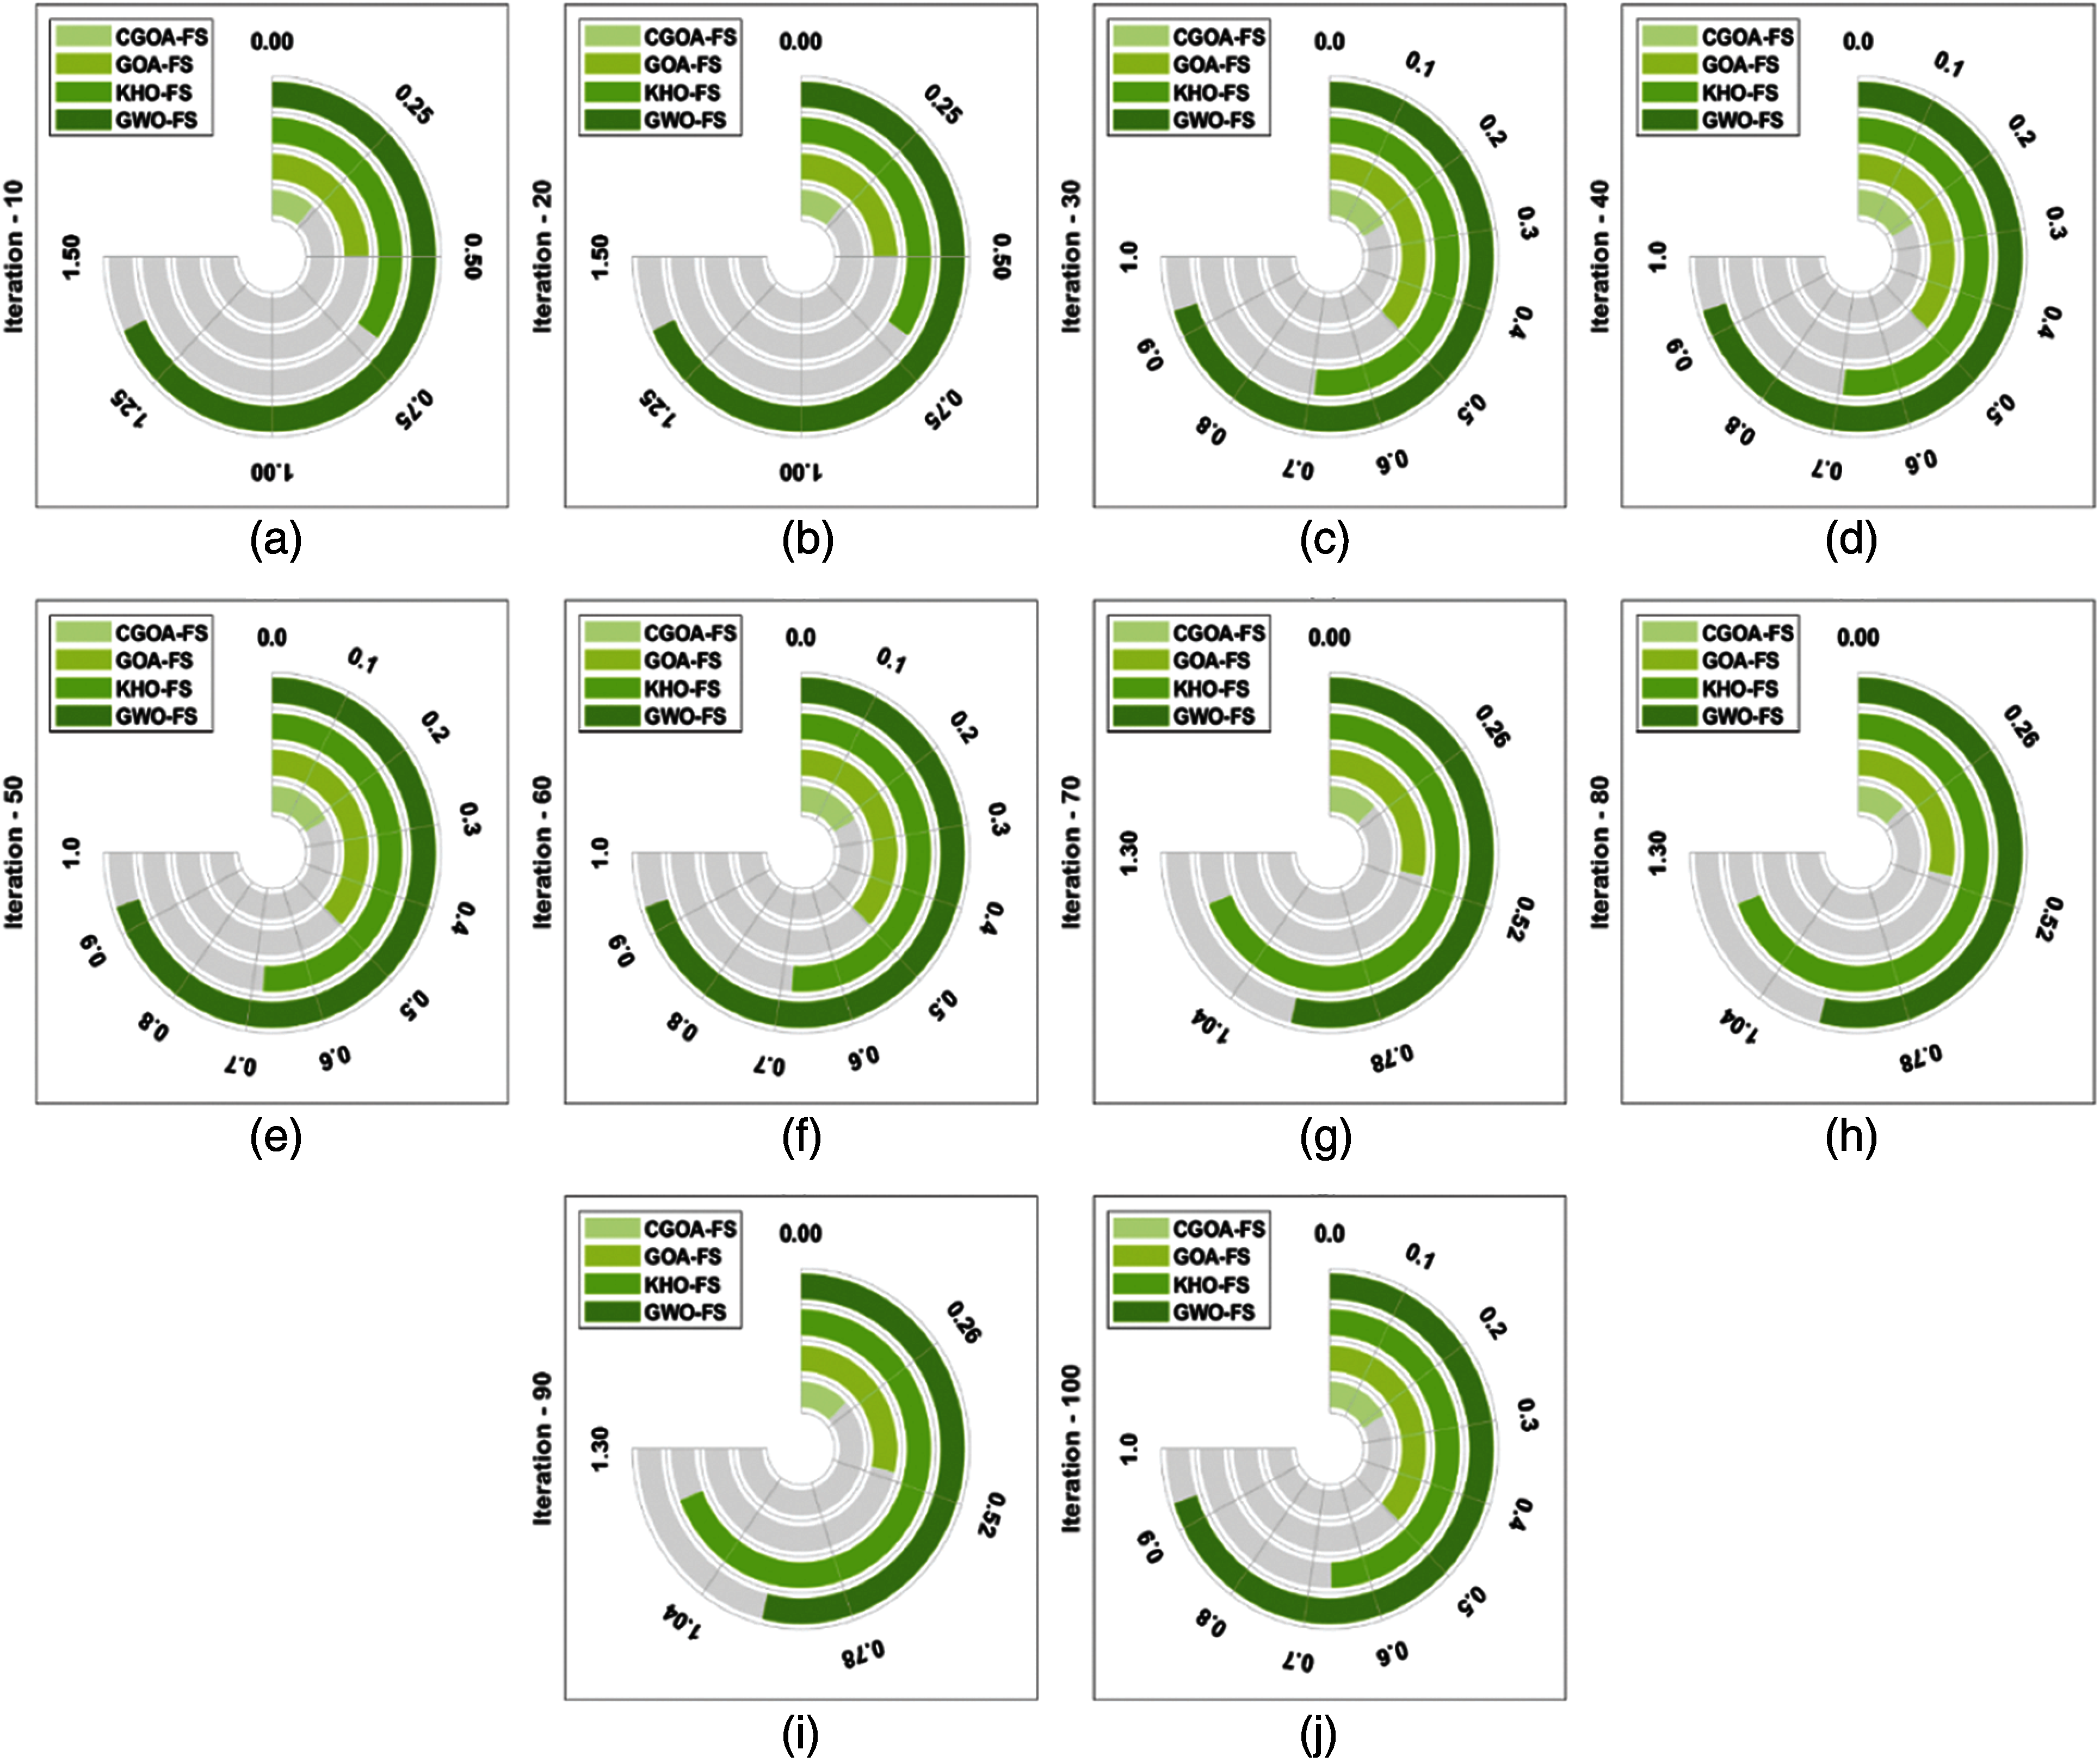
Figure 4: Best cost analysis of different iterations on polish dataset year-I (a) Iteration-10, (b) Iteration-20,..., (j) Iteration-100
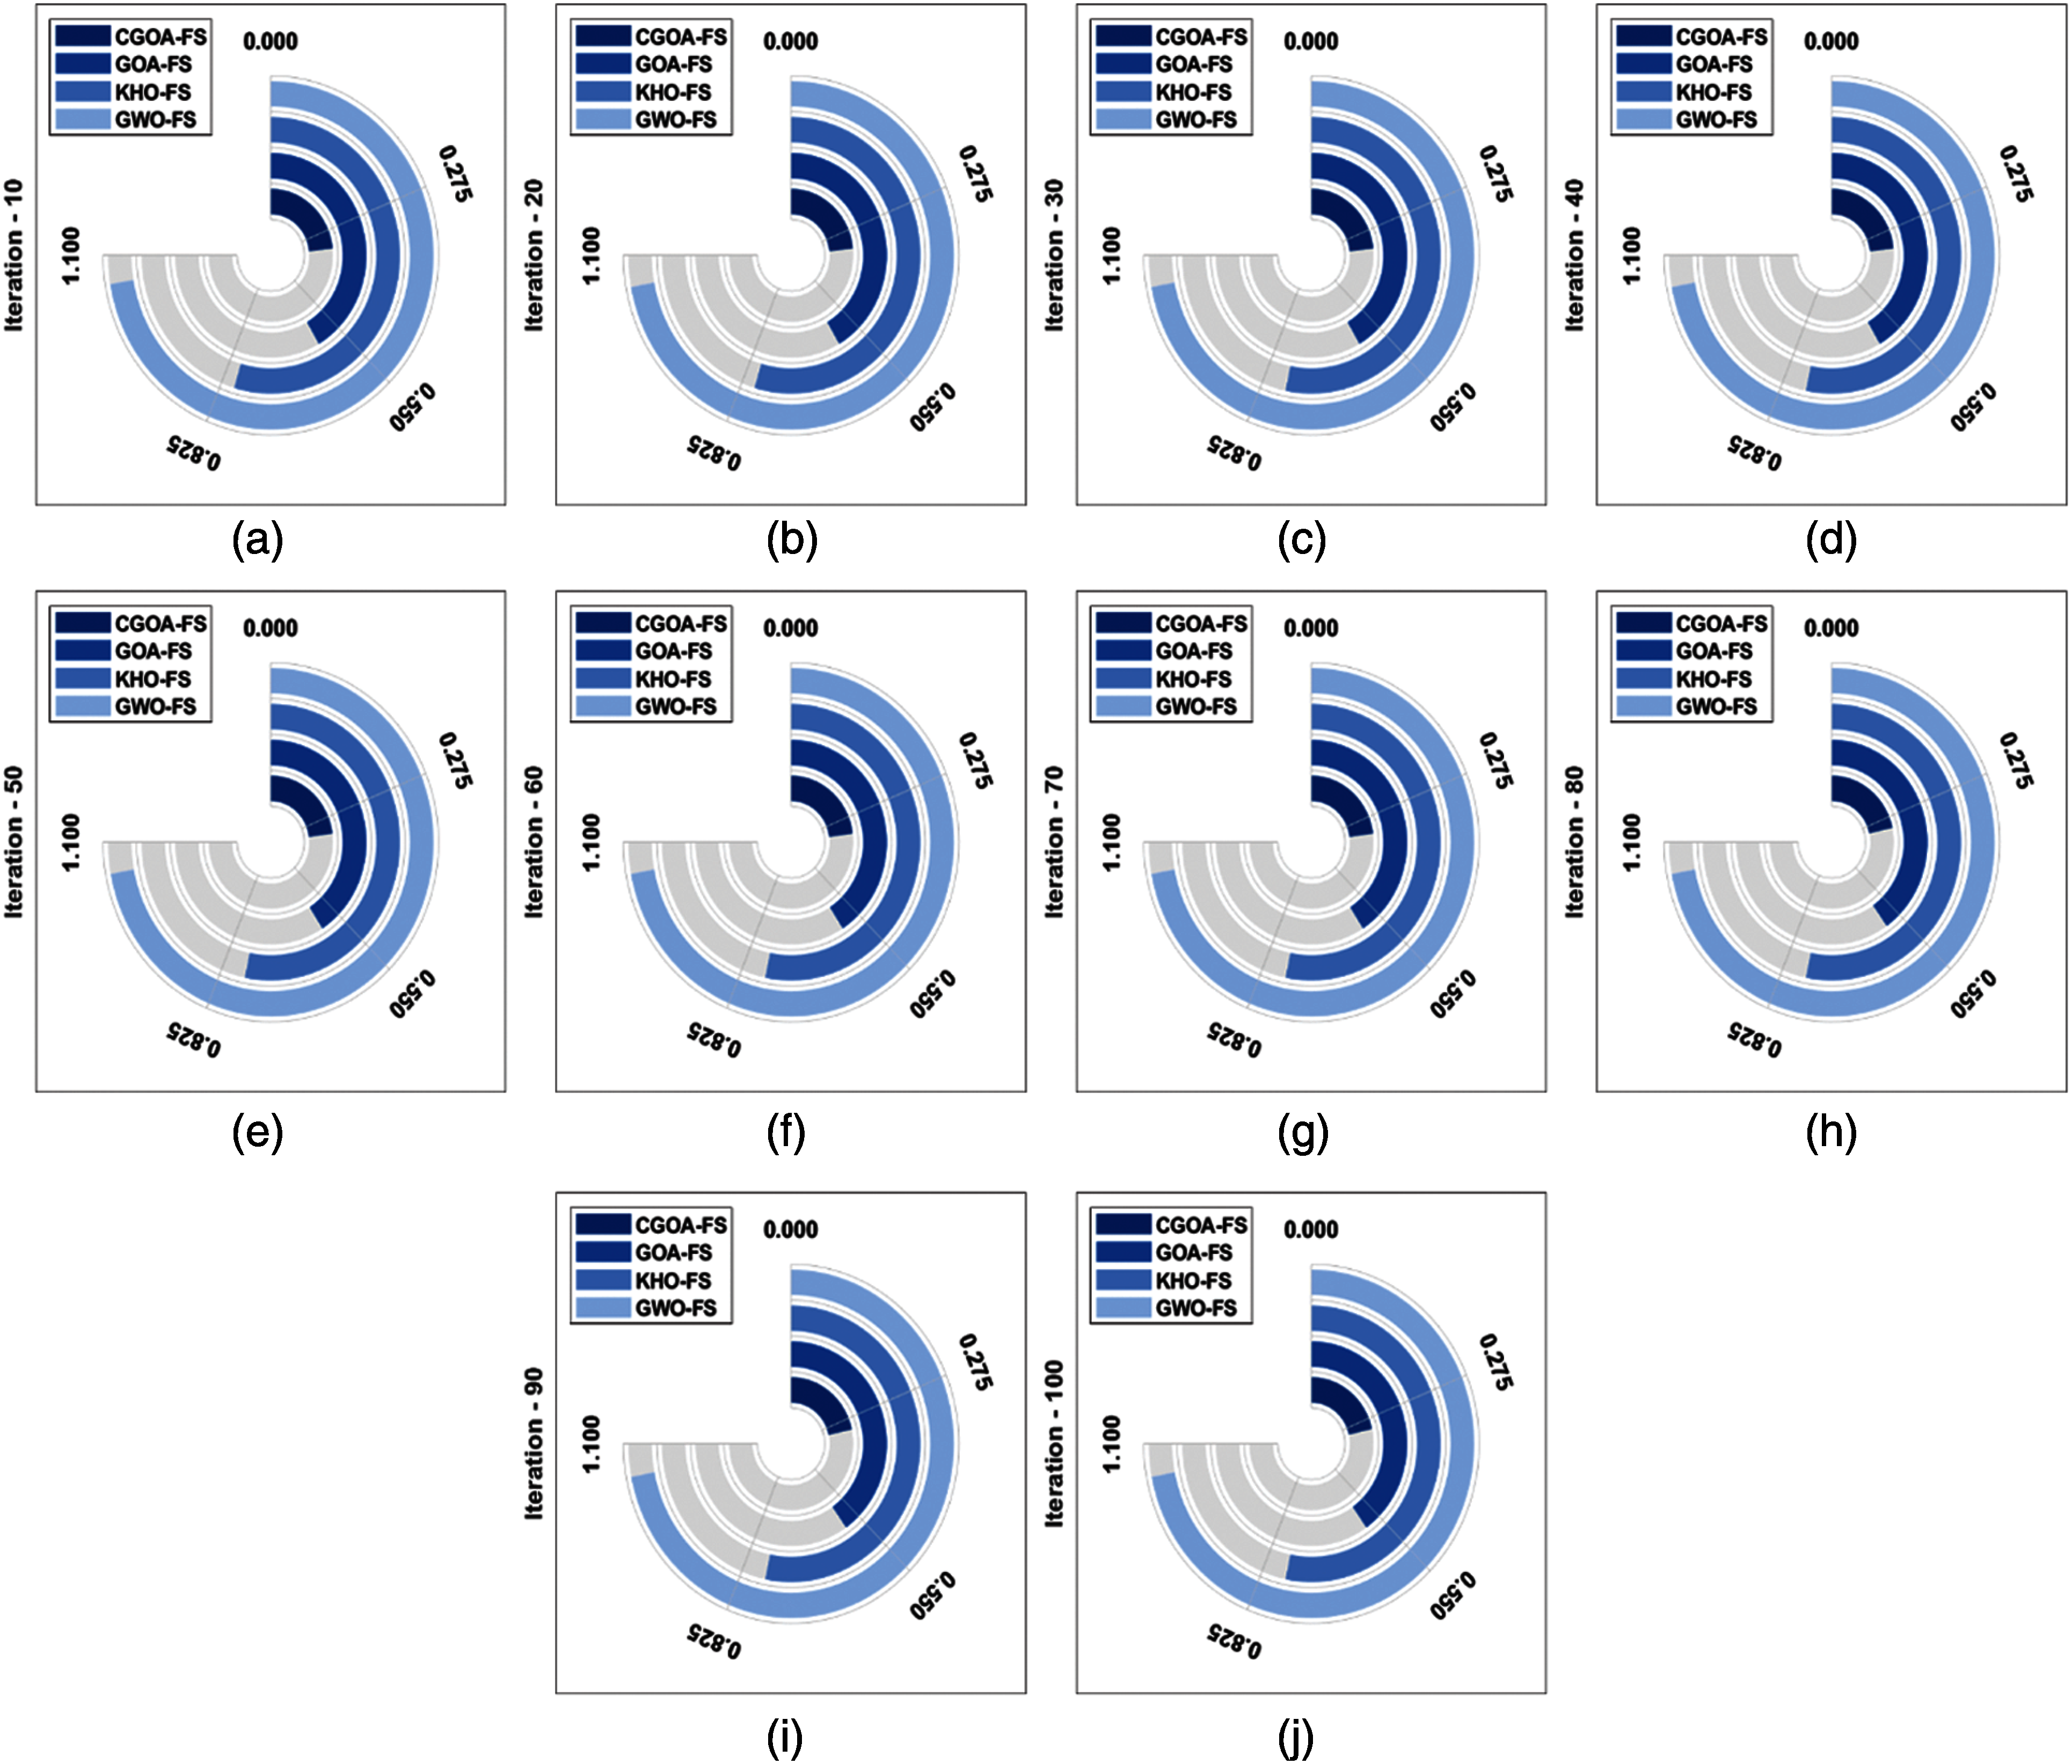
Figure 5: Best cost analysis of different iterations on polish dataset year-II (a) Iteration-10, (b) Iteration-20,..., (j) Iteration-100
Tab. 2 and Figs. 4–6 offers a brief result analysis of the CGOA-FS technique on the applied three datasets under ten iterations. On examining the performance on the Polish dataset year-I, it is apparent that the GWO-FS technique has accomplished poor performance with the average best cost of 1.0179. At the same time, the KHO-FS technique has gained slightly enhanced outcomes with an average best cost of 0.6984. Likewise, the GOA-FS technique has accomplished moderate performance with an average best cost of 0.4966. However, the CGOA-FS technique outperformed the existing techniques with the average best cost of 0.2246. On investigative the performance on the Polish dataset year-II, it can be clear that the GWO-FS approach has accomplished worse performance with the average best cost of 1.0570. Likewise, the KHO-FS manner has attained somewhat improved results with the average best cost of 0.7840. In line with, the GOA-FS method has accomplished moderate performance with the average best cost of 0.6010. But, the CGOA-FS technique demonstrated the recent approaches with the average best cost of 0.3319.
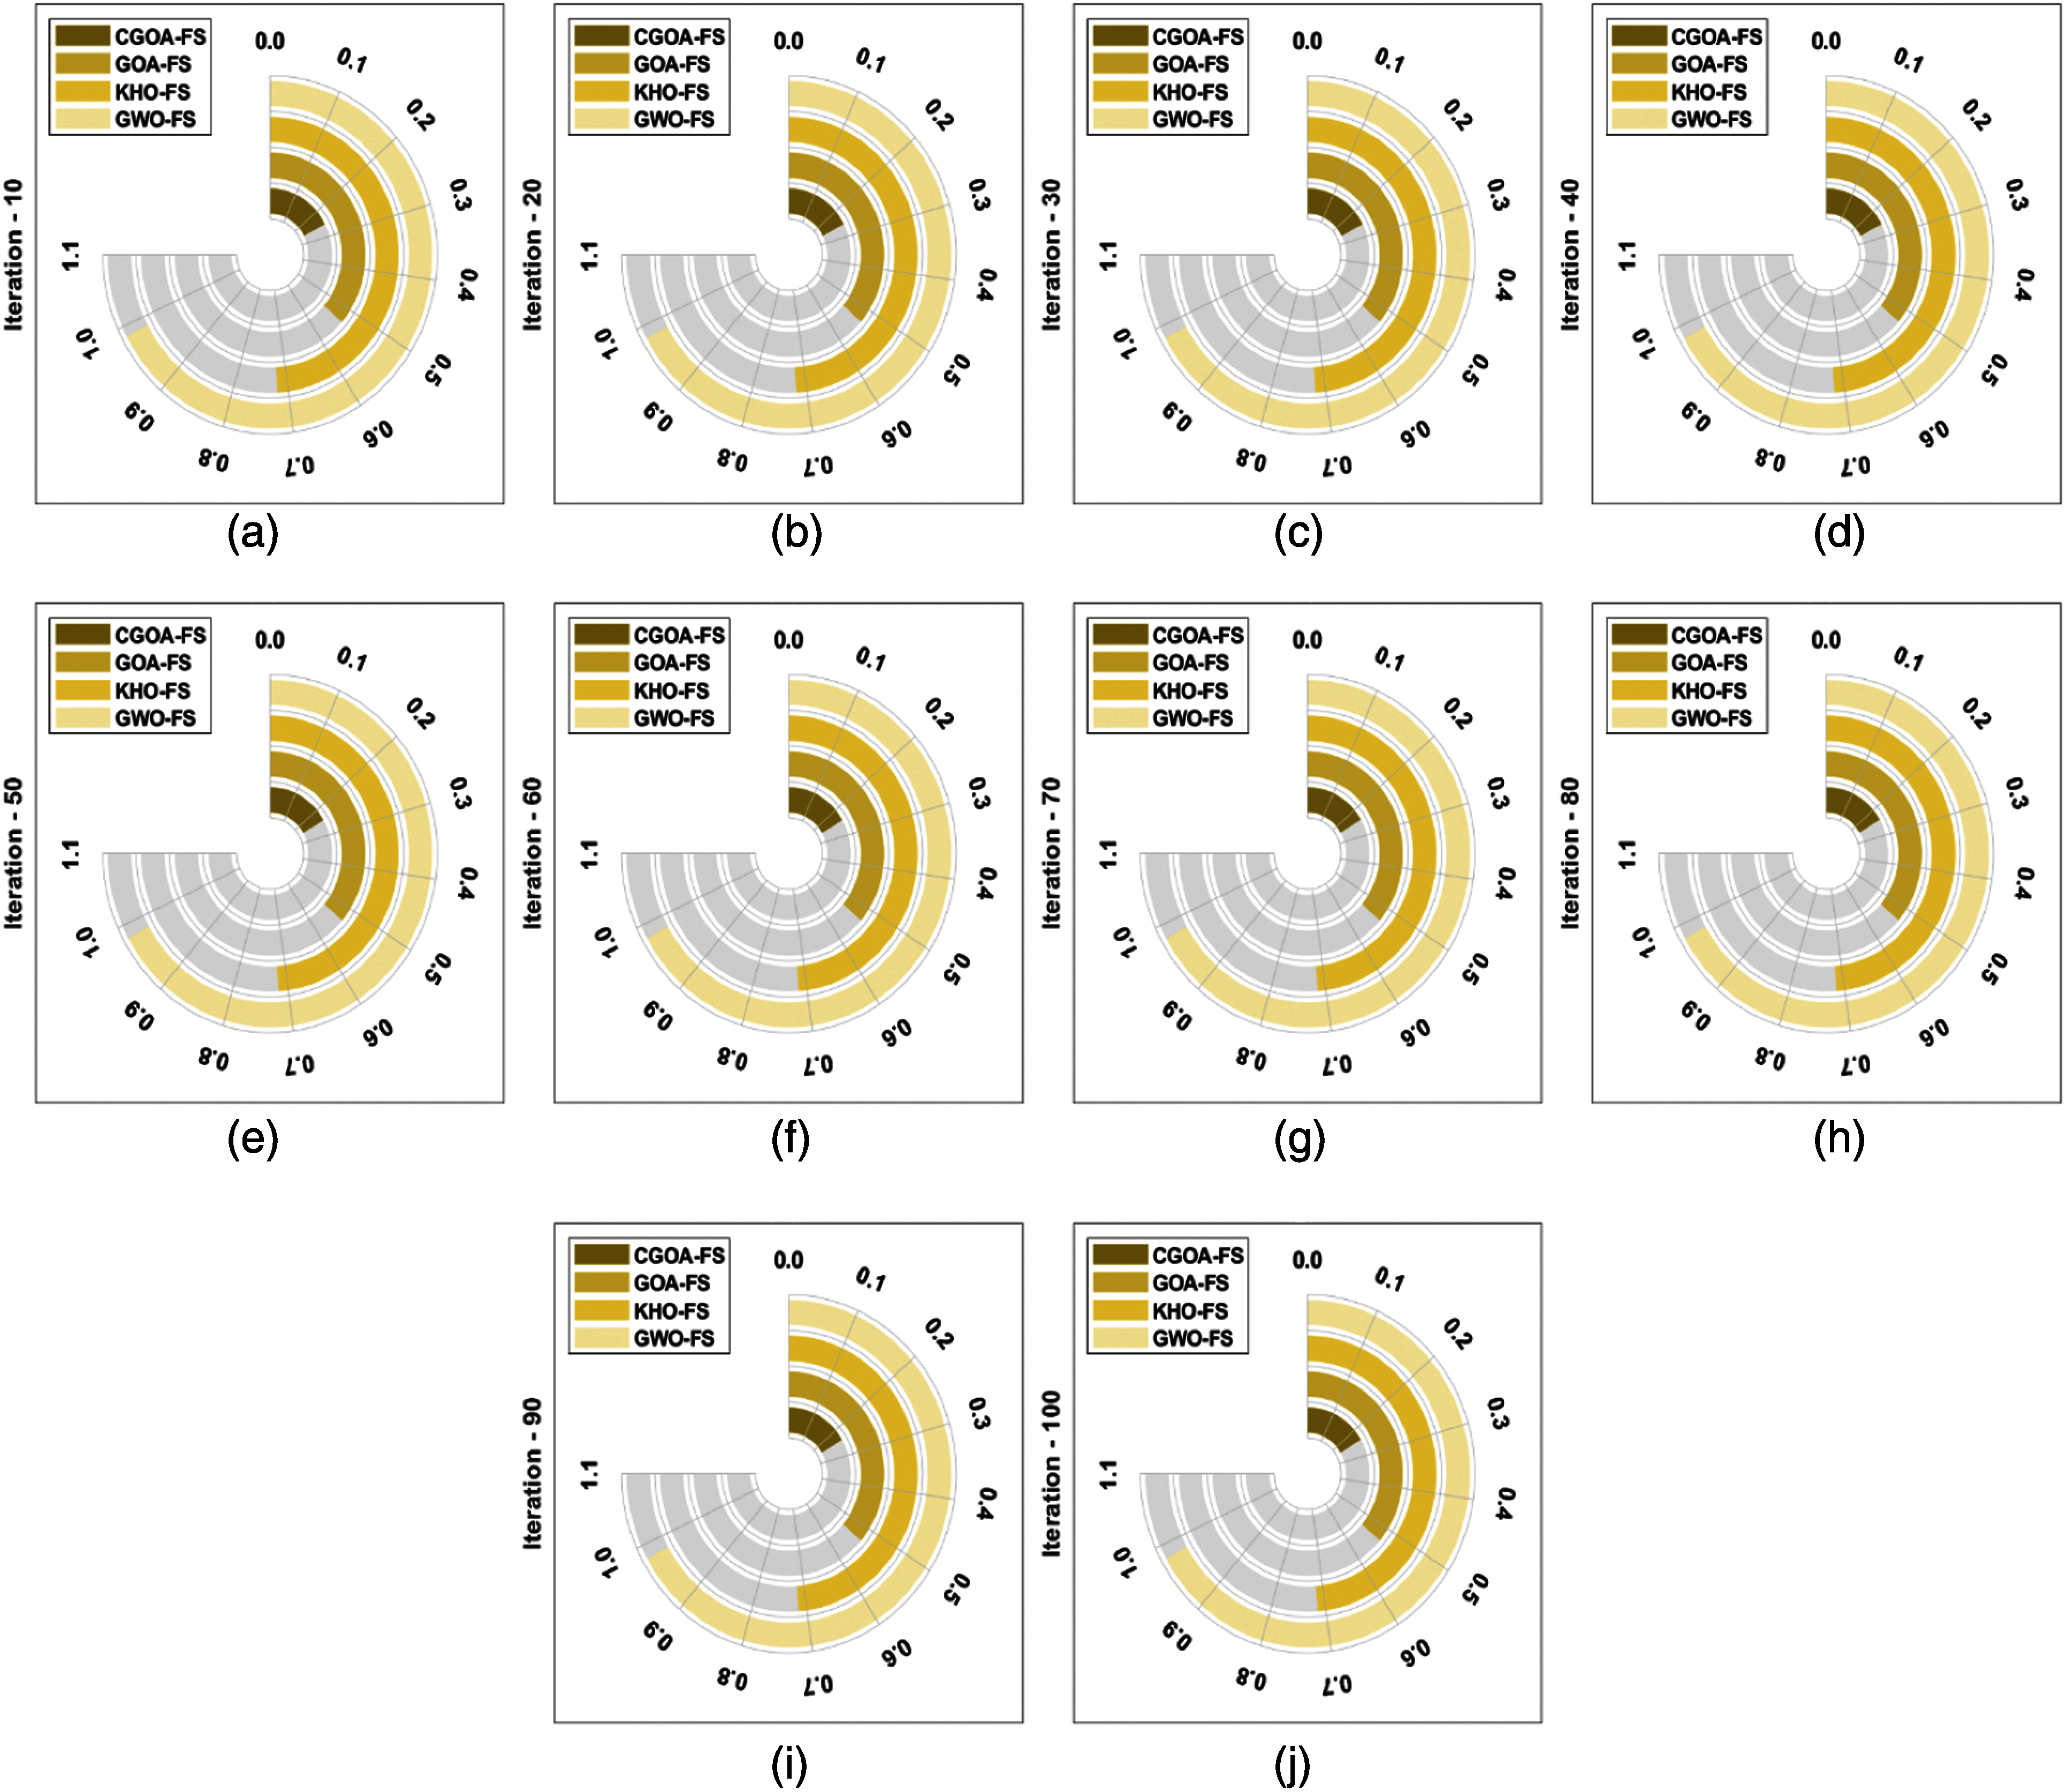
Figure 6: Best cost analysis of different iterations on polish dataset year-III (a) Iteration-10, (b) Iteration-20,..., (j) Iteration-100
On analyzing the performance on the Polish dataset year-III, it can be stated that the GWO-FS manner has accomplished least performance with the average best cost of 0.9819. Simultaneously, the KHO-FS manner has achieved slightly increased outcome with the average best cost of 0.7168. Also, the GOA-FS manner has accomplished moderate performance with the average best cost of 0.5331. Finally, the CGOA-FS approach outperformed the existing manners with the average best cost of 0.2467.
This paper has developed a new CGOA-FLNN-CSO algorithm to predict the financial status of the SMEs. The proposed model involves different processes such as preprocessing, CGOA based feature selection, FLNN based classification, and CSO based parameter tuning. The inclusion of CGOA algorithm for FS plays a vital role in the improved predictive performance. At the same time, the unique features of the FLNN model parameter tuning using CSO algorithm helps to considerably enhance the predictive performance. A detailed experimental validation process takes place on Polish dataset to ensure the performance of the presented model. The obtained simulation results verified the effectiveness of the presented model over the compared methods interms of best cost, sensitivity, specificity, accuracy, F-score, and Mathew Correlation Coefficient (MCC). The CGOA-FLNN-CSO model has accomplished maximum prediction accuracy of 98.830%, 92.100%, and 95.220% on the applied Polish dataset Year I-III respectively. In future, the predictive performance of the CGOA-FLNN-CSO algorithm can be extended by the use of outlier detection approaches.
Funding Statement: The authors extend their appreciation to the Deanship of Scientific Research at King Khalid University for funding this work under Grant Number (RGP 1/147/42), https://www.kku.edu.sa. This research was funded by the Deanship of Scientific Research at Princess Nourah bint Abdulrahman University through the Fast-Track Path of Research Funding Program.
Conflicts of Interest: The authors declare that they have no conflicts of interest to report regarding the present study.
1. G. Kou, Y. Xu, Y. Peng, F. Shen, Y. Chen et al., “Bankruptcy prediction for SMEs using transactional data and two-stage multiobjective feature selection,” Decision Support Systems, vol. 140, no. 4, pp. 113429, 2021. [Google Scholar]
2. S. Agrawal, S. Sarkar, G. Srivastava, P. K. Reddy Maddikunta and T. R. Gadekallu, “Genetically optimized prediction of remaining useful life, Sustainable Computing,” Informatics and Systems, vol. 31, pp. 100565, 2021. [Google Scholar]
3. G. X. Yuan, H. Wang, T. Zeng, T. Wu, S. Gao et al., “The dynamical mechanism for SMEs evolution under the hologram approach,” SSRN Electronic Journal, vol. 13, no. 5, pp. 296, 2019. [Google Scholar]
4. R. Kaluri, D. Singh Rajput, Q. Xin, K. Lakshmanna, S. Bhattacharya et al., “Roughsets-based approach for predicting battery life in IoT,” Intelligent Automation & Soft Computing, vol. 27, no. 2, pp. 453–469, 2021. [Google Scholar]
5. E. I. Altman and G. Sabato, “Modelling credit risk for SMEs: Evidence from the U.S. market,” Abacus-a Journal of Accounting Finance and Business Studies, vol. 43, no. 3, pp. 332–357, 2007. [Google Scholar]
6. F. Ciampi and N. Gordini, “Small enterprise default prediction modeling through artificial neural networks: An empirical analysis of italian small enterprises,” Journal of Small Business Management, vol. 51, no. 1, pp. 23–45, 2013. [Google Scholar]
7. E. B. Hansen and S. Bøgh, “Artificial intelligence and internet of things in small and medium-sized enterprises: A survey,” Journal of Manufacturing Systems, vol. 58, no. 1, pp. 362–372, 2021. [Google Scholar]
8. J. Uthayakumar, N. Metawa, K. Shankar and S. K. Lakshmanaprabu, “Financial crisis prediction model using ant colony optimization,” Int. Journal of Information Management, vol. 50, no. 5, pp. 538–556, 2020. [Google Scholar]
9. Z. Huang, H. Chen, C. J. Hsu, W. H. Chen and S. Wu, “Credit rating analysis with support vector machines and neural networks: A market comparative study,” Decision Support Systems, vol. 37, no. 4, pp. 543–558, 2004. [Google Scholar]
10. M. A. E. Aziz and A. E. Hassanien, “Modified cuckoo search algorithm with rough sets for feature selection,” Neural Computing and Applications, vol. 29, no. 4, pp. 925–934, 2018. [Google Scholar]
11. E. Gregova, K. Valaskova, P. Adamko, M. Tumpach and J. Jaros, “Predicting financial distress of slovak enterprises: Comparison of selected traditional and learning algorithms methods,” Sustainability, vol. 12, no. 10, pp. 3954, 2020. [Google Scholar]
12. D. Yazdanfar and P. Öhman, “Financial distress determinants among SMEs: Empirical evidence from Sweden,” Journal of Economic Studies, vol. 47, no. 3, pp. 547–560, 2020. [Google Scholar]
13. Z. Lu, J. Liu and M. Jiang, “The application of the integrated machine learning model in the financial crisis of imbalanced samples,” IOP Conf. Series: Materials Science and Engineering, vol. 790, pp. 012049, 2020. [Google Scholar]
14. H. Shang, D. Lu and Q. Zhou, “Early warning of enterprise finance risk of big data mining in internet of things based on fuzzy association rules,” Neural Computing and Applications, vol. 33, no. 9, pp. 3901–3909, 2021. [Google Scholar]
15. N. Metawa, P. T. Nguyen, Q. L. H. T. T. Nguyen, M. Elhoseny and K. Shankar, “Internet of things enabled financial crisis prediction in enterprises using optimal feature subset selection-based classification model,” Big Data, pp. 1–16, 2021. http://doi.org/10.1089/big.2020.0192. [Google Scholar]
16. A. Ptak-Chmielewska, “Bankruptcy prediction of small- and medium-sized enterprises in Poland based on the LDA and SVM methods,” Statistics in Transition New Series, vol. 22, no. 1, pp. 179–195, 2021. [Google Scholar]
17. G. Perboli and E. Arabnezhad, “A machine learning-based DSS for mid and long-term company crisis prediction,” Expert Systems with Applications, vol. 174, no. 4, pp. 114758, 2021. [Google Scholar]
18. A. Malakauskas and A. Lakštutienė, “Financial distress prediction for small and medium enterprises using machine learning techniques,” Engineering Economics, vol. 32, no. 1, pp. 4–14, 2021. [Google Scholar]
19. Z. Luo, P. Hsu and N. Xu, “SME default prediction framework with the effective use of external public credit data,” Sustainability, vol. 12, no. 18, pp. 7575, 2020. [Google Scholar]
20. S. Saremi, S. Mirjalili, S. Mirjalili and J. S. Dong, “Grasshopper optimization algorithm: Theory, literature review, and application in hand posture estimation,” Nature-inspired optimizers, Studies in Computational Intelligence book series (SCI, volume 811). New York City, NY, USA, pp. 107–122, 2019. [Google Scholar]
21. S. Saremi, S. Mirjalili and A. Lewis, “Grasshopper optimisation algorithm: Theory and application,” Advances in Engineering Software, vol. 105, pp. 30–47, 2017. [Google Scholar]
22. S. Dwivedi, M. Vardhan and S. Tripathi, “An effect of chaos grasshopper optimization algorithm for protection of network infrastructure,” Computer Networks, vol. 176, no. 4, pp. 107251, 2020. [Google Scholar]
23. M. Mafarja, I. Aljarah, H. Faris, A. I. Hammouri, A. M. Al-Zoubi et al., “Binary grasshopper optimisation algorithm approaches for feature selection problems,” Expert Systems with Applications, vol. 117, no. 3, pp. 267–286, 2019. [Google Scholar]
24. A. Khan, J. Bukhari, J. I. Bangash, A. Khan, M. Imran et al., “Optimizing connection weights of functional link neural network using APSO algorithm for medical data classification,” Journal of King Saud University-Computer and Information Sciences, vol. 60, no. 1, pp. 769, 2020. [Google Scholar]
25. A. M. Ahmed, T. A. Rashid and S. Ab M. Saeed, “Cat swarm optimization algorithm: A survey and performance evaluation,” Computational Intelligence and Neuroscience, vol. 2020, no. 1, pp. 1–20, 2020. [Google Scholar]
26. Dataset, 2016. [Online]. Available: https://archive.ics.uci.edu/ml/datasets/Polish+companies+bankruptcy+data. [Google Scholar]
 | This work is licensed under a Creative Commons Attribution 4.0 International License, which permits unrestricted use, distribution, and reproduction in any medium, provided the original work is properly cited. |