DOI:10.32604/cmc.2022.021268
| Computers, Materials & Continua DOI:10.32604/cmc.2022.021268 | |
| Article |
Forecasting E-Commerce Adoption Based on Bidirectional Recurrent Neural Networks
1Community college, Jazan University, Jazan, Kingdom of Saudi Arabia
2Department of Communications and Electronics, Delta Higher Institute of Engineering and Technology, Mansoura, 35111, Egypt
*Corresponding Author: Abdullah Ali Salamai. Email: abSalamai@jazanu.edu.sa
Received: 28 June 2021; Accepted: 03 August 2021
Abstract: E-commerce refers to a system that allows individuals to purchase and sell things online. The primary goal of e-commerce is to offer customers the convenience of not going to a physical store to make a purchase. They will purchase the item online and have it delivered to their home within a few days. The goal of this research was to develop machine learning algorithms that might predict e-commerce platform sales. A case study has been designed in this paper based on a proposed continuous Stochastic Fractal Search (SFS) based on a Guided Whale Optimization Algorithm (WOA) to optimize the parameter weights of the Bidirectional Recurrent Neural Networks (BRNN). Furthermore, a time series dataset is tested in the experiments of e-commerce demand forecasting. Finally, the results were compared to many versions of the state-of-the-art optimization techniques such as the Particle Swarm Optimization (PSO), Whale Optimization Algorithm (WOA), and Genetic Algorithm (GA). A statistical analysis has proven that the proposed algorithm can work significantly better by statistical analysis test at the P-value less than 0.05 with a one-way analysis of variance (ANOVA) test applied to confirm the performance of the proposed ensemble model. The proposed Algorithm achieved a root mean square error of RMSE (0.0000359), Mean (0.00003593) and Standard Deviation (0.000002162).
Keywords: Neural networks; e-commerce; forecasting; risk management; machine learning
Ecommerce has a lot of potential as a new business paradigm for the twenty-first century. E-commerce development has achieved a unique high point in terms of economic growth [1]. The e-commerce business is expanding at a breakneck speed. According to Statista, by 2021, the market is anticipated to be worth $4.88 trillion. One of the most challenging tasks for e-commerce firms is determining the best pricing for all of the items on the platform daily to optimize revenue and profitability. The eCommerce industry is dynamic, and demand may swing significantly from one day to the next. As a result, retailers and wholesalers must be agile enough to adapt quickly to changes in client demand [2]. Simply responding to market changes isn’t enough; you could run out of goods to meet a rise in order, or you might miss out entirely on a trend. To stay one step ahead of the game, you must be proactive in predicting changes.
The statistical regression model and the machine learning model are two types of e-commerce transaction volume forecast methods that have been developed. As opposed to statistical regression models, machine learning models have a high level of data adaptability and nonlinear fitting ability, making them attractive [3]. We will discover any hidden trends, outliers, points of interest (POI), and much more with the capacity to forecast utilizing machine learning algorithms for e-commerce. This will enable e-commerce to detect the critical information in each element correctly. They will analyze all of their data, including the quantity of the product purchased, product categories, payment method, interest rate, delivery time, and client location, to better understand and manage their sales.
The purpose and main contribution of the analysis can be discussed as follow:
• The goal of this research was to develop machine learning algorithms that might predict e-commerce platform sales.
• A case study has been developed using a proposed continuous Stochastic Fractal Search (SFS) based on a Guided Whale Optimization Algorithm (WOA) to optimize the parameter weights of the Bidirectional Recurrent Neural Networks (BRNN).
• An SFS is a mainly adaptive dynamic for whale optimization algorithm WOA parameters
• Dataset of time series is tested in the experiments.
• Compared to many versions of the-state-of-the-art optimization techniques
• To conclude the performance of the proposed ensemble model based on the continuous SFS-Guided WOA algorithm and the compared models, a one-way analysis of variance (ANOVA) test is applied.
As the analysis discussed above, this paper was based on a study of solutions and models for forecast the sales of e-commerce.
Sales forecasting is a critical activity that must be completed by e-commerce, and the forecasting will have a significant influence on the corporate decision-making process. They can better understand their financial situation to manage the workforce by having sales predictions for the e-commerce platform. Still, they can also better understand their financial status by having sales predictions for the e-commerce platform and further improving their economic status supply chain management system. Based on [4], A sales forecast helps an e-commerce platform anticipate sales with more precision and reliability, which aids inventory planning, competitive pricing, and timely marketing tactics. According to [5], Predicting e-commerce sales helps you better understand the e-commerce platform’s lifecycle, including sales and growth, stability, and decline, and how sales are influenced by short-term product goals like promotion, pricing, season, and season online ranking.
The most frequent approach for predicting sales is to use time series analysis. The Autoregressive function is used in time series analysis to aid in any sort of prediction study. According to [6], Sales prediction is a current business intelligence approach, according to a survey of the machine learning model for sales time series forecasting.
Another study was done by [7], which looked at the sales prediction for Amazon sales using several statistical methodologies. This study primarily focused on Amazon data to forecast future sales using previous data and statistical algorithms.
Reference [8] performed research on automobile sales forecast using a machine learning algorithm. The focus of this study is on vehicle sales data and how it is obtained from diverse sources. The researcher found two key issues: getting a diverse understanding of how well the various criteria in our dataset function and determining the proper method which can be used.
The significant risk–client defaults during credit sales operations in E-commerce–is examined, and risk transfer mechanisms and preliminary risk management research. Companies can minimize the risk of credit sales operations by improving the management and control of credit sales before, during, and after the sale, combined with the credit insurance tool and other risk transfer tools in E-commerce.
Generally, ML can be classified into four categories; supervised, unsupervised, semi-supervised, and reinforcement learning. The machine-learned the previous data and knowledge feedback to predict the events with its corresponding class labels in supervised learning. The input data in supervised learning are called instances, and the value of these data are called features. The significant tasks of supervised learning algorithms are the classification and regression tasks. Unsupervised learning discovers the hidden patterns in the unlabeled data and permits modelling probability densities over the features. The primary mission for unsupervised learning is clustering and dimensionality reduction. Semi-supervised learning For both labelled data and unlabeled data, it must be used [9–15].
Semi-supervised learning algorithms. We can say that semi-supervised learning collects a minor quantity ratio of labelled data and an excellent quantity ratio of unlabeled data. Generative models, whichever an allowance of supervised learning or unsupervised learning, define whether the unlabeled data is lessening or growing the performance. Finally, Reinforcement learning is goal-oriented learning and interacting with the surrounding environment. Fig. 1 shows the machine learning categorization.
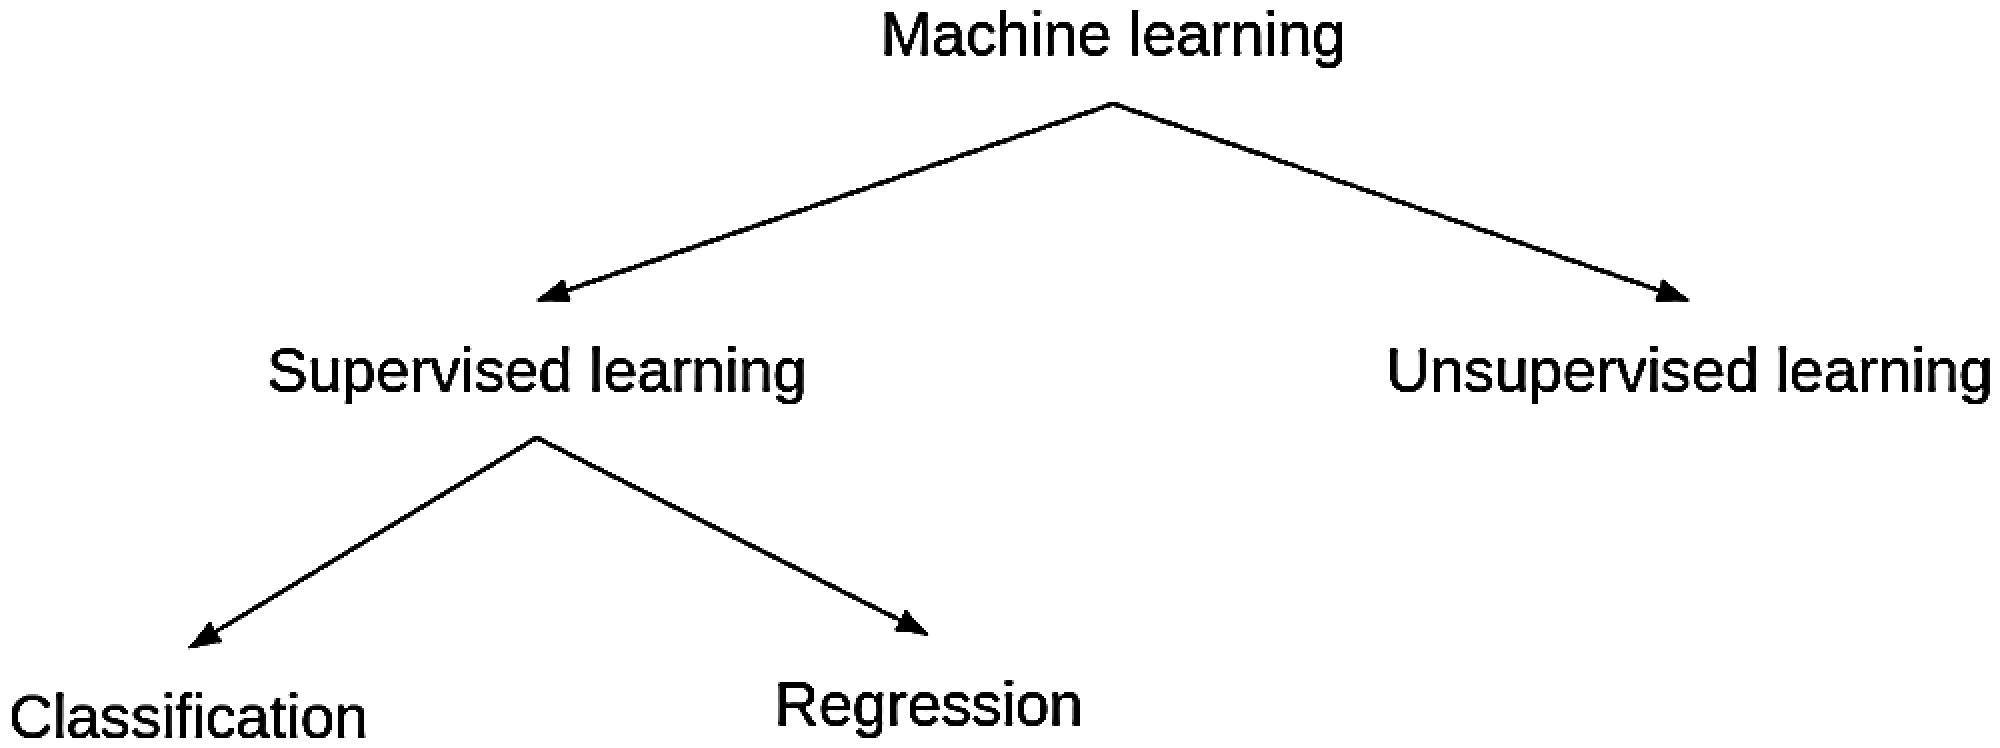
Figure 1: Machine learning categorization
In traditional NNs, there are three layers: input, hidden, and output. Each layer is made up of neurons that are linked to the layers above and below it. The inputs are multiplied by a set of weights updated regularly for each enrollment input data to be tailored. The summation of the inputs multiplied by the updated weights is the processing element, followed by transformation or activation. It may be a Relu function. In deep neural networks, the hidden layer of most network designs is generally multilayer hidden levels built to be carefully learned with the properties of input [16]. Fig. 2 shows a neural network architecture.
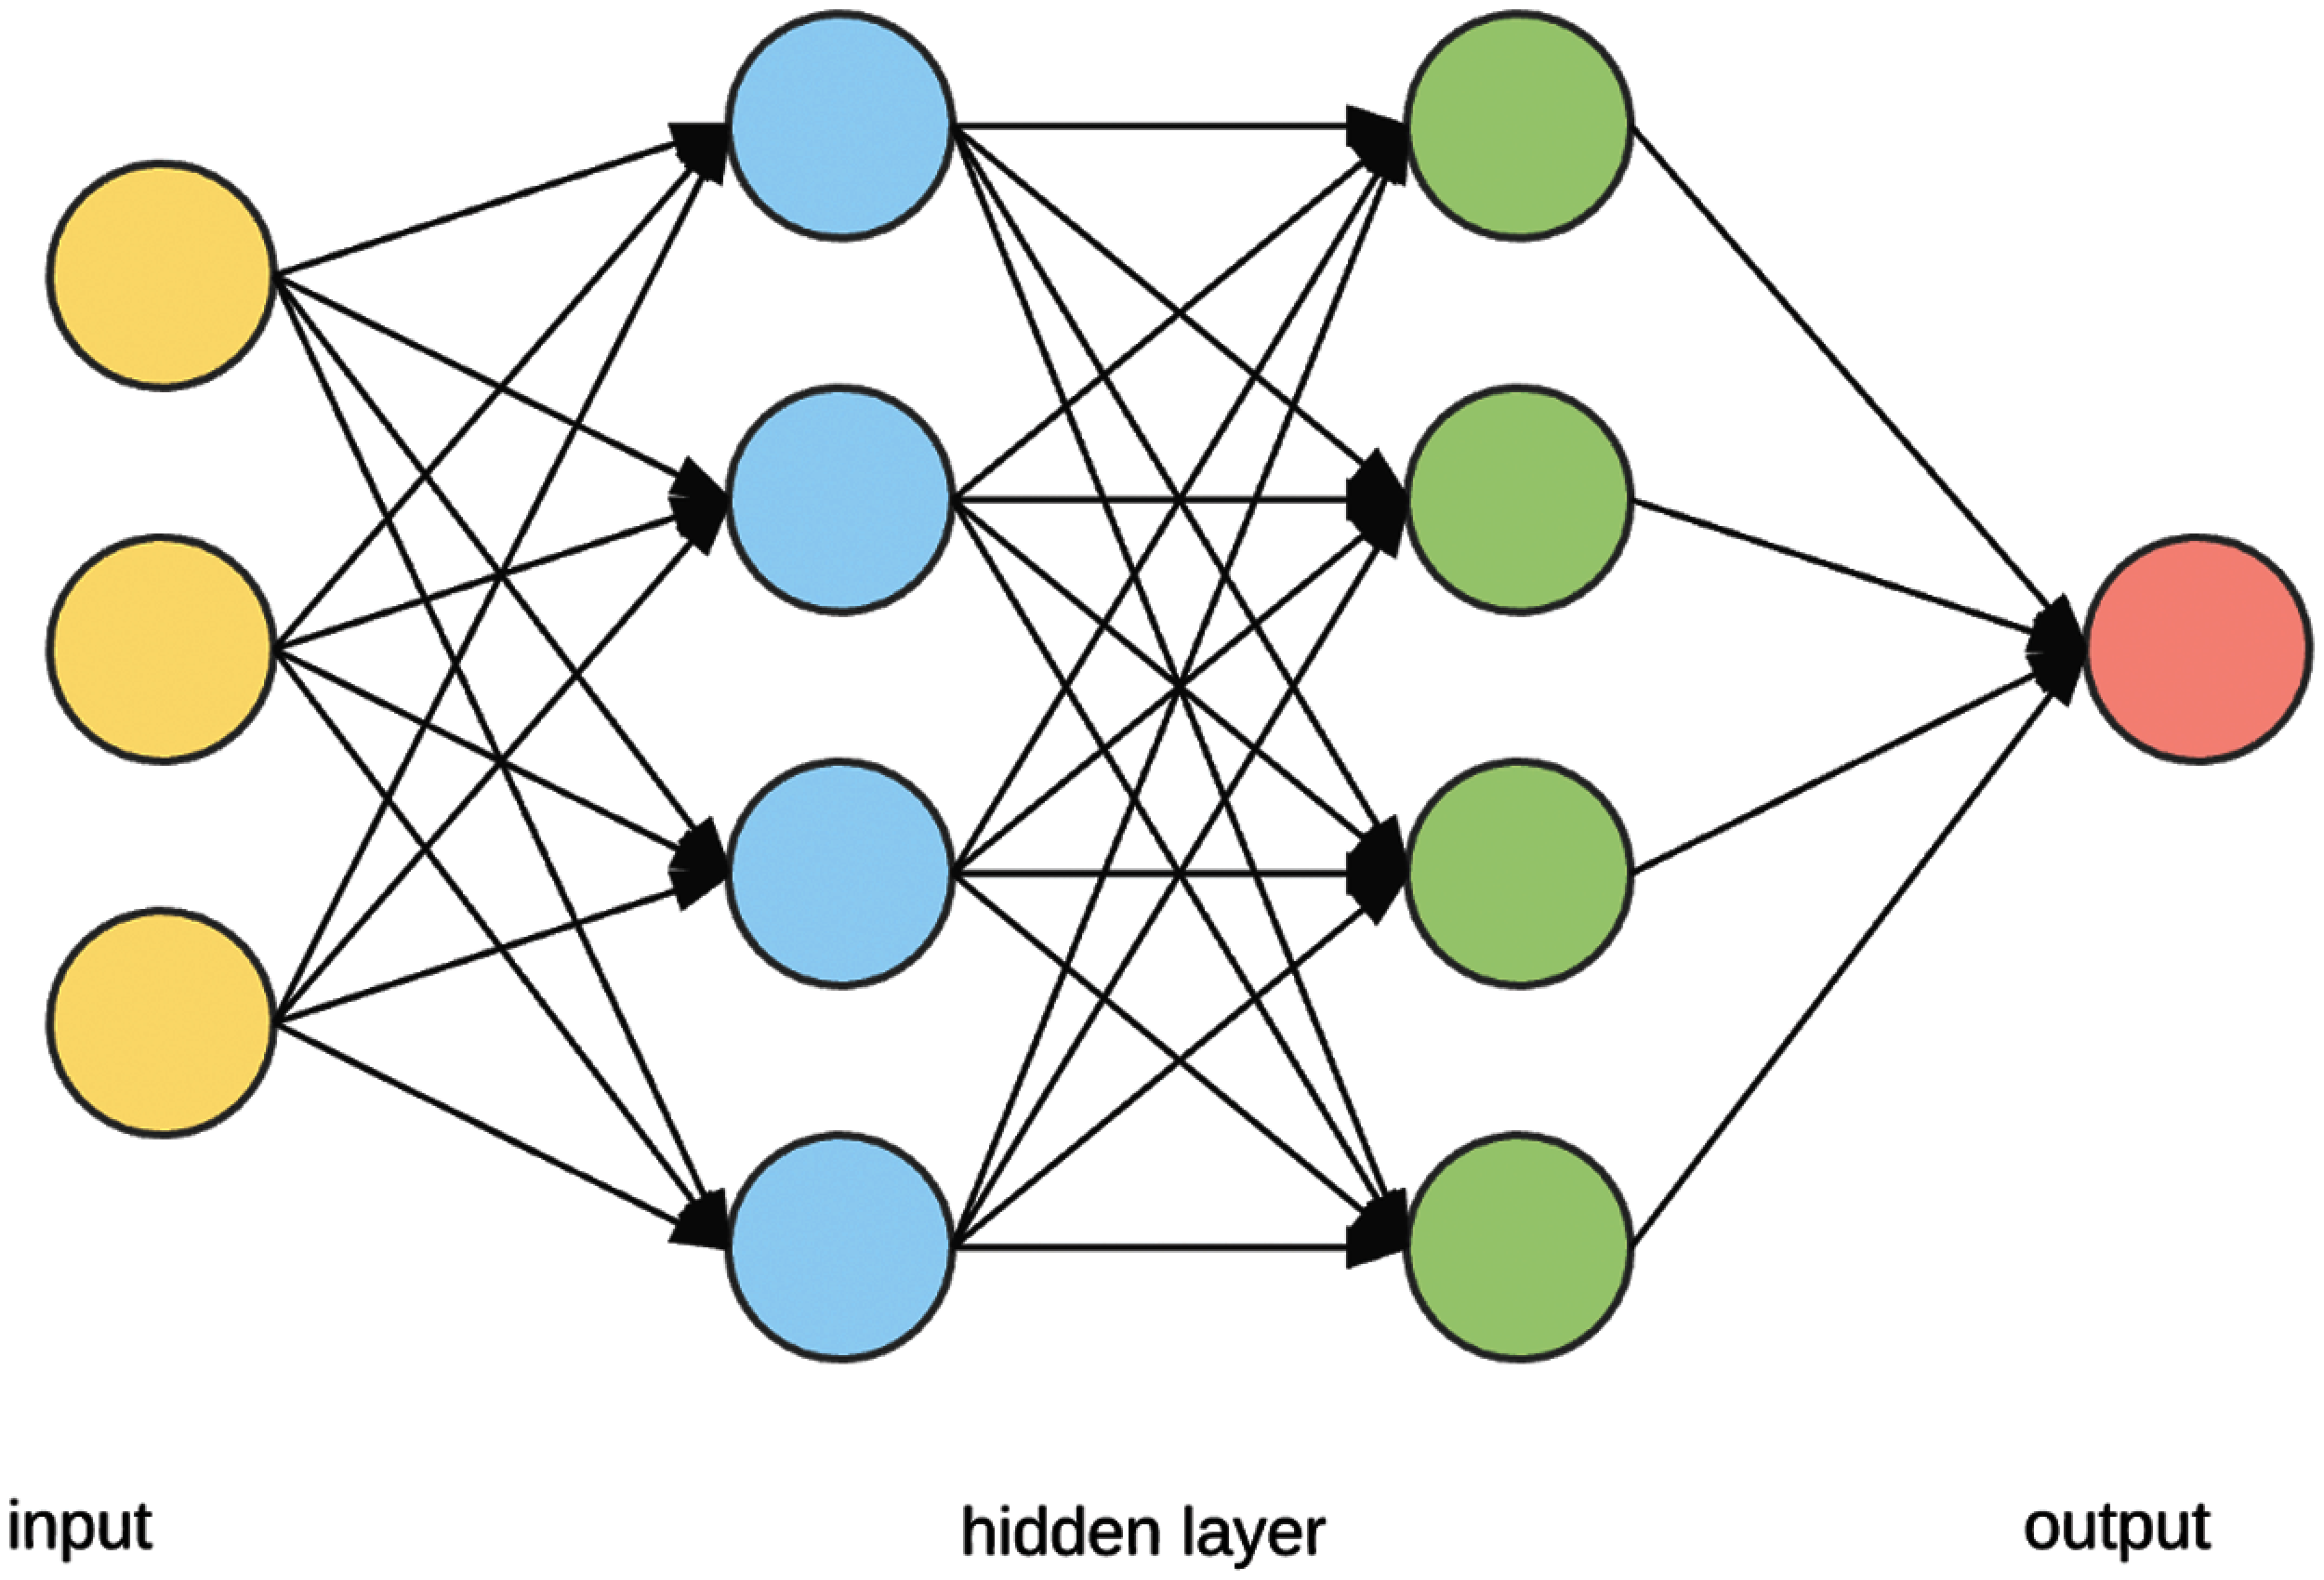
Figure 2: Neural network architecture
Nowadays, real-world optimization troubles are complicated with high dimensional search areas and therefore testing to address. Heuristic Optimization techniques have been applied in several places. Meta-heuristics are family members of approximate optimization techniques that offer acceptable solutions in a reasonable time. They are adopted for resolving challenging and complex troubles in science as well as engineering.
Population-based metaheuristics involve using multiple candidates (multiple solutions), Cooperate to achieve the global goal, and avoiding local optima; the main fundamental processes of population-based metaheuristics are exploration and exploitation. Exploration is the process of finding good points in the search space, whereas exploitation is finding better points near reasonable solutions found so far. Achieving a proper trade-off between exploration and exploitation is considered the essential part of the design of metaheuristic [17]. Fig. 3 shows the classification of meta-heuristic algorithms.
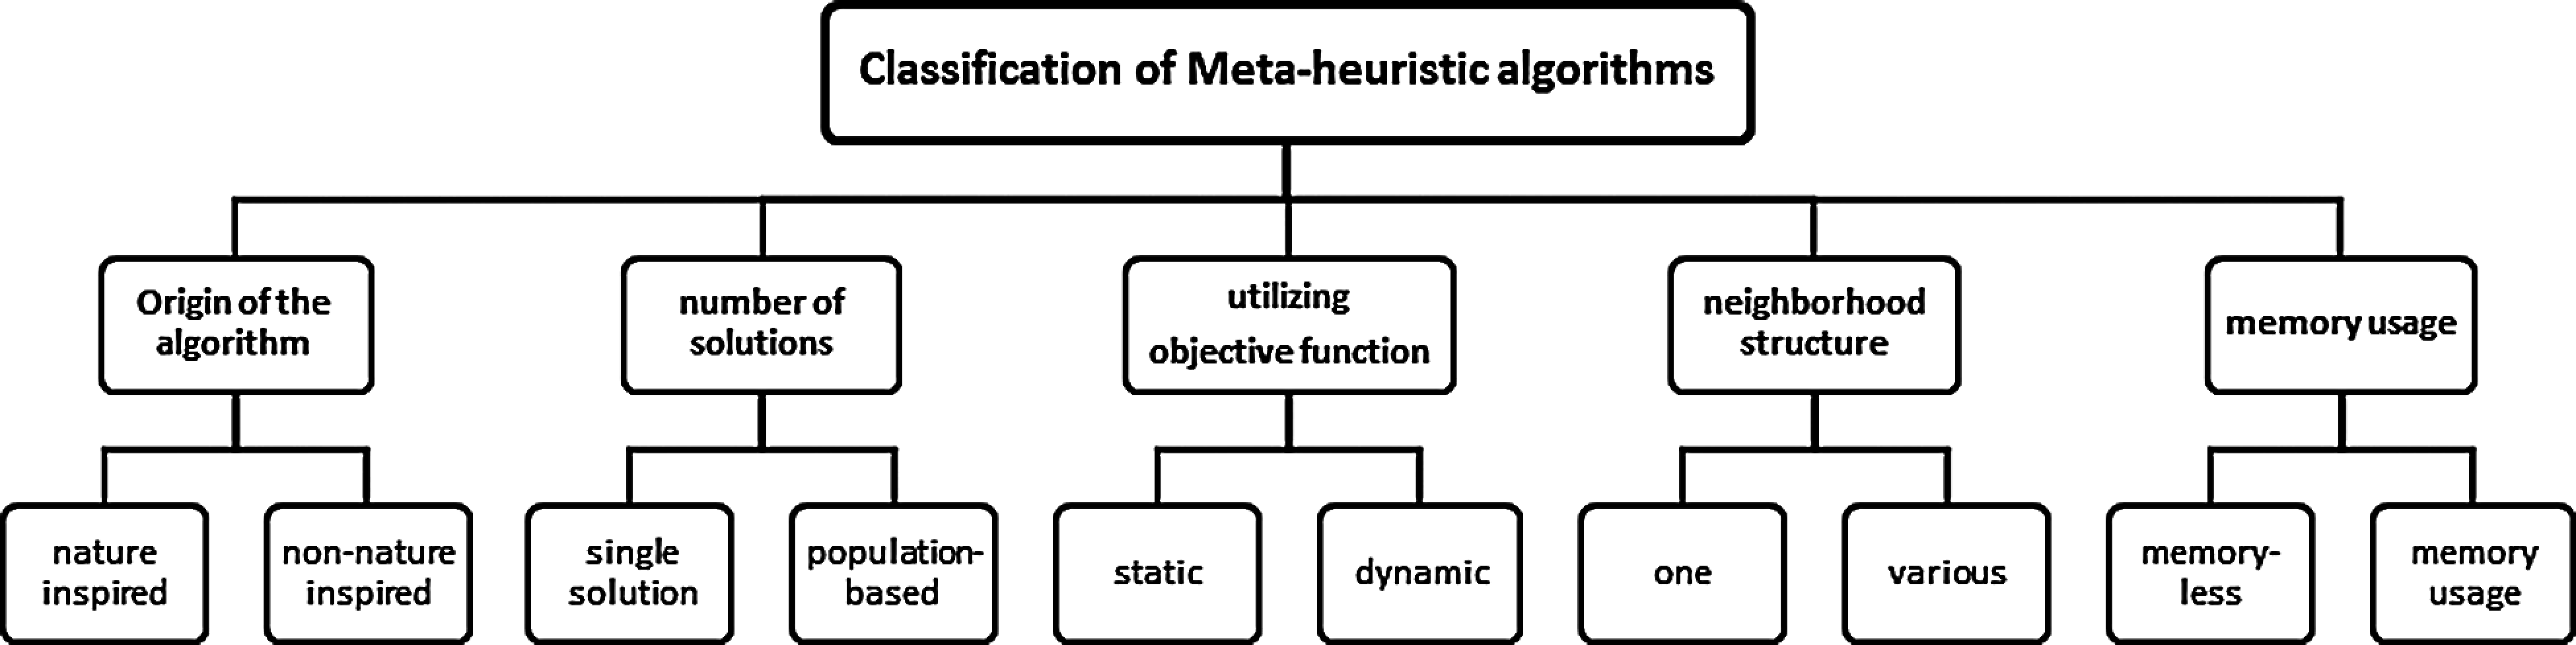
Figure 3: Classification of meta-heuristic algorithms
A case study has been developed in this paper using an optimization technique named SFS-Guided WOA to optimize the Parameter Weights of the BRNN. A dataset of time series is tested in the experiments.
This data utilized data from the Kaggle dataset “E-Commerce Data | Actual Transactions of UK Retailer”. This transnational data collection includes all transactions made by a UK-based and registered non-store internet retailer between December 1, 2010, and December 9, 2011. The firm specializes in selling one-of-a-kind presents for any occasion. Wholesalers make up a large portion of the company’s clientele.
In the preprocessing level, the input data is standardized after selecting the appropriate features to be in a suitable representation for different machine learning estimators. Machine learning estimators’ techniques can be misbehaved in some cases from which the selected feature does not look like the standard normally distributed data. To achieve this task, the StandardScaler method is employed in this paper to update the extracted features, removing the mean and scale to unit variance. In addition to feature selection and standardization, the haematological dataset is divided into 80% as training data and 20% as testing data. The training data is used to train the machine learning estimators, and the testing data is used to calculate each estimator’s error and accuracy [18].
Regression is the task of approximating a mapping function between the input and the continuous output variables. In this work, an open-source software library called Scikit-Learn is used. Scikit-learn is an efficient python tool for the tasks of data mining and analysis. Three different machine learning estimators named Random Forest, Linear Regression, and Neural Networks are tested against the proposed optimization model to show its superiority and efficiency [19].
3.3 Meta-Heuristic Optimization
Meta-heuristics are techniques that can provide acceptable solutions in a suitable time interval with much less effort in computations. This section shows the proposed continuous (SFS-Guided WOA). The optimization techniques are usually adjusted to solve challenging and even complex science and engineering problems. They can be applied in various fields such as feature selection [20], medical applications [21], virtual machine migration [22], cloud computing [23], thermal image recognition [24], and image segmentation [25–29].
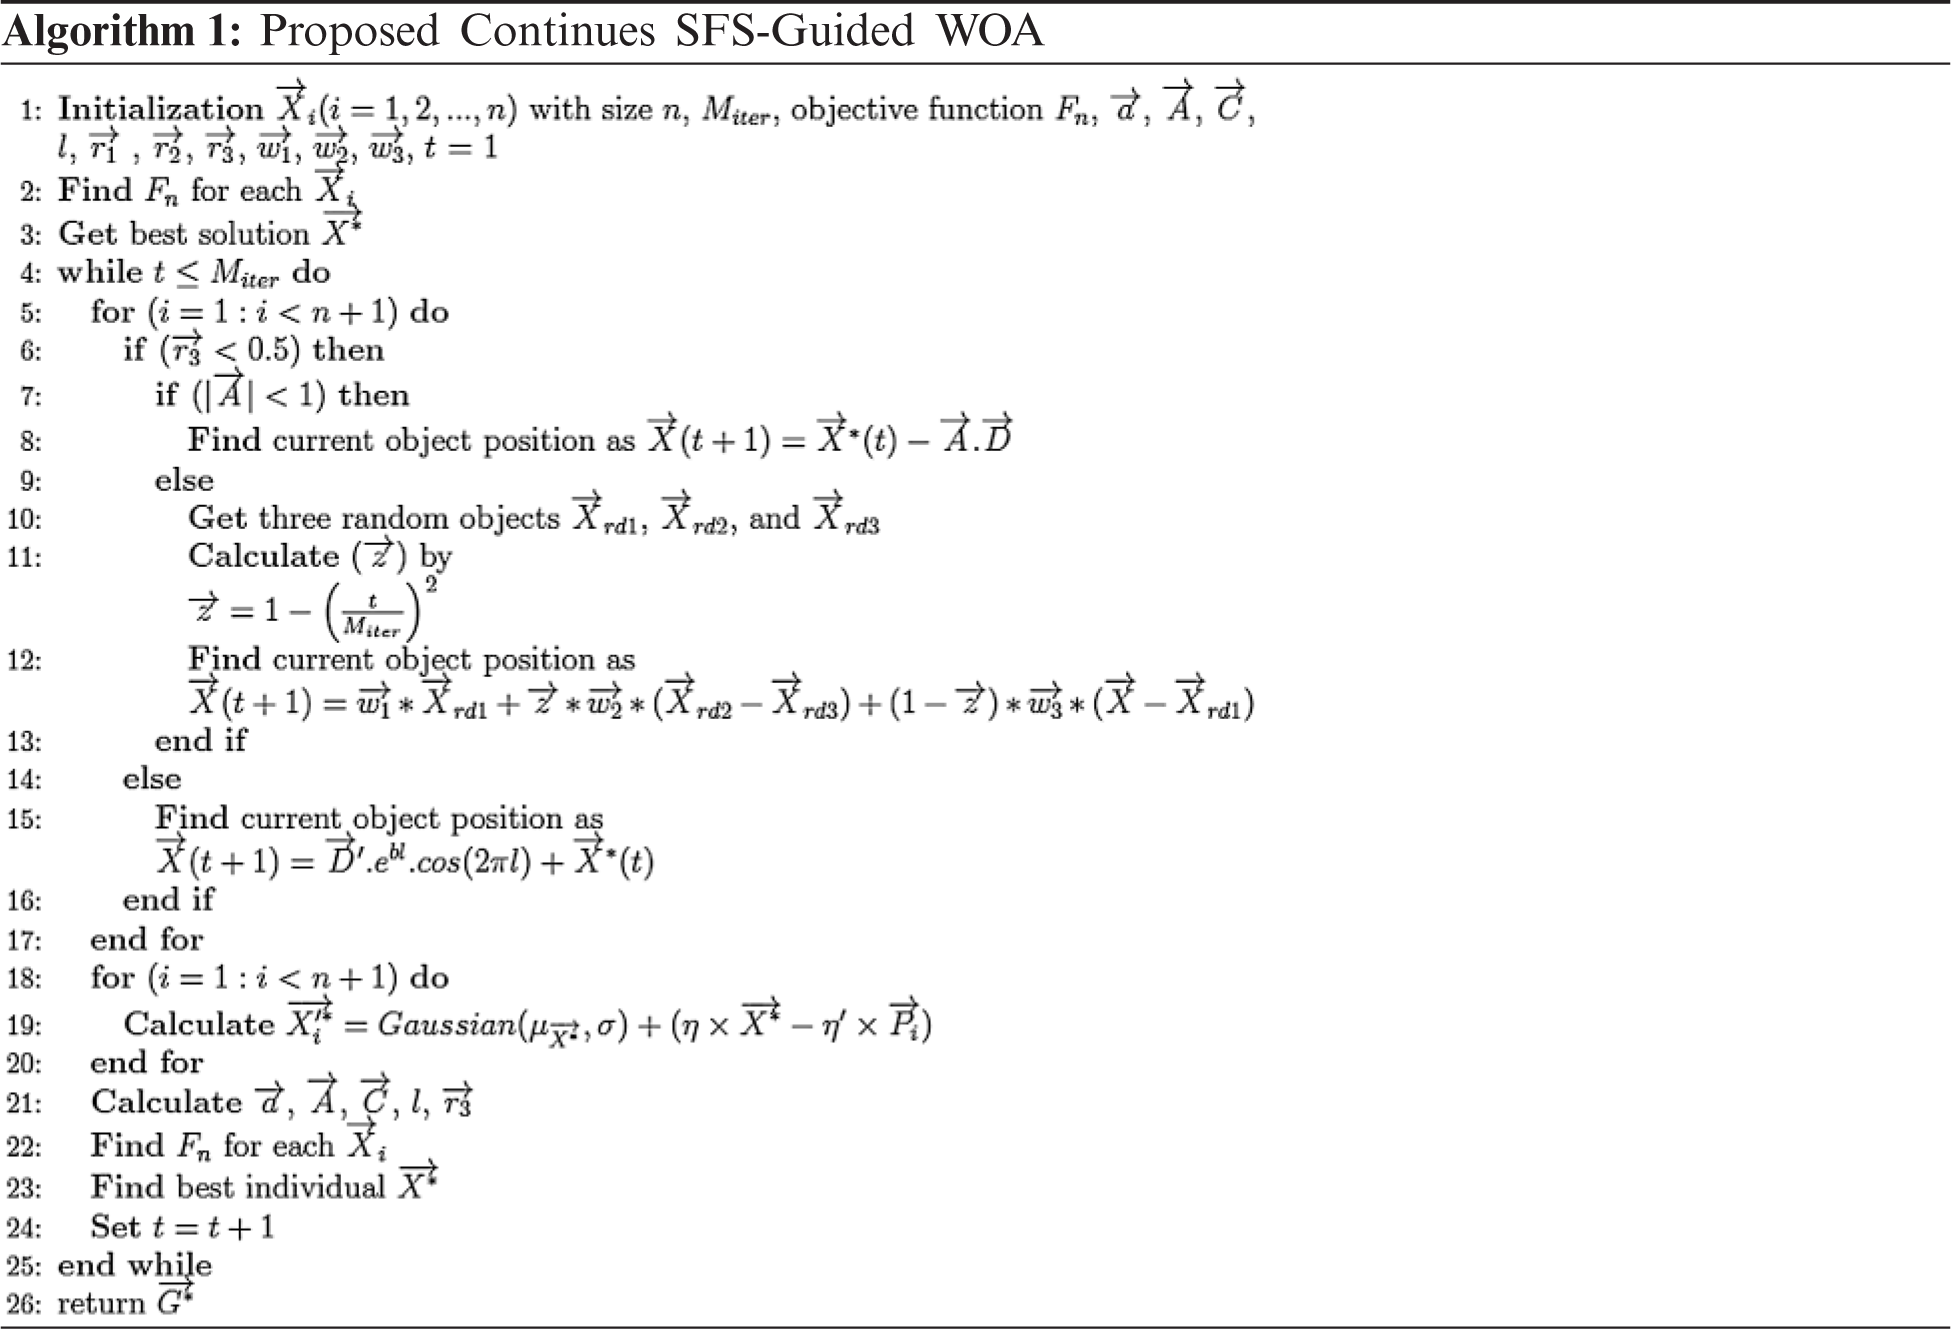
4 Proposed Continues SFS-Guided WOA
WOA has shown its advantages in the optimization area, and it is considered one of the most effective algorithms in the literature. However, it suffers from a low exploration capability of the search space in some applications, main parts that are different from the original WOA algorithm. These changes are used to explore the search space while being affected by the leader’s position to enhance exploration performance. Parameters will be as follow Agents 10, Iterations 80, Repetitions 20, a in range [0, 2] and r [0, 1].
The whales’ behaviour inspires the Whale Optimization Algorithm (WOA). In this Algorithm, the prey is trapped by making bubbles and forcing prey to the water surface in a spiral shape, as shown in Fig. 4. The following equation describes the first step in this Algorithm.
where
The second step is described by the named shrinking encircling that decreases
where
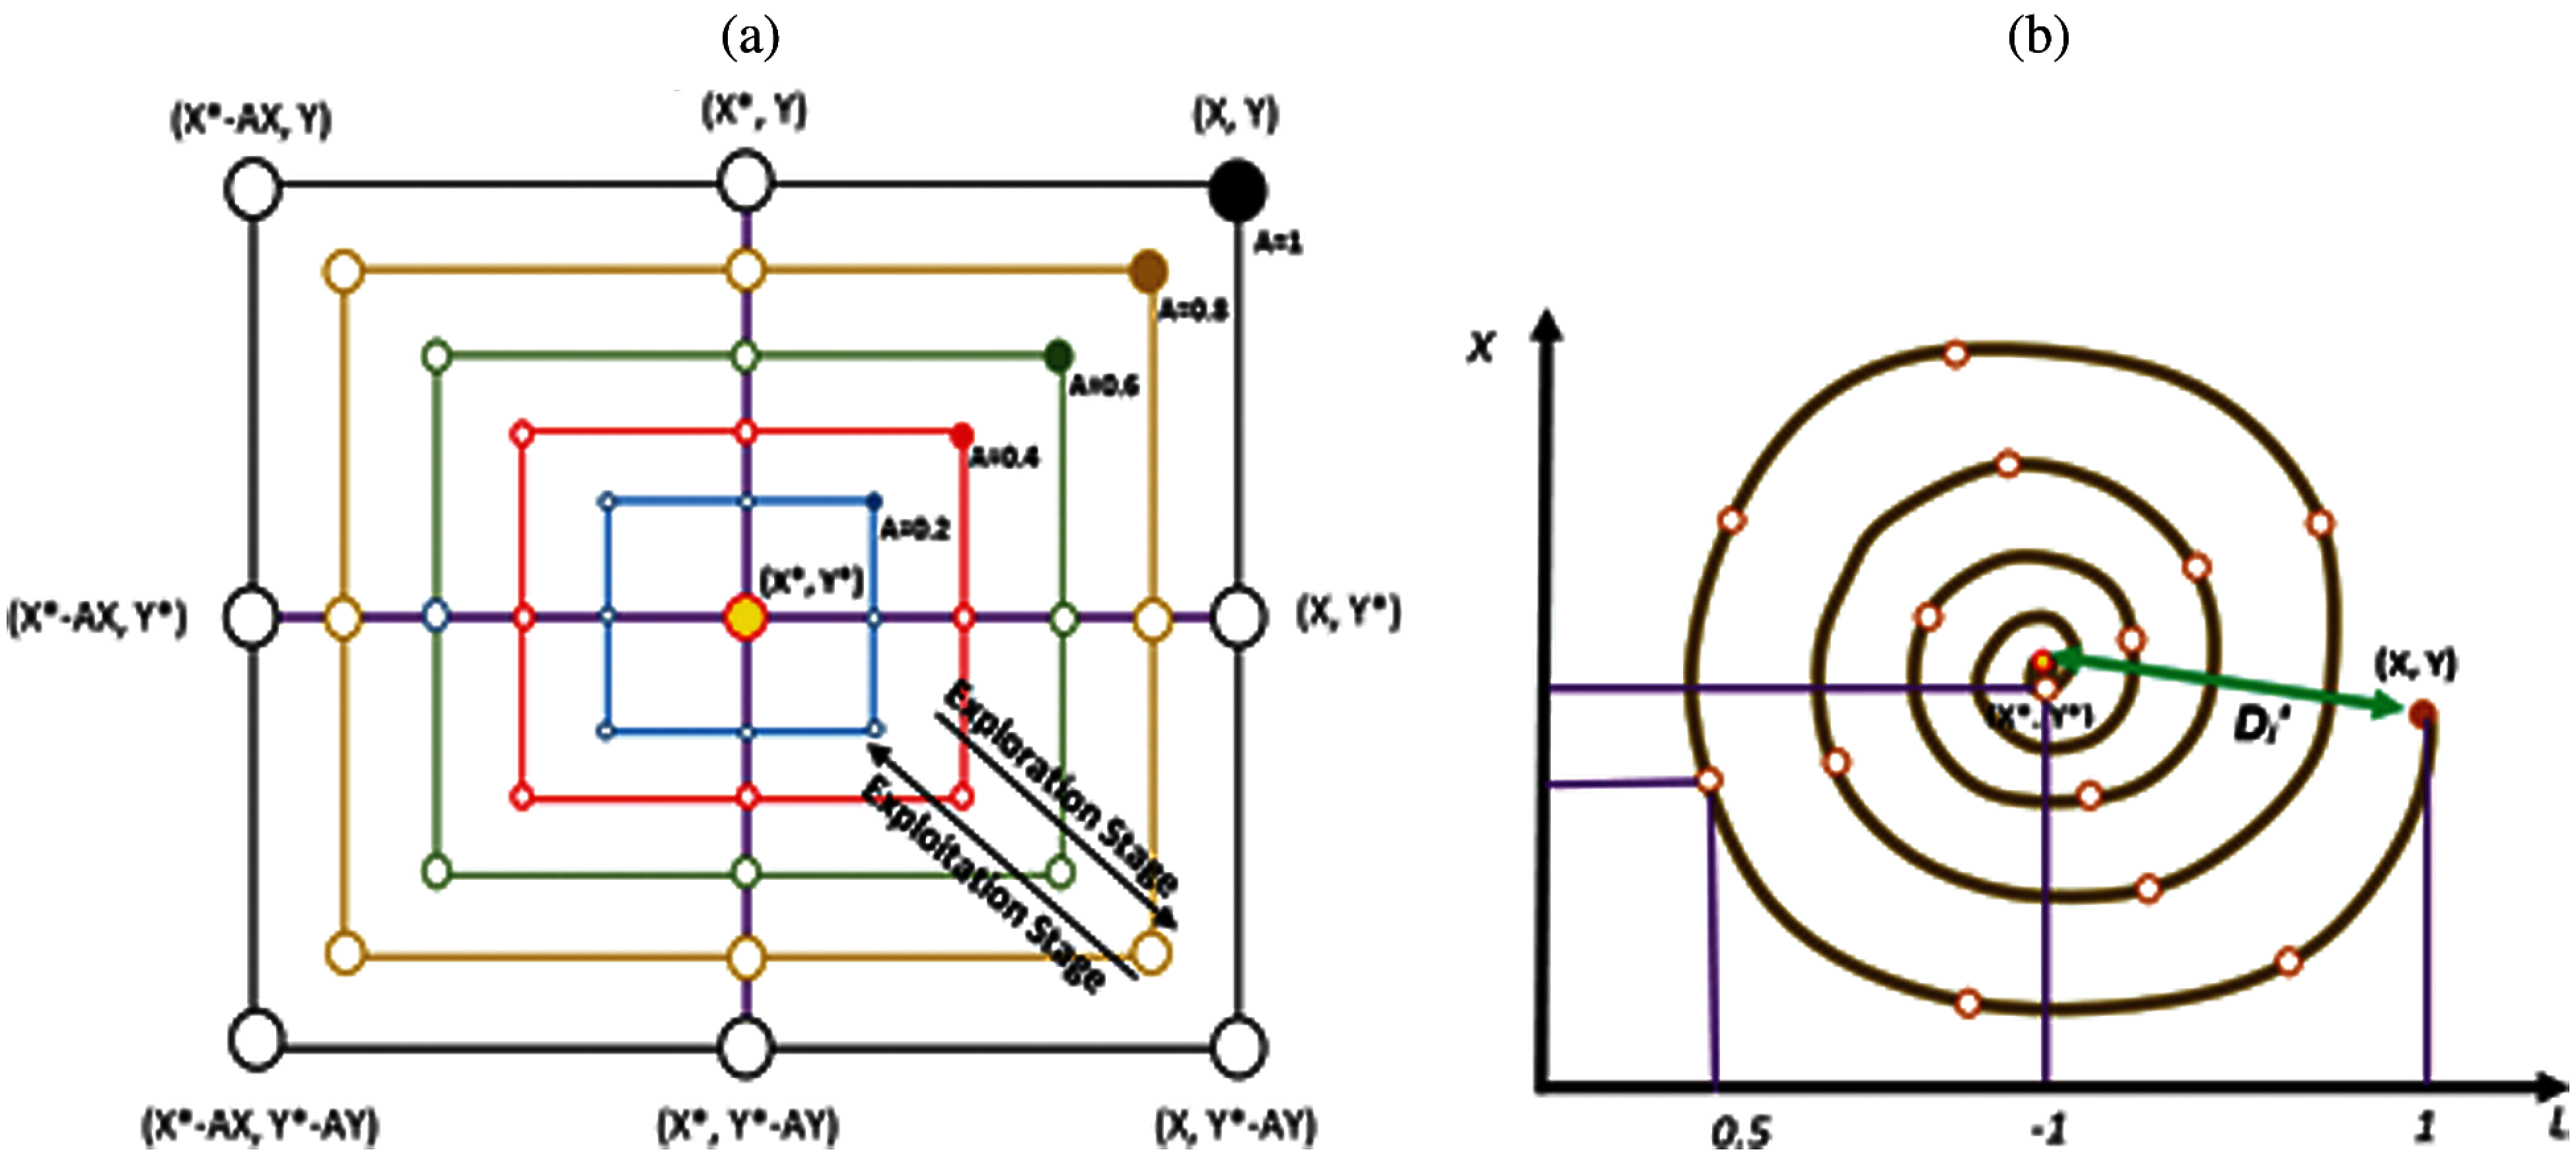
Figure 4: Basic mechanisms of the WOA algorithm; (a) Bubbles (b) Shrinking
The next step in the continuous SFS-Guided WOA algorithm is the Guided WOA, enhancing the exploration performance. Whales in the Guided WOA algorithm follow three random whales, which allow more exploration, and the whales are not affected by the position of the leader. This is described as following.
where
where
In this step, a series of random walks near to best solution is created using a technique called the SFS diffusion method, as shown in Fig. 5. This step is mainly required to increase the Guided WOA exploration ability. The diffusion process near updated best position
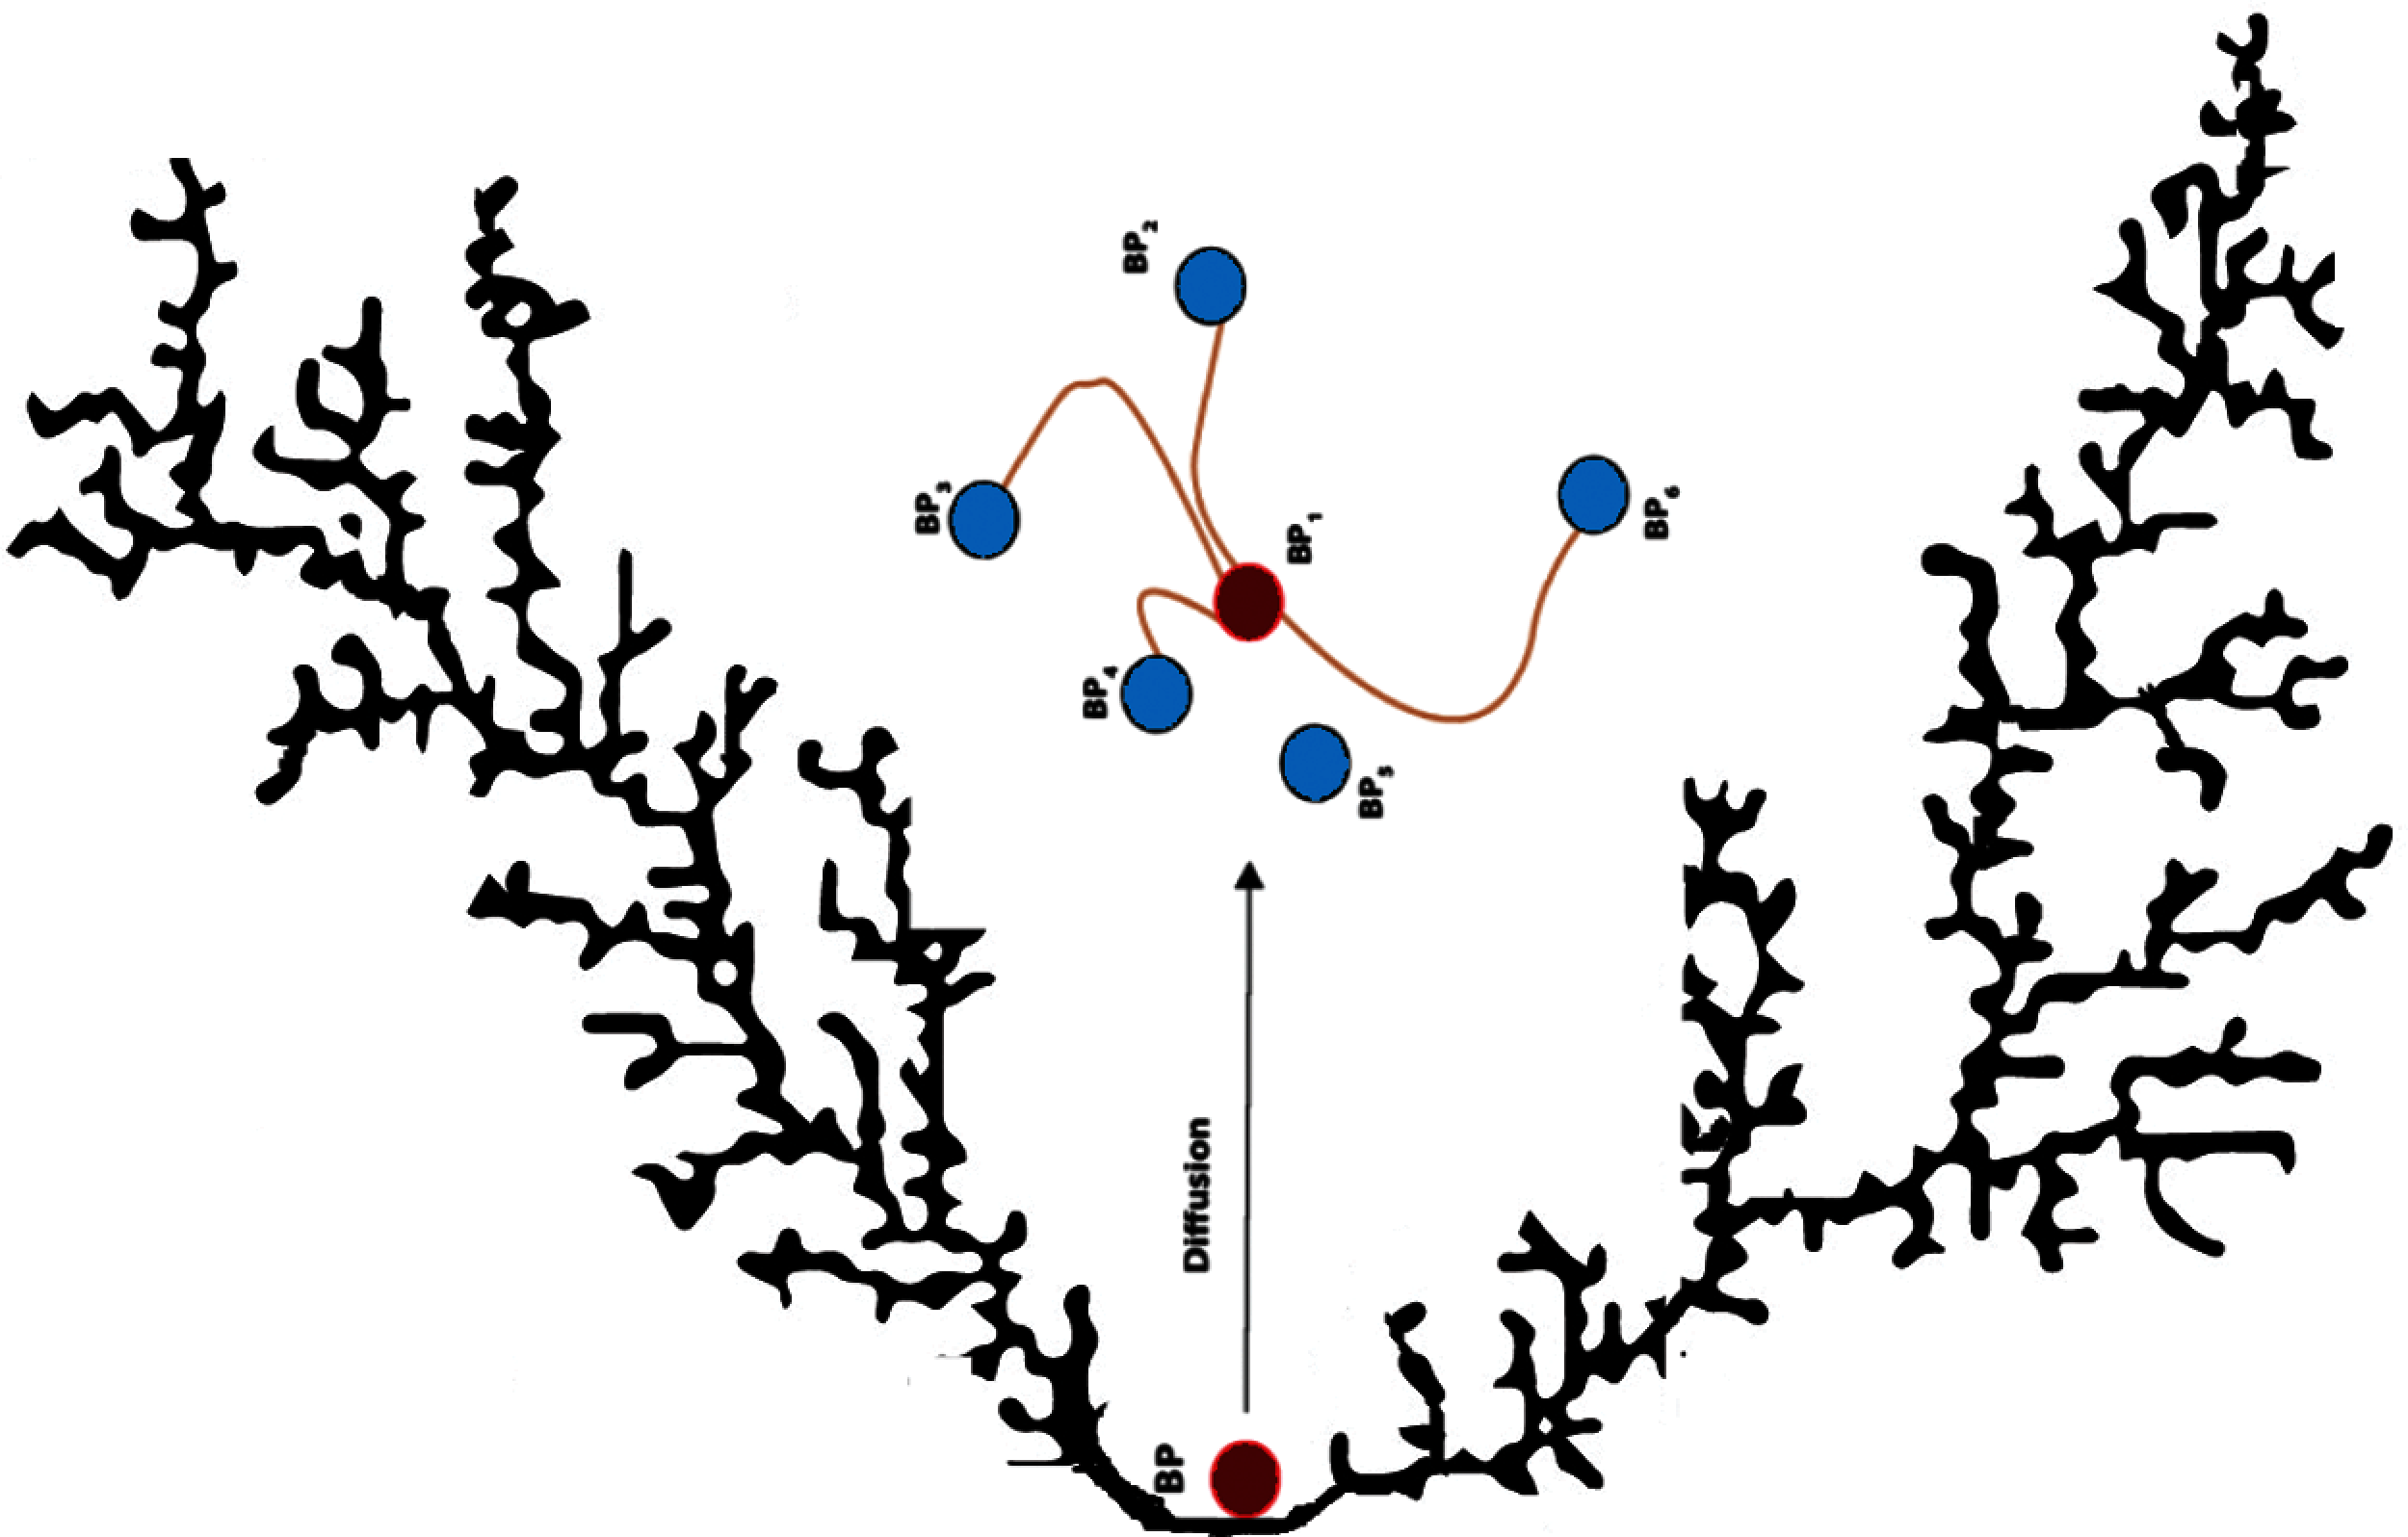
Figure 5: SFS diffusion
where
The experiments are designed to evaluate the proposed technique’s performance. First, the performance of the primary methods of BRNN, MLP, and SVR are evaluated. Then, the proposed optimizing ensemble weights model is tested. Finally, the Time Series Dataset for e-commerce demand forecasting is randomly divided into 80% for training and 20% for testing.
The performance metrics that will be used in the experiments are the root mean square error (RMSE), mean absolute error (MAE) and mean bias error (MBE). The RMSE metric can be calculated as follow to assess the prediction performance:
where
The MBE can show whether the tested model is under-predicting or over-predicting. It measures the mean bias of prediction based on the average differences in directions between the predicted and the measured values.
The First experiment tests BRNN, MLP, and SVR performance techniques without involving the ensemble technique. The results of the base models using RMSE in Eq. (7), MAE in Eq. (8), and MBE in Eq. (9) as performance metrics are shown in Tab. 1. The preliminary results indicate that the BRNN model, with RMSE of 0.016952358, MAE of 0.005118018, and MBE of −0.000856911, has good values among the other basic models. However, these results can be improved using advanced ensemble models based on optimization techniques.
The following experiment shows the results of the proposed ensemble model in Tab. 1. The proposed ensemble weights model for BRNN with RMSE of 0.000034998, MAE of 0.000222191, and MBE of −0.000101235, based on the continuous SFS-Guided WOA algorithm, gives competitive results compared to the basic models.
To conclude whether there is any statistical difference between the RMSE of the proposed ensemble model based on the continuous SFS-Guided WOA algorithm and the compared models, a one-way analysis of variance (ANOVA) test was applied. The hypothesis testing can be formulated here in terms of two hypotheses; the null hypothesis (


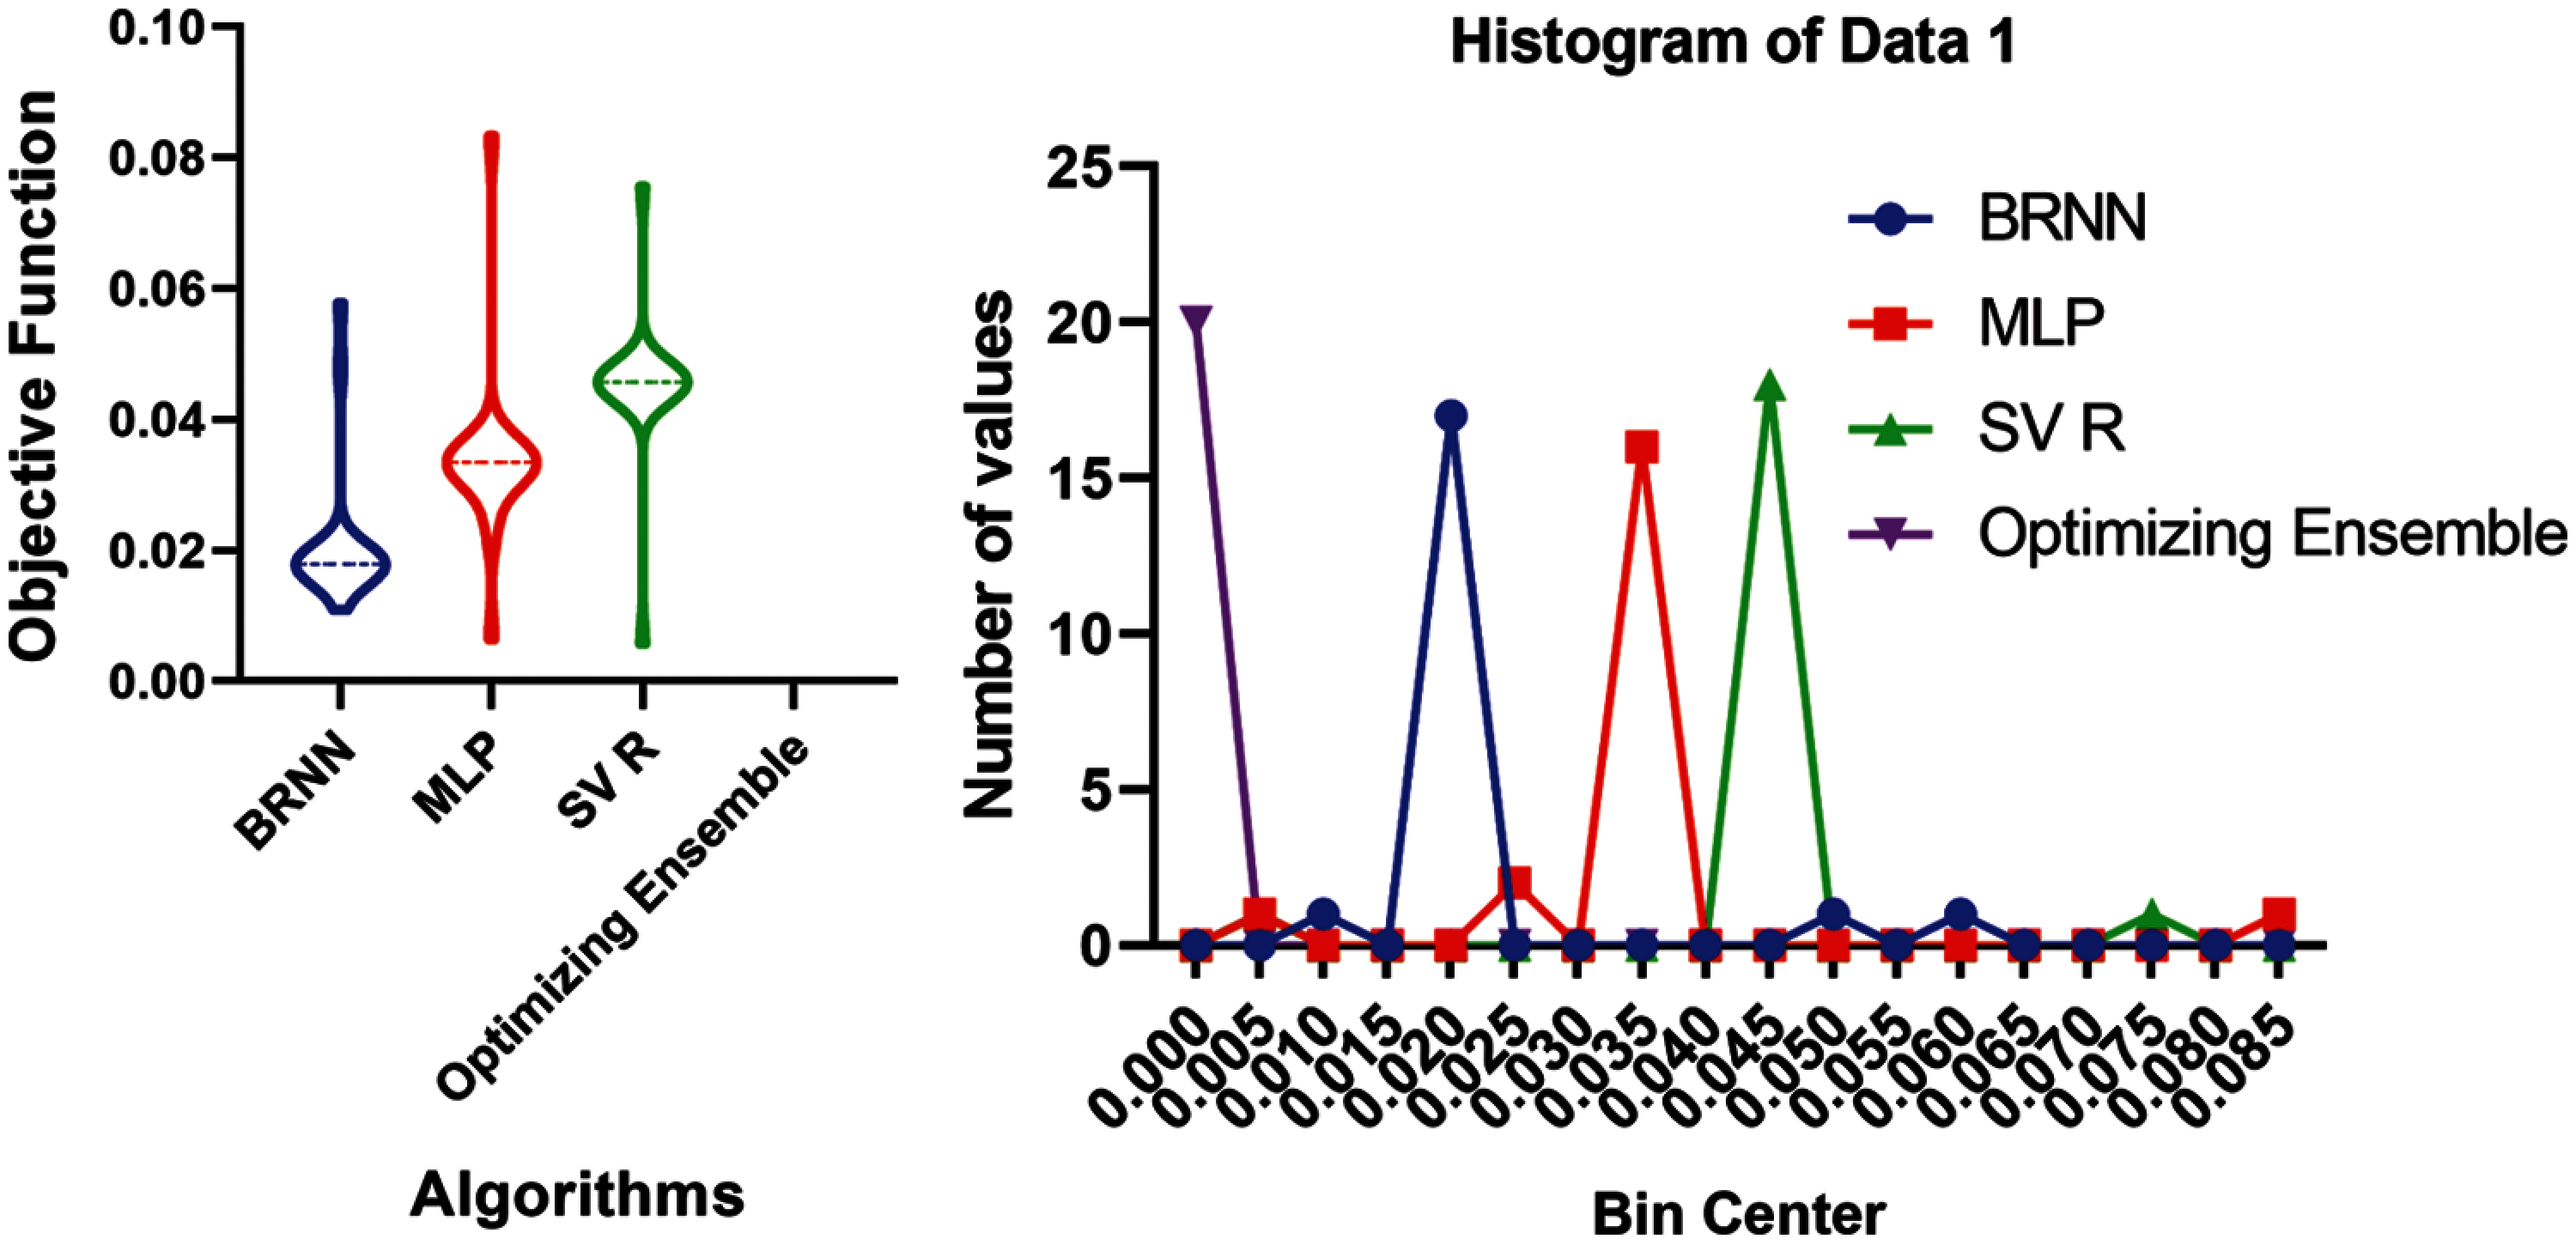
Figure 6: Box plot and histogram of accuracy for the proposed and the compared models
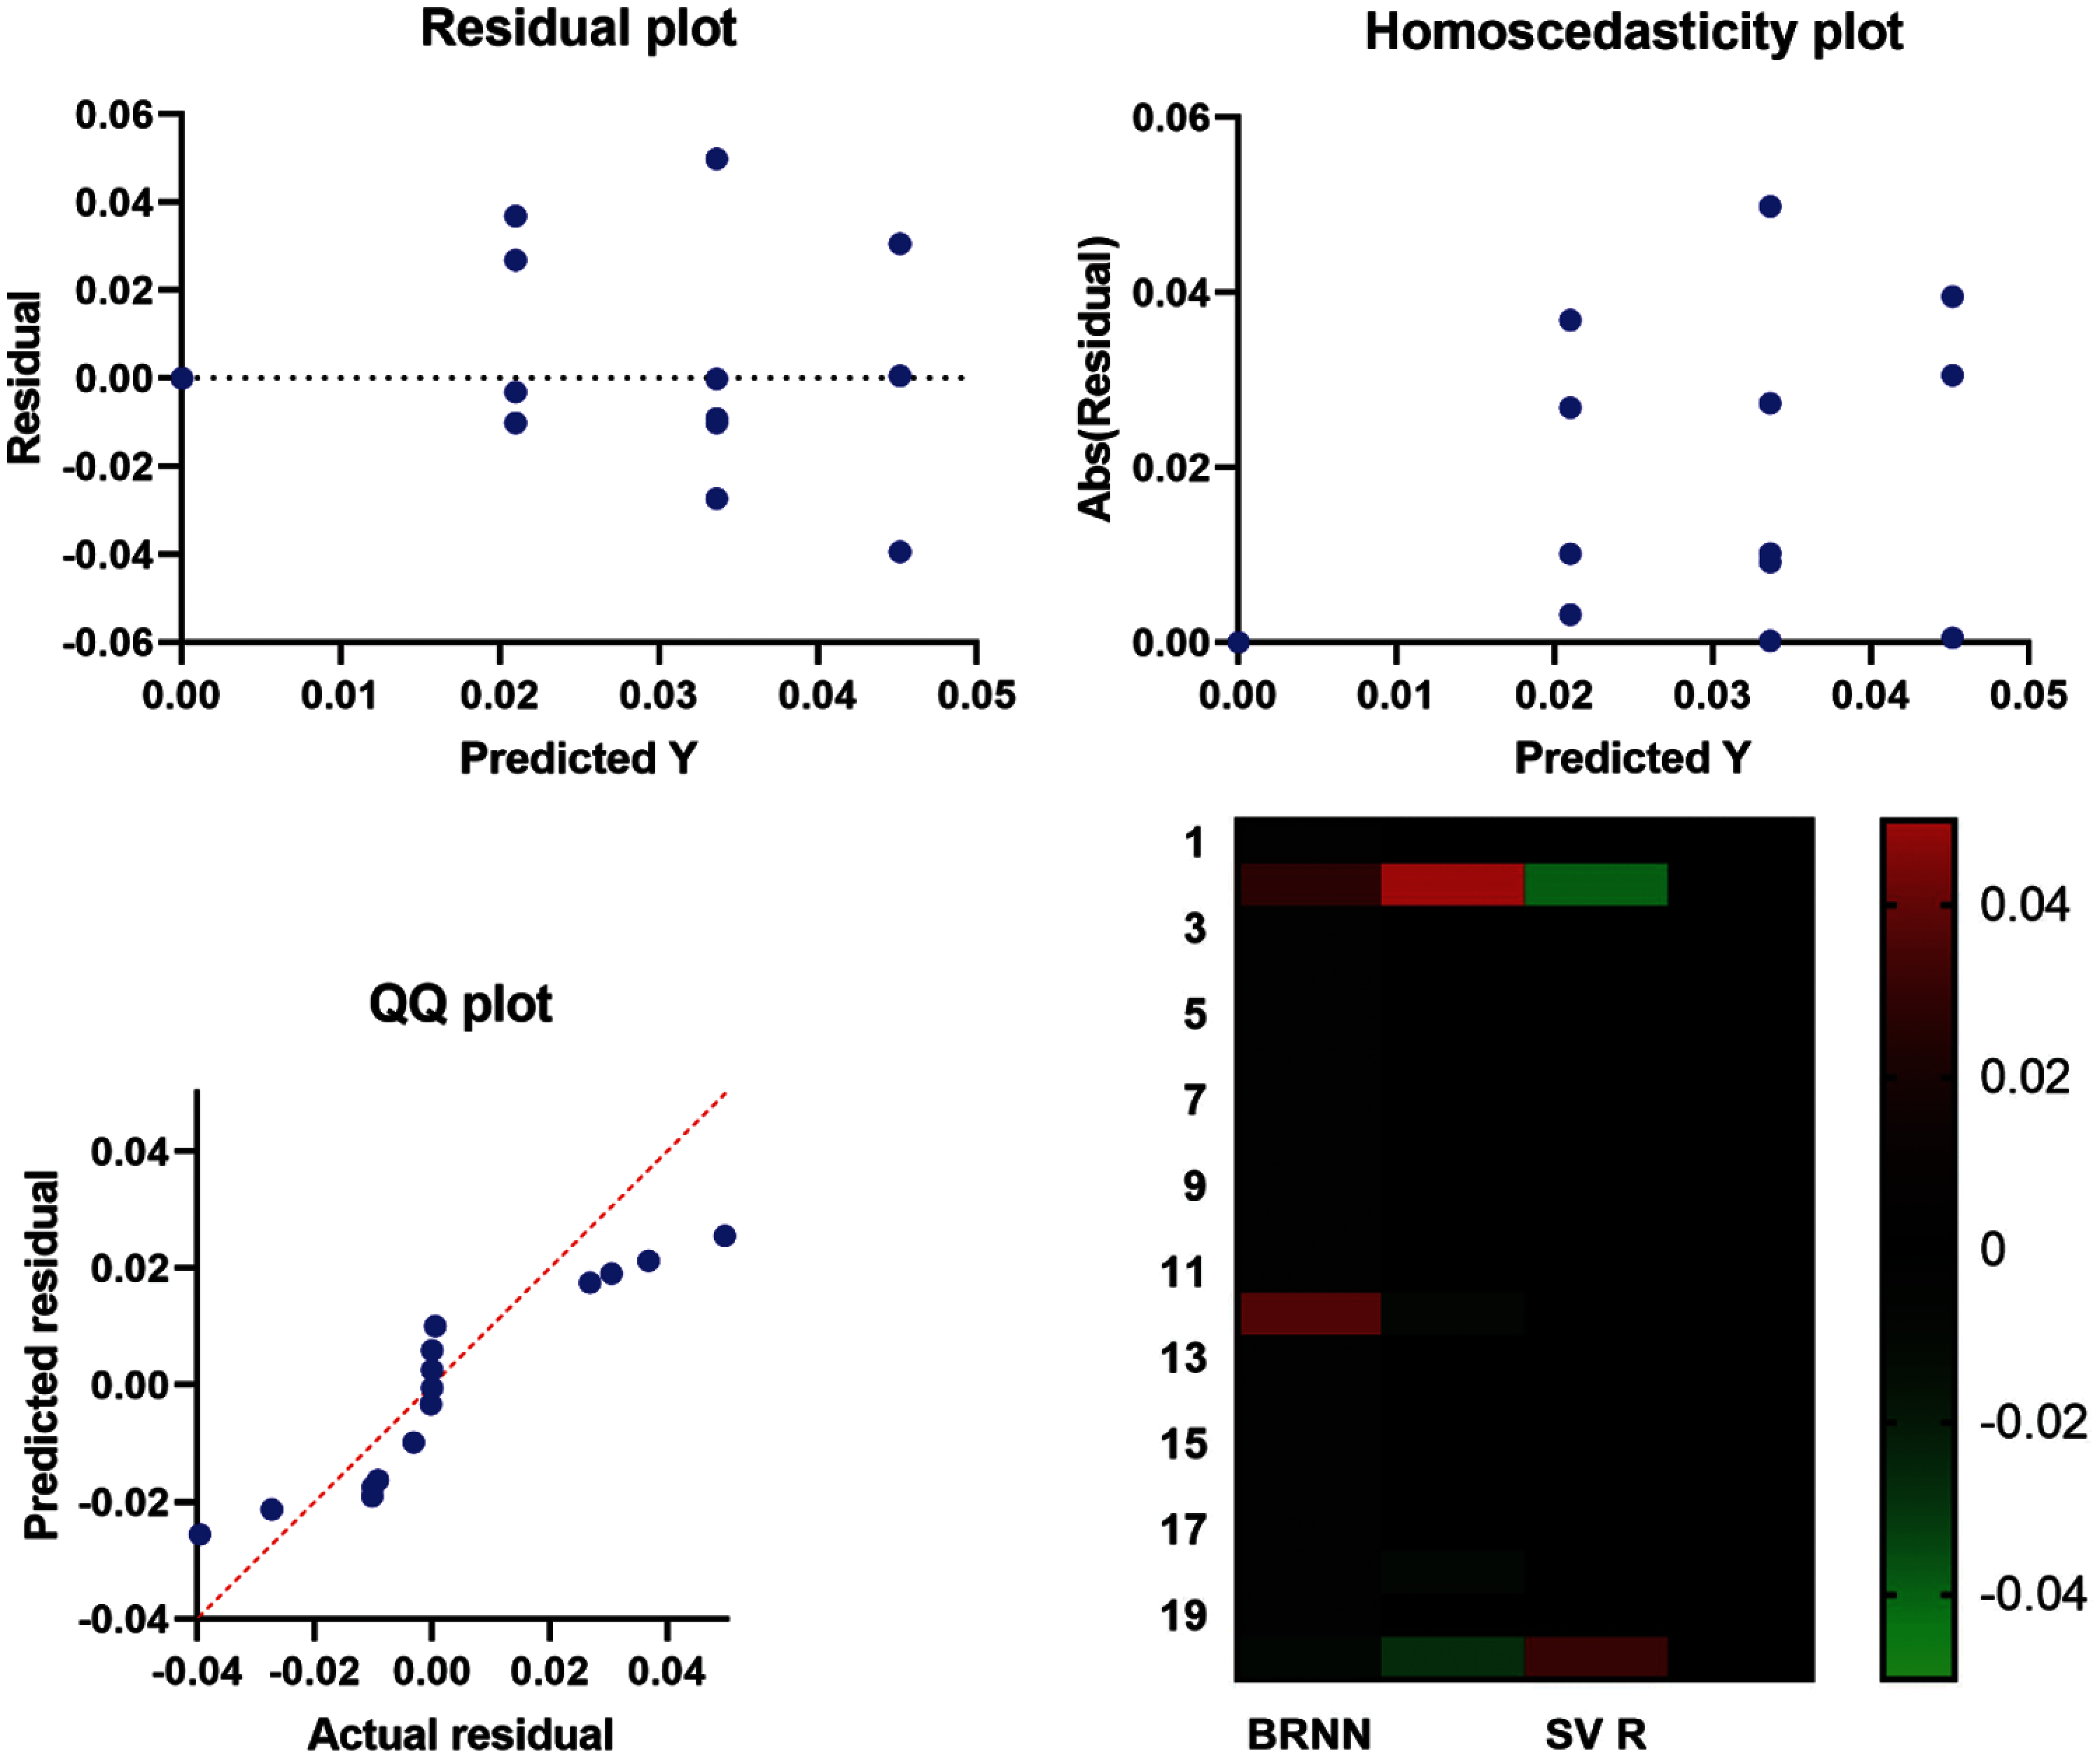
Figure 7: Residuals vs. fits plot for proposed and the compared models
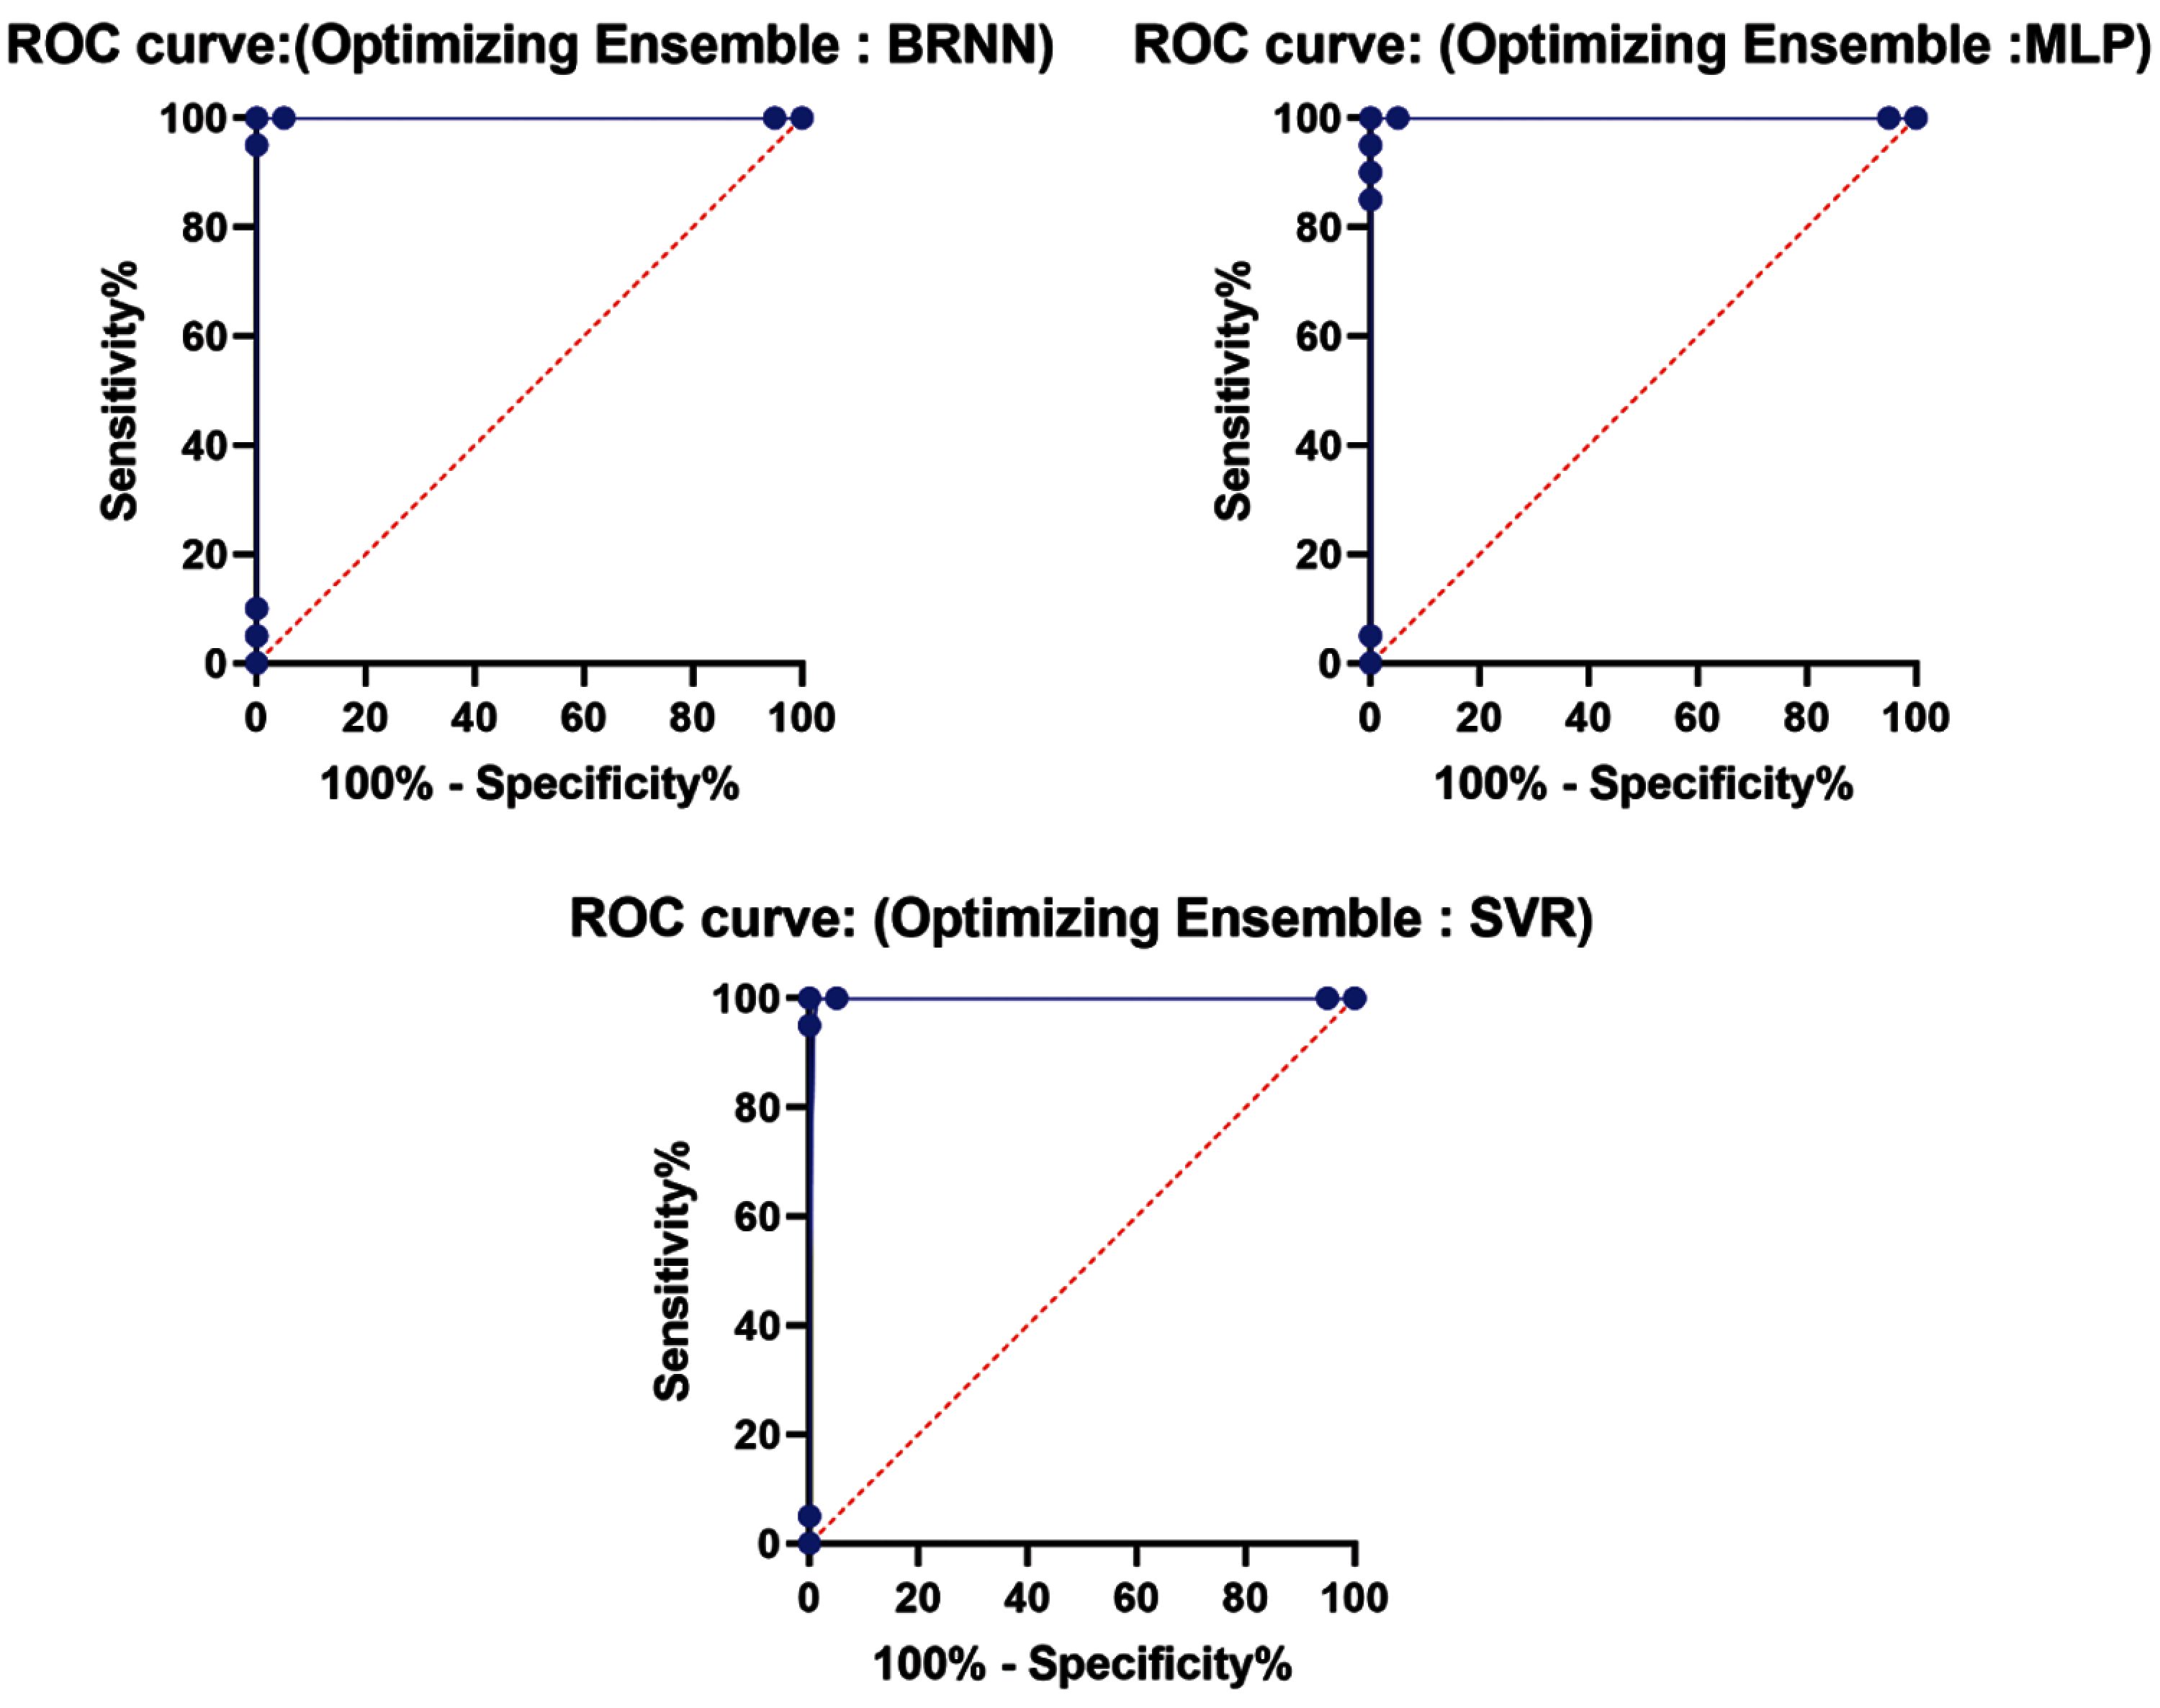
Figure 8: ROC curves for proposed vs. the compared models
The residuals vs. fits plot are shown in Fig. 7. The model based on a linear or a nonlinear behaviour can be noticed from the plot patterns in the residual plot, and an appropriate one is chosen. Fig. 8 shows the ROC curves of the proposed model vs. the compared models, which confirms the superiority of the proposed model for the tested problem.
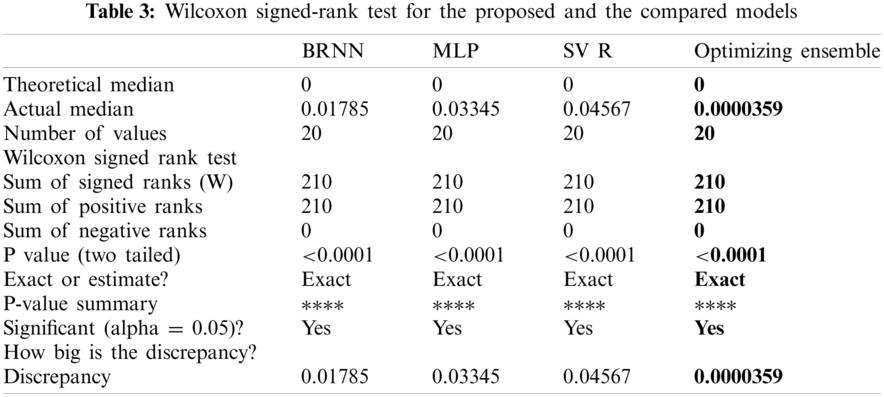
The p-values of the proposed model are tested compared to BRNN, MLP, and SVR models based on Wilcoxon’s rank-sum test as shown in Tab. 3. In this test, if the p-value is less than 0:05, it indicates that the model results are significantly different from other models. The p-value results shown in Tab. 4 show the superiority of the proposed model. In this experiment, the descriptive statistics are shown in Tab. 4. The results show that the proposed model can improve the classification accuracy of the tested dataset.

ROC analysis is a helpful method for assessing diagnostic test performance and, more broadly, assessing the correctness of a statistical model (e.g., classification, logistic regression, linear discriminant analysis, regression).

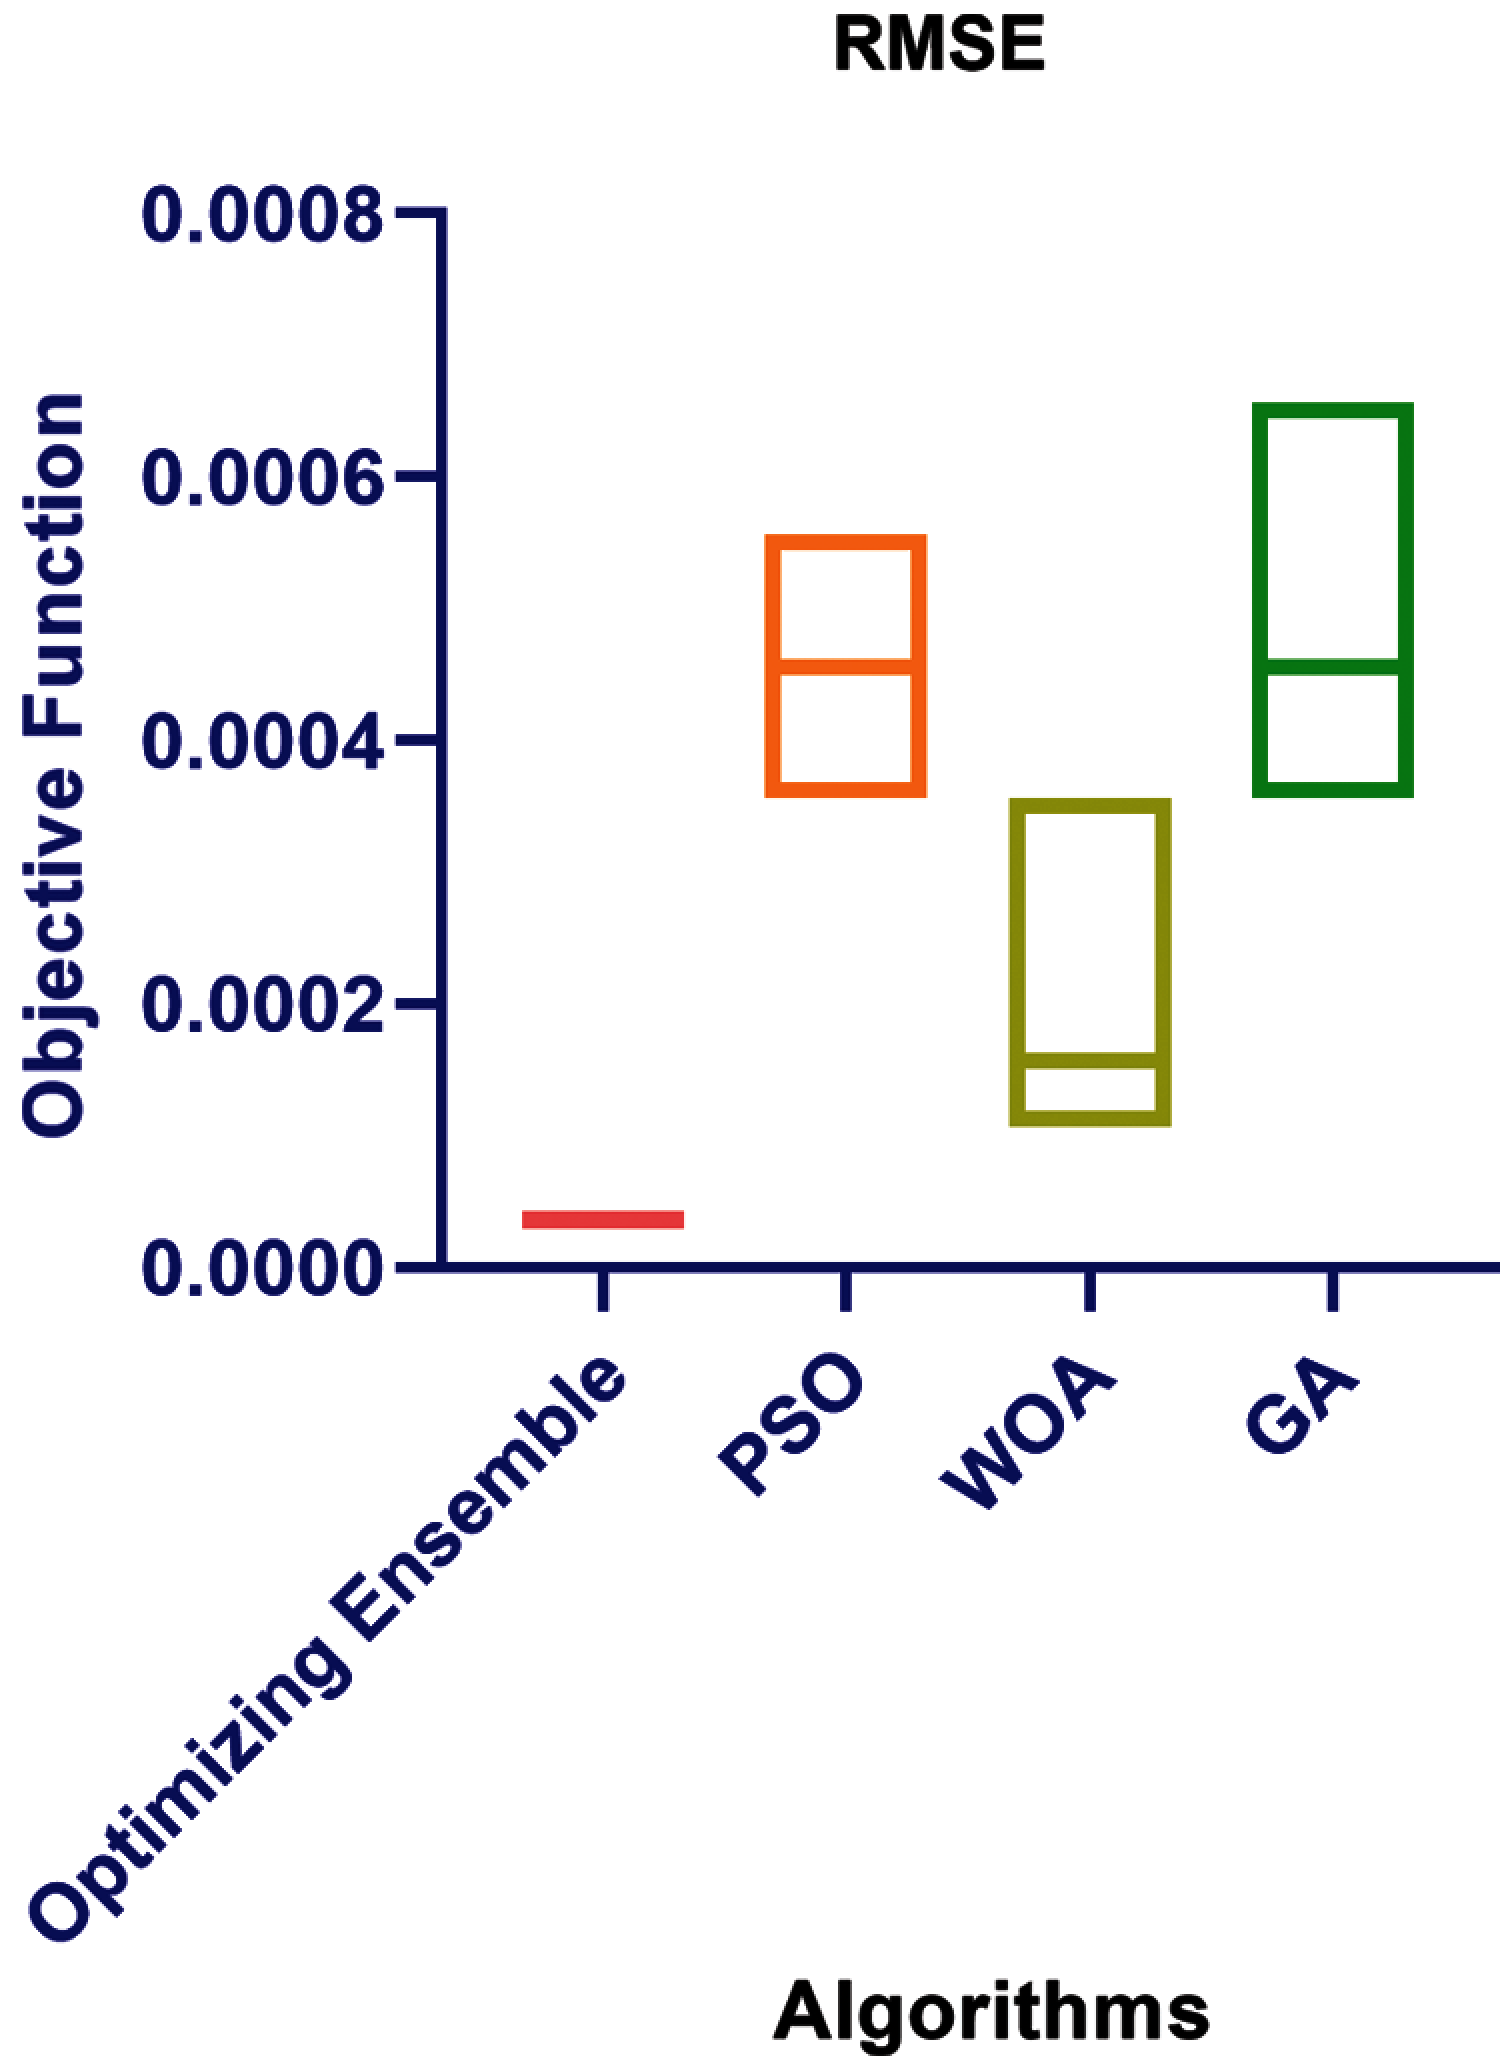
Figure 9: RMSE for the proposed and the compared algorithms
Fig. 7 also includes a quantile-quantile (QQ) graphic. A probability plot is what it’s called. It is mostly used to compare two probability distributions by comparing their quantiles against each other. It can be seen in the graph that the QQ plot’s point distributions are roughly fitted on the dividing line. As a result, the actual and projected residuals are the same. Linearly connected, confirming the proposed regression’s performance to identify the forecast sales of e-commerce.
To confirm the suggested Algorithm’s correctness, it is compared to the PSO, WOA, and GA algorithms. The resilience and reliability of the forecasting tasks for selecting the best subset of dataset characteristics are confirmed by the findings in Tab. 5 and Fig. 9.
When working on this study of utilizing machine learning to anticipate e-commerce sales, it was discovered that there are many various techniques of projecting e-commerce platform sales. Still, the researcher was only able to focus on widely used algorithms when forecasting future sales. A case study has been developed in this paper using a proposed continuous SFS-Guided WOA algorithm to optimize the parameter weights of the BRNN. A dataset for the risk assessment problem in the supply chain networks is tested in the experiments. The results and the ANOVA test concluded the performance of the proposed ensemble model, especially after comparison with many different optimization algorithms such as PSO, WOA and GA. There is still a need for further research and in-depth study in the future work of this study to create and define the correlation between the risk of credit sales activities in e-commerce and sales forecasting. The proposed Algorithm will be evaluated on continuous issues, restricted engineering challenges, and binary problems. The authors will try to improve this continuous Algorithm to enhance and validate the suggested Algorithm’s performance at CEC2017 or CEC2019.
Funding Statement: The authors received no specific funding for this study.
Conflicts of Interest: The authors declare that they have no conflicts of interest to report regarding the present study.
1. A. Intezari and B. McKenna, “Creating organizational culture,” Leadership: Regional and Global Perspectives, vol. 160, pp. 160–189, 2018. [Google Scholar]
2. E. B. Shiraev and D. A. Levy, Cross-Cultural Psychology: Critical Thinking and Contemporary Applications. England, UK: Routledge, 2020. [Google Scholar]
3. K. Weerts, W. Vermeulen and S. Witjes, “On corporate sustainability integration research: Analyzing corporate leaders’ experiences and academic learnings from an organizational culture perspective,” Journal of Cleaner Production, vol. 203, no. 4, pp. 1201–1215, 2018. [Google Scholar]
4. M. M. Fouad, A. I. El-Desouky, R. Al-Hajj and E.-S. M. El-Kenawy, “Dynamic group-based cooperative optimization algorithm,” IEEE Access, vol. 8, pp. 148378–148403, 2020. [Google Scholar]
5. E. M. Hassib, A. I. El-Desouky, E. M. El-Kenawy and S. M. El-Ghamrawy, “An imbalanced big data mining framework for improving optimization algorithms performance,” IEEE Access, vol. 7, no. 1, pp. 170774–170795, 2019. [Google Scholar]
6. E. M. Hassib, A. I. El-Desouky, L. M. Labib and E.-S. M. T. El-Kenawy, “WOA + BRNN: An imbalanced big data classification framework using whale optimization and deep neural network,” Soft Computing, vol. 24, no. 8, pp. 5573–5592, 2020. [Google Scholar]
7. A. Ibrahim, H. A. Ali, M. M. Eid and E.-S. M. El-Kenawy, “Chaotic harris hawks optimization for unconstrained function optimization,” in 2020 16th Int. Computer Engineering Conf., Cairo, Egypt, IEEE, pp. 153–158, 2020. [Google Scholar]
8. E.-S. M. El-kenawy, A. Ibrahim, S. Mirjalili, M. M. Eid and S. E. Hussein, “Novel feature selection and voting classifier algorithms for COVID-19 classification in CT images,” IEEE Access, vol. 8, no. 1, pp. 179317–179335, 2020. [Google Scholar]
9. E.-S. M. El-Kenawy, M. M. Eid, M. Saber and A. Ibrahim, “MbGWO-SFS: Modified binary grey wolf optimizer based on stochastic fractal search for feature selection,” IEEE Access, vol. 8, no. 1, pp. 107635–107649, 2020. [Google Scholar]
10. M. M. Eid, E.-S. M. El-Kenawy and A. Ibrahim, “A binary sine cosine-modified whale optimization algorithm for feature selection,” in 4th National Computing Colleges Conf., Taif, Saudi Arabia, IEEE, pp. 1–6, 2021. [Google Scholar]
11. A. Ibrahim, A. Tharwat, T. Gaber and A. E. Hassanien, “Optimized superpixel and adaboost classifier for human thermal face recognition,” Signal Image and Video Processing, vol. 12, no. 4, pp. 711–719, 2018. [Google Scholar]
12. S. S. M. Ghoneim, T. A. Farrag, A. A. Rashed, E.-S. M. El-Kenawy and A. Ibrahim, “Adaptive dynamic meta-heuristics for feature selection and classification in diagnostic accuracy of transformer faults,” IEEE Access, vol. 9, pp. 78324–78340, 2021. [Google Scholar]
13. A. Elhosuieny, M. Salem, A. Thabet and A. Ibrahim, “ADOMC-NPR automatic decision-making offloading framework for mobile computation using nonlinear polynomial regression model,” International Journal of Web Services Research, vol. 16, no. 4, pp. 53–73, 2019. [Google Scholar]
14. A. Ibrahim, A. Ahmed, S. Hussein and A. E. Hassanien, “Fish image segmentation using salp swarm algorithm,” in Proc. Int. Conf. on Advanced Machine Learning Technologies and Applications, Advances in Intelligent Systems and Computing, Cairo, Egypt, Cham: Springer, vol. 723, 2018. [Google Scholar]
15. A. Ahmed, A. Ibrahim and S. Hussein, “Detection of palm tree pests using thermal imaging: A review,” in Machine Learning Paradigms: Theory and Application. Studies in Computational Intelligence, A. Hassanien (Eds.vol. 801. Cham: Springer, 2019. [Google Scholar]
16. E.-S. M. El-kenawy and M. Eid, “Hybrid gray wolf and particle swarm optimization for feature selection,” Int. Journal of Innovative Computing, Information and Control, vol. 16, no. 3, pp. 831–844, 2020. [Google Scholar]
17. A. Ibrahim, S. Mohammed, H. A. Ali and S. E. Hussein, “Breast cancer segmentation from thermal images based on chaotic salp swarm algorithm,” IEEE Access, vol. 8, no. 1, pp. 122121–122134, 2020. [Google Scholar]
18. M. M. Eid, E.-S. M. El-Kenawy and A. Ibrahim, “Anemia estimation for covid-19 patients using a machine learning model,” Journal of Computer Science and Information Systems, vol. 17, no. 11, pp. 1–7, 2021. [Google Scholar]
19. H. R. Hussien, E.-S. M. El-Kenawy and A. I. El-Desouky, “EEG channel selection using a modified grey wolf optimizer,” European Journal of Electrical Engineering and Computer Science, vol. 5, no. 1, pp. 17–24, 2021. [Google Scholar]
20. E.-S. M. El-Kenawy, S. Mirjalili, A. M.Alrahmawy and M. El-Said, “Advanced meta-heuristics, convolutional neural networks, and feature selectors for efficient COVID-19 x-ray chest image classification,” IEEE Access, vol. 9, pp. 36019–36037, 2021. [Google Scholar]
21. A. Ibrahim, M. Noshy, H. A. Ali and M. Badawy, “PAPSO: A poweraware VM placement technique based on particle swarm optimization,” IEEE Access, vol. 8, no. 1, pp. 81747–81764, 2020. [Google Scholar]
22. M. Noshy, A. Ibrahim and H. Arafat Ali, “Optimization of live virtual machine migration in cloud computing: A survey and future directions,” Journal of Network and Computer Applications, vol. 110, no. 2, pp. 1–10, 2018. [Google Scholar]
23. H. Hassan, A. I. El-Desouky, A. Ibrahim, E. M. El-Kenawy and R. Arnous, “Enhanced QoS-based model for trust assessment in cloud computing environment,” IEEE Access, vol. 8, no. 1, pp. 43752–43763, 2020. [Google Scholar]
24. H. Banerjee, G. Saparia, V. Ganapathy, P. Garg and V. M. Shenbagaraman, “Time series dataset for risk assessment in supply chain networks,” Mendeley Data, vol. V2, 2019. https://doi.10.17632/gystn6d3r4.2. [Google Scholar]
25. R. Al-Hajj, A. Assi and M. M. Fouad, “Stacking-based ensemble of support vector regressors for one-day ahead solar irradiance prediction,” in 8th Int. Conf. on Renewable Energy Research and Applications, Brasov, Romania, pp. 428–433, 2019. [Google Scholar]
26. A. Ibrahim, T. Gaber, T. Horiuchi, V. Snasel and A. E. Hassanien, “Human thermal face extraction based on superpixel technique,” in 1st Int. Conf. on Advanced Intelligent System and Informatics, Beni Suef, Egypt, pp. 163–172, 2016. [Google Scholar]
27. T. Gaber, A. Tharwat, A. Ibrahim, V. Snael and A. E. Hassanien, “Human thermal face recognition based on random linear oracle (RLO) ensembles,” in Int. Conf. on Intelligent Networking and Collaborative Systems, Taipei, Taiwan, pp. 91–98, 2015. [Google Scholar]
28. A. Ibrahim and E.-S. M. El-Kenawy, “Applications and datasets for superpixel techniques: A survey,” Journal of Computer Science and Information Systems, vol. 15, no. 3, pp. 1–6, 2020. [Google Scholar]
29. A. Ibrahim and E.-S. M. El-Kenawy, “Image segmentation methods based on superpixel techniques: A survey,” Journal of Computer Science and Information Systems, vol. 15, no. 3, pp. 1–11, 2020. [Google Scholar]
 | This work is licensed under a Creative Commons Attribution 4.0 International License, which permits unrestricted use, distribution, and reproduction in any medium, provided the original work is properly cited. |