DOI:10.32604/cmc.2022.021195
| Computers, Materials & Continua DOI:10.32604/cmc.2022.021195 | |
| Article |
Machine Learning Based Depression, Anxiety, and Stress Predictive Model During COVID-19 Crisis
1Department of Computer Science, King Khalid University, Muhayel Aseer, Saudi Arabia
2Faculty of Computer and IT, Sana’a University, Sana’a, Yemen
3Department of Information Systems, College of Computer and Information Sciences, Princess Nourah bint Abdulrahman University, Saudi Arabia
4Department of Computer and Self Development, Preparatory Year Deanship, Prince Sattam bin Abdulaziz University, AlKharj, Saudi Arabia
5Department of Natural and Applied Sciences, College of Community-Aflaj, Prince Sattam bin Abdulaziz University, Saudi Arabia
6Computer Science Department, King Khaled University, KSA
7Faculty of Science, Mathematics and Computer Science Department, Menoufia University, Egypt
*Corresponding Author: Fahd N. Al-Wesabi. Email: falwesabi@kku.edu.sa
Received: 25 June 2021; Accepted: 26 July 2021
Abstract: Corona Virus Disease-2019 (COVID-19) was reported at first in Wuhan city, China by December 2019. World Health Organization (WHO) declared COVID-19 as a pandemic i.e., global health crisis on March 11, 2020. The outbreak of COVID-19 pandemic and subsequent lockdowns to curb the spread, not only affected the economic status of a number of countries, but it also resulted in increased levels of Depression, Anxiety, and Stress (DAS) among people. Therefore, there is a need exists to comprehend the relationship among psycho-social factors in a country that is hypothetically affected by high levels of stress and fear; with tremendously-limiting measures of social distancing and lockdown in force; and with high rates of new cases and mortalities. With this motivation, the current study aims at investigating the DAS levels among college students during COVID-19 lockdown since they are identified as a highly-susceptible population. The current study proposes to develop Intelligent Feature Subset Selection with Machine Learning-based DAS predictive (IFSSML-DAS) model. The presented IFSSML-DAS model involves data preprocessing, Feature Subset Selection (FSS), classification, and parameter tuning. Besides, IFSSML-DAS model uses Group Gray Wolf Optimization based FSS (GGWO-FSS) technique to reduce the curse of dimensionality. In addition, Beetle Swarm Optimization based Least Square Support Vector Machine (BSO-LSSVM) model is also employed for classification in which the weight and bias parameters of the LSSVM model are optimally adjusted using BSO algorithm. The performance of the proposed IFSSML-DAS model was tested using a benchmark DASS-21 dataset and the results were investigated under different measures. The outcome of the study suggests the development of specialized programs to handle DAS among population so as to overcome COVID-19 crisis.
Keywords: Psycho-social factors; covid-19; crisis management; predictive models; decision making; machine learning
World Health Organization (WHO) declared Coronavirus Disease (COVID-19) as a pandemic on March 11, 2020. This respiratory infection is caused by SARS-CoV-2, a novel coronavirus reported for the first time in China. COVID-19 has affected more than 187 Million people across the globe and the disease is characterized by mild to moderate signs such as cough, sore throat, fatigue, fever, and shortness in breath. According to a recent data, persons with comorbidities and above 60 years are vulnerable people who are highly prone to serious respiratory infection which increases the mortality rate. On the other hand, pregnant women do not seem to be harmfully affected.
In order to curtail the spread of coronavirus, governments introduced various modifications in daily life such as closing of workplaces, shopping areas and public amenities, prevalent diagnostics of the virus, forced isolation in schools, and constraints to civil liberties. Consequently, these modifications created several psychological replies in persons that has become the degree of compliance with prevention measures. Indeed, the public health studies conducted earlier focused on slowing/preventing the spreading of crisis, while it also emphasized the significance of social and psychological aspects of curfews. The implication of this difficult aspect is to follow prevention measures, introduced by distinct governments that should be examined in detail. In fact, societal and psychological impacts might be pronounced, widespread, and have long lasting impression compared to physical healthy complications brought by the disease [1]. After few weeks of COVID-19 outbreak in China, 53.8% people mostly Chinese expressed the psychological impact of epidemic creating a mild to serious impact upon them. Extensive research conducted earlier, on the effect of infective epidemics upon mental health, demonstrates that crisis is an extremely stressful event which can drive people to handle ambiguous, uncertain, and unexpected conditions. Particularly, two major factors of epidemics have been established to influence the mental state of people. First, it is relevant to the risk (i.e., fear of contagion). This may raise due to detected threats and occasionally cause behavioral contagion, panic, and emotional crisis [2,3]. The next risk is the introduction of rapid and multiple variations in regular social, work and familiar habits due to social distancing and self-isolation measures. A long self-isolation period results in more persons encounter boredom and frustration, together with concerned disease.
Well-documented psychological responses to such crisis include anxiety behaviors, anger, emotional distress, sleep disorders, fear, health concerns, depression, uncertainty, and sense of powerlessness. Moreover, the researchers who examined the long-term impact of infective epidemics exposed that few persons might improve from the symptoms of Post-Traumatic Stress Disorder (PTSD). From an individual analysis, it is understood that a person may take around 3 years to improve from PTSD that occurred as a result of epidemic. Stress-related reactions might be physiological, behavioral, emotional, or cognitive. Based on the severity, type, and timing of disclosure to stress, the resultant stress might become a risk factor for various diseases that involve psychiatric/cardiovascular diseases. An emergency-like COVID-19 situation may be assumed as a serious stress, since it is novel and unpredicted that poses severe influences on health (experience gained from both personal and through relatives) including social limitation. However, no incident by themselves is the sudden reason for illness and its consequences. Relatively, it is the perception of stress (i.e., the degree up to which an individual assumes the incident to be stressful) that changes the mental and physical responses to a condition [4,5]. Initially, it becomes important to detect vulnerable patients, and support them through efficient prevention schemes so that they can deal with such conditions quickly and escape from negative psychological results.
The current research article examines DAS levels among college students during COVID-19 lockdown since they are highly-susceptible population. The current study proposed to develop an Intelligent Feature Subset Selection (FSS) with Machine Learning based DAS predictive (IFSSML-DAS) model. The presented IFSSML-DAS model involves Group Gray Wolf Optimization-based FSS technique in order to reduce the curse of dimensionality. Moreover, Beetle Swarm Optimization-based Least Square Support Vector Machine (BSO-LSSVM) model is applied as a classifier, which includes BSO algorithm-based parameter optimization. The proposed IFSSML-DAS model was experimentally validated using a benchmark DASS-21 dataset and the results were examined under different dimensions. In short, the contributions of the study are as follows.
• Assessment of the relationship between psycho-social factors and COVID-19 lockdown among college students
• Development of an automated DAS predictive model using IFSSML-DAS model to detect different levels of DAS during COVID-19 crisis.
• The proposed model involves different sub-processes namely, data preprocessing, feature subset selection, classification, and parameter tuning.
• GGWO-FSS technique is employed to choose an optimal feature sunset and reduce the computational complexity.
• BSO-LSSVM model is proposed as a classifier to detect different levels of DAS due to COVID-19 crisis.
• Application of BSO algorithm to fine tune the weights and biases of LSSVM model, thereby increasing the classification performance.
• The performance of IFSSML-DAS model was validated against benchmark DASS dataset.
The pandemic has enforced several governments to bring severe restrictions to curtail the movement of people. The governments of the worst affected countries in terms of number of patients, infections, and death levels, such as Spain, China, Ecuador, and Italy, have decided longer period of lockdown and quarantine in which the people should stay at home. This has extremely discomforted the living conditions of these countries’ citizens, especially, it has damaged the countries with less assets, for example, Latin American population. Worrying features such as uncertainty about the spread of disease, evolution and immunity of the persons infected with disease and lack of vaccine to overcome the spread of disease have together resulted in an improved feeling of fear amongst the population. Such fears are created by threatening stimulation which occurred in such previous health crises too such as the outbreak of SARS/Middle East Respiratory Syndrome Coronavirus [6].
The severity of common threats and its influence of COVID-19 pandemic have been well recorded in various fields of health, well-being, development, and human survival. Ahorsu et al. [7] devised a scale to measure the fear about this pathogen depending on the survey. This scale has been extensively utilized in many countries. Several researchers have identified a connection between COVID-19 fear and anxiety [8]. Further, the researchers also used Hospital Anxiety and Depression Scale (HADS) and Depression and Anxiety Stress Scale (DASS-21) scales for less extent of depression. Recently, it is witnessed that the fear of COVID-19 is highly related to stress and anxiety with a less range of depression [9]. Though the evidences connecting depression and fear are less, suicidal thoughts have been registered in the population, because of COVID-19 [10]. Additionally, the number of cases being reported daily has increased with high mortality rates. The explosion of data, presented by the media, also started influencing the mood disorders [11]. Therefore, in the earlier stages of pandemic, Chinese scientists established reasonable and severity symptoms for DAS among Chinese population [12]. The associations among DAS have been recognized in their research works. Theoretic methods are assisted by survey while the socio-environmental stress is connected with biological process since it drives the depression about pathogens.
A linear research conducted upon younger generation also recommends the prediction of depression and stress earlier [13]. According to the research, they can recognize highly stressful conditions and there exists a close connection between depression and anxiety, i.e., persons suffer from PTSD frequently exhibit high level of anxiety and fear. Since depression and anxiety are positively connected with one another, both the functions can be utilized for predicting the other. In this situation, due to this crisis, the current study is conducted to reveal a specific variance on the basis of age and gender. Young female population show high levels of DAS and fear of COVID-19. But, all the investigations have been conducted by medical personnel [14] while only a few people know about the younger generation. University students witnessed COVID-19 fear in comparison with graduates [15]. Moreover, based on several researches, the symptoms of anxiety and depression among scholars are raising, because of social distancing and lockdown rules [16].
3 The Proposed DAS Predictive Model
Fig. 1 illustrates the overall working process involved in the proposed IFSSML-DAS model. According to the figure, DAS dataset is fed as input to the preprocessing module. Next, GGWO algorithm is applied as a feature selector to derive a set of useful features. At last, BSO-LSSVM model is employed as a classifier to determine the DAS levels.
The presented IFSSML-DAS model was simulated in a benchmark DAS dataset. The dataset holds an identical number of 938 instances with 7 attributes, and 5 classes for DAS. The information related to the dataset is given in Tab. 1.
Data preprocessing plays a vital role in improving the outcome of ML-based predictive models. This step is an important one since the data is usually noisy and occasionally has missing values. Therefore, data cleaning process is mandatory to remove the noise that exists in it. Besides, missing data imputation and data normalization using min-max technique are carried out to distribute the data, closer to normal distribution. It thereby enhances the predictive outcome of DAS classification process.
3.3 Feature Subset Selection Using GGWO Algorithm
After data preprocessing, FSS process takes place using GGWO algorithm. In this stage, the preprocessed data is fed into GGWO algorithm to elect the optimal subset of features. It is essential to decrease the feature vectors during this step for classification since the input is comprised of huge number of features equivalent to remarkable limiting. Consequently, there is a significant requirement arise to devise a method for executing feature dimensionality reduction without losing data. Both chasing process and social behavior of wolves have been mathematically established in the final objective of creating GWO [17]. The processes involved in GGWO-FSS model are concisely described herewith.
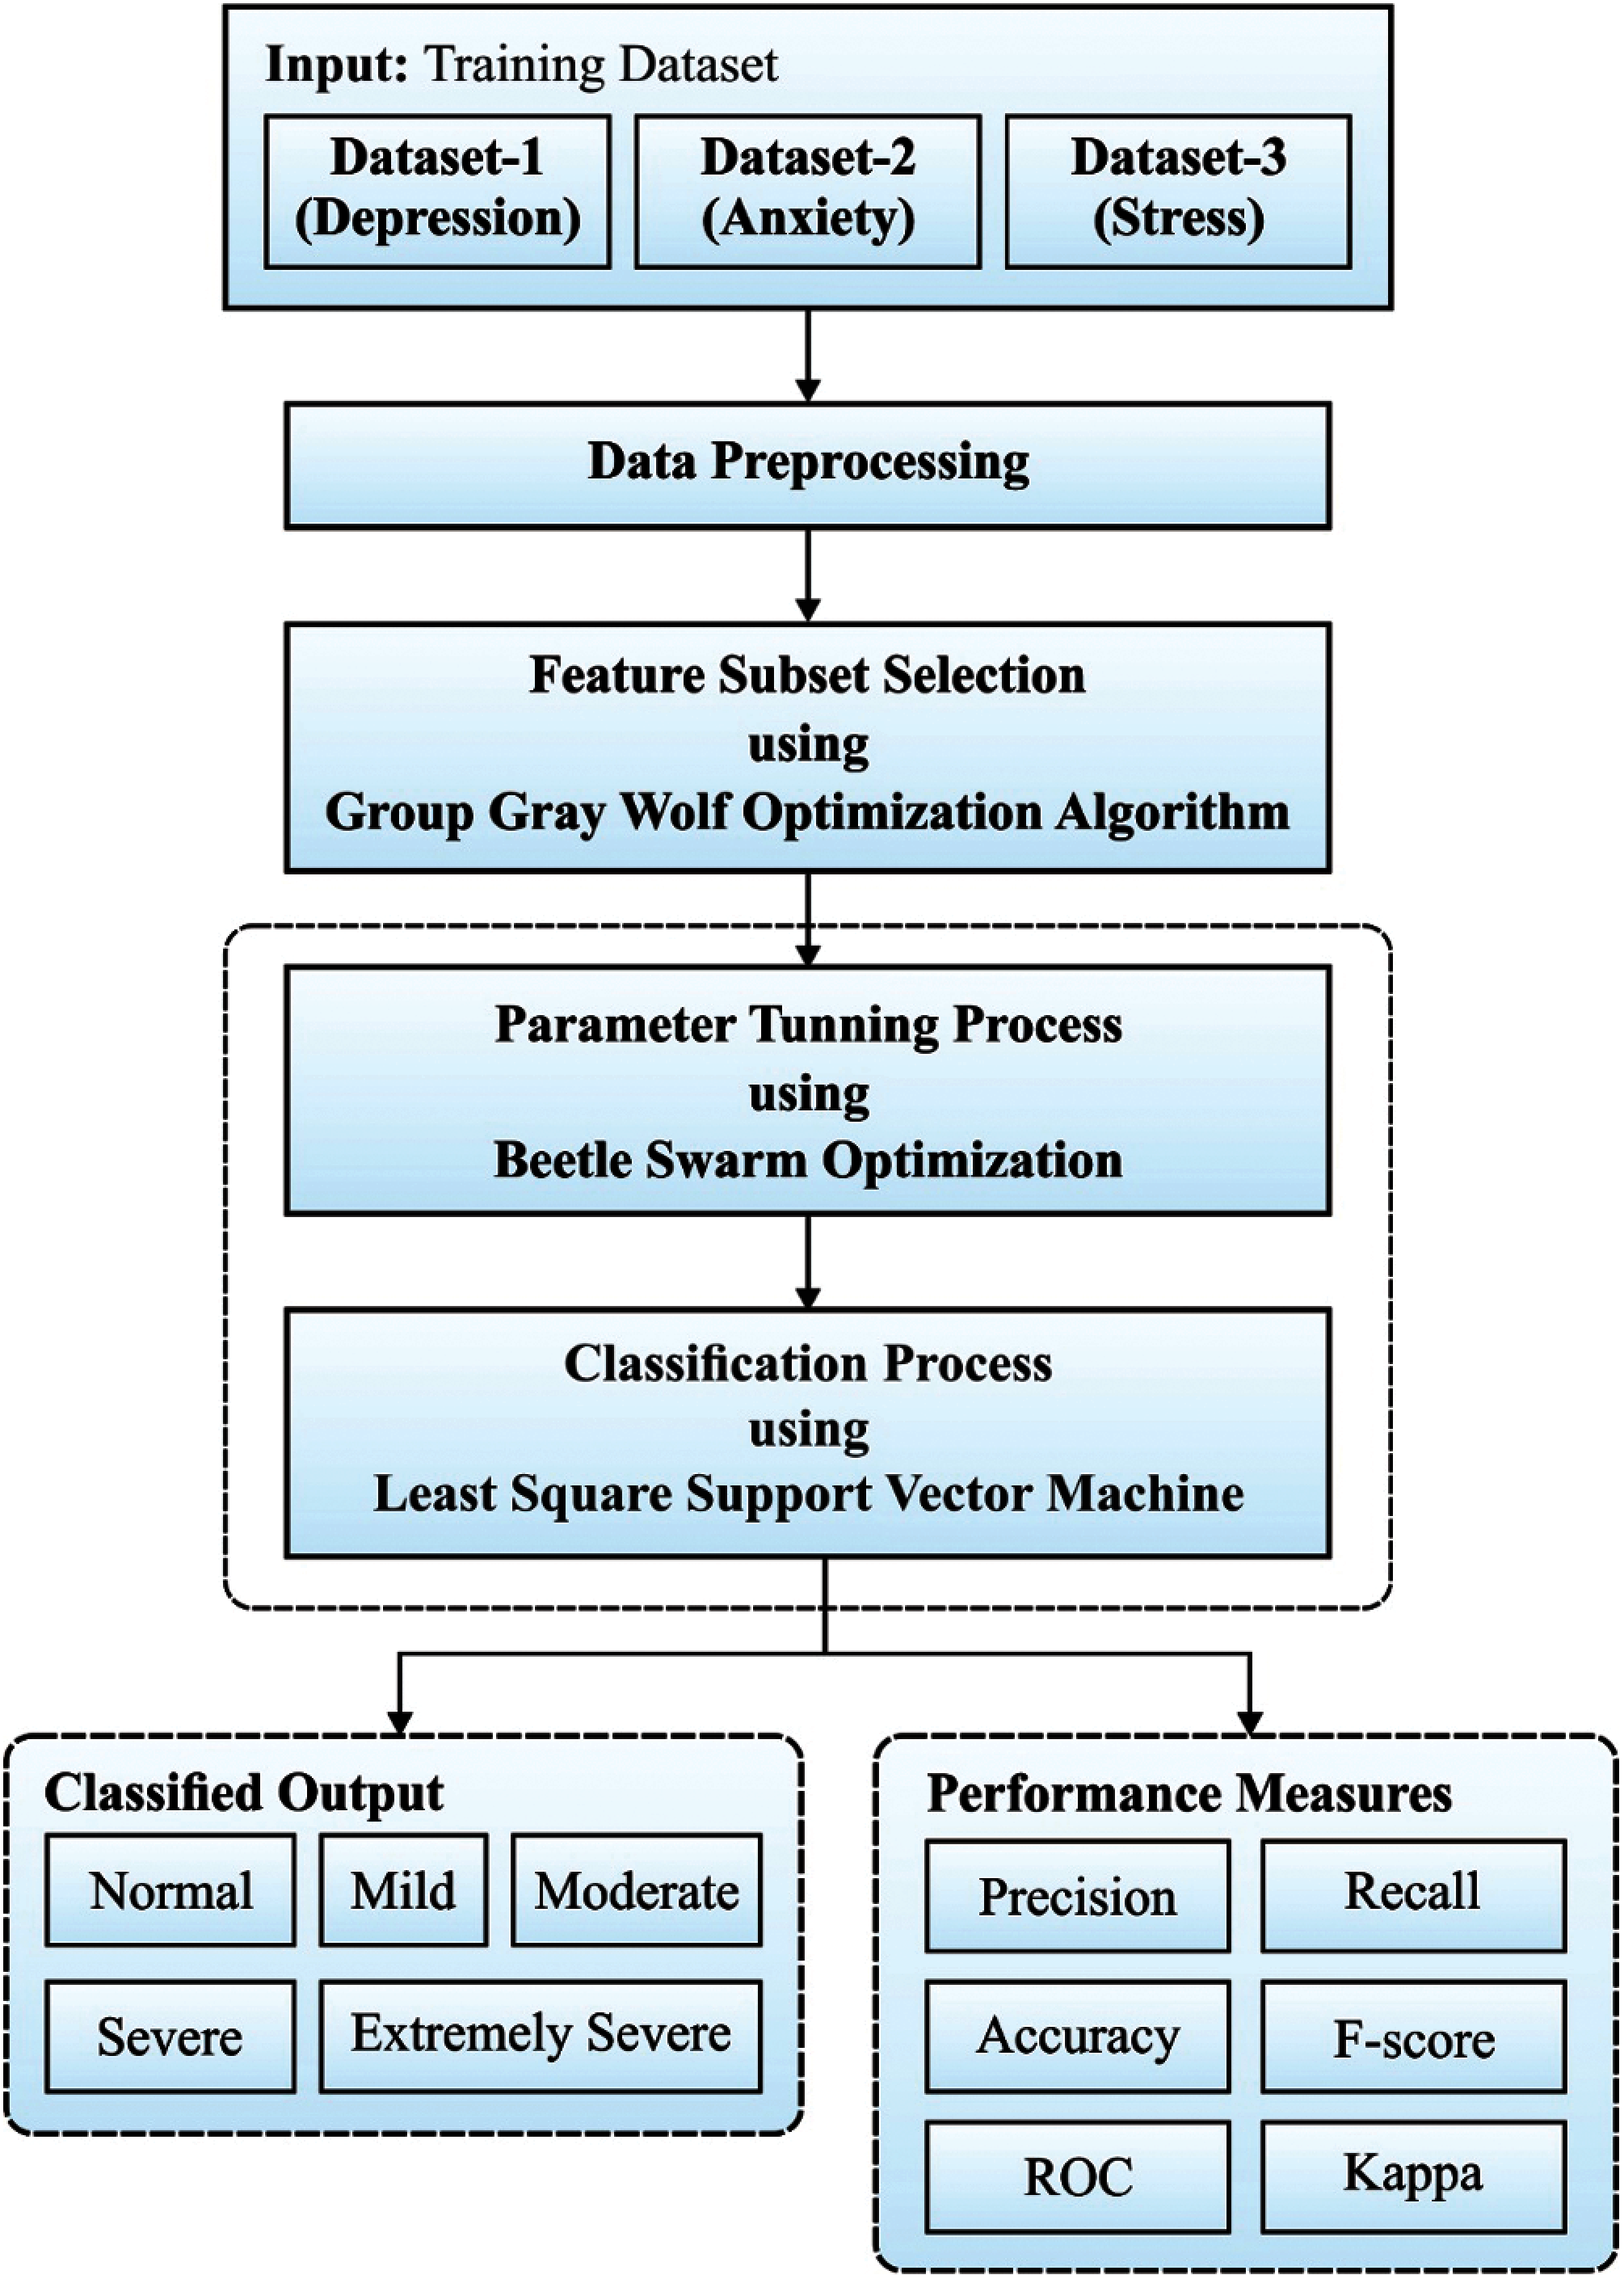
Figure 1: Working process of IFSSML-DAS model
1) Feature Set Initialization: In order to optimize the features, GGWO method creates an individual population of the swarm. Finding the solution is a crucial development in enhancing the method since the best solution is identified quickly. The determined feature set is given herewith.
2) Grouping model: For group creation, grey wolfs (i.e., features) are initially ordered based on their processing from diving requests. The basic features present in the ordered wolves denote the optimal ones. The same types of features, from every collection, possess an equivalent pursuit space whereas three different collections of feature information are assumed for every instance.
3) Objective function: Fitness Function (FF) is highlighted as an important factor in classification process. Now, classification accuracy is the fundamental condition which is utilized to describe the FF. For every registered cycle, FF is evaluated as follows.
4) Updating feature selection: After considering the fitness function, the solution gets updated based on the recreation of grey wolves. Considering the initial iteration, the feature prearrangement is separated by three features such as best α, best β, and best ω. According to three grey wolves, the enhanced method is performed to select the best feature during classification procedure. The projected method utilizes the condition given below.
Coefficient vectors are given herewith.
where,
Hunting behavior: Chase is customarily directed by α, whereas
Enclosing the performance, the following equation is utilized for modeling the process in a mathematical way.
where,
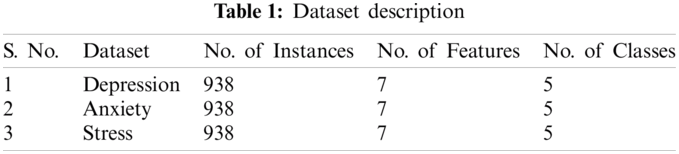
5) Termination process: The algorithm gets terminated after reaching the maximum number of rounds and when the solution, encompassing the optimum fitness value, is selected. When optimum fitness with best features are attained, it denotes that the features are provided to classification method. Fig. 2 shows the flowchart of GGWO technique.
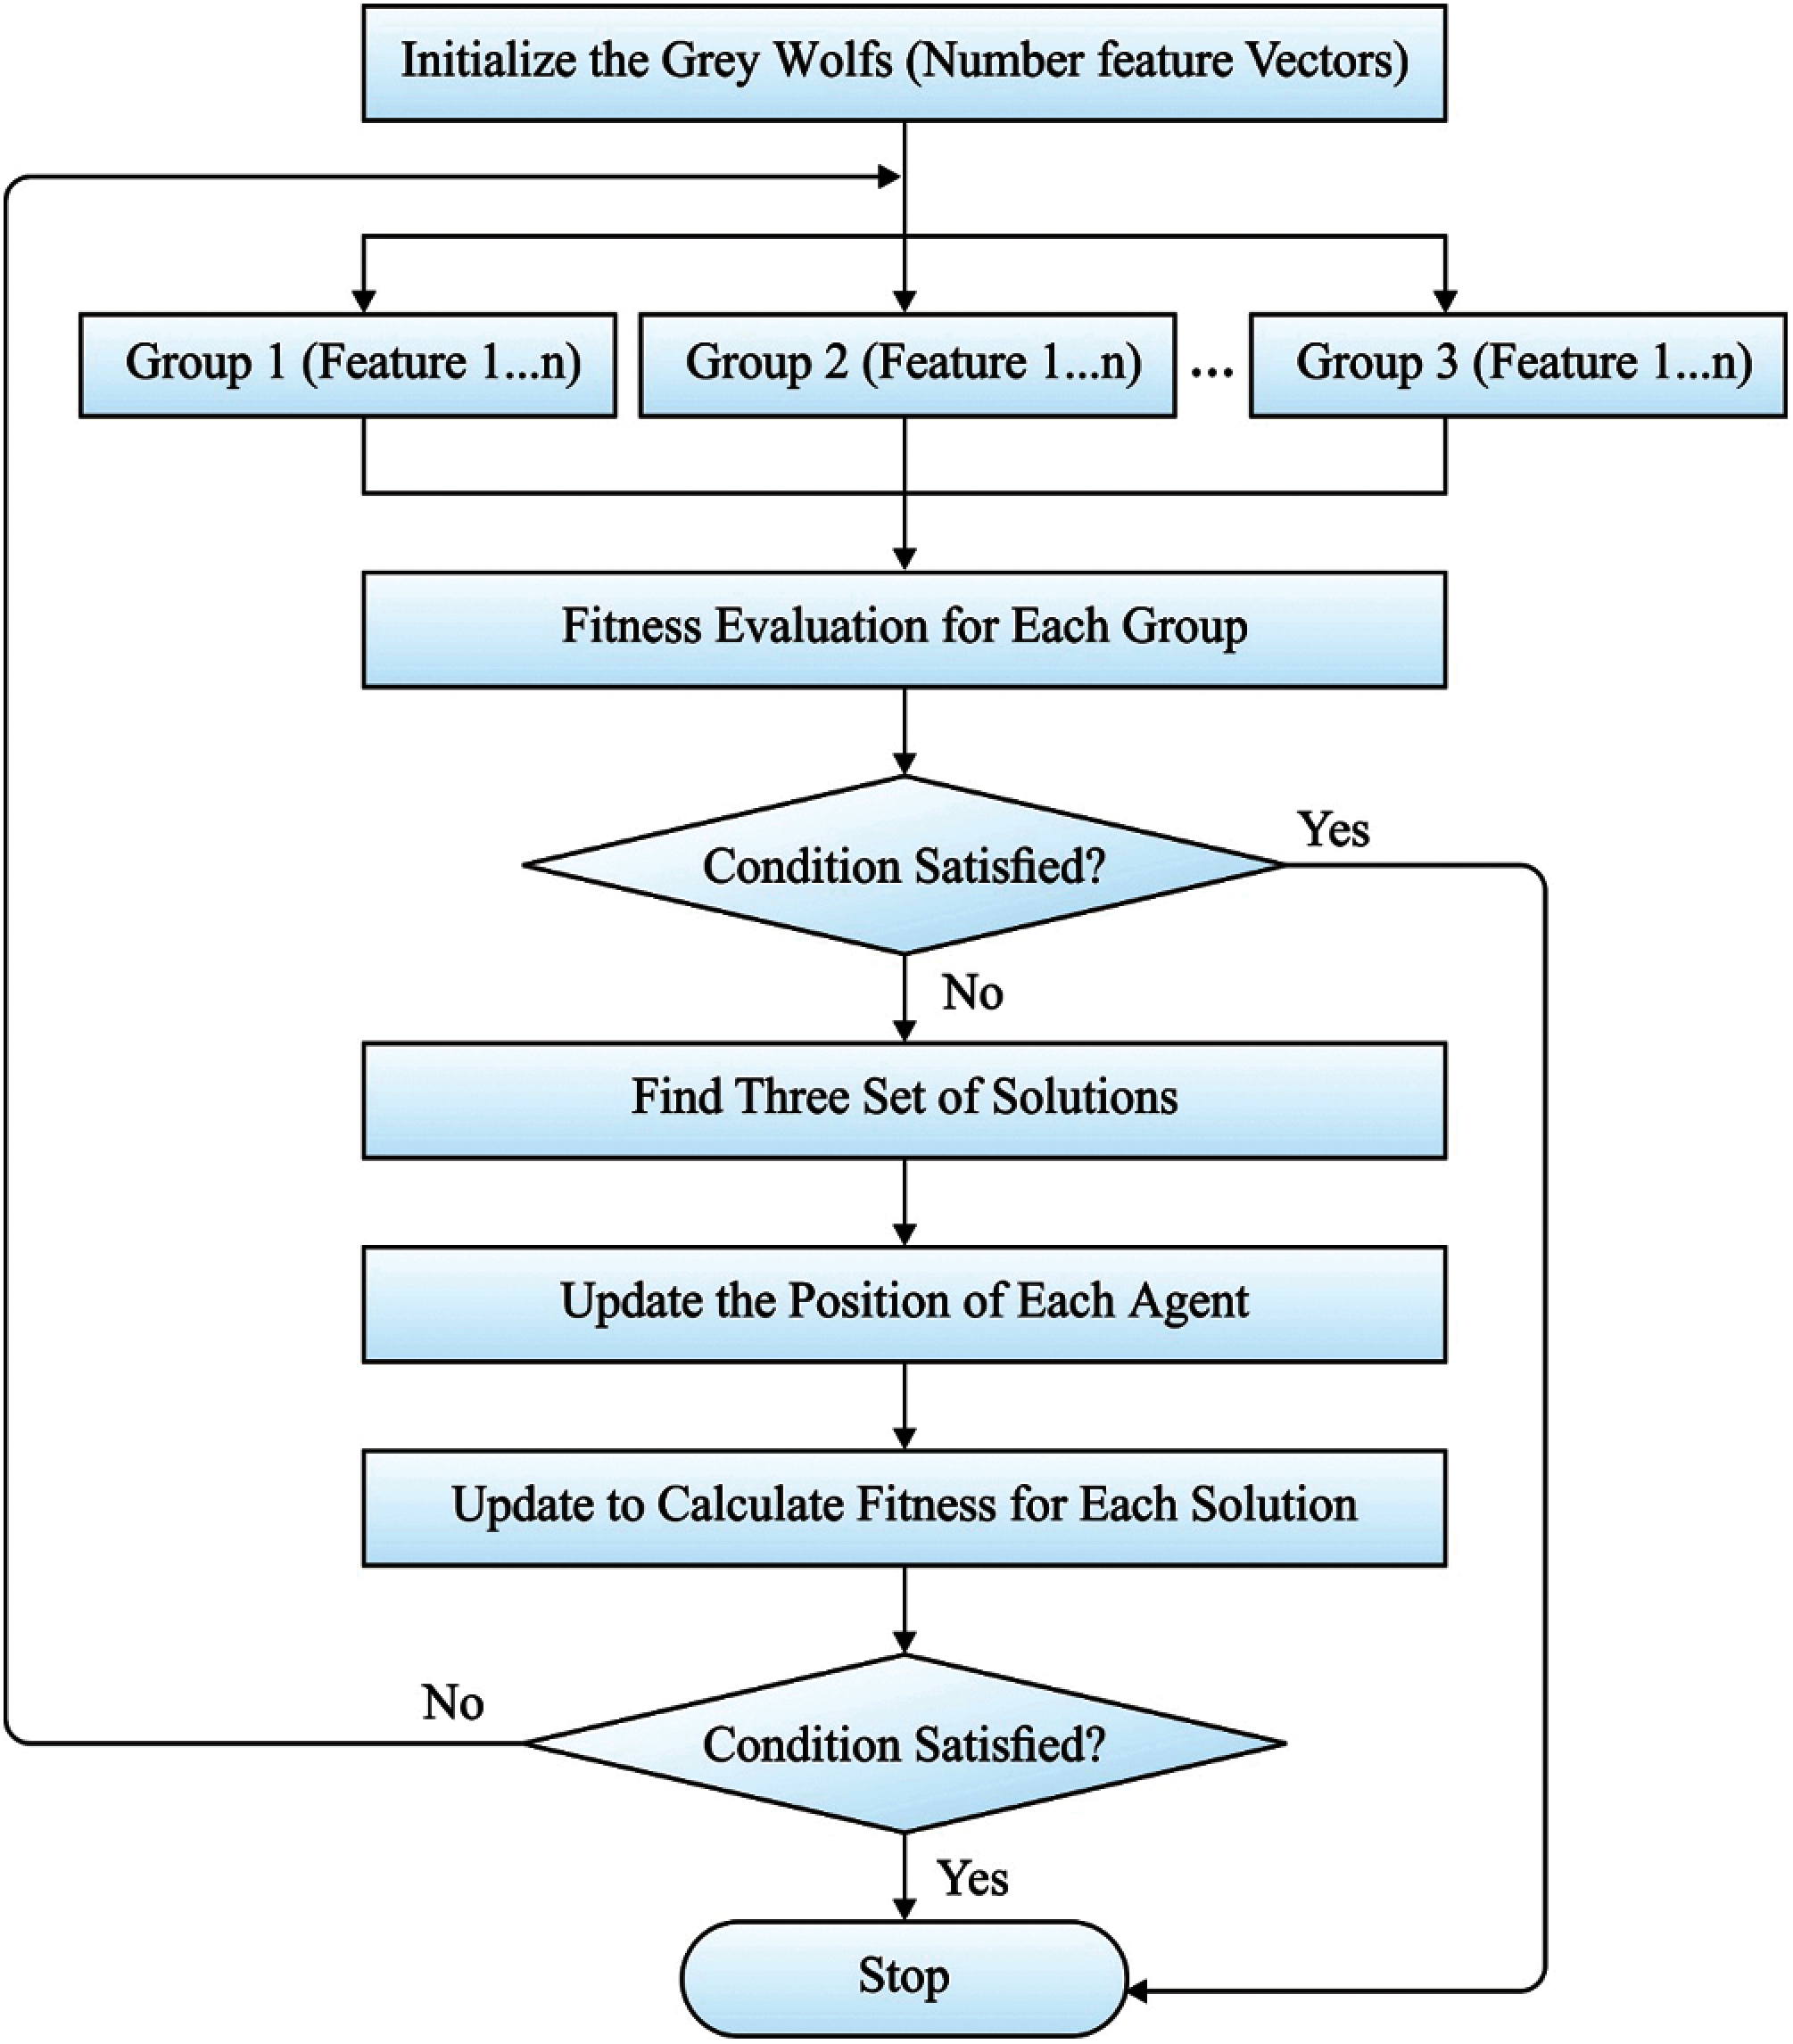
Figure 2: Flowchart of GGWO algorithm
3.4 DAS Classification Using BSO-LSSVM Model
In BSO-LSSVM-based data classification process, the chosen subset of features is fed as input to allocate appropriate class labels. In addition, BSO algorithm is utilized to adjust the weight and bias values of LSSVM model to enhance the predictive outcome up to a considerable value. LSSVM is an enhanced method of SVM and is commonly employed in classification process. Though modified, its basic concept remains unchanged. To be specific, identifying the hyperplane that can optimize the classification and maximize the gap between classification processes in order to increase the reliability. The variance between SVM and LSSVM is its design of objective function of LSSVM via binomials for error factor. Simultaneously, the limitations of both methods are equally constraining and can be related to resolve the optimization issue, since LSSVM is highly constrained. Fig. 3 demonstrates the hyperplane of SVM model. Here, linear equation method remains the solution and it decreases the complexity of this method, with an increase in revolving speed. These benefits make it different from other enhancements made in SVM method [18].
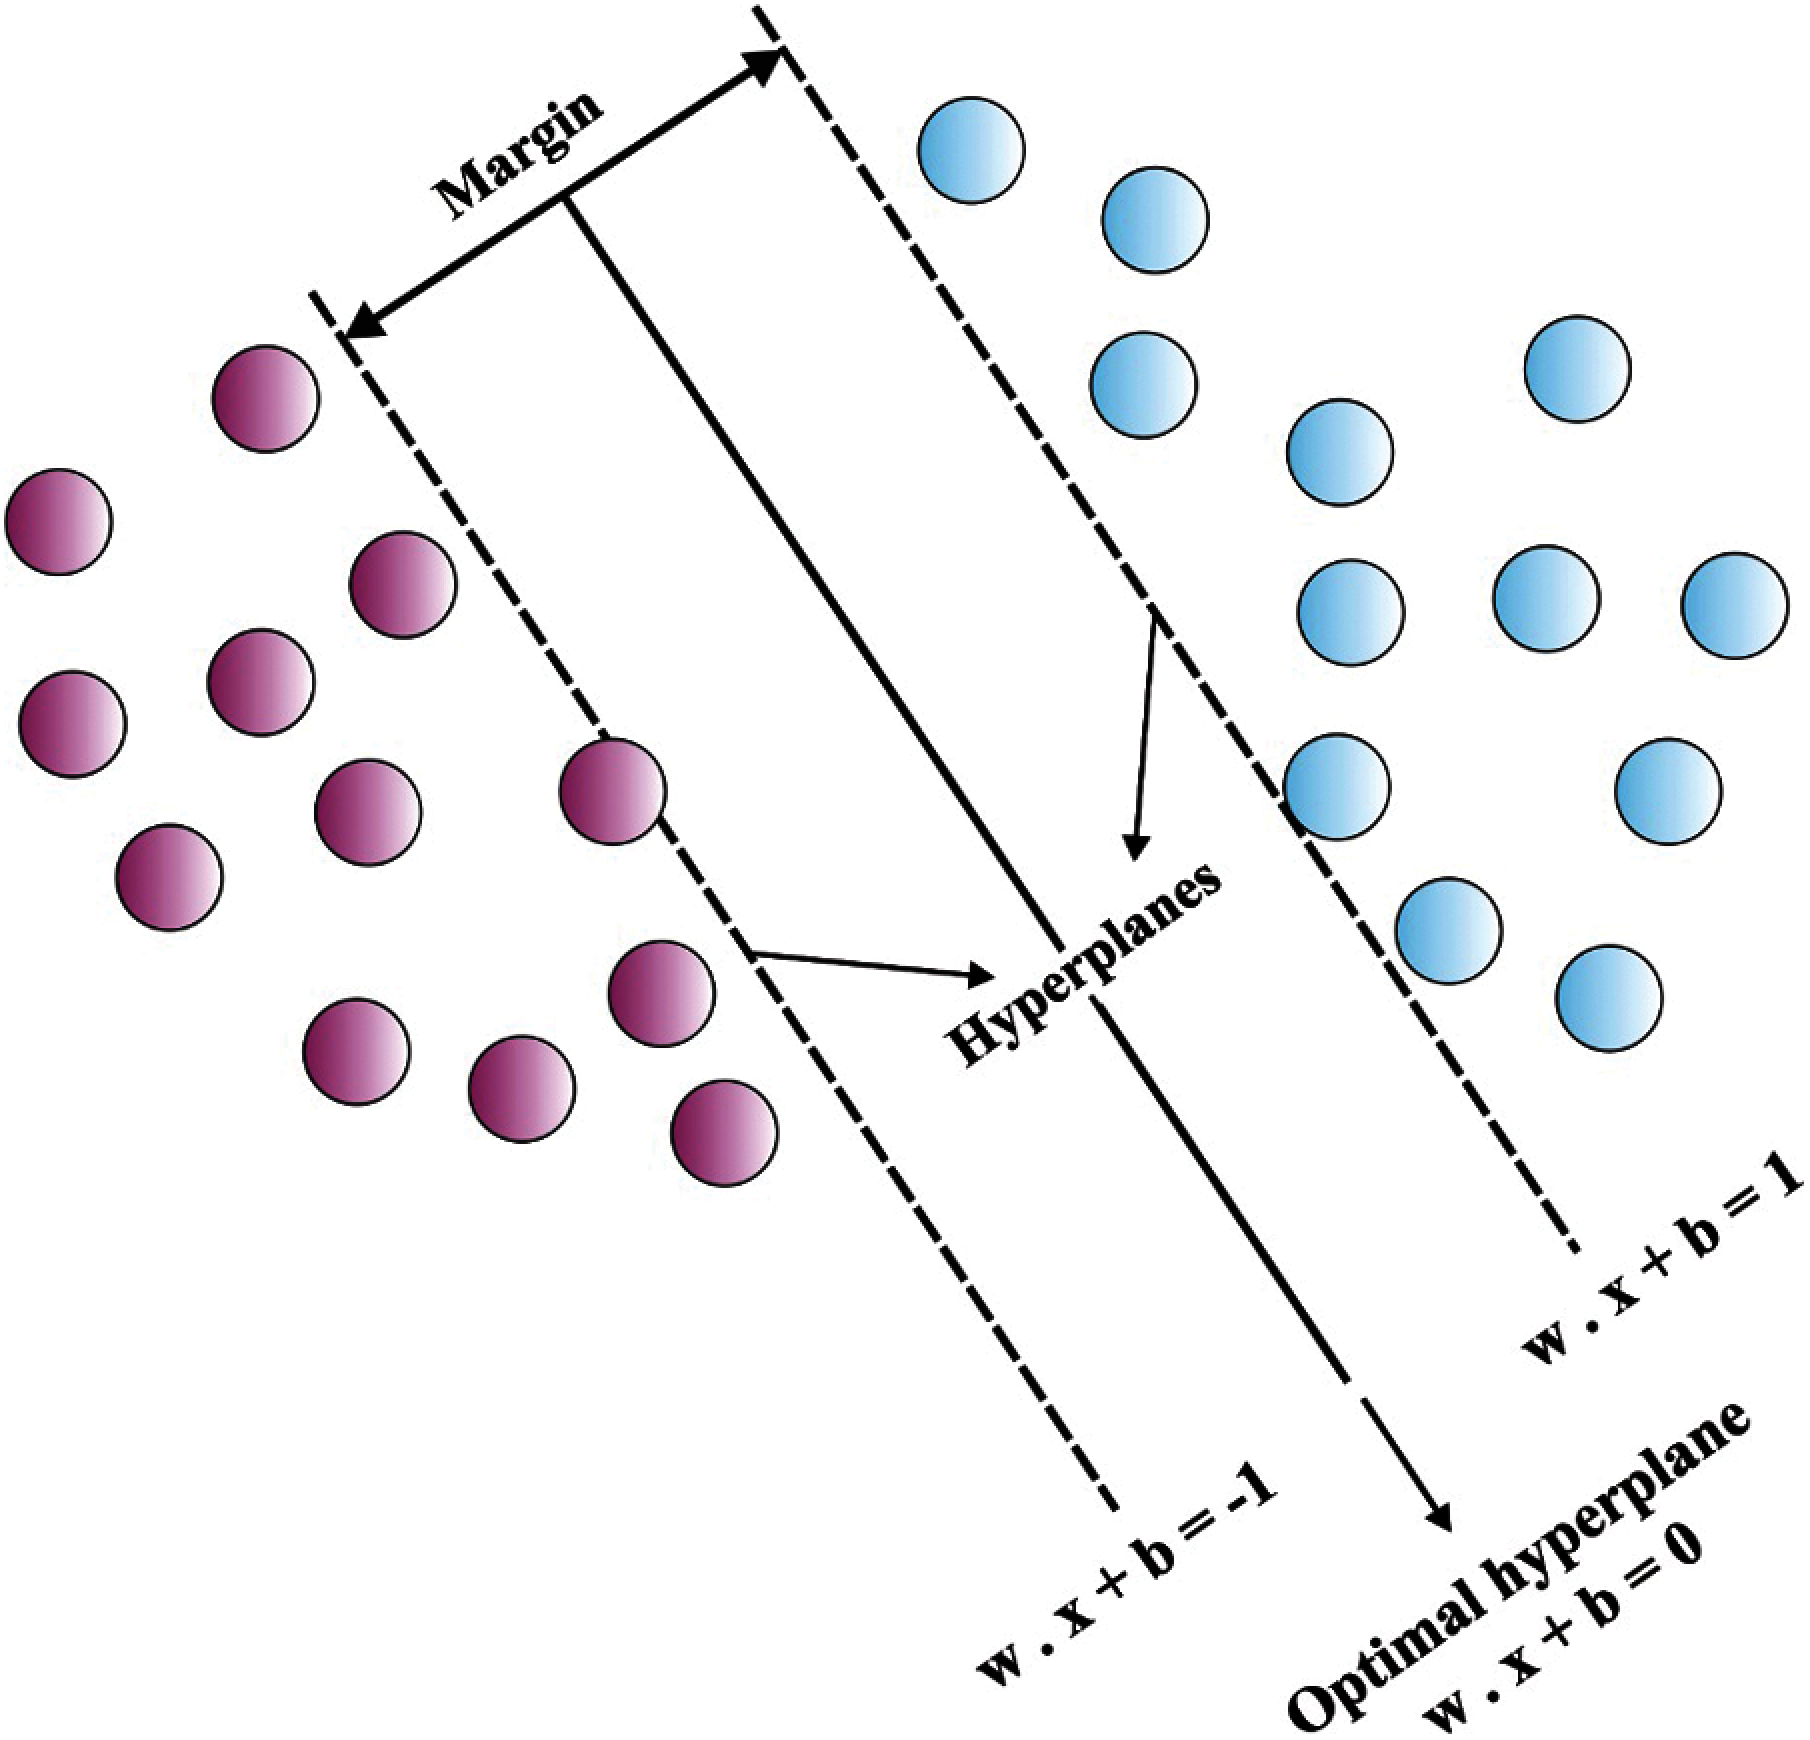
Figure 3: Hyperplane of SVM
The fundamentals of this technique are defined in this section. An instance of trained data is demonstrated by
where
Type
where
where I represents the identity matrix. Based on Mercer condition, the kernel function is given by
Once
In order to tune the weight and bias parameters of LSSVM model, BSO algorithm is employed. It aims at enhancing the classification accuracy. A 10-fold Cross-Validation (CV) model is also implemented to evaluate FF. In 10-fold CV, the training dataset is arbitrarily separated into 10 mutually exclusive subsets of equivalent size, among which 9 subsets are utilized for training the data while one final subset is utilized for testing the data [19]. The aforementioned process is repeated for 10 times so that all the subsets are utilized, once for testing. FF is determined as
where,
In BSO method, every beetle denotes a significant solution for optimization problem and is equal to a fitness value, defined by FF. Mathematically, it borrowed the concept of PSO technique. There is a population of
where
where
The current study follows the approach of reducing inertia weight and its equation is as follows
where
where
To represent the search path in a visual manner, the researchers utilized a small population size and displayed the position changing procedure for ten iterations in 3-dimensional space. Since factors like step length and inertial weight coefficient get reduced during iterative procedure, the technique does not meet the targeted point too early. So, the group avoids from falling under local optimum group significantly. BSO technique initializes a group of arbitrary solutions. In every iteration, the search agent upgrades its position according to the individual search method while the optimum solution is presently accessible. The integration of these two portions cannot speed up the population iterations. However, it decreases the likelihood of population falls to local optimal that is highly stable when handling high dimension problems. In this concept, BSO method involves the capacity of exploitation and exploration, thus it belongs to global optimization. Moreover, a linear integration of speed and beetle search processes improves the accuracy and rapidity of population optimization and results in highly stable method.
The current section examines the performance validation of the proposed model on the applied DAS dataset. Tab. 2 and Fig. 4 shows the results of FSS analysis attained by GGWO algorithm and other existing FSS algorithms. The resultant table values denote that GGWO algorithm accomplished better outcomes which can be understood from the least cost it achieved. For instance, on the applied depression dataset, GGWO algorithm obtained the least cost of 0.0083, whereas GWO, ACO, and PSO algorithms incurred heavy costs such as 0.0187, 0.0259, and 0.0351 respectively and performed badly. Likewise, on the applied anxiety dataset, GGWO algorithm obtained the least cost of 0.0173, whereas GWO, ACO, and PSO algorithms achieved worst performance and their best cost was 0.0190, 0.0268, and 0.0391 respectively. At last, on the applied depression dataset, GGWO model achieved the least cost of 0.0457, whereas GWO, ACO, and PSO algorithms accomplished bad performance with best costs such as 0.0782, 0.0829, and 0.0973 correspondingly.
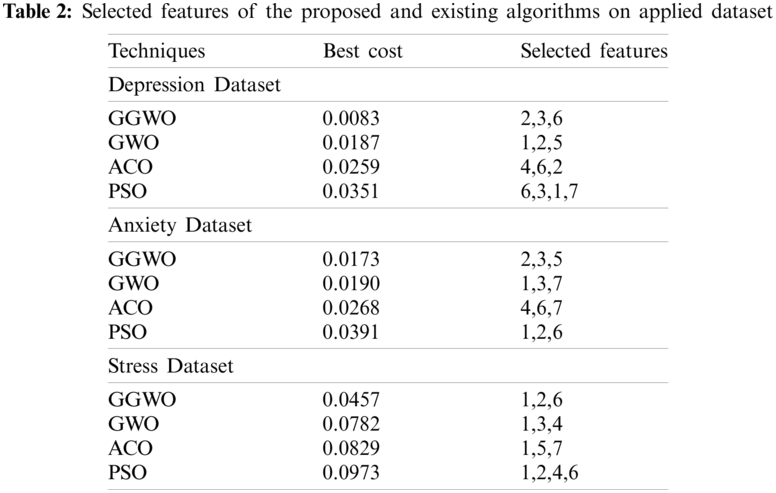
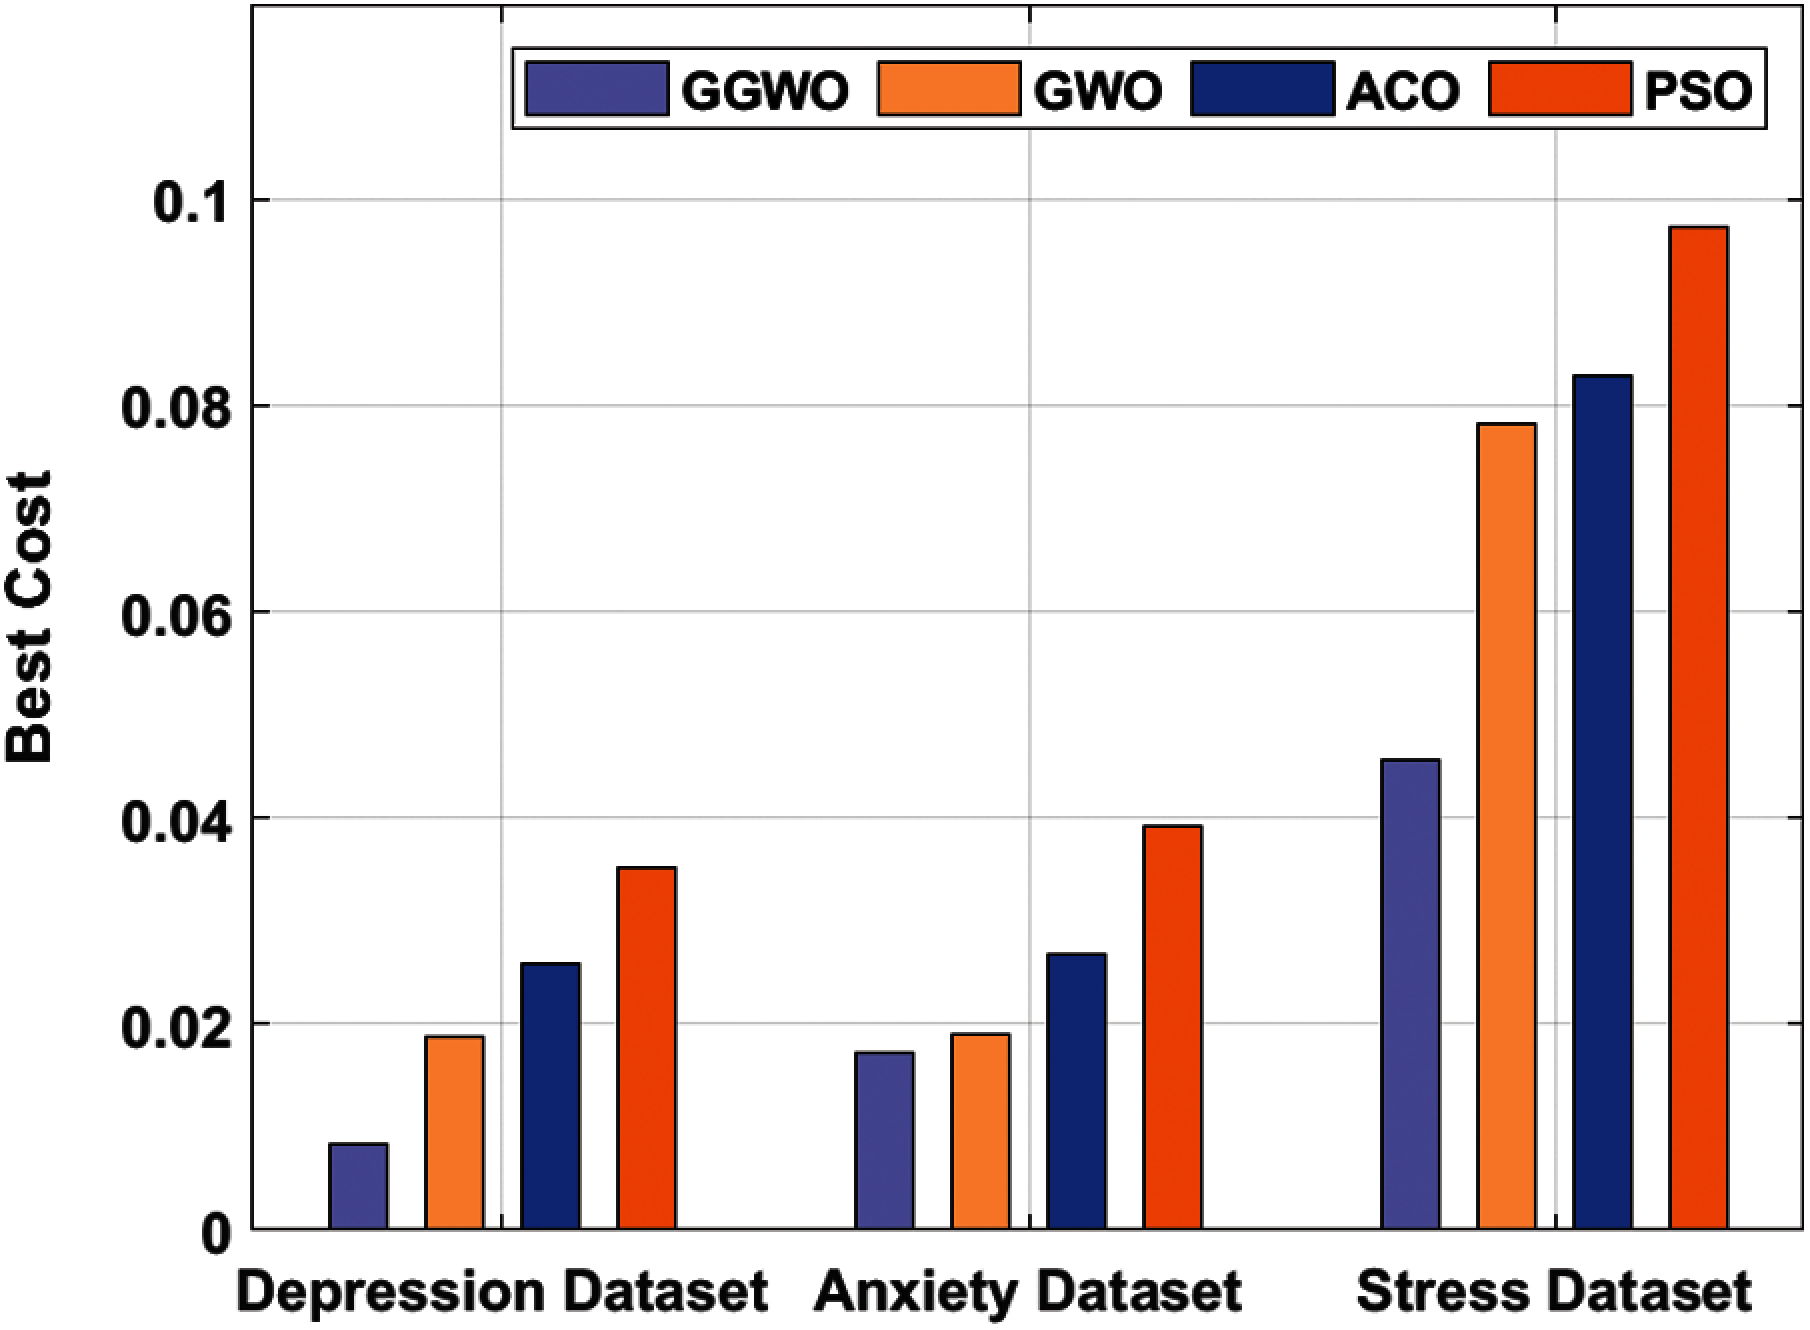
Figure 4: FSS analysis results of GGWO model with existing methods
The results attained by IFSSML-DAS model and other existing methods from a brief comparative analysis on depression dataset are shown in Tab. 3 and Fig. 5. From the obtained results, it is obvious that the CART method achieved the least performance since it attained a precision of 0.75, recall of 0.8, accuracy of 0.8, F-score of 0.779, and kappa of 0.331. Besides, RepTree model showcased a slightly higher outcome than CART method as it obtained a precision of 0.763, recall of 0.815, accuracy of 0.815, F-score of 0.782, and kappa of 0.341. Moreover, J48 model accomplished better performance by attaining a precision of 0.801, recall of 0.822, accuracy of 0.822, F-score of 0.81, and kappa of 0.43. Simultaneously, the LR model yielded moderate outcomes with a precision of 0.909, recall of 0.903, accuracy of 0.903, F-score of 0.905, and kappa of 0.72. Concurrently, MLP model demonstrated a manageable outcome with a precision of 0.94, recall of 0.942, accuracy of 0.942, F-score of 0.94, and kappa of 0.828. Furthermore, ACO algorithm accomplished a reasonable performance with a precision of 0.939, recall of 0.992, accuracy of 0.976, F-score of 0.968, and kappa of 0.935. Though BSO-LSSVM model showcased near optimal results with a precision of 0.957, recall of 0.995, accuracy of 0.982, F-score of 0.749, and kappa of 0.964, the presented IFSSML-DAS model outperformed all other methods with a precision of 0.0.974, recall of 0.998, accuracy of 0.99, F-score of 0.985, and kappa of 0.978 respectively.
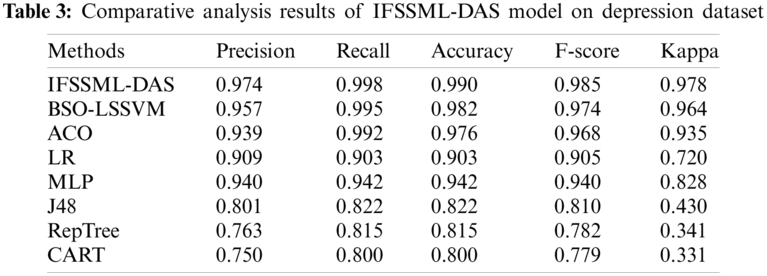
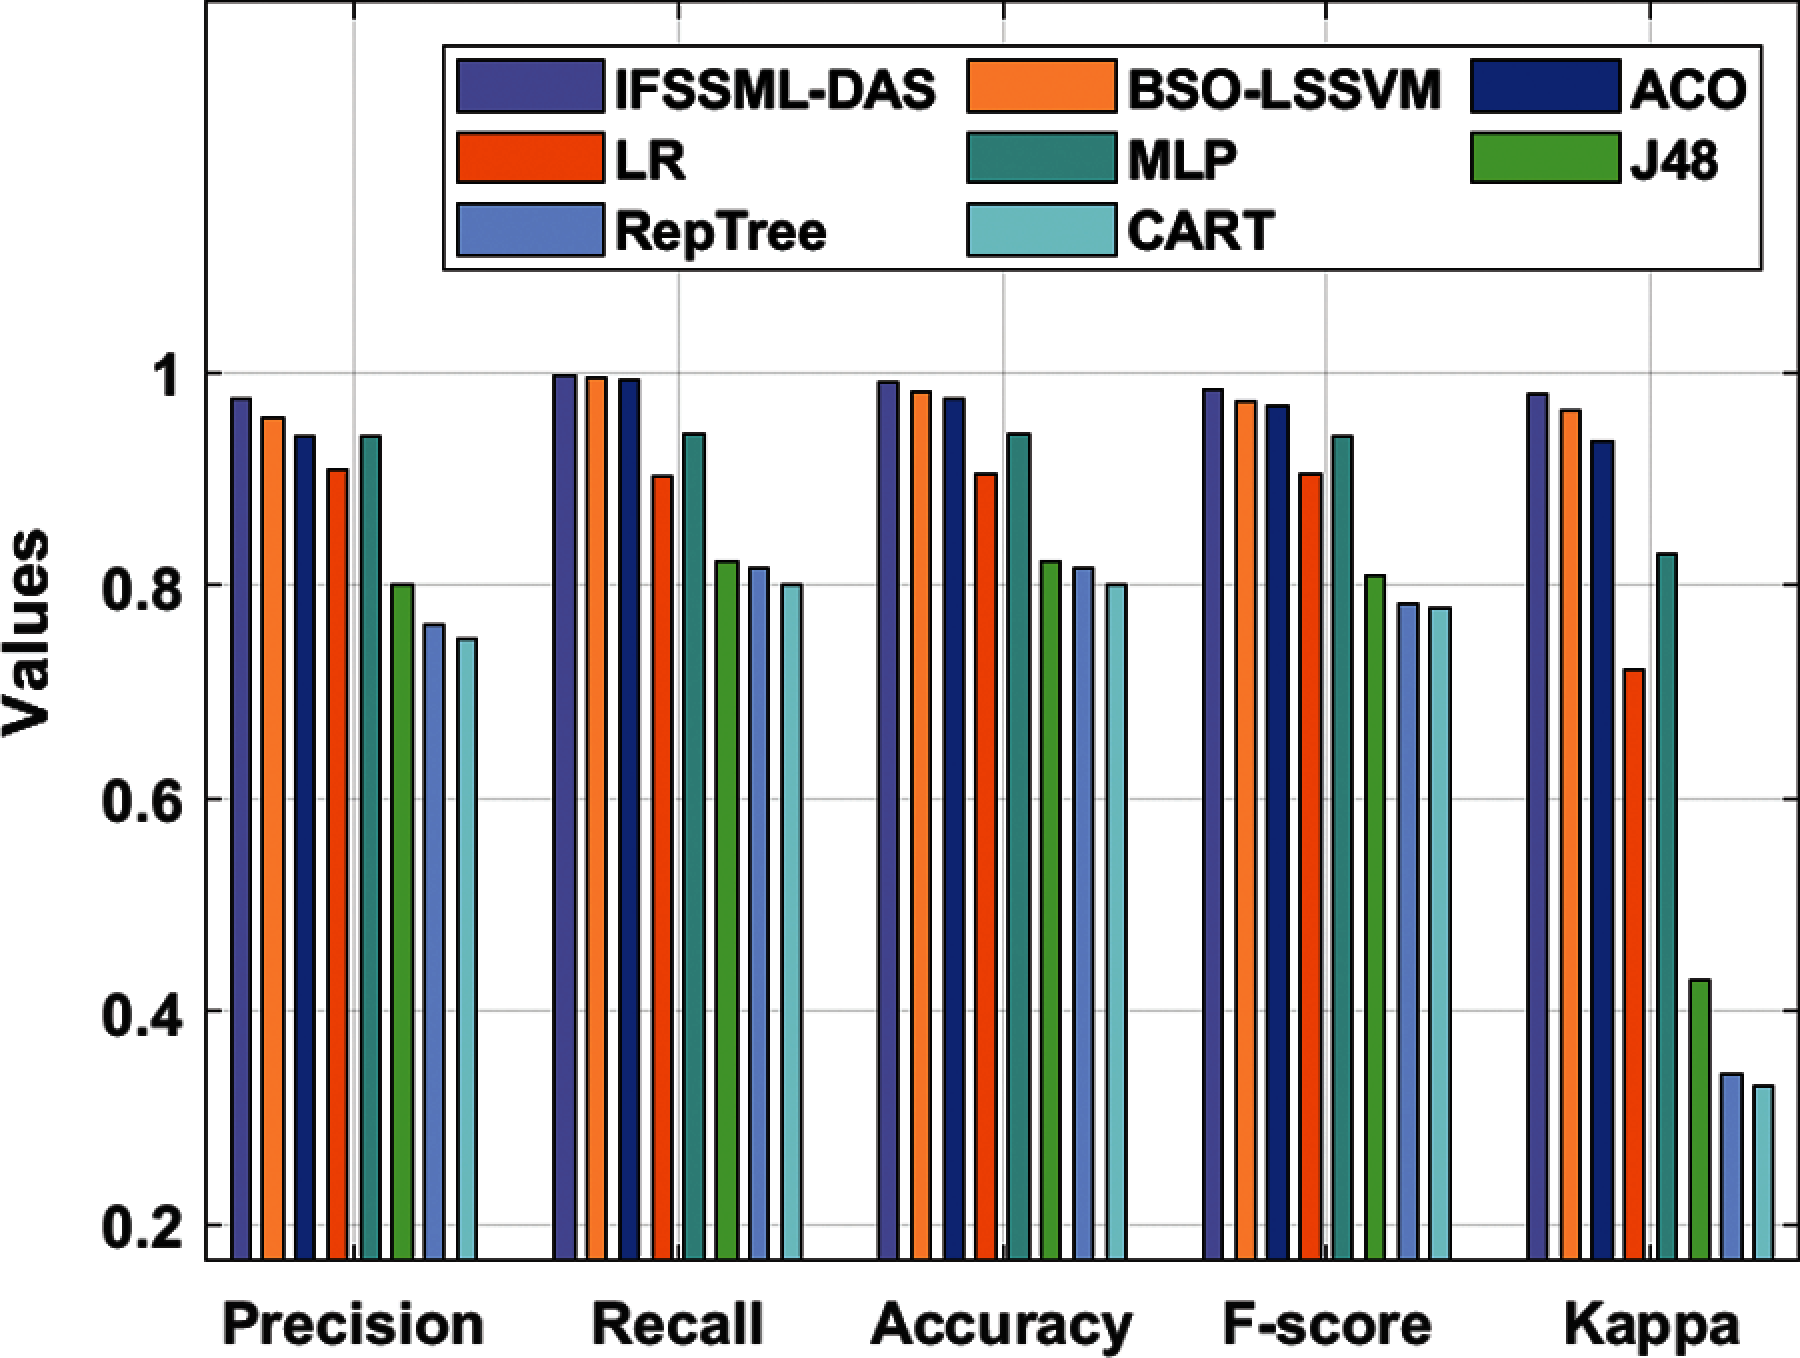
Figure 5: Results of the analysis of IFSSML-DAS model on depression dataset
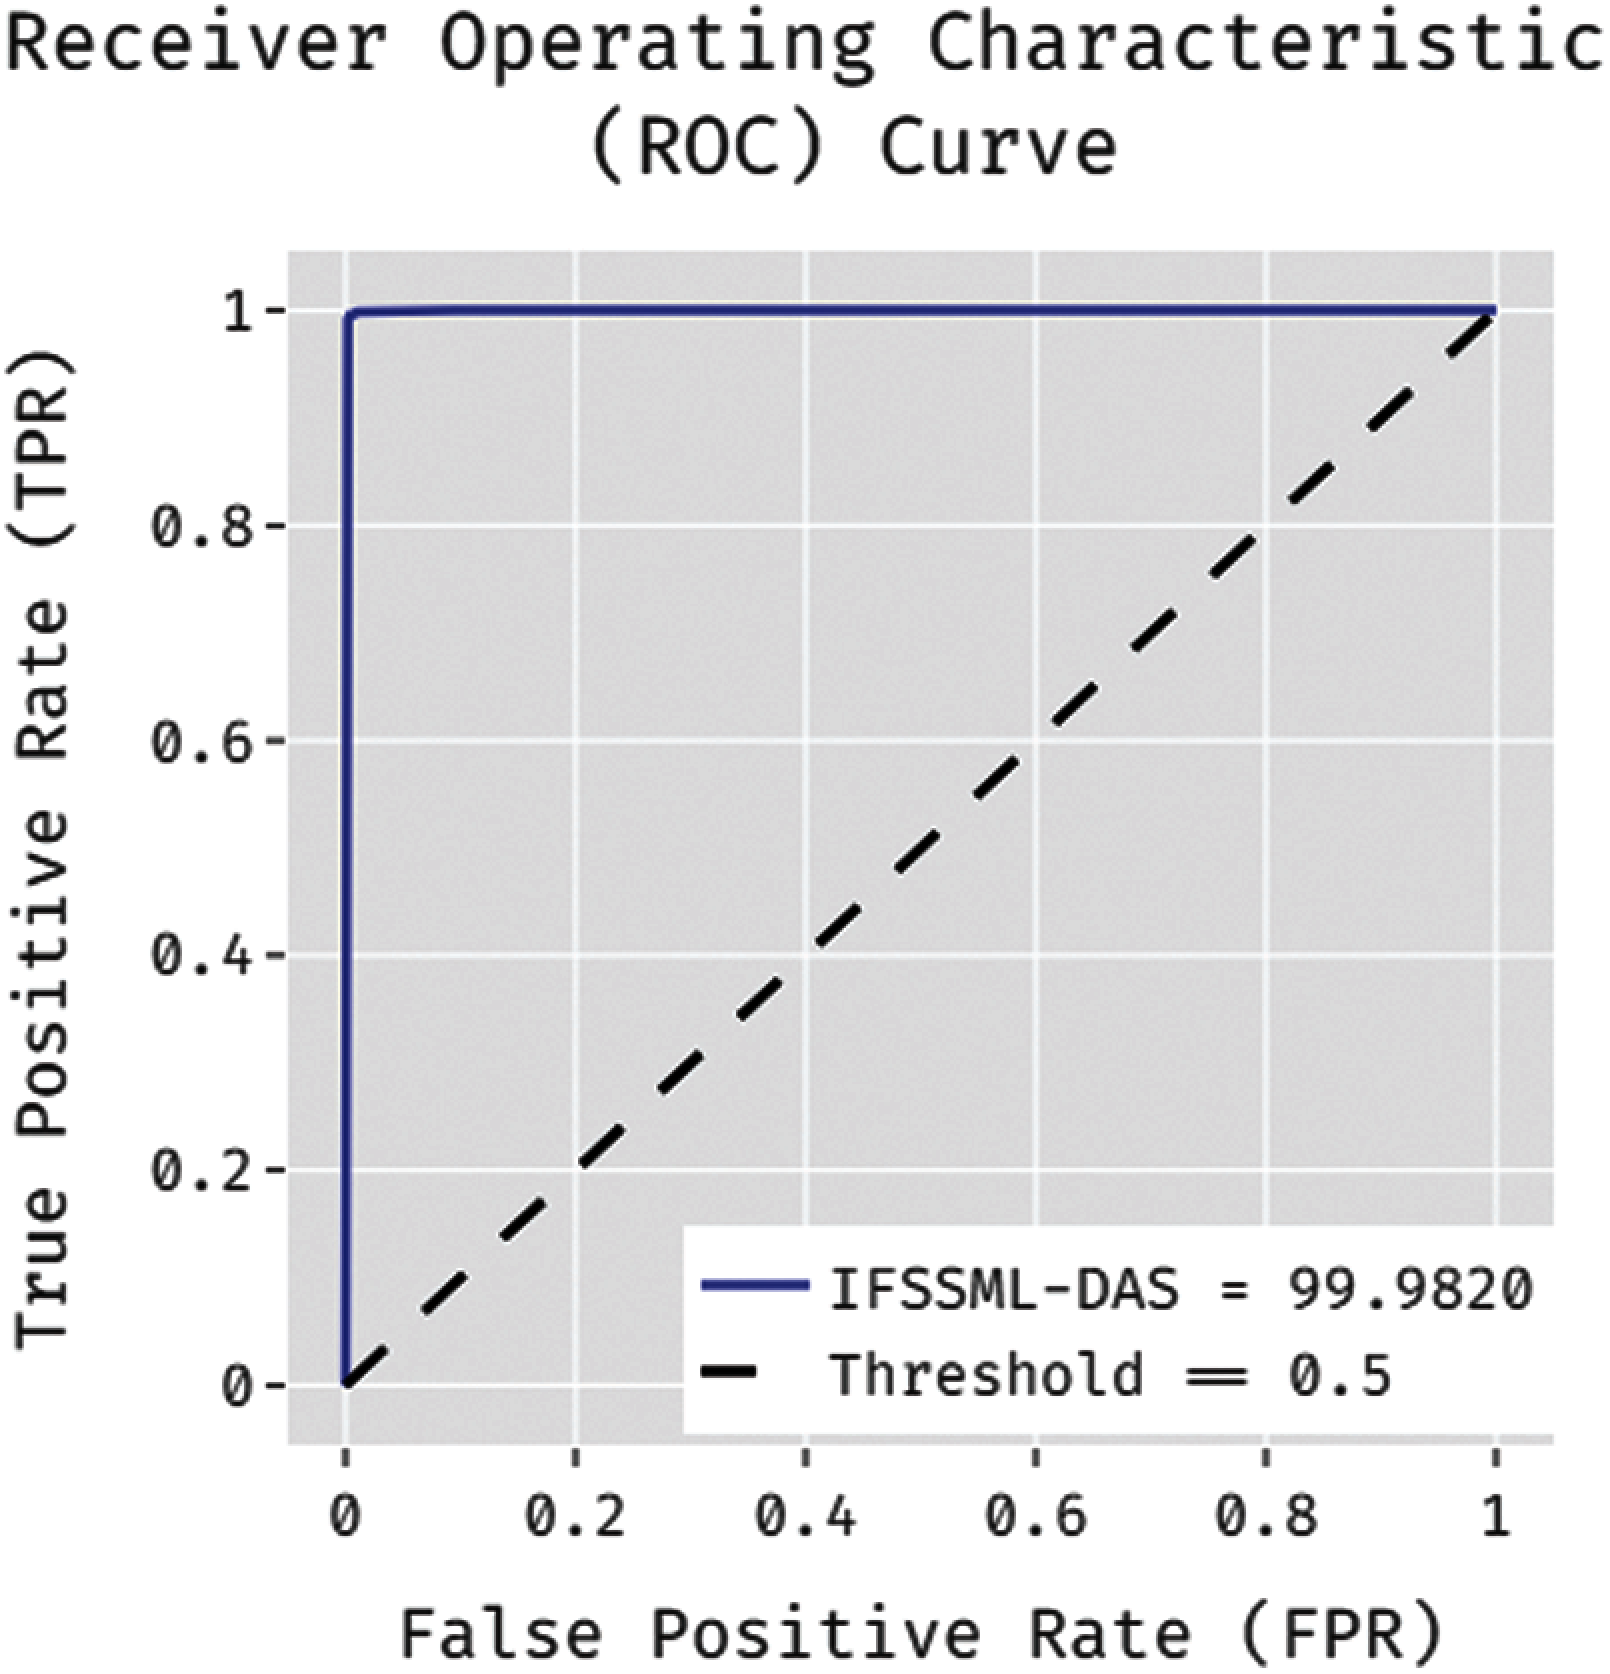
Figure 6: ROC analysis results of IFSSML-DAS model on depression dataset
Fig. 6 illustrates the results attained by the proposed IFSSML-DAS model during ROC analysis conducted using the depression dataset. From the figure, it is apparent that IFSSML-DAS model showcased improved classification results with an ROC of 99.9820.
In addition, the results of a detailed comparative analysis of IFSSML-DAS model against existing methods on anxiety dataset are shown in Tab. 4 and Fig. 7. From the results obtained, it is obvious that the RepTree method achieved the least performance with a precision of 0.81, recall of 0.852, accuracy of 0.852, F-score of 0.825, and kappa of 0.382. Besides, J48 model showcased a slightly higher outcome over CART method and it obtained a precision of 0.840, recall of 0.863, accuracy of 0.863, F-score of 0.849, and kappa of 0.471. Moreover, CART model accomplished a better performance with a precision of 0.861, recall of 0.887, accuracy of 0.887, F-score of 0.863, and kappa of 0.513.
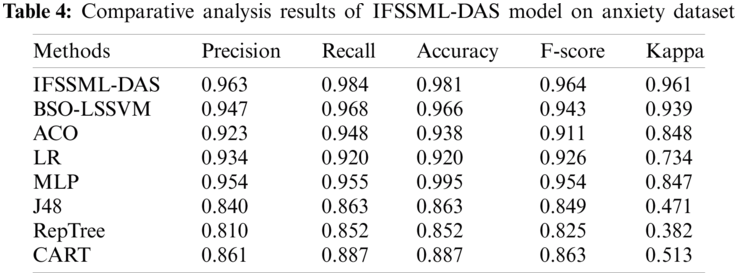
Simultaneously, ACO model achieved moderate outcomes with a precision of 0.923, recall of 0.948, accuracy of 0.938, F-score of 0.911, and kappa of 0.848. Concurrently, LR model demonstrated a manageable outcome with a precision of 0.934, recall of 0.920, accuracy of 0.920, F-score of 0.926, and kappa of 0.734. Furthermore, the BSO-LSSVM algorithm depicted a reasonable performance with a precision of 0.947, recall of 0.968, accuracy of 0.966, F-score of 0.943, and kappa of 0.939. Though MLP model almost achieved optimal results with a precision of 0.954, recall of 0.955, accuracy of 0.995, F-score of 0.954, and kappa of 0.847, the presented IFSSML-DAS model outperformed all other methods with a precision of 0.963, recall of 0.984, accuracy of 0.981, F-score of 0. 964, and kappa of 0.961.
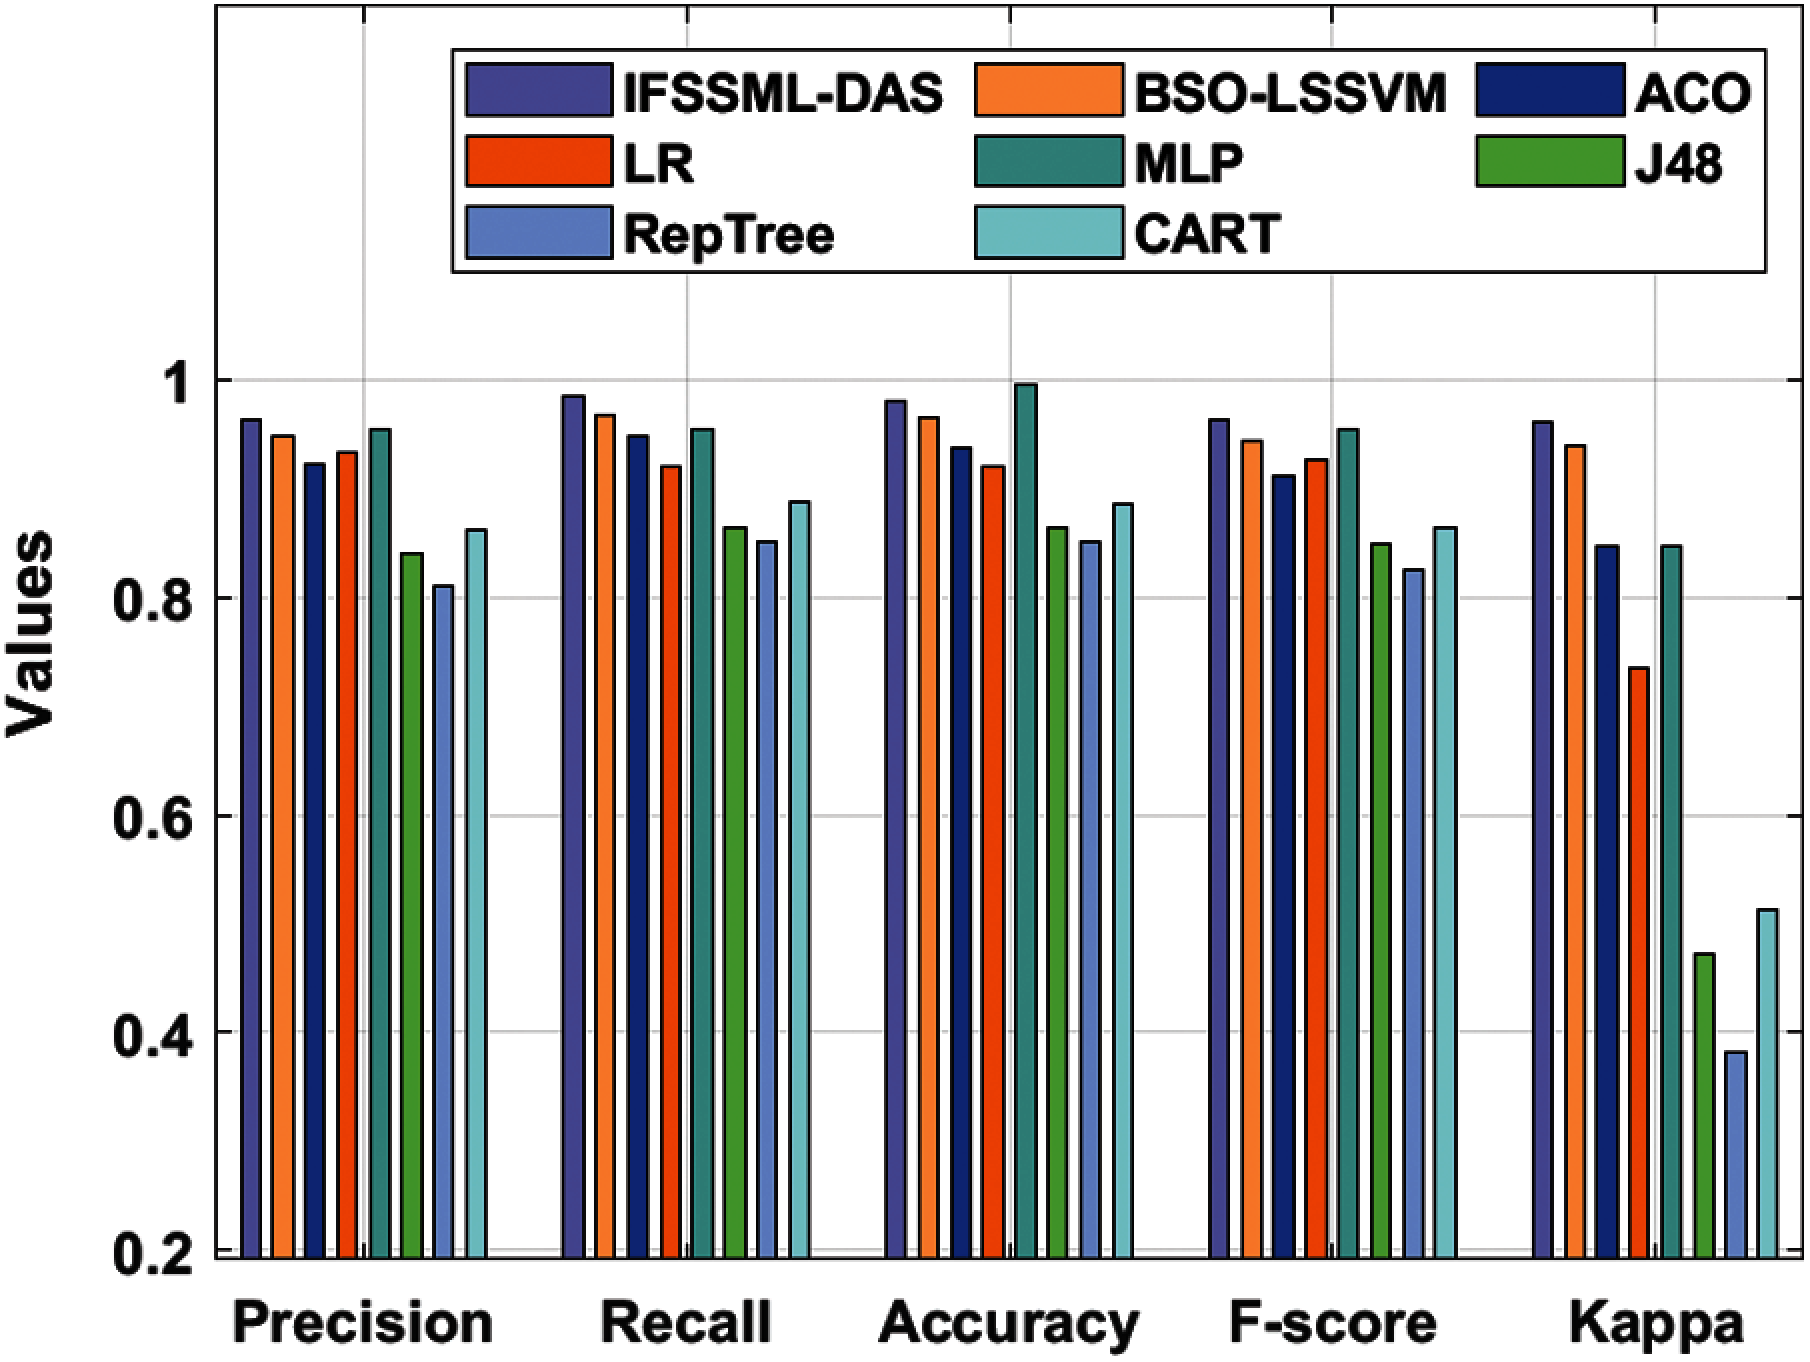
Figure 7: Results of the analysis of IFSSML-DAS model on anxiety dataset
Fig. 8 illustrates the results attained by the proposed IFSSML-DAS model during ROC analysis upon anxiety dataset. From the figure, it is apparent that the presented IFSSML-DAS model achieved high classification results with an ROC of 99.5841.
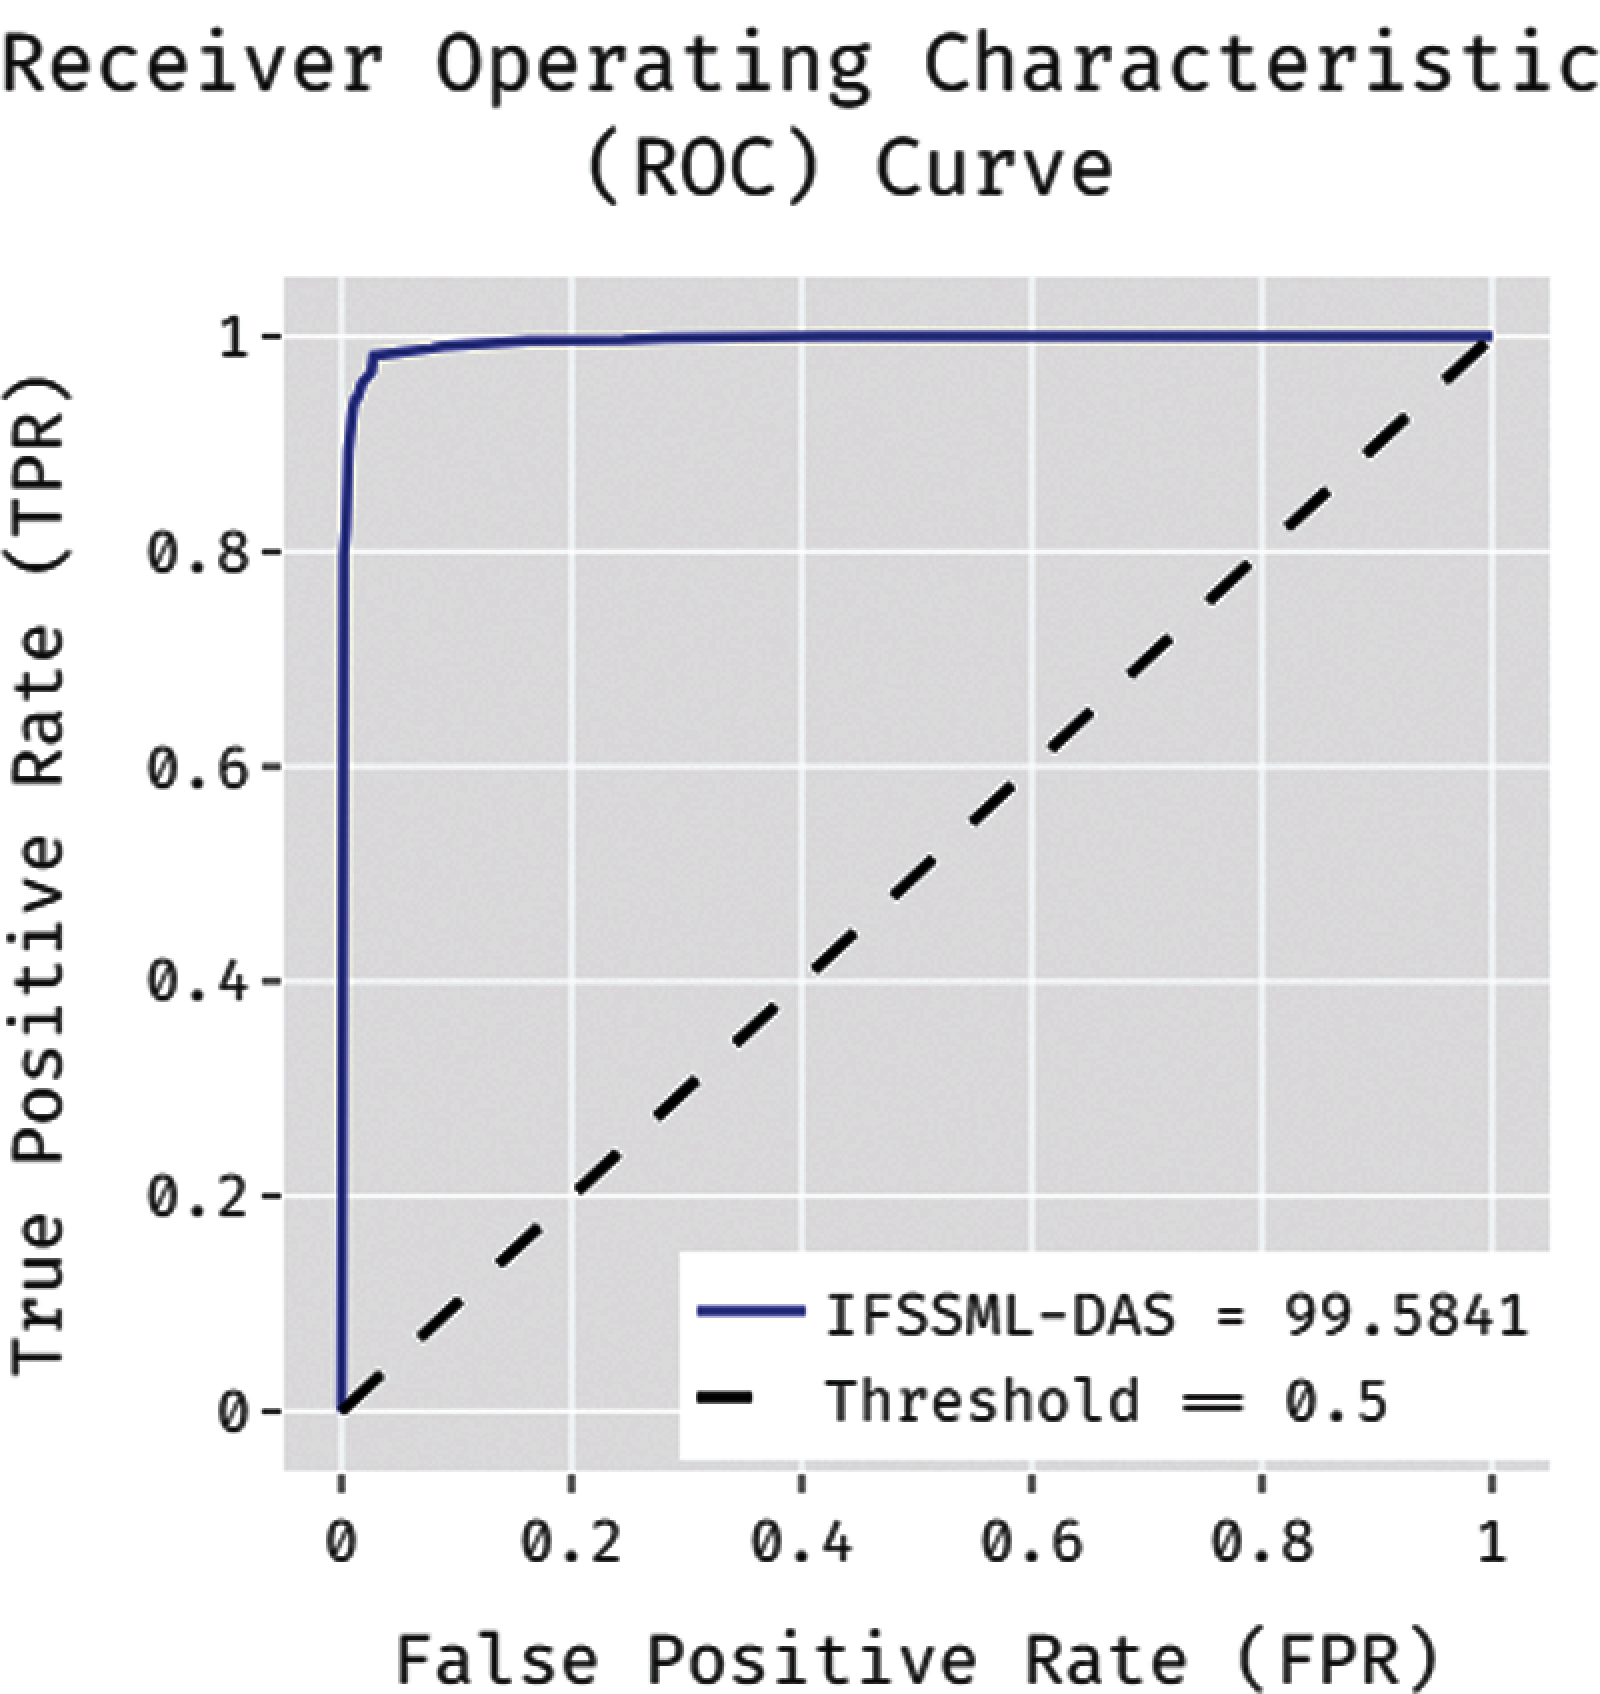
Figure 8: ROC analysis of IFSSML-DAS model on anxiety dataset
The results for a comprehensive comparative analysis of IFSSML-DAS model with existing methods on stress dataset are shown in Tab. 5 and Fig. 9. From the obtained results, it is obvious that RepTree method accomplished the least performance with a precision of 0.763, recall of 0.815, accuracy of 0.815, F-score of 0.782, and kappa of 0.341. Besides, J48 model showcased slightly increased outcomes over CART method by obtaining a precision of 0.801, recall of 0.822, accuracy of 0.822, F-score of 0.810, and kappa of 0.430. Moreover, CART model accomplished comparatively better performance with a precision of 0.861, recall of 0.887, accuracy of 0.887, F-score of 0.863, and kappa of 0.513. Simultaneously, LR model achieved moderate outcomes with a precision of 0.909, recall of 0.903, accuracy of 0.903, F-score of 0.905, and kappa of 0.720.
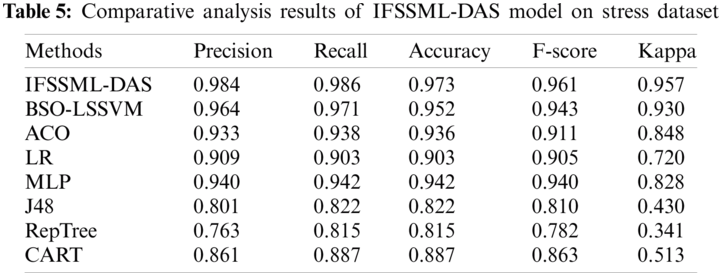
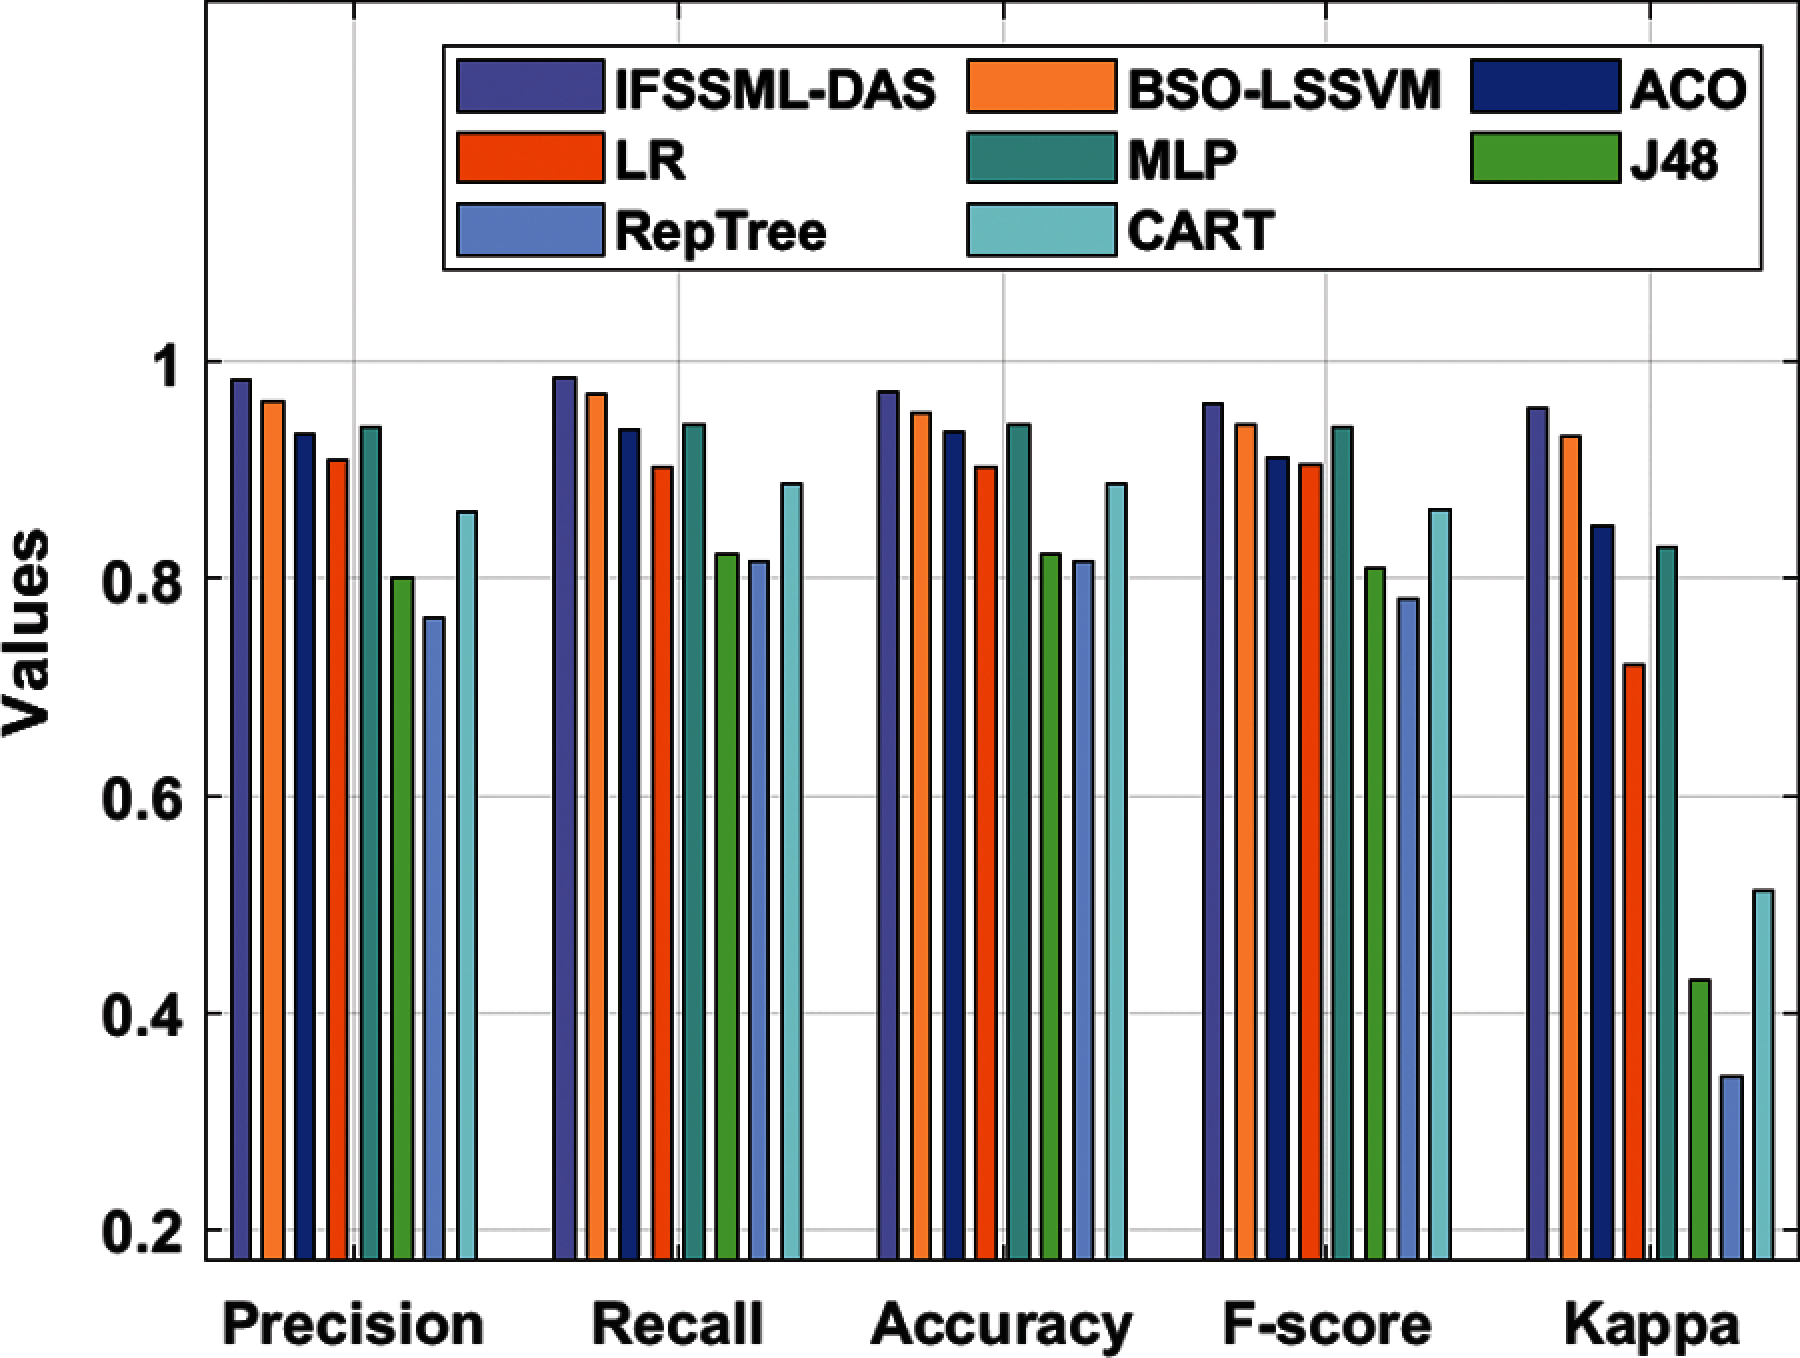
Figure 9: Result analysis of IFSSML-DAS model on stress dataset
Concurrently, ACO model demonstrated a manageable outcome with a precision of 0.933, recall of 0.938, accuracy of 0.936, F-score of 0.911, and kappa of 0.848. Furthermore, MLP algorithm depicted a reasonable performance with a precision of 0.940, recall of 0.942, accuracy of 0.942, F-score of 0.940, and kappa of 0.828. Though BSO-LSSVM model showcased near optimal results with a precision of 0.964, recall of 0.971, accuracy of 0.952, F-score of 0. 943, and kappa of 0.930, the presented IFSSML-DAS model outperformed all other methods with a precision of 0.984, recall of 0.986, accuracy of 0.973, F-score of 0.961, and kappa of 0.957.
Fig. 10 illustrates the results obtained by the proposed IFSSML-DAS model for ROC analysis on stress dataset. From the figure, it is evident that the presented IFSSML-DAS model improved the classification results with an ROC of 99.6045. Based on the discussion made on above-mentioned tables and figures, it can be stated that the proposed IFSSML-DAS model is an appropriate tool to determine DAS among people during COVID-19 crisis. Based on the results achieved, necessary awareness schemes should be introduced to reduce the DAS levels among people.
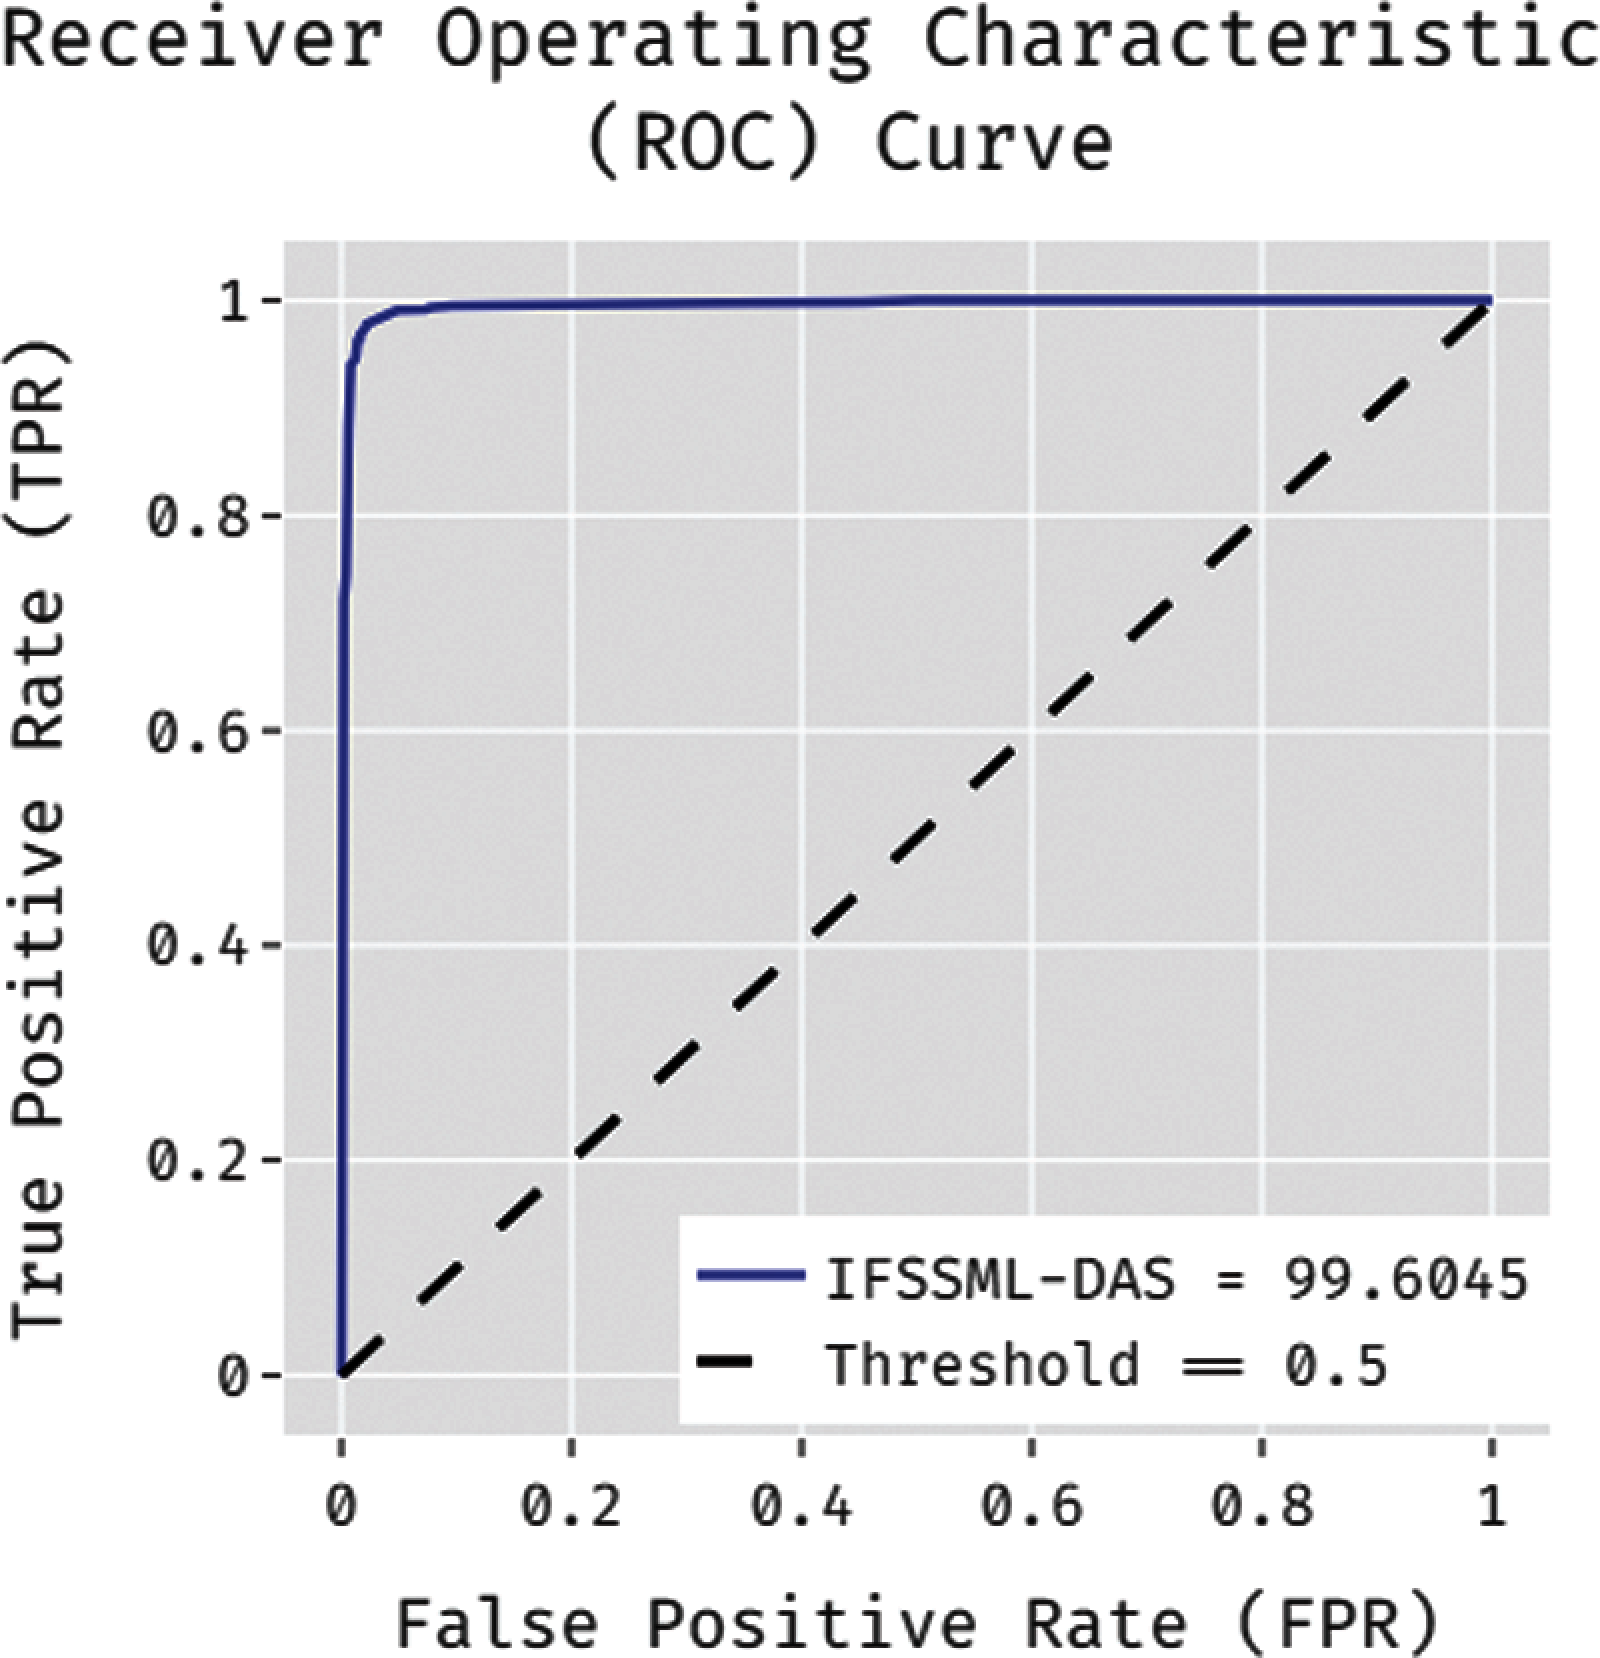
Figure 10: ROC analysis of IFSSML-DAS model on stress dataset
The current study designed an automated DAS predictive model i.e., IFSSML-DAS model to observe the relationship between psycho-social factors and COVID-19 lockdown among college students during COVID-19 crisis. It involves different sub-processes namely, data preprocessing, FSS, classification, and parameter tuning. The presented method employed GGWO-FSS technique to choose an optimal subset of features and to reduce the computational complexity. Followed by, BSO-LSSVM model is used as a classifier to detect different levels of DAS that arose as a result of COVID-19 crisis. While BSO algorithm is applied to fine-tune the weights and biases of LSSVM model so as to increase the performance of classification. The proposed IFSSML-DAS model was experimentally validated on a benchmark DASS-21 dataset and the results were examined under different dimensions. The experimental outcomes of the proposed IFSSML-DAS model were promising in comparison with other state-of-the-art methods. In future, a new classification model can be designed for crisis management in small-to-medium-sized enterprises during COVID-19 lockdown.
Funding Statement: The authors extend their appreciation to the Deanship of Scientific Research at King Khalid University for funding this work under Grant Number (RGP 2/25/42), https://www.kku.edu.sa. This research was funded by the Deanship of Scientific Research at Princess Nourah bint Abdulrahman University through the Fast-track Research Funding Program.
Conflicts of Interest: The authors declare that they have no conflicts of interest to report regarding the present study.
1. C. Wang, R. Pan, X. Wan, Y. Tan, L. Xu et al., “Immediate psychological responses and associated factors during the initial stage of the 2019 coronavirus disease (covid-19) epidemic among the general population in china,” International Journal of Environmental Research and Public Health, vol. 17, no. 5, pp. 1729, 2020. [Google Scholar]
2. K. Shankar and E. Perumal, “A novel hand-crafted with deep learning features based fusion model for COVID-19 diagnosis and classification using chest X-ray images,” Complex Intelligent Systems, vol. 7, no. 3, pp. 1277–1293, 2021. [Google Scholar]
3. P. Koti, P. Dhavachelvan, T. Kalaipriyan, S. Arjunan, J. Uthayakumar et al., “An efficient healthcare framework for kidney disease using hybrid harmony search algorithm,” Electronic Journal, vol. 16, no. 1/2, pp. 56, 2020. [Google Scholar]
4. D.-N. Le, V. S. Parvathy, D. Gupta, A. Khanna, J. J. P. C. Rodrigues et al., “IoT enabled depthwise separable convolution neural network with deep support vector machine for COVID-19 diagnosis and classification,” International Journal of Machine Learning and Cybernetics, vol. 1, pp. 1–14, 2021. [Google Scholar]
5. K. Shankar, E. Perumal, P. Tiwari, M. Shorfuzzaman and D. Gupta, “Deep learning and evolutionary intelligence with fusion-based feature extraction for detection of COVID-19 from chest X-ray images,” Multimedia Systems, vol. 2, pp. 1–13, 2021. [Google Scholar]
6. D. A. Pustokhin, I. V. Pustokhina, P. N. Dinh, S. V. Phan, G. N. Nguyen et al., “An effective deep residual network based class attention layer with bidirectional LSTM for diagnosis and classification of COVID-19,” Journal of Applied Statistics, pp. 1–18, 2020. https://doi.org/10.1080/02664763.2020.1849057. [Google Scholar]
7. D. K. Ahorsu, C.-Y. Lin, V. Imani, M. Saffari, M. D. Griffiths et al., “The fear of covid-19 scale: Development and initial validation,” International Journal of Mental Health and Addiction, vol. 27, pp. 1–9, 2020. [Google Scholar]
8. G. Mertens, L. Gerritsen, S. Duijndam, E. Salemink and I. M. Engelhard, “Fear of the coronavirus (COVID-19Predictors in an online study conducted in March 2020,” Journal of Anxiety Disorders, vol. 74, pp. 102258, 2020. [Google Scholar]
9. D. T. Bitan, A. G. Giron, Y. Bloch, Y. Mayer, N. Shiffman et al., “Fear of COVID-19 scale: Psychometric characteristics, reliability and validity in the israeli population,” Psychiatry Research, vol. 289, pp. 113100, 2020. [Google Scholar]
10. M. A. Mamun and M. D. Griffiths, “First COVID-19 suicide case in Bangladesh due to fear of COVID-19 and xenophobia: Possible suicide prevention strategies,” Asian Journal of Psychiatry, vol. 51, pp. 102073, 2020. [Google Scholar]
11. L. Duan and G. Zhu, “Psychological interventions for people affected by the COVID-19 epidemic,” Lancet Psychiatry, vol. 7, no. 4, pp. 300–302, 2020. [Google Scholar]
12. Y. Huang and N. Zhao, “Generalized anxiety disorder, depressive symptoms and sleep quality during COVID-19 outbreak in China: A web-based cross-sectional survey,” Psychiatry Research, vol. 288, pp. 112954, 2020. [Google Scholar]
13. M. Agoston and K. D. Rudolph, “Transactional associations between youths’ responses to peer stress and depression: The moderating roles of sex and stress exposure,” Journal of Abnormal Child Psychology, vol. 39, no. 2, pp. 159–171, 2011. [Google Scholar]
14. S. Pappa, V. Ntella, T. Giannakas, V. G. Giannakoulis, E. Papoutsi et al., “Prevalence of depression, anxiety, and insomnia among healthcare workers during the covid-19 pandemic: A systematic review and meta-analysis,” SSRN Electronic Journal, vol. 88, pp. 901–907, 2020. [Google Scholar]
15. A. Reznik, V. Gritsenko, V. Konstantinov, N. Khamenka and R. Isralowitz, “COVID-19 fear in eastern europe: Validation of the fear of COVID-19 scale,” International Journal of Mental Health and Addiction, vol. 16, no. Suppl. 1, pp. S97, 2020. [Google Scholar]
16. Z. I. Santini, P. E. Jose, E. Y. Cornwell, A. Koyanagi, L. Nielsen et al., “Social disconnectedness, perceived isolation, and symptoms of depression and anxiety among older Americans (NSHAPA longitudinal mediation analysis,” Lancet Public Health, vol. 5, no. 1, pp. e62–e70, 2020. [Google Scholar]
17. K. Shankar, S. K. Lakshmanaprabu, A. Khanna, S. Tanwar, J. J. P. C. Rodrigues et al., “Alzheimer detection using group grey wolf optimization based features with convolutional classifier,” Computers & Electrical Engineering, vol. 77, no. 3, pp. 230–243, 2019. [Google Scholar]
18. Y. Li, D. Huang and Z. Qin, “A classification algorithm of fault modes-integrated lssvm and pso with parameters’ optimization of vmd,” Mathematical Problems in Engineering, vol. 2021, pp. 1–10, 2021. [Google Scholar]
19. S. Gambhir, S. K. Malik and Y. Kumar, “PSO-ANN based diagnostic model for the early detection of dengue disease,” New Horizons in Translational Medicine, vol. 4, no. 1–4, pp. 1–8, 2017. [Google Scholar]
20. T. Wang, L. Yang and Q. Liu, “Beetle swarm optimization algorithm: Theory and application,” Filomat, vol. 34, no. 15, pp. 5121–5137, 2020. [Google Scholar]
 | This work is licensed under a Creative Commons Attribution 4.0 International License, which permits unrestricted use, distribution, and reproduction in any medium, provided the original work is properly cited. |