DOI:10.32604/cmc.2022.021148
| Computers, Materials & Continua DOI:10.32604/cmc.2022.021148 | |
| Article |
Medical Data Clustering and Classification Using TLBO and Machine Learning Algorithms
1Chitkara University Institute of Engineering and Technology, Chitkara University, Punjab, India
2Institute of Engineering and Technology, JK Lakshmipat University, Jaipur, India
*Corresponding Author: Ashutosh Kumar Dubey. Email: ashutosh.dubey@chitkara.edu.in
Received: 25 June 2021; Accepted: 26 July 2021
Abstract: This study aims to empirically analyze teaching-learning-based optimization (TLBO) and machine learning algorithms using k-means and fuzzy c-means (FCM) algorithms for their individual performance evaluation in terms of clustering and classification. In the first phase, the clustering (k-means and FCM) algorithms were employed independently and the clustering accuracy was evaluated using different computational measures. During the second phase, the non-clustered data obtained from the first phase were preprocessed with TLBO. TLBO was performed using k-means (TLBO-KM) and FCM (TLBO-FCM) (TLBO-KM/FCM) algorithms. The objective function was determined by considering both minimization and maximization criteria. Non-clustered data obtained from the first phase were further utilized and fed as input for threshold optimization. Five benchmark datasets were considered from the University of California, Irvine (UCI) Machine Learning Repository for comparative study and experimentation. These are breast cancer Wisconsin (BCW), Pima Indians Diabetes, Heart-Statlog, Hepatitis, and Cleveland Heart Disease datasets. The combined average accuracy obtained collectively is approximately 99.4% in case of TLBO-KM and 98.6% in case of TLBO-FCM. This approach is also capable of finding the dominating attributes. The findings indicate that TLBO-KM/FCM, considering different computational measures, perform well on the non-clustered data where k-means and FCM, if employed independently, fail to provide significant results. Evaluating different feature sets, the TLBO-KM/FCM and SVM(GS) clearly outperformed all other classifiers in terms of sensitivity, specificity and accuracy. TLBO-KM/FCM attained the highest average sensitivity (98.7%), highest average specificity (98.4%) and highest average accuracy (99.4%) for 10-fold cross validation with different test data.
Keywords: K-means; FCM; TLBO; TLBO-KM; TLBO-FCM; TLBO-KM/ FCM; machine learning algorithms
Data mining and machine learning algorithms are efficient in pattern identification, extraction and data separation through clustering and classification [1]. The major challenge in biological data is the insight evolution in terms of structure and function for the exploration of the adaptation, diversity, and complexity of the system [2,3]. Developing computational, and statistical approaches and validating applicability in the analysis of parameters and attributes is the grand challenge [3,4]. Since the symptoms of diseases are not similar across patients, it is essential to characterize their distinctive features [5]. Pattern detection has been found to be important in correctly identifying hidden patterns [6]. For example, data mining and machine learning techniques can identify these hidden patterns and are effective [7]. Another aspect is the appropriate association and correlation between methods and their tuning parameters, threshold ranges and attribute dominance factors. So, the main motivation is to adhere to and develop an efficient framework for the process of advance computing applicability with the inclusion of feature extraction, along with the decision support capability to accelerate individual and integrated aspects of computing biological sets. The clustering algorithm organizes the data into similar groups. Therefore, it can be applied to distinguish disease and non-disease attributes. The typical clustering algorithms are the k-means and fuzzy c-means (FCM) algorithms [8]. Although the k-means may fail for a badly-placed cluster center, better results can be obtained through an appropriate selection of the initial points. However, the results may also suffer in the case of FCM if the dataset is large, and if there is uncertainty in the data objects and optimal parameters setting [9]. In these scenarios, the classification approach can be helpful in determining the selection points and preparing uniform data for experimentation. The classification approach categorizes the data based on training data that generate the target class with proper boundaries. The optimization algorithm, with efficient data-point-selection and uniform-data-creation property, can also be useful in data classification [10]. The popular optimization algorithms include ant colony optimization (ACO), particle swarm optimization (PSO), genetic algorithm (GA), and artificial bee colony (ABC) algorithm. The performance of the above-mentioned algorithms depends on the tuning of their parameters [11,12]. Rao et al. proposed the teaching-learning-based optimization (TLBO) algorithm, which only requires common controlling parameters such as population size and number of generations but does not require any algorithm-specific parameters [11]. This solves the problem of unsuitable tuning of the parameters. The elitism concept in the TLBO algorithm was introduced also for complex constrained optimization problems [12]. Moreover, the TLBO algorithm was found to be capable of identifying the centroids of a user-specified number of clusters of numerical data [13]. Machine learning algorithms was found to be helpful in the disease detection and variable applicability in different domains [14–16]. So, the main contribution in this paper is the hybrid use of altogether and provide the complete comparative analysis. It means our framework allows the combination of algorithms for different purposes. The objective of our study was to analyze the performance of the TLBO with k-means (TLBO-KM) and FCM (TLBO-FCM) (TLBO-KM/FCM) algorithms along with machine learning algorithms considering variable parameters and computational aspects.
Pedireddla et al. [17] suggested the hybridization of TLBO and MapReduce for working with a huge dataset. In addition, the TLBO was used to solve clustering problems like local optima and for automatic clustering of large unlabeled datasets [18,19]. The latter approach does not require any prior knowledge of the data. Swapna et al. [20] obtained a better accuracy by using the modified-TLBO (MTLBO) algorithm. In 2020, Zadeh et al. [21] discussed triple-negative breast cancer. They have suggested that it is unresponsive to targeted hormonal therapies. So, it is limited to the treatment of nonselective chemotherapeutic agents. They considered basal-like breast cancers. They applied dimensionality reduction data mining techniques with a feature section method on the triple-negative breast cancer dataset. Their result has been prominent in proper identification and diagnosis. In 2020, Simsek et al. [22] constructed a hybrid data mining-based method, constructed for differentiation for survival changes. They considered least absolute shrinkage, selection operator and genetic algorithm, along with artificial neural networks and logistic regression models in the final stage. In 2020, Chiudinelli et al. [23] discussed the care-flow mining algorithm, considering data from electronic health records, mined and examined on the basis of data recorded for administrative purposes. Their results were found to be significant for decision-making systems in hospitals. In 2020, Jonsdottir et al. [24] discussed the predictive outcome model. They have developed a model selection tool, a collection of classification algorithms. The results indicate that the same performance was achieved irrespective of the algorithms considered. In 2020, Tanha et al. [25] discussed prognostic indices in terms of breast cancer groups for patients in Iran. Their main aim was to design a classification model for pattern discovery. They used decision tree and rule-based algorithms. Their results were prominent in showing the relationship between different prognostic indices. In 2018, Alwidian et al. [26] discussed the prediction of breast cancer. They suggested that the association classification technique suffers from prioritization at the attribute level. They have presented a new pruning and prediction technique. Results indicate that the algorithms applied can also be applied in different domains. In 2009, Yeh et al. [27] developed a hybrid data mining approach with two phases. Preprocessing is done in the first phase, including statistical methods. It is capable of reducing computational complexity and also speeds up the process. In the next phase discrete particle swarm optimization was applied. Their results will be helpful in the decision-making process. In 2020, Salehi et al. [28] discussed breast cancer survivability. They considered the surveillance, epidemiology, and end results program (SEER) dataset, using a multi-layer perceptron. For the machine evaluation they considered the k-fold cross-validation technique. Their results show an average accuracy of 84%. In 2020, Prabadevi et al. [29] discussed the accurate discovery of cancerous breast cells. They applied several machine learning algorithms to their comparative study. These are random forest (RF), support vector machine (SVM), naive Bayes (NB), decision tree (DT), neural networks (NN) and logistic regression (LR). In 2020, Nizam and Hassan [30] discussed unsupervised learning, studying and analyzing clustering algorithms. They suggested that classification accuracy may be affected if different distance metrics are used. They also suggested the combination of k-means with Manhattan and FCM with Euclidean distance for the best results. In 2007, Ahmad and Dey [31] presented a clustering algorithm, based on the k-means algorithm. This was well suited well for mixed numeric and categorical features. They have proposed a new cost function and distance measure, based on co-occurrence of values. Their approach uses a modified description of the cluster center. This may be useful to remove the limitation of the numeric data limitation problem. Their approach has been prominent among traditional methods. In 2011, Minaei-Bidgoli et al. [32] proposed an ensemble-based approach for feature selection. They worked on the parameter sensitivity problem, selecting highest score features based on the ensemble method. Their approach's main advantage is the parameter insensitive support. There is no need to set any parameter in the case of this method. In 2015, Parvin et al. [33] discussed the classification problem and the recognition of a classifier for the specific problem. They suggested ensemble learning to provide a near-optimal solution and proposed a novel method for the ensemble creation. This is called classifier selection based on clustering. Their base classifier is like the DT or a multilayer perceptron classifier. They have used the weighted majority vote method as an aggregate function and investigated the influence of cluster number. They have used the University of California, Irvine (UCI) repository for the experimentation and their method has become prominent. In 2013, Parvin et al. [34] discussed data point distribution and the imbalance dataset. They have also discussed relative or non-relative datasets in the case of imbalanced shape and presented an algorithm for non-relative imbalanced datasets. Their results were also prominent. In 2020, Dashti et al. [35] discussed colorectal cancer. They developed a statistical pipeline based on a ‘gene-motif’. This merge mutated gene information with a tri-nucleotide motif. Their approach is useful in the case of cancer subtypes and cancer biomarker identification. In 2021, Baccouche et al. [36] proposed a You-Only-Look-Once (YOLO) model. Their model is helpful in the suspicious breast lesions classifications. They achieved the average accuracy of 98%. In 2021, Rasam et al. [37] explored the ArcGIS Online and Web Apps. It has been explored in terms of tuberculosis. Their main purpose is to manage the disease dataset. In 2021, Bardhi et al. [38] aimed for the patient survivability detection in different diseases. SVM classifier found to be best. In 2021, Flores et al. [39] discussed and analyzed various aspects of machine learning and artificial intelligence techniques in the direction of peripheral artery diseases.
The above review and analysis suggested the need of algorithms with aggregate functionality. It also depicted the concentration major on preprocessing and feature selection as the symptom's variability is higher in case of medical data.
In this paper, five different benchmark datasets have been considered. These are BCW dataset (Number of instances: 699, Number of features: 9, Number of classes: 2), Pima Indians Diabetes (Number of instances: 768, Number of features: 8, Number of classes: 2), Heart-Statlog (Number of instances: 270, Number of features: 13, Number of classes: 2), Hepatitis (Number of instances: 155, Number of features: 19, Number of classes: 2) and Cleveland Heart Disease (Number of instances: 296, Number of features: 13, Number of classes: 5). This has been taken from the UCI Machine Learning Repository [40].
The k-means clustering depends on the closest centroid. In case of a medical dataset, the data can be either malign or benign. If k-means is applied to these datasets, sometimes the initial centroids re-adjust themselves and sometimes they do not, and this process is repeated several times. The accuracy of the results highly depends on whether this process can provide the closest centroid or not. On the other hand, the FCM algorithm processes the data by allocating membership to each data point corresponding to each cluster center. The fuzziness shows the degree of truth (>1), whereas the termination criterion and epsilon value lie between 0 and 1. The process is repeated till the termination criteria. This may influence the results as the data point may be affected. So, there is the chance of trapping it into local optima. If the values are arranged considering an optimization problem, the above-mentioned problem can be solved to a great extent as the readjustment is already performed and the final outcome is more organized and normalized. If the k-means or FCM algorithm is then applied to this data, the clustering accuracy can be improved further.
In order to achieve a good performance, all optimization algorithms require the tuning of their parameters [5]. In this study, TLBO is used first with k-means and FCM algorithms as it requires only common controlling parameters or a smaller number of parameters. The TLBO algorithm is based on the influence of a teacher on the outcome of a learner. There are two phases in this algorithm: the teacher phase and the learner phase. The learners learn from the teacher as well as from other learners. The main parameters of this algorithm are the population size, design variables, and teaching factors. In our case, the population size is the size of the medical datasets. The design variables or the number of subjects is the attribute. In general, the teaching factor value is either 1 or 2 (it is 1 in our case). This determines the revised mean value. Thereafter, the best learner among the whole population is considered as a teacher. If the objective is minimization, then the lowest value is considered as the teacher; and if the objective is maximization, then the highest value is considered as the teacher. In the teacher phase, the different mean is calculated to increase the knowledge level by applying it to the attributes. These values are used as the input to the learner phase. In this phase, a learner can learn from any other learner having more knowledge. If the objective is minimization, then the knowledge is transferred from the lowest value, and if the objective is maximization, then the knowledge is transferred from the highest value. Based on this, the updated values of the attributes and the objective functions based on the fitness comparison are obtained. The output of the learner phase was used as the input for the clustering algorithms. The whole procedure can be better understood through the proposed system as shown in Fig. 1.
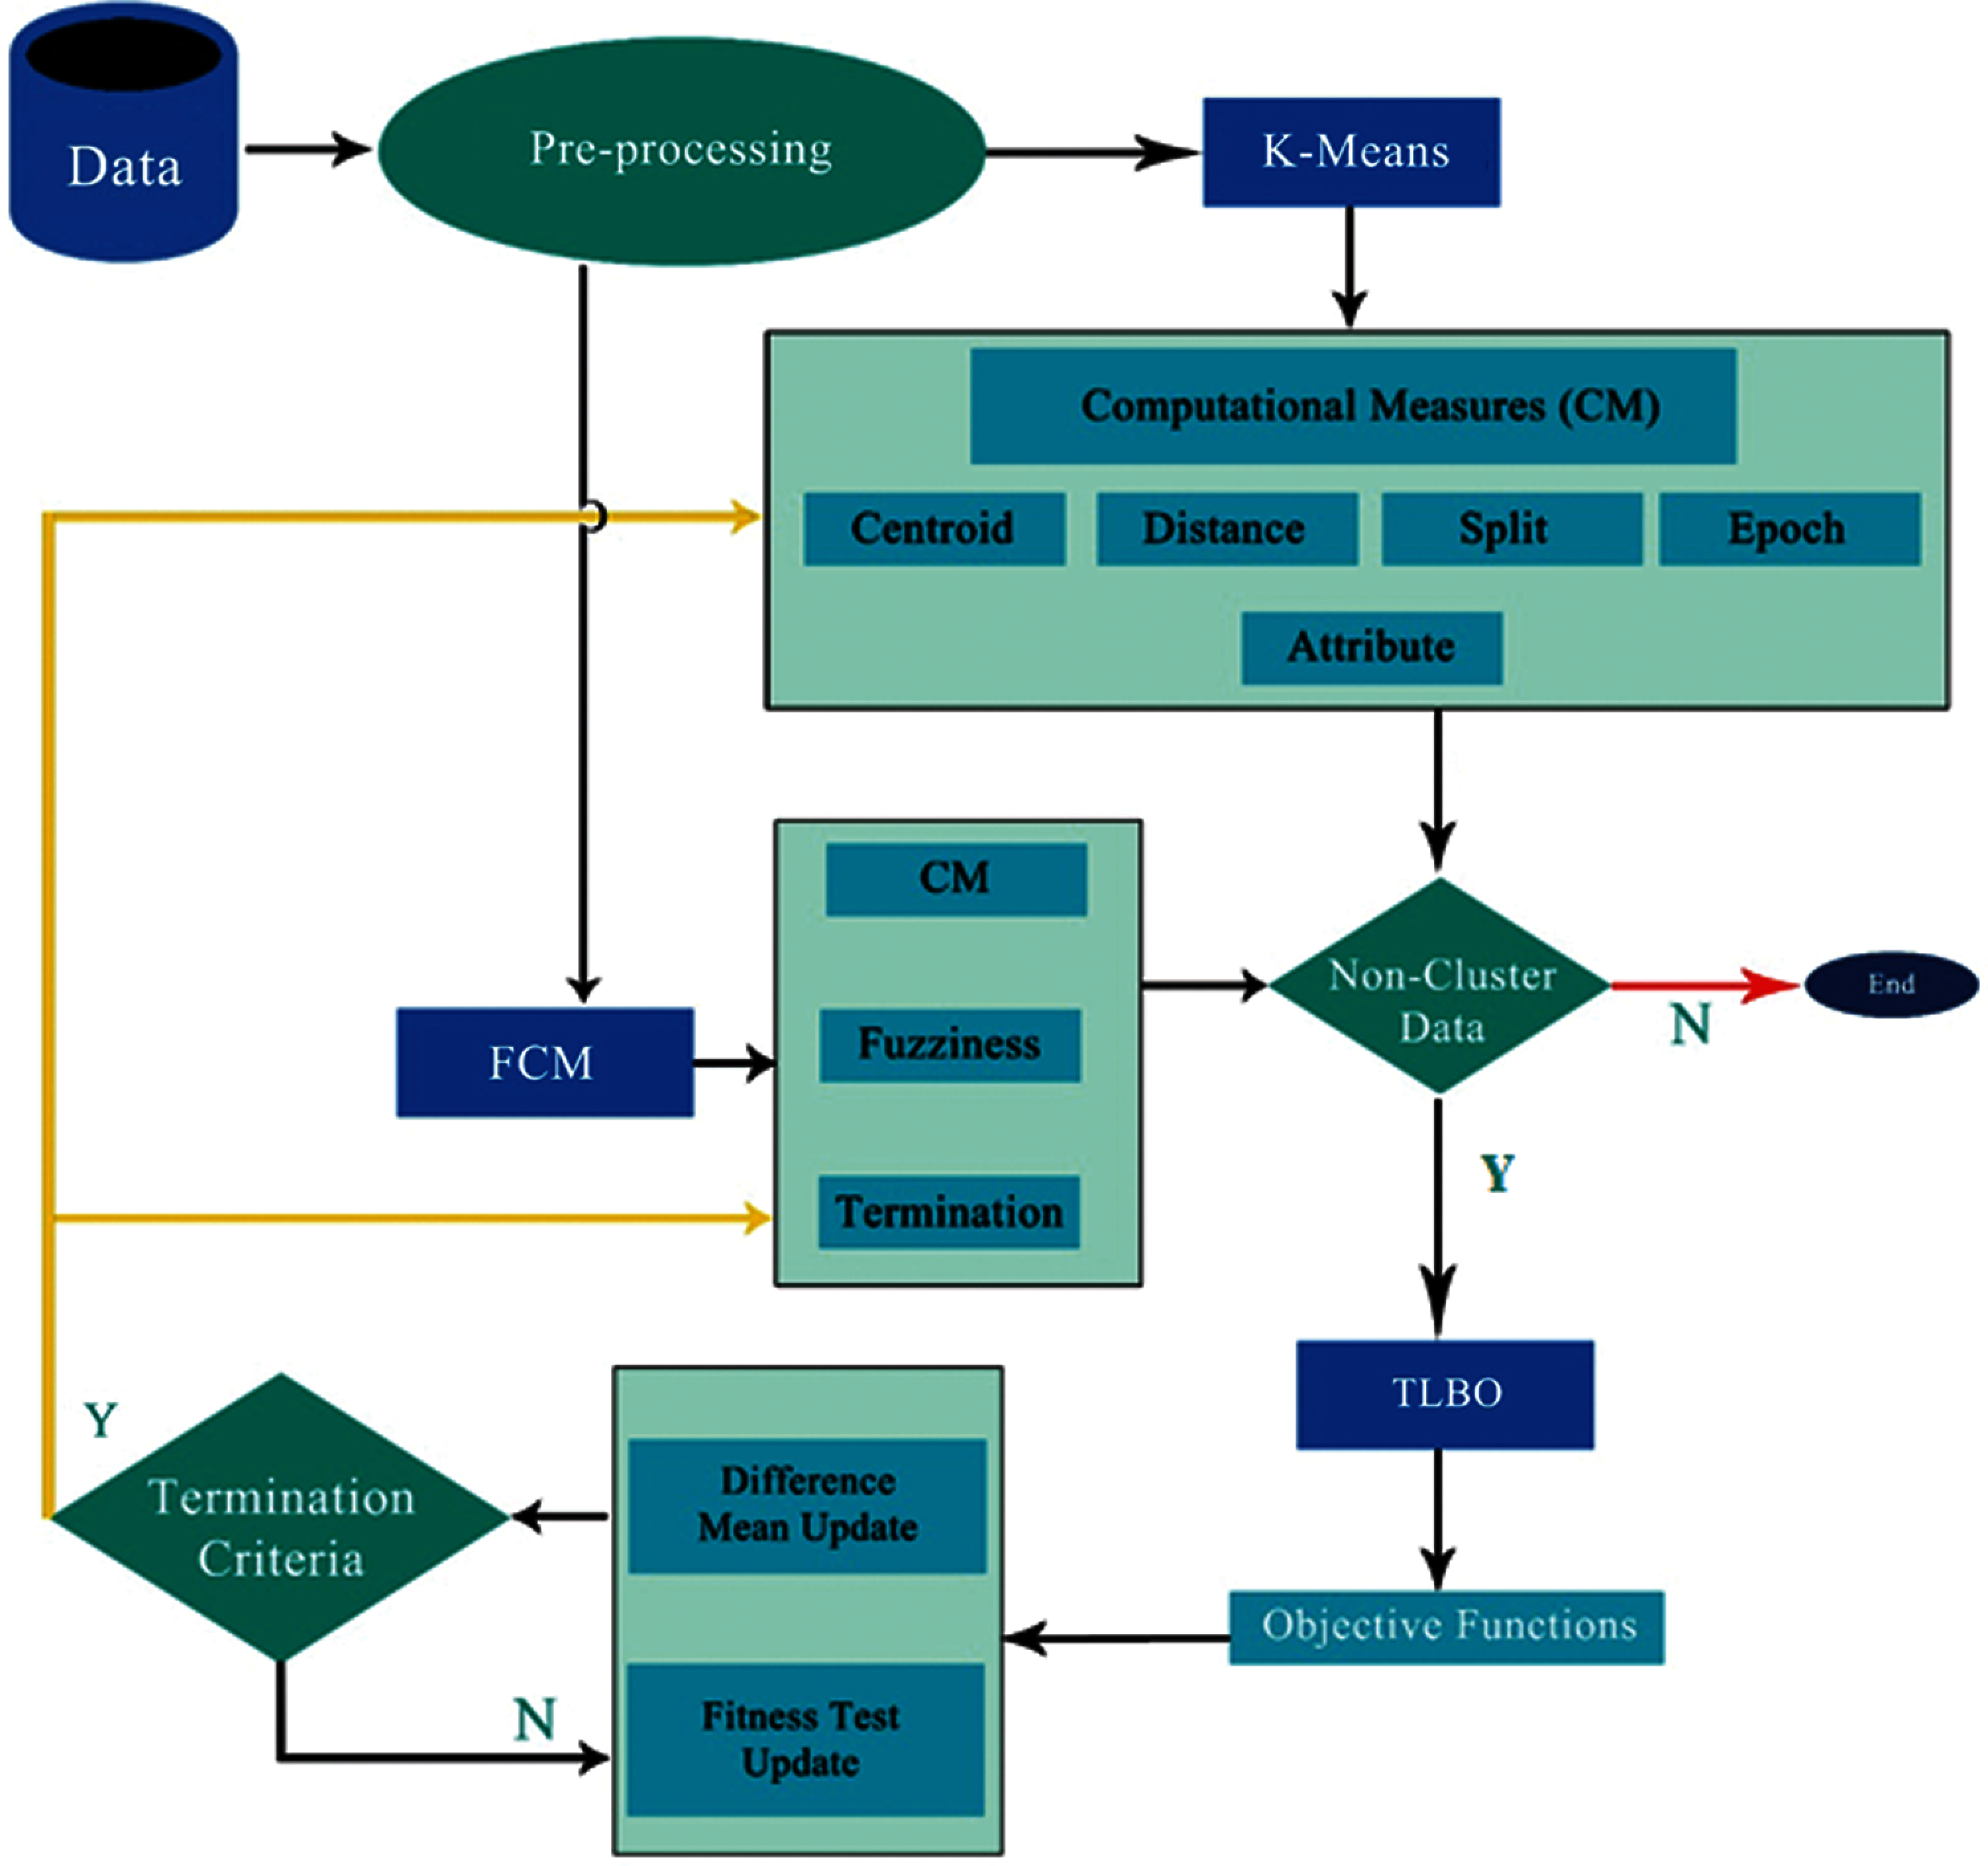
Figure 1: Block diagram for the TLBO-KM/FCM procedure and system structure
The proposed framework provides different functionalities and computational parametric variations with the solutions to variable problem areas. This implies that the required setup for the preprocessing and clustering of data is implemented and evaluated. This approach can then be utilized in suitable places according to need. The functionalities include data selection, preprocessing, partitioning, clustering, classification, and the computational parametric variations based on variable parameters. The proposed framework also provides a basic set of application tools which can be extended with different methodological prospects and dataset expansion, with new attributes for the classification and clustering purposes. In phase-I, only clustering algorithms (k-means and FCM) were used and the clustering accuracy was evaluated using different computational measures. In phase-II, the non-clustered data were treated with the TLBO. In the third phase, the non-clustered data obtained from the TLBO process were clustered using k-means and FCM algorithms. The TLBO-KM and TLBO-FCM (TLBO-KM/FCM) algorithms were used to find the most accurate clusters. The optimized objective function was determined by considering both minimization and maximization. Here, non-clustered refers to the remaining data by k-means and FCM after clustering. Termination criteria refers to the termination criteria in case of FCM for finalizing the clusters. The TLBO-KM/FCM algorithm depict the complete picture. The terms used in the algorithm is shown in Tab. 1.


For the experiment, the attributes A1–An were considered. The objective function is shown in Eq. (1). We considered the minimization and maximization both, assigning the upper and lower limit of number of attributes, respectively.
Range of variables: 1 ≤ Ai ≤ n
The first difference mean, according to Eq. (2), is calculated for A1–An. The updated values were generated after different iterations based on Eq. (3).
For comparative study and analysis different classification algorithms, along with our approach, have been considered for the experimentation. The classification algorithms used are RF, k-nearest neighbor (KNN), SVM, SVM with grid search (SVM (GS)) and NB. To avoid any ambiguous inference, each experiment is repeated for 50 cycles for the calculation of average accuracy.
Five different benchmark datasets have been considered for experimentation. These are BCW dataset (D1), Pima Indians Diabetes (D2), Heart-Statlog (D3), Hepatitis (D4) and Cleveland Heart Disease (D5).
This section discusses the outcome of TLBO-KM/FCM and machine learning algorithms in different cases. First, TLBO-KM/FCM results were considered with different cases with D1 dataset. For the comparison of the results, positive predictive value (PPV) was considered first (Eq. (4)).
In the case of k-means, foggy and random centroids have been used for initialization. The Euclidean distance algorithm is used to find the distance between the cluster center and the data points. The simple and variance split methods were applied for data splitting. The cluster centers were calculated based on the mean and variance. Tab. 2 presents a list of the cases considered for comparison. D1 dataset was considered for the following cases shown in Tab. 2.

For Case 1, the results were obtained using foggy centroid, Euclidean distance, simple-split method, epoch, and variations in the design variables with 10-fold cross validation in a complete cycle. The simple-split method is used to cluster more elements. The epoch determines the stopping condition of the iteration in the process of identifying the cluster center. Fig. 2 shows the corresponding results for a population size of 250. In this case, both the TLBO minimization and maximization were considered. The design variables are the parameters of the objective function. The results are shown on a scale of 0–1. Fig. 2 shows that the highest, average and the lowest PPV values are 89.0%, 84.0%, and 81.0%, respectively. A better outcome could be obtained with variations in the variance and the same centroid. Fig. 3 show the results based on the TLBO-KM for different design variables. When the k-means algorithm fails and the TLBO-KM is applied to the non-clustered data, the results of minimization and maximization for the five different design variable selections are (96.4% and 91.3%), (97.0% and 90.8%), (95.4% and 91.3%), (95.7% and 90.5%), and (95.0% and 91.0%), respectively, with average clustering accuracies of 91.2% and 88.4%, respectively. Design variables shows the consideration of different attributes.
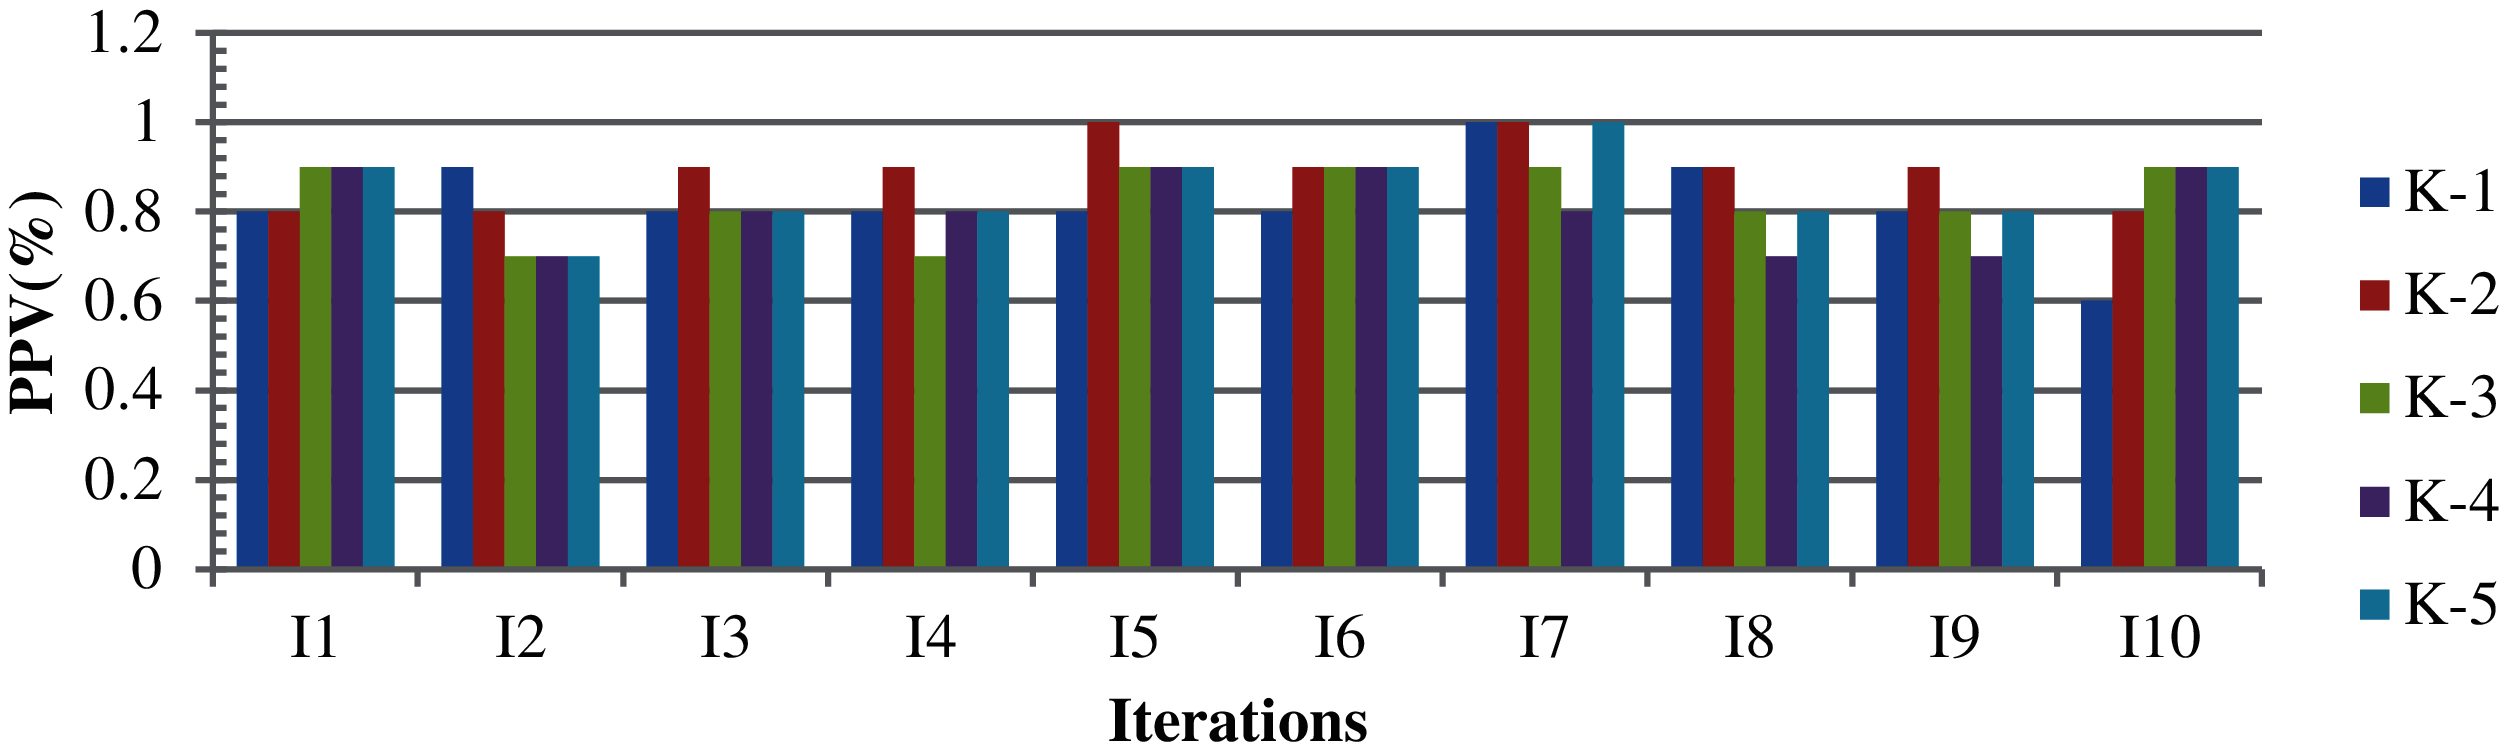
Figure 2: K-means results based on different attributes with ten iterations in five cycles
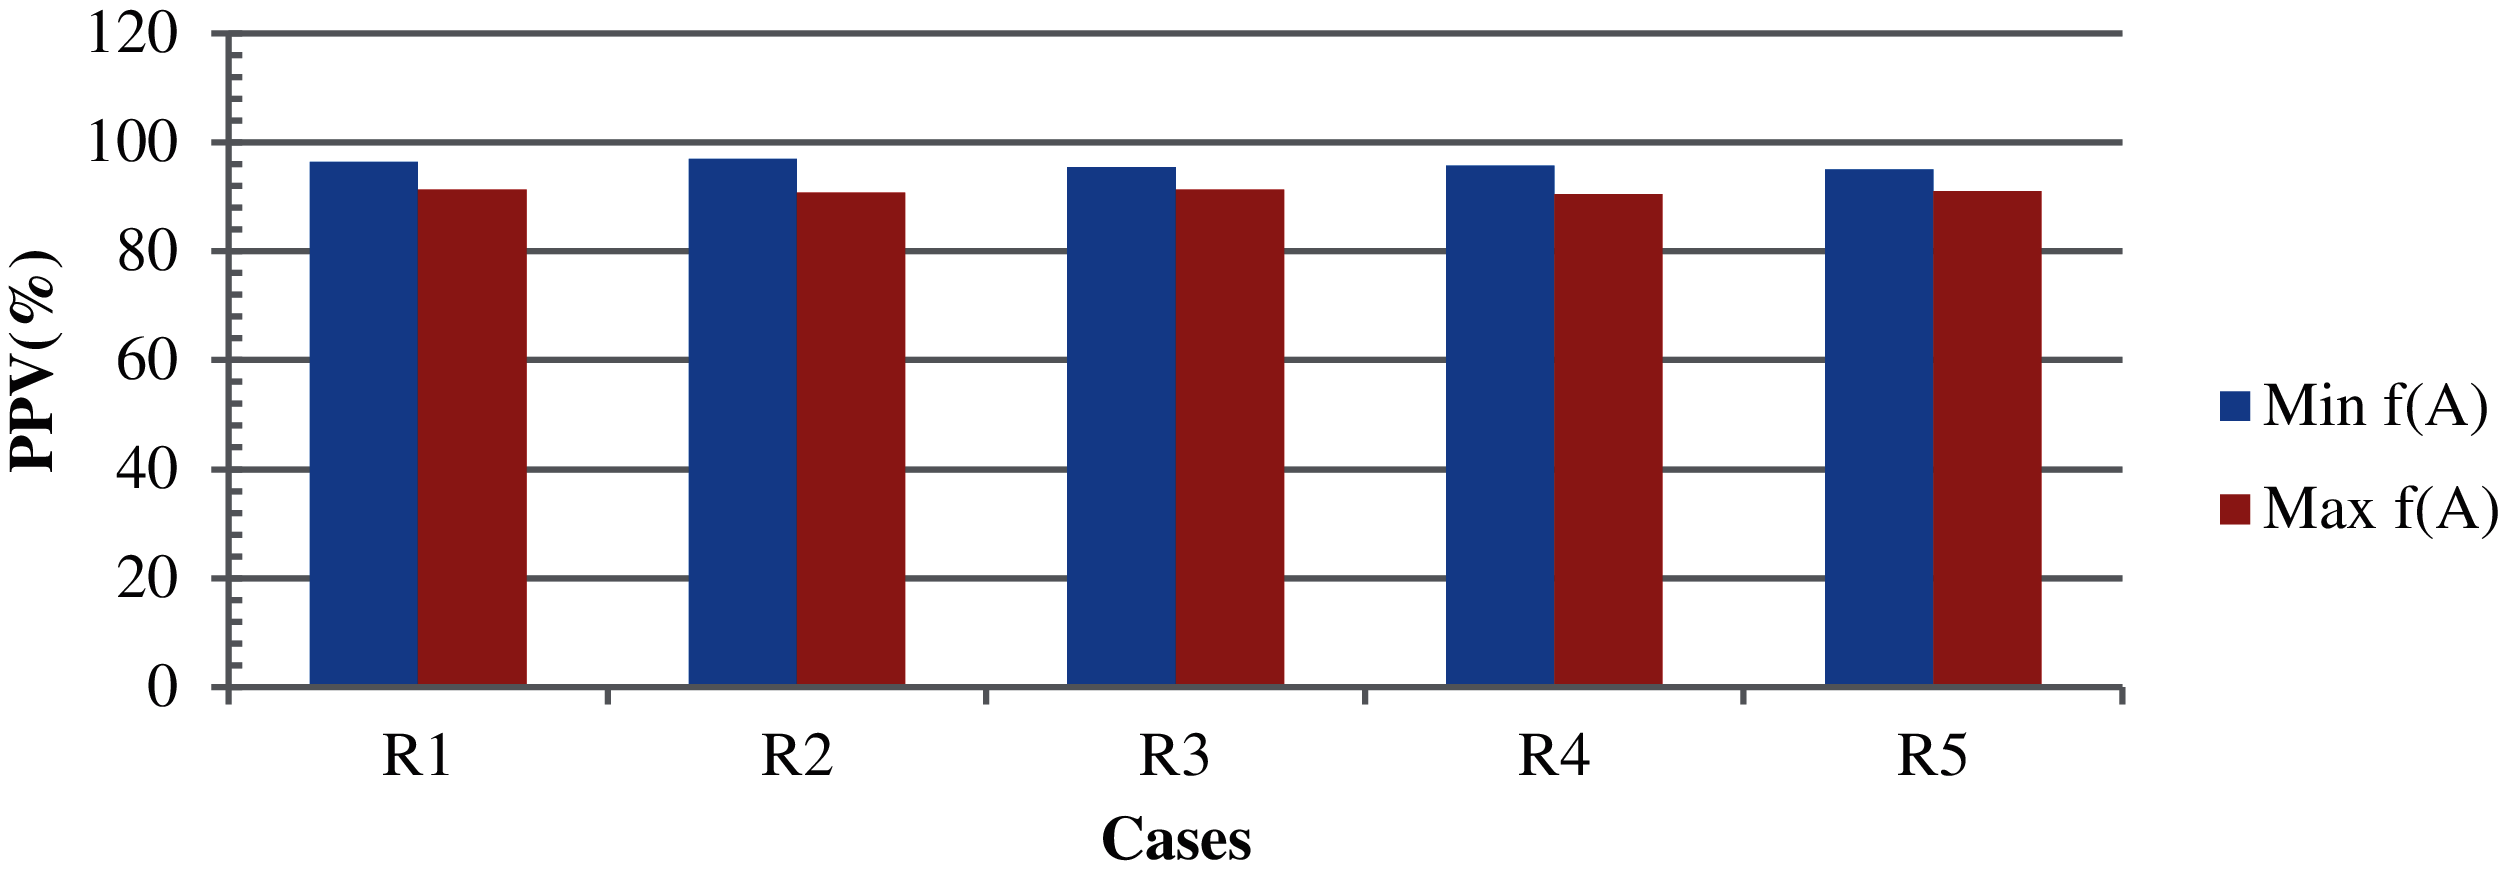
Figure 3: The results based on case 1 with different design variables [R1 = TLBO-KM with design variable-2, R2 = TLBO-KM with design variable-3, R3 = TLBO-KM with design variable-4, R4 = TLBO-KM with design variable-5 and R5 = TLBO-KM with design variable-6]
The parameters remain the same for Cases 2–5. However, the whole population was considered here. The results of k-means for Cases 2, 4, and 5 with the highest and lowest clustering accuracy of (91.0% and 86.0%), (92.0% and 89.0%), and (94.0% and 90.0%), and the average accuracies of (89.6% and 85.4%), (90.6%, 88.3%), and (91.4%, 89.7%) for cases 2, 4, and 5, respectively. The non-clustered records are then processed with the TLBO-KM. The highest and lowest minimization clustering accuracies are (98.0%, 92.0%), (100%, 97.0%), and (99.0%, 94.0%), while that of the maximization are (97.0%, 94.0%), (98.0%, 92.0%), and (95.0%, 92.0%) for Cases 2, 4, and 5, respectively. The average clustering accuracies in case of minimization and maximization are (95.6%, 91.4%), (98.8%, 96.4%) and (98.8%, 92.7%), respectively. For Case 3, as the initialization remained the same in all iterations, no variations are found in the case of means. Although the results may vary with the TLBO-KM, the variations are caused by the random initialization only. Therefore, the specific results of Case 3 are not presented. These results are shown in Fig. 4.
For Case 6, the same parameters were used with a completely random selection of attributes, with variation in TLBO knowledge transfer (interaction cycle). Fig. 5 shows the corresponding result with the highest, average, and lowest clustering accuracy of 91.0%, 87.4%, and 85.0%, respectively. The non-clustered records produced by this process are then processed with TLBO-KM and are shown in Fig. 6. If TLBO-KM is applied on the non-clustered records where the k-means algorithm alone has failed, then the results in the case of minimization and maximization with five different design variables with random parameter selections are (97.7% and 94.0%), (98.8% and 94.3%), (97.1% and 95.0%), (98.9% and 93.7%), and (97.8% and 96.3%), for minimization and maximization, respectively, with an average clustering accuracy of 97.6% and 93.2%.
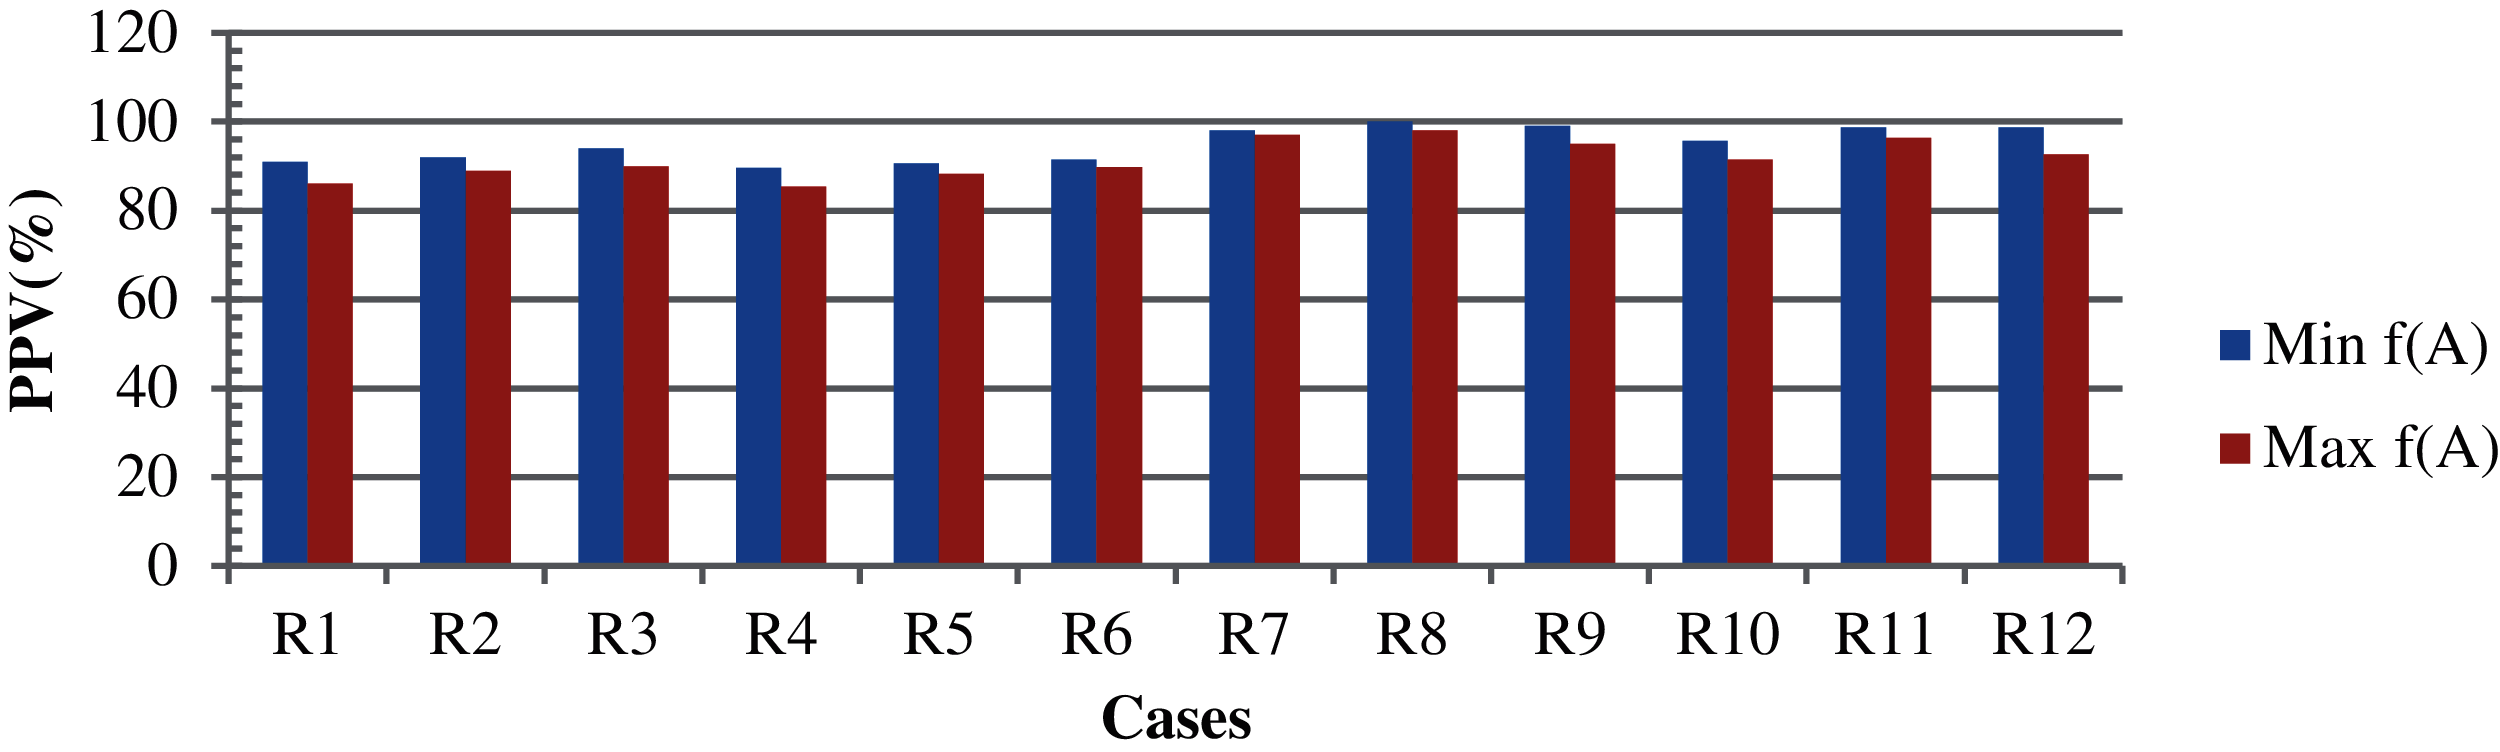
Figure 4: The results based on case 2, case 4 and case 5[R1 = case 2 with k-means, R2 = case 4 with k-means, R3 = case5 with k-means, R4 = case 2 with k-means (average), R5 = case 4 with k-means (average), R6 = case 5 with k-means (average), R7 = case 2 with TLBO-KM, R8 = case 4 with TLBO-KM, R9 = case 5 with TLBO-KM, R10 = case 2 with TLBO-KM (average), R11 = case 4 with TLBO-KM (average) and R12 = case 5 with TLBO-KM (average)]
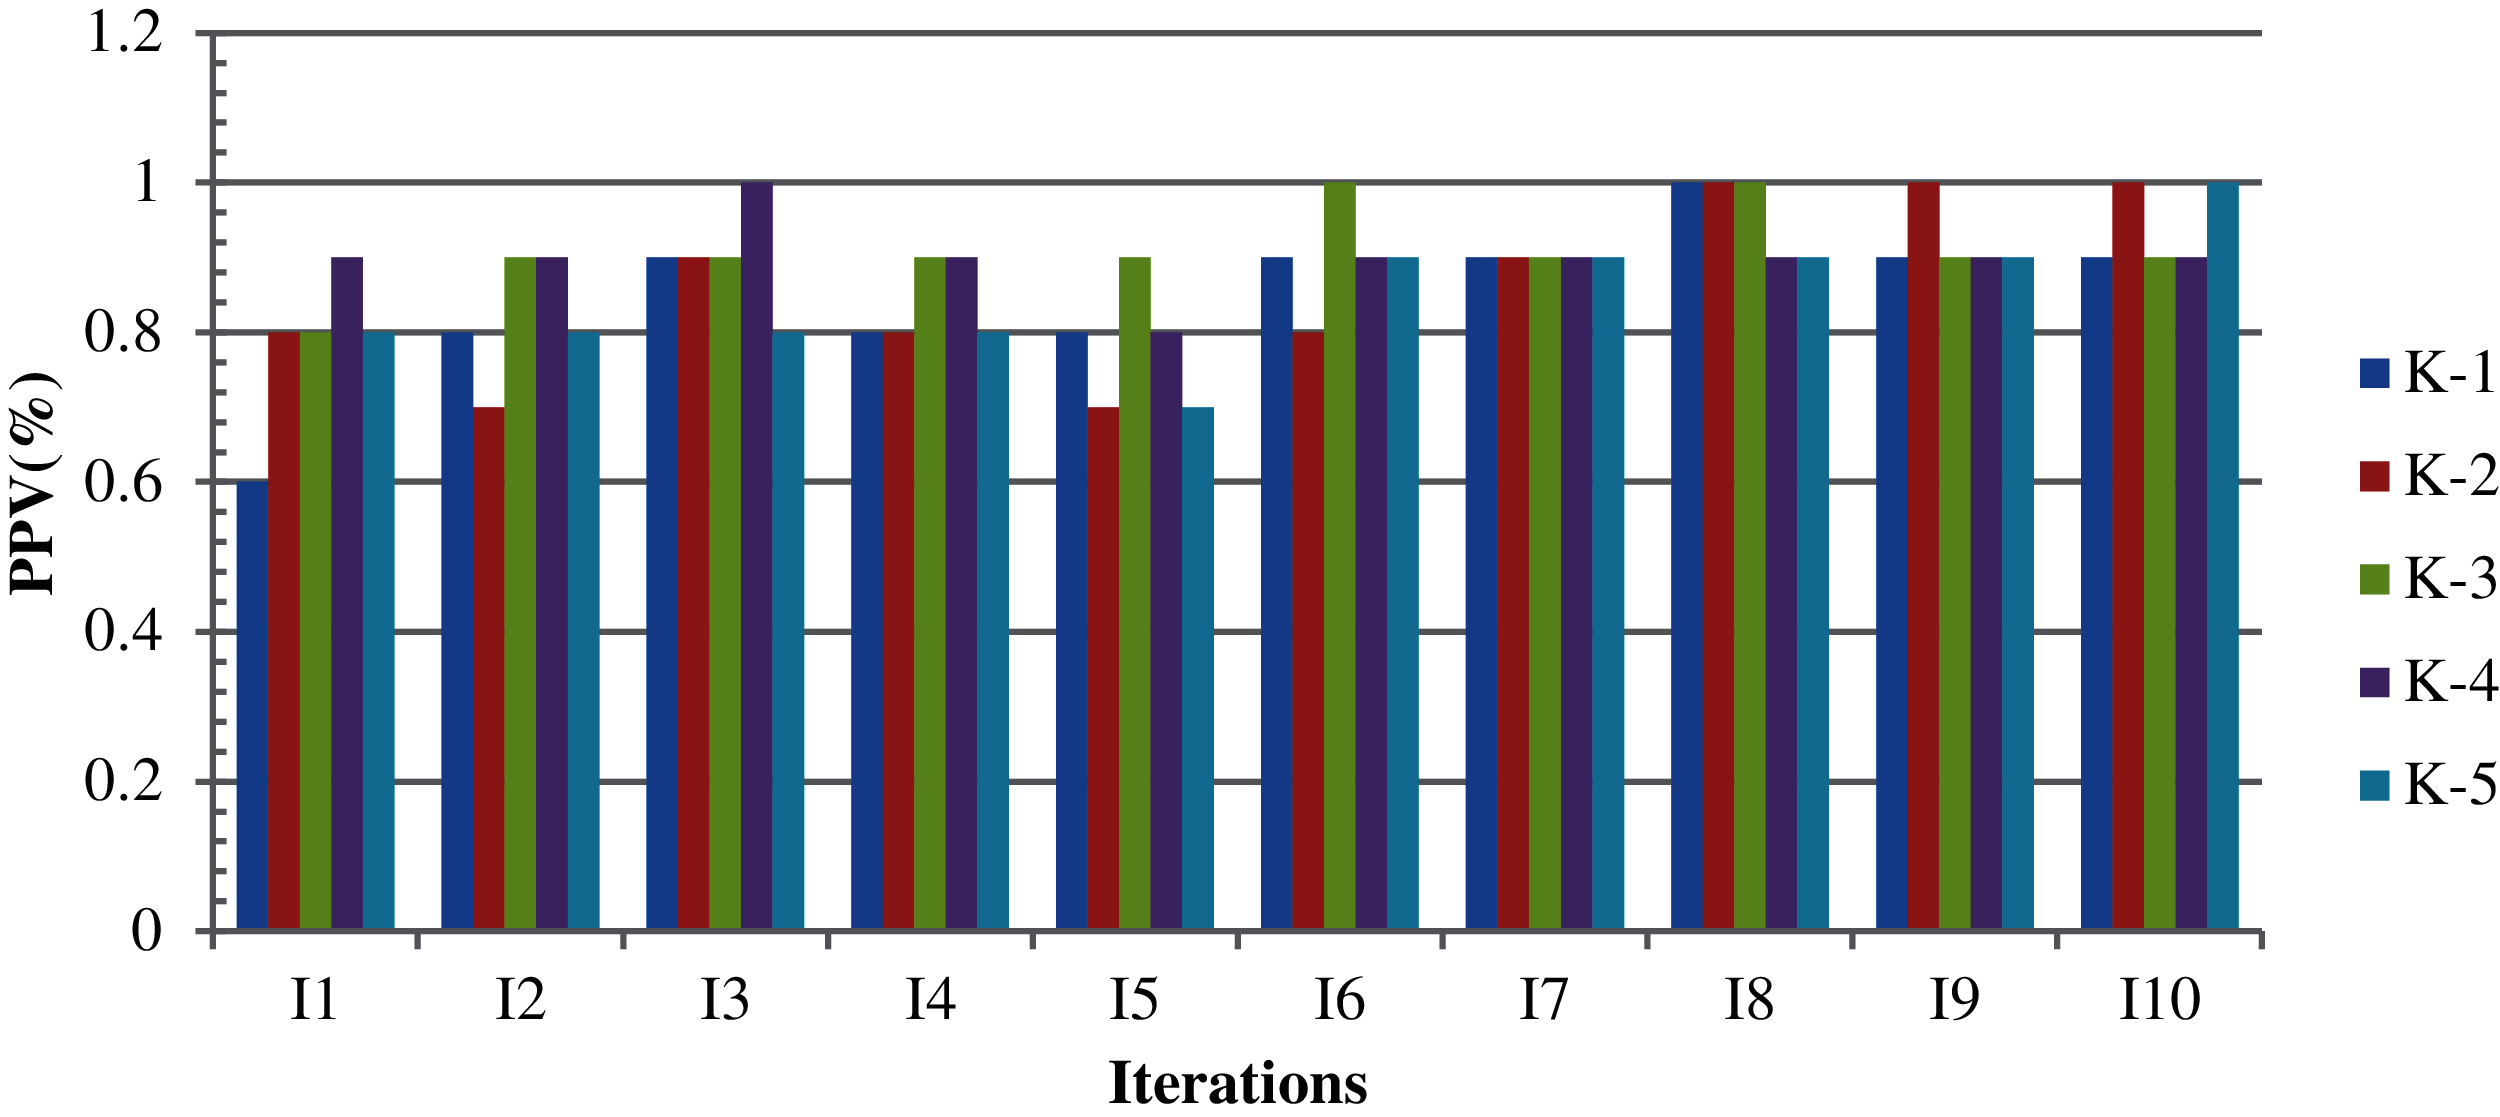
Figure 5: K-means results based on design variables with ten iterations in five cycles

Figure 6: The results based on case 6 with different parameters [R1 = TLBO-KM with random parameters 1, R2 = TLBO-KM with random parameters 2, R3 = TLBO-KM with random parameters 3, R4 = TLBO-KM with random parameters 4 and R5 = TLBO-KM with random parameters 5]
Thereafter, the FCM algorithm was applied. The experimentation was performed on the basis of the variation in the fuzziness value and termination criteria. In our approach, the fuzziness variations considered from 2–5 and the epsilon value lie between 2 × 10⁻⁵ and 6 × 10⁻⁵. Tab. 3 shows the results of FCM based on different epsilon values and fuzziness factors. The non-clustered data from the FCM are then processed with the TLBO algorithm. The results produced by the TLBO-FCM are shown in Figs. 7 and 8 for minimization and maximization, respectively. The highest and lowest results in the case of minimization and maximization with different epsilon and fuzziness factors are (82.1% and 75.9%) and (78.6% and 70.6%), respectively. The average clustering accuracies in the case of minimization and maximization are 80.4% and 73.3%, respectively. The accuracy obtained collectively (non-clustered and clustered data obtained from k-means) is approximately 99.4% in case of TLBO-KM (Fig. 9). The accuracy obtained collectively (non-clustered and clustered data obtained from FCM) is approximately 98.6% in the case of TLBO-FCM (Fig. 9). Here, CM indicates the computational measures and TCFV shows the termination criteria with fuzziness value.

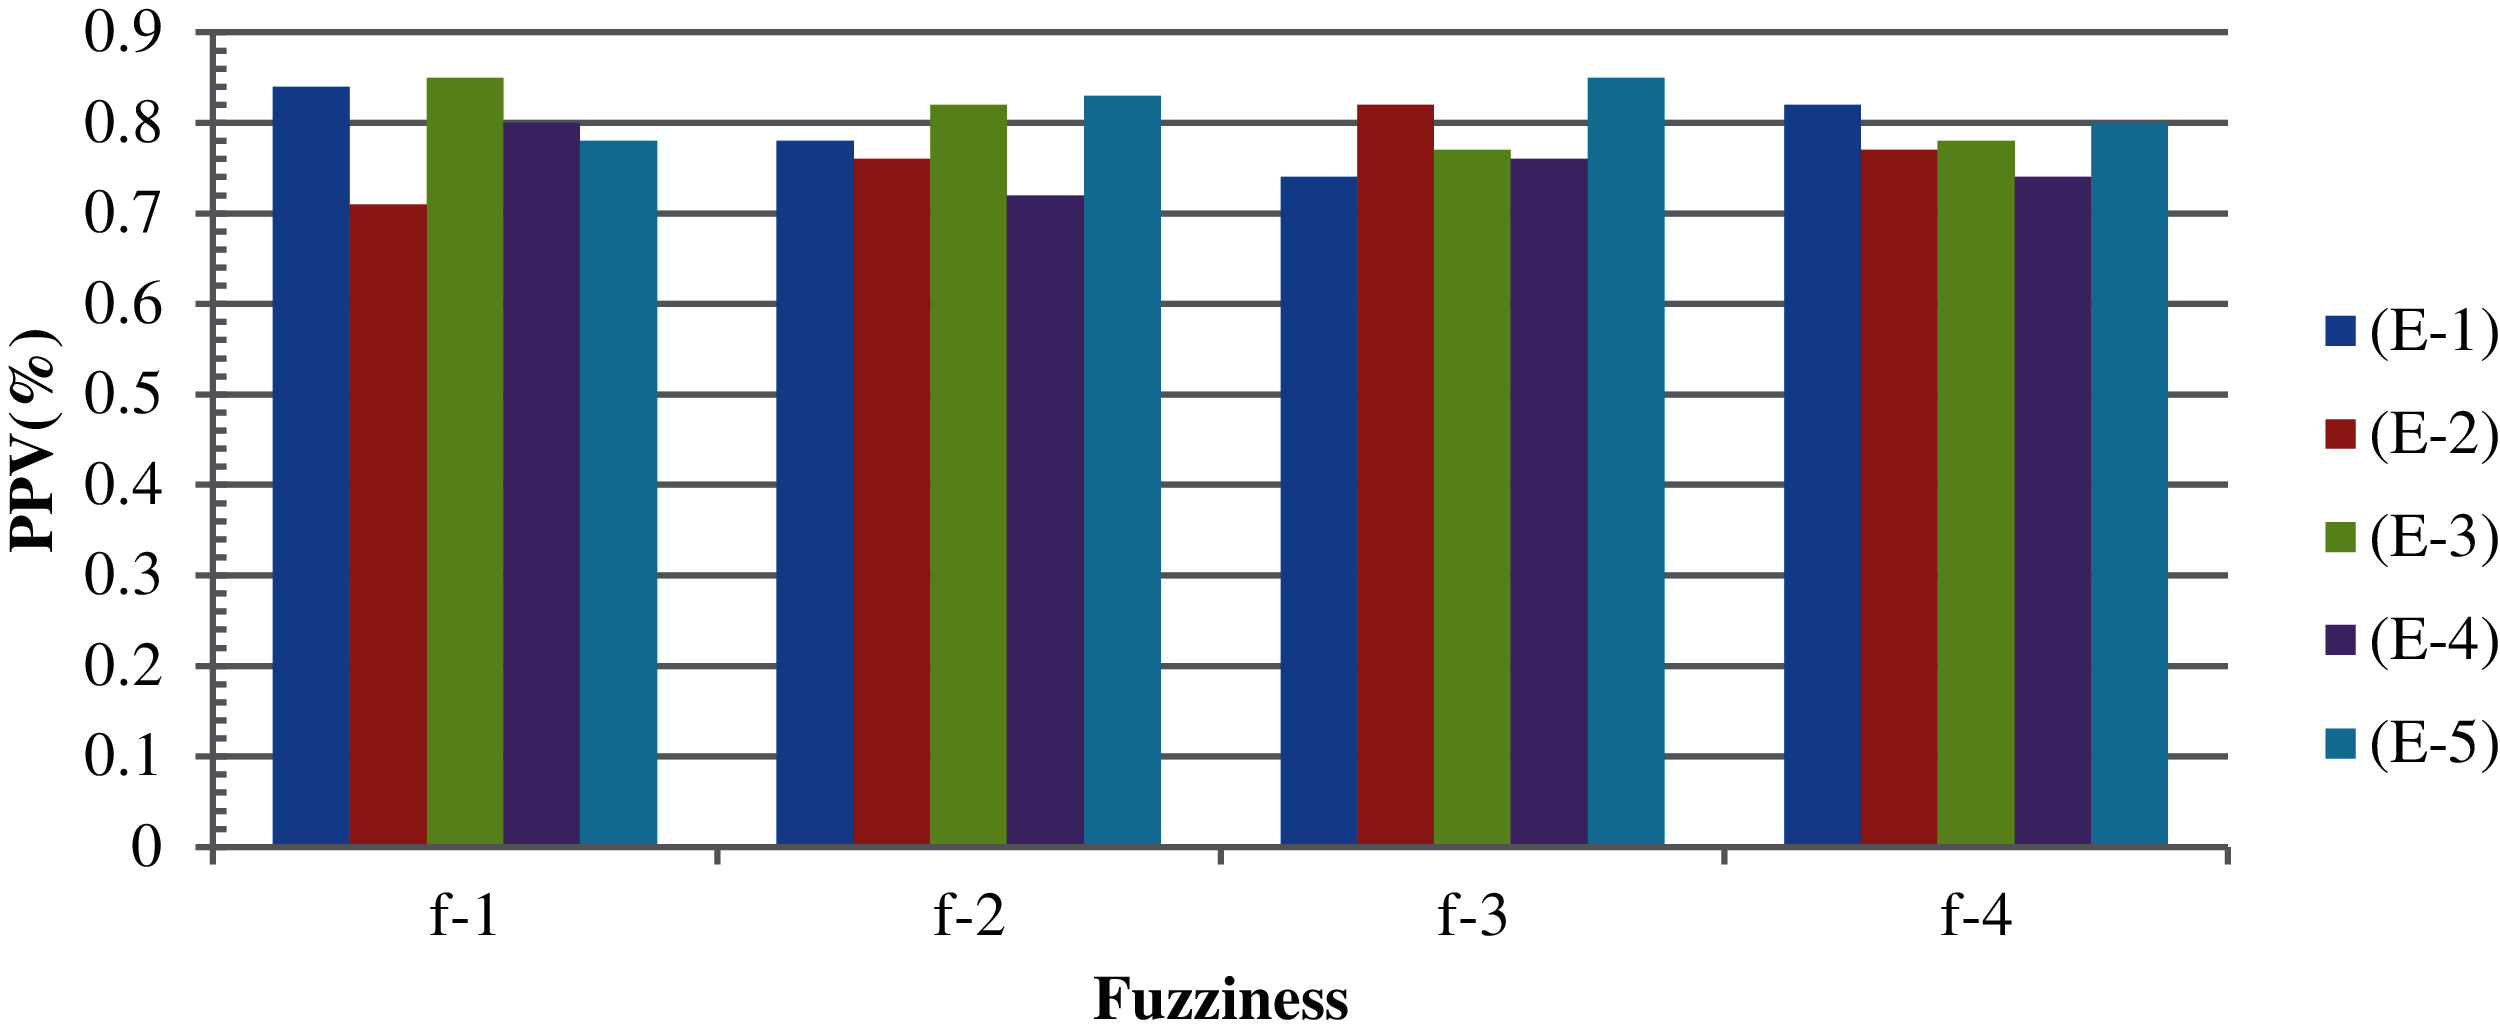
Figure 7: Results, based on TLBO-FCM, on non-clustered records based on minimization

Figure 8: Results, based on TLBO-FCM, on non-clustered records based on maximization

Figure 9: Overall comparisons based on different computational measures
Mean, standard deviation (SD) and the standard error of the mean (SEM) were considered for the variability variations from the complete population. Mean shows the average of the weight instances divided by the complete numbers. SD and SEM have been used for the presentation of the data characteristics. SD has been used to show the accurate dispersion of the individual values. SEM has been used for statistical inference. The variance has also been discussed to check the suitability of the objective function. The mean (
wi is the weight instance. n is the complete numbers. x represents the data point. s shows the sample population size.
Fig. 10 shows the mean and standard deviation obtained for the individual attributes. Fig. 11 shows the average mean and standard deviation obtained for the individual attributes. Fig. 12 shows the variance obtained for the individual attributes. Fig. 13 shows the average variance obtained for the individual attributes. From the results of D1 dataset, highest variance has been observed in the case of the A7 attribute. This indicates that attribute ranking, which may dominate the feature selection, are in the order of A7, A3, A4, A9 and A2 attributes. Most dominating attributes are A7, A3 and A4. The variance analysis clearly indicates few features with more predictive value. An overfitting problem may arise in case of high variance and low bias. There are chances that the model may predict differently, but in our case, this is negligible, as several repetitions have been considered along with the consideration of average values. The classification performances were analyzed according the following metrics.
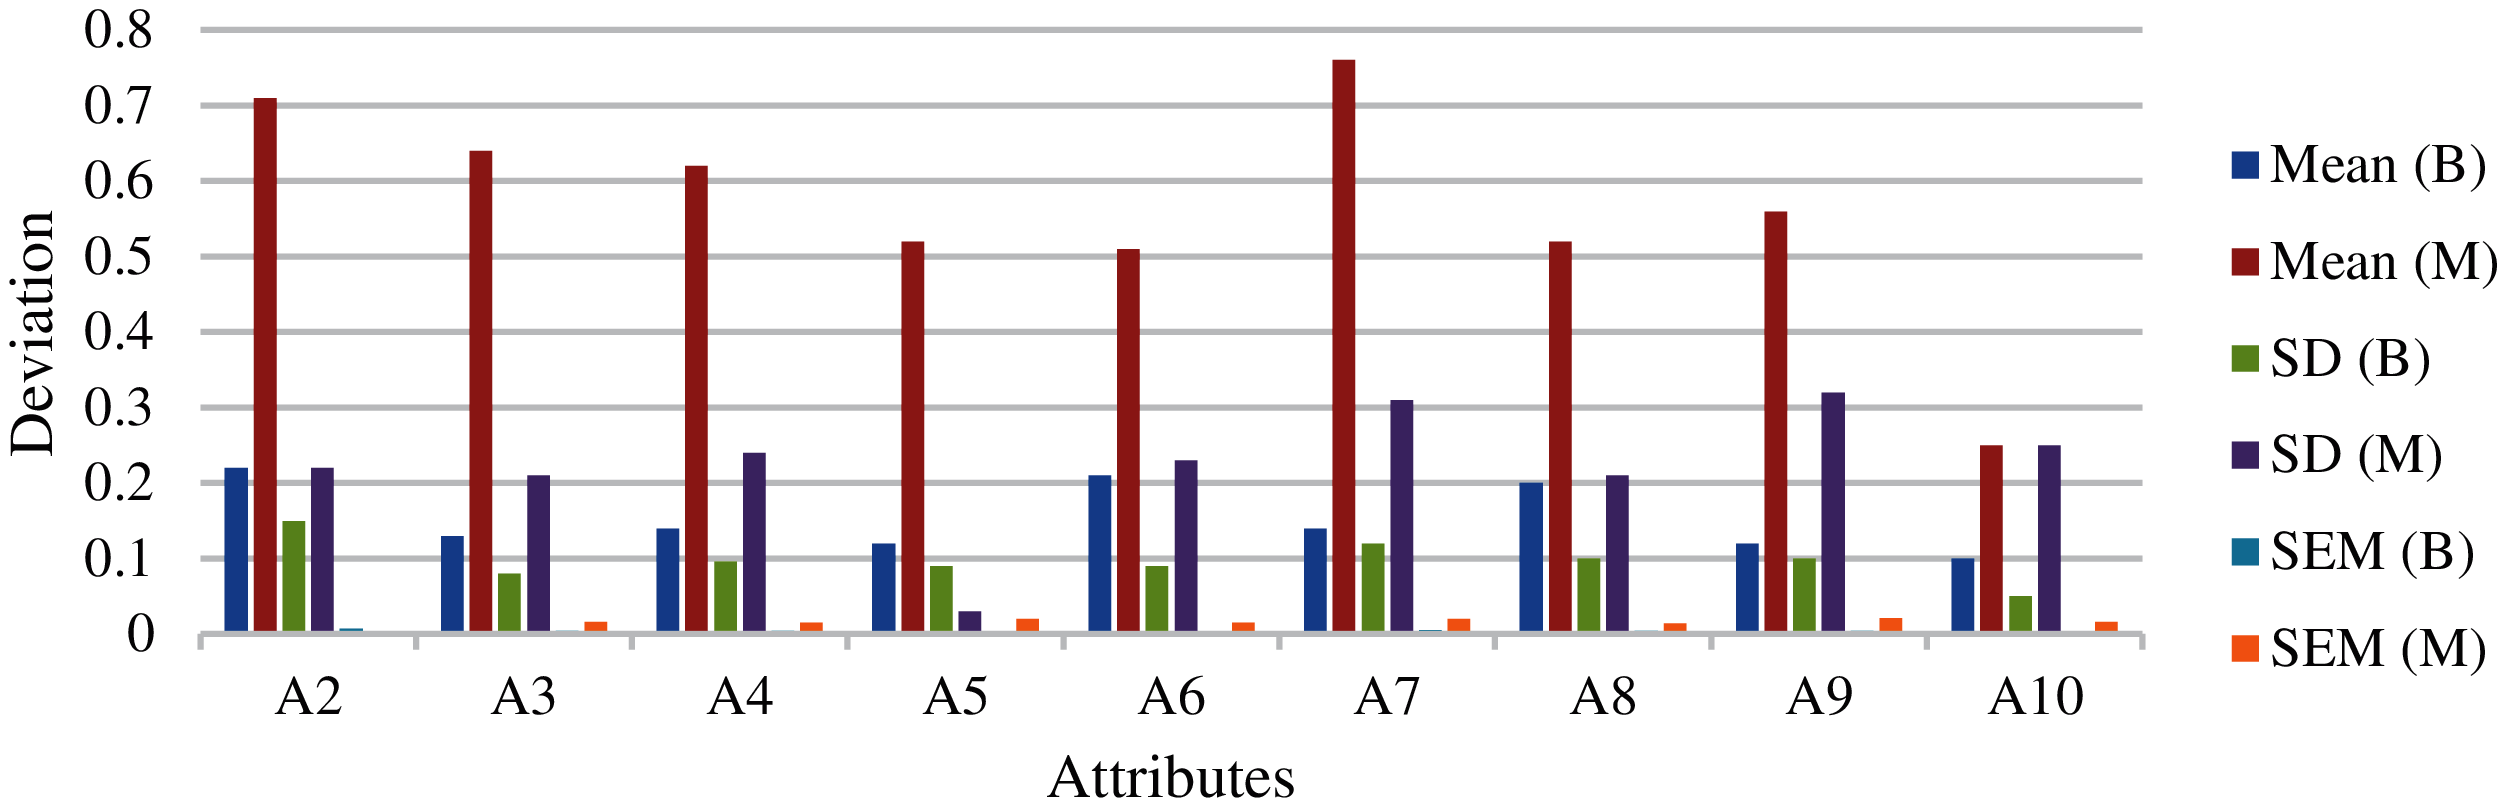
Figure 10: Mean and standard deviation obtained for the individual attributes
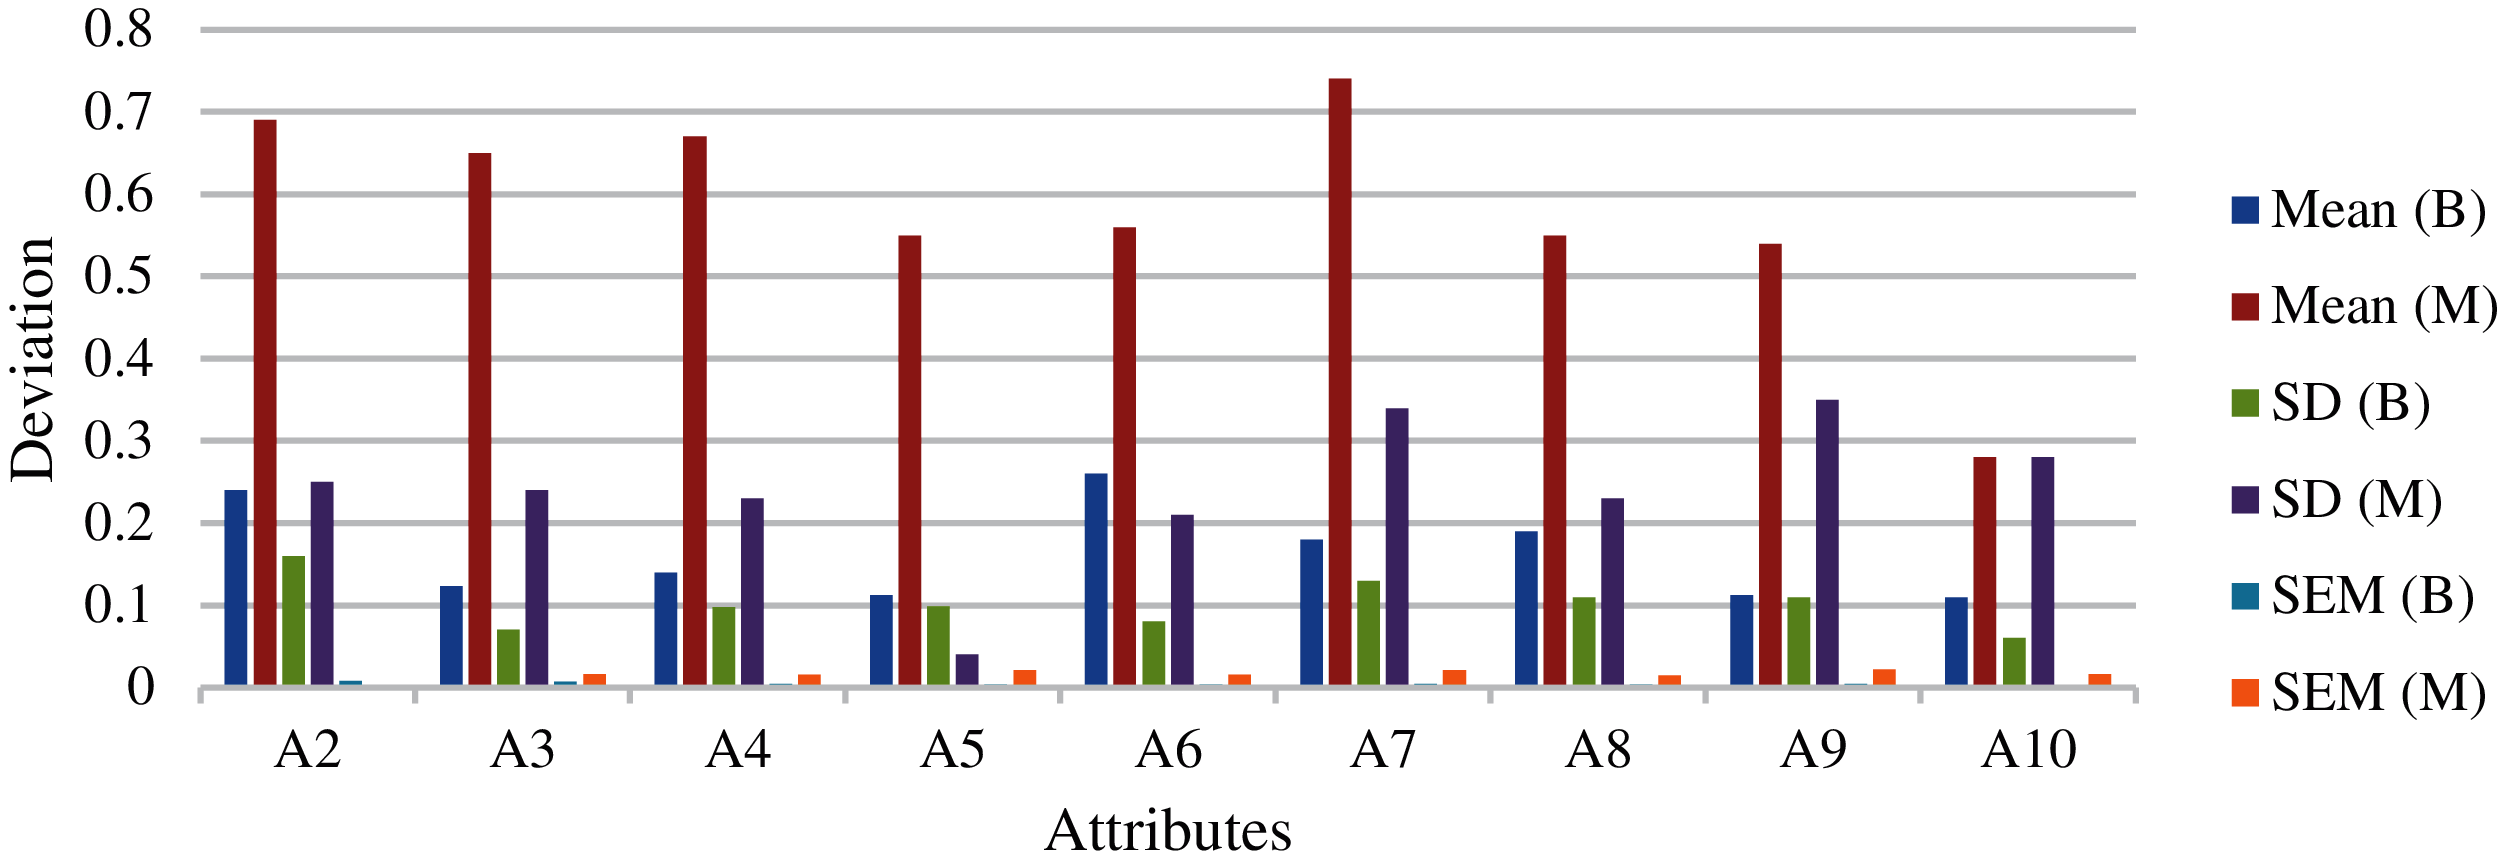
Figure 11: Average mean and standard deviation obtained for the individual attributes
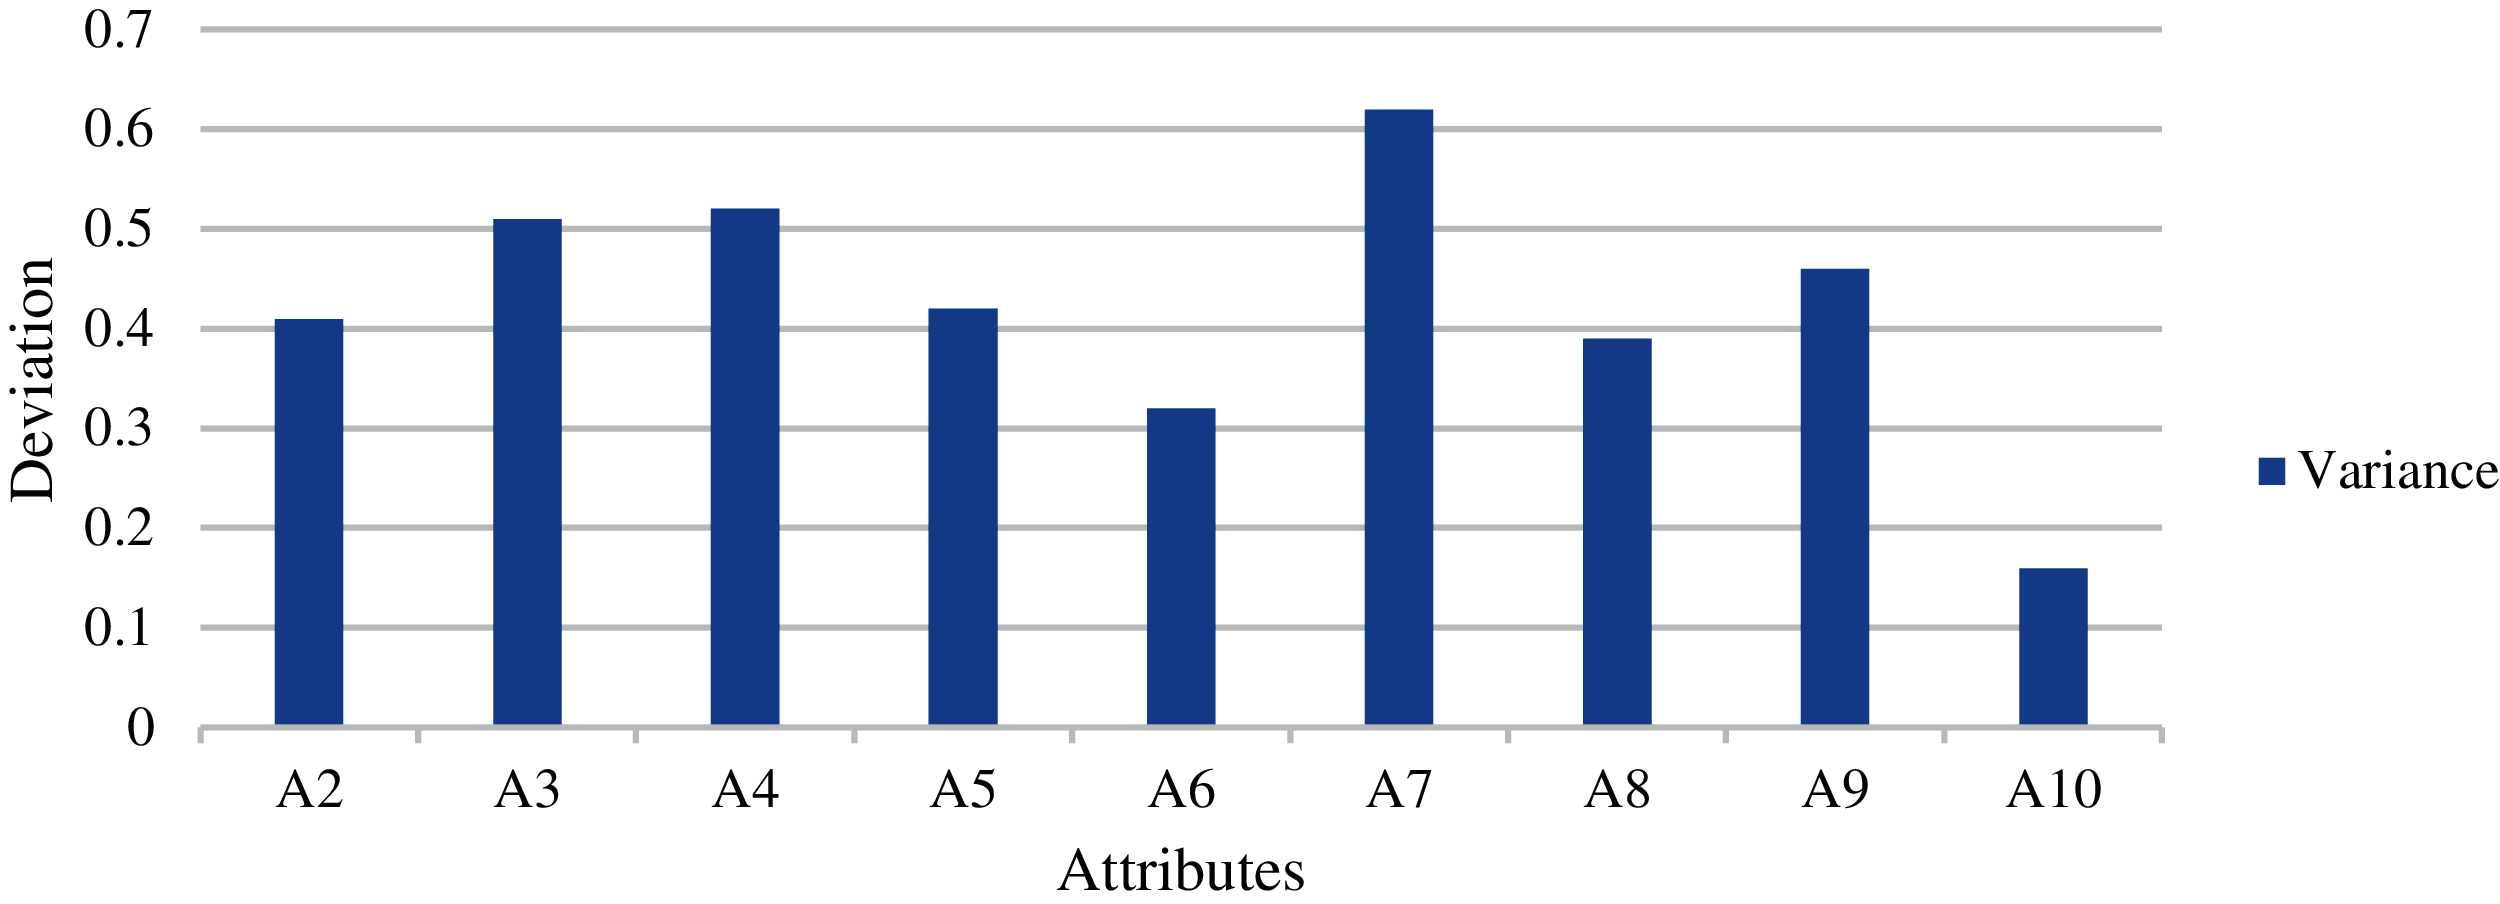
Figure 12: Variance obtained for the individual attributes

Figure 13: Average variance obtained for the individual attributes
Accuracy: It shows the rate of outcomes which are predicted based on the total outcomes. It is shown in Eq. (8).
where, TP shows the true positive value, TN shows the true negative value, FP shows the false positive value, and FN shows the false negative value.
Sensitivity: It shows the rate of outcomes which are predicted positive to all outcomes for the yes. It is shown in Eq. (9).
Specificity: It shows the rate of outcomes which are predicted negative to all outcomes for the no It is shown in Eq. (10).
For comparative study and analysis different classification algorithms, along with our approach, were considered for the experimentation. The algorithms used were RF, KNN, SVM, SVM (GS) and NB. To avoid any ambiguous inference, each experiment is repeated for 50 cycles for the calculation of average accuracy. Fig. 14 shows the sensitivity analysis of TLBO-KM/FCM on different test data with six classification algorithms. Fig. 15 shows the specificity analysis of TLBO-KM/FCM on different test data with six classification algorithms. Fig. 16 shows the comparative analysis of TLBO-KM/FCM accuracy with different classification algorithms. Evaluating D1, D2, D3, D4 and D5 feature sets, the TLBO-KM/FCM and SVM(GS) outperformed in terms of sensitivity, specificity and accuracy. TLBO-KM/FCM attained the highest average sensitivity (98.7%), highest average specificity (98.4%) and highest average accuracy (99.4%) for 10-fold cross validation with different test data. Fig. 17 shows the accuracy analysis of TLBO-KM/FCM with different datasets. The 60–80% variations considered in case of splitting ratio for training and testing data. It is considered for validating the results in different variations.

Figure 14: Sensitivity analysis of TLBO-KM/FCM on different test data with six classification algorithms

Figure 15: Specificity analysis of TLBO-KM/FCM on different test data with six classification algorithms
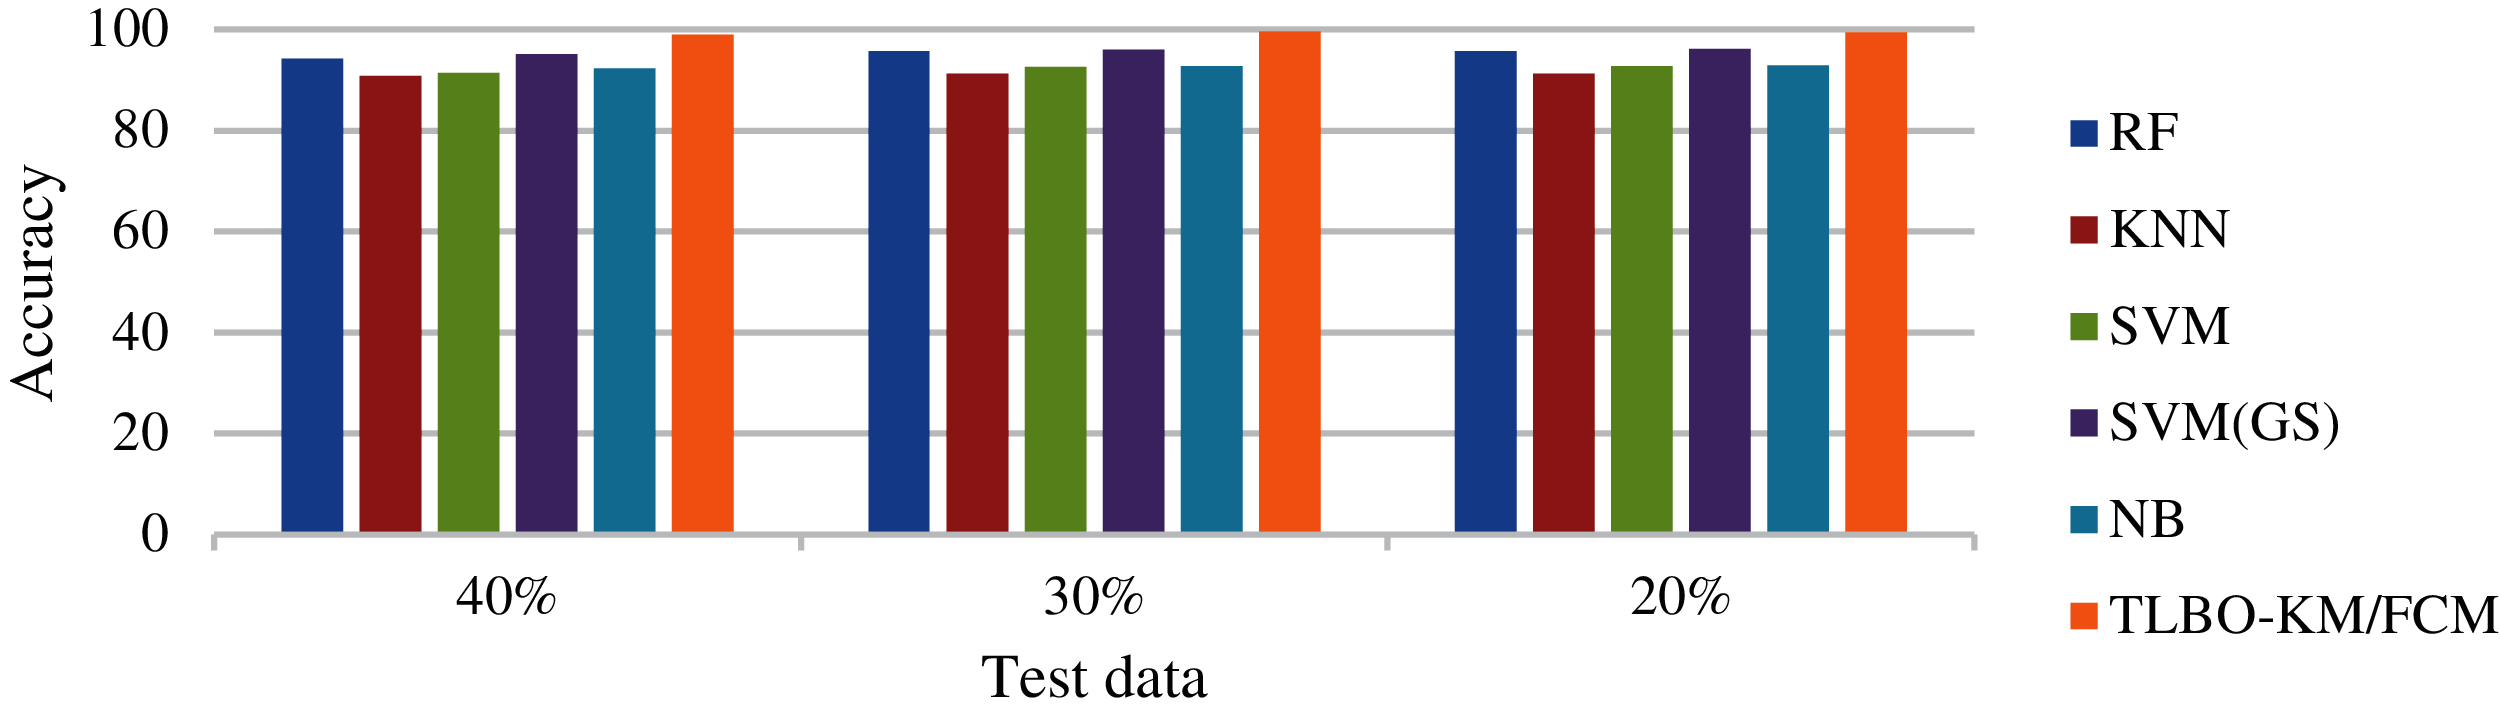
Figure 16: Comparative analysis of TLBO-KM/FCM accuracy with different classification algorithms

Figure 17: Accuracy analysis of TLBO-KM/FCM with different datasets
In this study, k-means, FCM, TLBO-KM/FCM and machine learning algorithms have been applied to the five benchmark datasets for achieving better performance in terms of sensitivity, specificity and accuracy. The key processes and findings are listed below.
1. The TLBO was used for the data-preprocessing and the TLBO-KM/FCM outperforms in all cases.
2. In Case 1 (BCW dataset), at first, only k-means was applied on the random but complete and unique data. The clustering accuracy obtained here is approximately 90%. Thereafter, TLBO was applied on the left-over data which k-means was unable to cluster. The results obtained after five cycles of TLBO were then re-applied to k-means, and approximately 97% and 92% average clustering accuracies are obtained in the case of minimization and maximization, respectively. This clearly depicts that most of the non-clustered data are classified after applying TLBO.
3. In Cases 2–5 (BCW dataset), instead of selecting randomly, the whole population was considered. Case 2 includes the variations in TLBO design variables and foggy centroid, and Case 3 additionally includes the variations in random centroid. Case 4 includes the variations in different epochs. Case 5 includes the variations in the variance and same centroid. The clustering accuracies obtained by k-means were approximately 91%, 92%, and 94% for Cases 2, 4, and 5, respectively. The non-clustered data produced by this process were then processed with TLBO-KM and the corresponding average accuracies of approximately 98%, 97%, and 99% in the case of minimization and 93%, 92%, and 93% in the case of maximization are obtained.
4. In Case 3 (BCW dataset), no variation was detected as the initialization remains the same in all iterations. The results may vary with TLBO. However, the variation caused by the random initialization is already covered in other cases.
5. In Case 6 (BCW dataset), the whole population with a completely random selection of attributes, with the variations in TLBO knowledge transfer (interaction cycle), was considered. The clustering accuracy obtained is approximately 91% in the case of k-means. The TLBO-KM applied to the non-clustered data achieves an average clustering accuracy of approximately 99% and 98% for the minimization and maximization, respectively. It is depicted from the results that TLBO-KM performs.
6. The clustering accuracies obtained were approximately 95%. The TLBO-FCM with different epsilon values and fuzziness factors achieve an average clustering accuracy of approximately, 97% and 98%, respectively. It is depicted from the results that TLBO-FCM performs better in comparison to FCM alone.
7. Therefore, TLBO-KM/FCM is efficient when compared to the k-means and FCM alone with various computational measures as it can efficiently cluster data which remain non-clustered in the approach of [41,42].
8. The combined average accuracy obtained collectively is approximately 99.4% in case of TLBO-KM and 98.6% in case of TLBO-FCM.
9. Evaluating different feature sets, the TLBO-KM/FCM and SVM(GS) clearly outperformed all other classifiers in terms of sensitivity, specificity and accuracy. TLBO-KM/FCM attained the highest average sensitivity (98.7%), highest average specificity (98.4%) and highest average accuracy (99.4%) for 10-fold cross validation with different test data.
Replications and Future Directions
The experimental framework has been developed in NETBEANS 7.2 IDE (Apache Software Foundation, Wakefield, USA). The Java Development Kit (JDK) (Oracle Corporation, California, USA) version is 1.7., using an Intel® Core™ i5–7200 U CPU running at 2.8 GHz with 4 GB RAM. The system type is a 64-bit operating system and ×64-based processor. This experiment can be replicated and enhanced in future by changing centroid calculation and validating different distance measures. Different combinations of data mining, classification algorithms and evolutionary algorithms may be used, but how these algorithms can be used together and which techniques will be more effective in combined form are the points warrant future research. This work can be extended for datasets with different arity and attributes.
In this study, TLBO-KM/FCM and machine learning algorithms were used for the clustering and classification of medical datasets. In order to compare their efficiency, they were applied separately to the same dataset. Various computational measures of integrative clustering were taken into account using multivariate parameters such as foggy centroid, random centroid, epoch variations, design variables, fuzziness value, termination criteria, and interaction cycle. For the explanation and discussion, the BCW dataset has been considered first. The TLBO-KM was able to cluster 99.4% and 97.4% of the non-clustered data (produced by applying k-means alone) in the case of minimization and maximization, respectively. Similarly, TLBO-FCM was able to cluster 98.6% and 96.4% of the non-clustered data (produced by applying FCM alone) in the case of minimization and maximization, respectively. The combined average accuracy obtained collectively is approximately 99.4% in case of TLBO-KM and 98.6% in case of TLBO-FCM. Moreover, the variations in the results of minimization and maximization were small. Thus, it can be inferred that our approach produces better results for the minimization or the maximization of the objective function. When the results of minimization and maximization are compared, it is seen that the minimization cases produce a better result. This approach is also useful in the determination of the dominating attributes. The TLBO-KM/FCM and SVM (GS) clearly outperformed all other classifiers in terms of sensitivity, specificity and accuracy. It shows the highest average sensitivity (98.7%), highest average specificity (98.4%) and highest average accuracy (99.4%) for the 10-fold cross validation. The present study suggests that the TLBO-KM/FCM with different computational measures and multivariate parameters, in different iterations and multiple TLBO preprocessing cycles, can efficiently handle medical data.
Funding Statement: The authors received no specific funding for this study.
Conflicts of Interest: The authors declare that they have no conflicts of interest to report regarding the present study.
1. A. K. Dubey, U. Gupta and S. Jain, “Breast cancer statistics and prediction methodology: A systematic review and analysis,” Asian Pacific Journal of Cancer Prevention, vol.16, no. 10, pp. 4237–4245, 2015. [Google Scholar]
2. National Research Council. In Catalyzing Inquiry at the Interface of Computing and Biology, National Academies Press, Washington, DC, USA, 2006. [Google Scholar]
3. A. Mushegian, “Grand challenges in bioinformatics and computational biology,” Frontiers in Genetics, vol. 2, pp. 1–2, 2011. [Google Scholar]
4. A. K. Dubey, U. Gupta and S. Jain, “Computational measure of cancer using data mining and optimization,” in Proc. of the Int. Conf. on Sustainable Communication Networks and Application, Erode, Tamil Nadu, India, pp. 626–632, 2019. [Google Scholar]
5. S. A. Elkader, M. Elmogy, S. El-Sappagh and A. N. Zaied, “A framework for chronic kidney disease diagnosis based on case based reasoning,” International Journal of Advanced Computer Research, vol. 8, no. 35, pp. 59–71, 2018. [Google Scholar]
6. S. M. Ashhar, S. S. Mokri, A. A. Abd Rahni, A. B. Huddin, N. Zulkarnain et al., “Comparison of deep learning convolutional neural network (CNN) architectures for CT lung cancer classification,” International Journal of Advanced Technology and Engineering Exploration, vol. 8, no. 74, pp. 126–134, 2021. [Google Scholar]
7. A. Stetco, X. J. Zeng and J. Keane, “Fuzzy C-means++: Fuzzy c-means with effective seeding initialization,” Expert Systems with Applications, vol. 42, no. 21, pp. 7541–7548, 2015. [Google Scholar]
8. S. R. Kannan, S. Ramathilagam and P. C. Chung, “Effective fuzzy c-means clustering algorithms for data clustering problems,” Expert Systems with Applications, vol. 39, no. 7, pp. 6292–300, 2012. [Google Scholar]
9. C. Bae, N. Wahid, Y. Y. Chung, W. C. Yeh, N. W. Bergmann et al., “Effective audio classification algorithm swarm-based optimization,” International Journal of Innovative Computing, Information and Control, vol. 10, no. 1, pp. 151–67, 2014. [Google Scholar]
10. R. V. Rao, V. J. Savsani and D. P. Vakharia, “Teaching–learning-based optimization: A novel method for constrained mechanical design optimization problems,” Computer-Aided Design, vol. 43, no. 3, pp. 303–315, 2011. [Google Scholar]
11. R. V. Rao, V. J. Savsani and J. Balic, “Teaching–learning-based optimization algorithm for unconstrained and constrained real-parameter optimization problems,” Engineering Optimization, vol. 44, no. 12, pp. 147–1462, 2012. [Google Scholar]
12. R. V. Rao and V. Patel, “An elitist teaching-learning-based optimization algorithm for solving complex constrained optimization problems,” International Journal of Industrial Engineering Computations, vol. 3, no. 4, pp. 535–560, 2012. [Google Scholar]
13. P. K. Mummareddy and S. C. Satapaty, “An hybrid approach for data clustering using K-means and teaching learning based optimization,” in Emerging ICT for Bridging the Future-Proceedings of the 49th Annual Convention of the Computer Society of India, CSI, Hyderabad, India, vol. 2, pp. 165–171, 2015. [Google Scholar]
14. J. S. Al-bayati and B. B. Ustundag, “Fused and modified evolutionary optimization of multiple intelligent systems using ANN, SVM approaches,” Computers Materials & Continua, vol. 66, no. 2, pp. 1479–1496, 2021. [Google Scholar]
15. R. Sanjeetha, A. Raj, K. Saivenu, M. I. Ahmed, B. Sathvik et al., “Detection and mitigation of botnet based DDoS attacks using catboost machine learning algorithm in SDN environment,” International Journal of Advanced Technology and Engineering Exploration, vol. 8, no. 76, pp. 445–461, 2021. [Google Scholar]
16. A. K. Dubey, S. Narang, A. Kumar, S. M. Sasubilli and V. García-Díaz, “Performance estimation of machine learning algorithms in the factor analysis of covid-19 dataset,” Computers, Materials & Continua, vol. 66, no. 2, pp. 1921–1936, 2021. [Google Scholar]
17. P. K. Pedireddla and S. A. Yadwad. “An effective and efficient clustering based on k-means using mapReduce and TLBO,” in Proc. of the Second Int. Conf. on Computer and Communication Technologies, Hyderabad, India, pp. 619–628, 2016. [Google Scholar]
18. B. Amiri, “Application of teaching-learning-based optimization algorithm on cluster analysis,” Journal of Basic and Applied Scientific Research, vol. 2, no. 11, pp. 11795–11802, 2012. [Google Scholar]
19. M. R. Murty, A. Naik, J. V. Murthy, P. P. Reddy, S. C. Satapathy et al., “Automatic clustering using teaching learning based optimization,” Applied Mathematics, vol. 5, no. 8, pp. 1202–1211, 2014. [Google Scholar]
20. C. S. Swapna, V. V. Kumar and J. V. Murthy, “A new approach to cluster datasets without prior knowledge of number of clusters,” Journal of Scientific & Industrial Research, vol. 74, pp. 261–264, 2015. [Google Scholar]
21. A. H. Zadeh, Q. Alsabi, J. E. Ramirez-Vick and N. Nosoudi, “Characterizing basal-like triple negative breast cancer using gene expression analysis: A data mining approach,” Expert Systems with Applications, 2020, vol. 148, pp. 1–11, 2020. [Google Scholar]
22. S. Simsek, U. Kursuncu, E. Kibis, M. AnisAbdellatif and A. Dag, “A hybrid data mining approach for identifying the temporal effects of variables associated with breast cancer survival,” Expert Systems with Applications, vol. 139, pp. 1–13, 2020. [Google Scholar]
23. L. Chiudinelli, A. Dagliati, V. Tibollo, S. Albasini, N. Geifman et al., “Mining post-surgical care processes in breast cancer patients,” Artificial Intelligence in Medicine, vol. 105, pp. 1–16, 2020. [Google Scholar]
24. T. Jonsdottir, E. T. Hvannberg, H. Sigurdsson and S. Sigurdsson, “The feasibility of constructing a predictive outcome model for breast cancer using the tools of data mining,” Expert Systems with Applications, vol. 34, no. 1, pp. 108–118, 2008. [Google Scholar]
25. J. Tanha, H. Salarabadi, M. Aznab, A. Farahi and M. Zoberi, “Relationship among prognostic indices of breast cancer using classification techniques,” Informatics in Medicine Unlocked, vol. 18, pp. 1–9, 2020. [Google Scholar]
26. J. Alwidian, B. H. Hammo and N. Obeid, “WCBA: Weighted classification based on association rules algorithm for breast cancer disease,” Applied Soft Computing, vol. 62, pp. 536–549, 2018. [Google Scholar]
27. W. C. Yeh, W. W. Chang and Y. Y. Chung, “A new hybrid approach for mining breast cancer pattern using discrete particle swarm optimization and statistical method,” Expert Systems with Applications, vol. 36, no. 4, pp. 8204–8211, 2009. [Google Scholar]
28. M. Salehi, J. Razmara and S. Lotfi, “A novel data mining on breast cancer survivability using MLP ensemble learners,” The Computer Journal, vol. 63, no. 3, pp. 435–447, 2020. [Google Scholar]
29. B. Prabadevi, N. Deepa, L. B. Krithika and V. Vinod, “Analysis of machine learning algorithms on cancer dataset,” in Int. Conf. on Emerging Trends in Information Technology and Engineering, Vellore, Tamil Nadu, India, pp. 1–10, 2020. [Google Scholar]
30. T. Nizam and S. I. Hassan, “Exemplifying the effects of distance metrics on clustering techniques: f-measure, accuracy and efficiency,” in Int. Conf. on Computing for Sustainable Global Development, New Delhi, India, pp. 39–44, 2020. [Google Scholar]
31. A. Ahmad and L. Dey, “A k-mean clustering algorithm for mixed numeric and categorical data,” Data & Knowledge Engineering, vol. 63, no. 2, pp. 503–527, 2007. [Google Scholar]
32. B. Minaei-Bidgoli, M. Asadi and H. Parvin, “An ensemble based approach for feature selection,” in Engineering Applications of Neural Networks, Springer, Corfu, Greece, pp. 240–246, 2011. [Google Scholar]
33. H. Parvin, M. MirnabiBaboli and H. Alinejad-Rokny, “Proposing a classifier ensemble framework based on classifier selection and decision tree,” Engineering Applications of Artificial Intelligence, vol. 37, pp. 34–42, 2015. [Google Scholar]
34. H. Parvin, B. Minaei-Bidgoli and H. Alinejad-Rokny, “A new imbalanced learning and dictions tree method for breast cancer diagnosis,” Journal of Bionanoscience, vol. 7, no. 6, pp. 673–678, 2013. [Google Scholar]
35. H. Dashti, A. Dehzangi, M. Bayati, J. Breen, D. Ebrahimi et al., “Integrative analysis of mutated genes and mutational processes reveals seven colorectal cancer subtypes,” bioRxiv, 2020. [Google Scholar]
36. A. Baccouche, B. Garcia-Zapirain, C. C. Olea and A. S. Elmaghraby, “Breast lesions detection and classification via yolo-based fusion models,” Computers, Materials & Continua, vol. 69, no.1, pp. 1407–1425, 2021. [Google Scholar]
37. A. R. Rasam, N. S. Zuki, N. M. Saad and R. Ghazali, “Geospatial infrastructure solutions for local government sectors: Geo-enabling infectious disease monitoring system in state health departments,” International Journal of Advanced Technology and Engineering Exploration, vol. 8, no. 78, pp. 670–684, 2021. [Google Scholar]
38. O. Bardhi and B. G. Zapirain, “Machine learning techniques applied to electronic healthcare records to predict cancer patient survivability,” Computers, Materials & Continua, vol. 68, no. 2, pp. 1595–1613, 2021. [Google Scholar]
39. A. M. Flores, F. Demsas, N. J. Leeper and E. G. Ross, “Leveraging machine learning and artificial intelligence to improve peripheral artery disease detection, treatment, and outcomes,” Circulation Research, vol. 128, no. 12, pp. 1833–1850, 2021. [Google Scholar]
40. K. Bache and M. Lichman, “UCI machine learning repository,” [Online]. Available http://archive.ics.uci.edu/ml, accessed on 26 October, 2019. [Google Scholar]
41. A. K. Dubey, U. Gupta and S. Jain, “Analysis of k-means clustering approach on the breast cancer wisconsin dataset,” International Journal of Computer Assisted Radiology and Surgery, vol. 11, no. 11, pp. 2033–2047, 2016. [Google Scholar]
42. A. K. Dubey, U. Gupta and S. Jain, “Comparative study of K-means and fuzzy C-means algorithms on the breast cancer data,” International Journal on Advanced Science, Engineering and Information Technology, vol. 8, no. 1, pp. 18–29, 2018. [Google Scholar]
 | This work is licensed under a Creative Commons Attribution 4.0 International License, which permits unrestricted use, distribution, and reproduction in any medium, provided the original work is properly cited. |