DOI:10.32604/cmc.2022.020698
| Computers, Materials & Continua DOI:10.32604/cmc.2022.020698 | |
| Article |
Efficient Deep-Learning-Based Autoencoder Denoising Approach for Medical Image Diagnosis
1Department of Electronics and Electrical Communications, Faculty of Electronic Engineering, Menoufia University, Menouf, 32952, Egypt
2Alexandria Higher Institute of Engineering & Technology (AIET), Alexandria, Egypt
3Department of Information Technology, College of Computer and Information Sciences, Princess Nourah Bint Abdulrahman University, Riyadh, 84428, Saudi Arabia
*Corresponding Author: Naglaa F. Soliman. Email: nfsoliman@pnu.edu.sa
Received: 04 June 2021; Accepted: 11 July 2021
Abstract: Effective medical diagnosis is dramatically expensive, especially in third-world countries. One of the common diseases is pneumonia, and because of the remarkable similarity between its types and the limited number of medical images for recent diseases related to pneumonia, the medical diagnosis of these diseases is a significant challenge. Hence, transfer learning represents a promising solution in transferring knowledge from generic tasks to specific tasks. Unfortunately, experimentation and utilization of different models of transfer learning do not achieve satisfactory results. In this study, we suggest the implementation of an automatic detection model, namely CADTra, to efficiently diagnose pneumonia-related diseases. This model is based on classification, denoising autoencoder, and transfer learning. Firstly, pre-processing is employed to prepare the medical images. It depends on an autoencoder denoising (AD) algorithm with a modified loss function depending on a Gaussian distribution for decoder output to maximize the chances for recovering inputs and clearly demonstrate their features, in order to improve the diagnosis process. Then, classification is performed using a transfer learning model and a four-layer convolution neural network (FCNN) to detect pneumonia. The proposed model supports binary classification of chest computed tomography (CT) images and multi-class classification of chest X-ray images. Finally, a comparative study is introduced for the classification performance with and without the denoising process. The proposed model achieves precisions of 98% and 99% for binary classification and multi-class classification, respectively, with the different ratios for training and testing. To demonstrate the efficiency and superiority of the proposed CADTra model, it is compared with some recent state-of-the-art CNN models. The achieved outcomes prove that the suggested model can help radiologists to detect pneumonia-related diseases and improve the diagnostic efficiency compared to the existing diagnosis models.
Keywords: Medical images; CADTra; AD; CT and X-ray images; autoencoder
Pneumonia is defined as an infection caused by bacteria, germs, or any other viruses, and it occurs inside the lungs. Pneumonia is one of the main causes of death in children and old people worldwide [1]. Therefore, pneumonia threatens human life, if it is not diagnosed promptly or known, early. Symptoms associated with pneumonia diseases include a combination of productive or dry cough, fever, difficulty of breathing, and chest pain [2].
Due to the similarity of symptoms associated with pneumonia and COVID-19 diseases, identifying them becomes complicated. Due to the mutations of coronavirus and the continuous increase of the number of infected people, COVID-19 pandemic is still widespread. The most critical step in confronting this virus is the effective and continuous examination of patients infected with pneumonia and COVID-19, so that they can receive treatment and isolate themselves to reduce the speed of spreading of the virus.
The method used in the screening and detection of coronavirus is the polymerase chain reaction (PCR) test [1], which can detect SARSCov-2 RNA from respiratory system samples collected by various means, such as swabs of the oropharynx and the nose. The PCR test is considered as a gold standard for high sensitivity, but it is time-consuming, expensive, and extremely complex. Alternatively, radiography examination of chest radiography images, such as X-rays and CT scans, helps to discover infected cases quickly and isolate them to minimize the spread of infection. In recent studies, it was found that patients show differences and abnormalities in chest radiography, through which it is possible to identify those infected with the COVID-19 virus [2,3]. Some researchers have even suggested that chest radiography is a fundamental tool in detecting coronavirus in areas that suffer from the pandemic spread, because it is faster and available in modern healthcare systems [4]. Radiological images also show high sensitivity to the infection [5]. One of the serious problems faced, when dealing with images, is the need for radiologists to interpret these images, because visual features can be unclear. Therefore, computer diagnostic systems will help specialists greatly in interpreting images, as they are, by far, faster and more accurate in detecting cases of pneumonia and COVID-19.
Deep convolution learning methods for learning feature representations of data in large dimensions were successfully implemented. The learned features would display the non-linear properties seen in the data. Unsupervised or supervised learning is a part of deep network preparation for feature extraction and classification. Noise reduction is required to analyze images, properly. So, a study of methods to reduce noise is presented, because denosising is a classic problem in computer vision. Various techniques are used in denoising of medical images, such as the stacked denoising autoencoder (SDAE) model, which is used for pre-training of networks [6]. Researchers suggested a new efficient online model for variational learning of limited and unlimited Gamma distributions [7]. It depends on the characteristics of Gamma distribution, online knowledge scalability, and the performance of variation inference. Initial experiments on newly developed databases of COVID-19 images were carried out with a feed-forward strategy, CNNs, and image descriptors of texture features [8]. A modern class decomposition-based CNN architecture was used to increase the efficiency of classification of medical images, with the DeTraC method for transfer learning and class decomposition. This method was presented in [9].
The developments and progress taking place in deep learning (DL) have led to new models for medical image processing [10–12]. Autoencoders were used to reduce the noise in images [13,14], as they have better performance than those of other traditional methods. To compare the autoencoder with traditional methods for noise reduction in medical images, we find that the autoencoder method gives the same performance as those of the other methods in the case of feature linearity. On the other hand, with feature non-linearity, the traditional methods fail to reconstruct the image from noise. Automatic noise reduction devices (autoencoders), using CNN, can effectively reduce noise on images, as they can exploit high spatial correlations. To solve the problem of data paucity in medical images, transfer learning is used to transfer what the model has learned from natural images in ImageNet competitions to medical image classification and save the amount of data and the training time.
This paper presents a model for the automatic detection of pneumonia and COVID-19 in a multi-class classification (Pneumonia, COVID-19, and Normal) scenario and binary classification (COVID-19 and Normal) scenario of chest CT images. This is performed using a deep CNN, namely CADTra, for better performance in terms of accuracy, precision, recall, f1-score, confusion matrix, and receiver operating characteristic (ROC) curve. It is performed on X-ray and CT datasets with an autoencoder model to denoise medical images and obtain higher evaluation metrics. Different types of noise are investigated, including Gaussian, salt and pepper, and speckle noise with different variances. The CADTra works to reduce noise and achieve good performance in extracting different features from medical images. This is clear in the values obtained for Peak Signal-to-Noise Ratio (PSNR) and the Structural Similarity Index (SSIM). Then, images resulting from the denoising process are used to improve classification efficiency using transfer learning. Different models of transfer learning, including AlexNet [15], LeNet-5 [16], VGG16 [17], and Inception (Naïve) V1 [18], are used for DL, whose purpose is to retrain all weights of the pre-trained network from the first to the last layer. DenseNet121, Dense-Net169, DenseNet201 [19], ResNet50, ResNet152 [20], VGG16, VGG19 [17], and Xception [21] are used for fine-tuning, whose purpose is to train more layers by tuning the learning weights, until an important performance boost is achieved. To test the rigidity of the proposed model, FCNN full training is used. Moreover, different ratios of training and testing are applied (80:20, 70:30, and 60:40).
This empirical work leads to the following significant results:
1) Differentiating between cases of pneumonia, COVID-19, and normal, depending on multiple sources of medical imaging. This is performed on datasets of X-ray and CT scans.
2) Proposal of CNN deep training for transfer learning models and FCNN model without using CADTra.
3) Preparing and training CADTra on different datasets, and then preparing images by adding noise and then removing it by AD.
4) Using CADTra to enhance the same deep training and the diagnostic and classification functions of knowledge transfer models.
5) Comparing the outcomes of the models with varying training/testing ratios before and after the use of CADTra, to assess their effect on digital medical image categorization.
6) Utilization of different state-of-the-art models from the literature for detailed comparisons and experimental research.
The rest of this research work is organized as follows. Related work is presented in Section 2. The proposed model for classification (CADTra) with autoencoder denoising is given in Section 3. Results are presented in Section 4, and the concluding remarks are given in Section 5.
Having an accurate diagnosis and identifying the cause of a disease and its complications quickly remain important tasks for physicians. This is needed to minimize patient distress. Indeed, image processing and deep learning algorithms in biomedical image analysis and processing have shown outstanding results. This section presents a short overview of a few significant literature contributions.
A CNN was used to create a decompose, transfer, and compose (DeTraC) model for diagnosing COVID-19, based on X-ray scans [22]. The model dealt with any irregularity in the image dataset by identifying its class using a class decomposition mechanism. Based on a CT dataset, a dual-branch combination network (DCN) method was developed to map the likelihood of converting the classification from classification at the slice level to classification at the individual level to better recognize COVID-19 [23]. This model achieved an accuracy of 96.74%, using an internal validation dataset, and 92.87% using an external dataset. Another model was devised depending on deep learning, using CT datasets to detect Coronavirus. It also uses a stacked autoencoder to improve the performance of the entire model by extracting the features of the dataset and achieving better results [24]. Capsule networks have been proposed as new artificial neural networks, whose goal is to detect COVID-19 from chest X-ray images [25]. These networks were suggested for quick and accurate diagnosis of COVID-19. For obtaining results in a short time, they were used for binary and multi-class classification.
Depending on artificial intelligence, especially deep learning, researchers evaluated eight pre-trained CNN models (VGG16, AlexNet, GoogleNet, SqueezeNet, MobileNet-V2, Inception-V3, ResNet34, and ResNet50) on chest X-ray images, and compared between models, based on several important factors [26]. The ResNet34 model has the best performance, with an average accuracy of 98.33%. A new CoroDet model was proposed for the automatic detection of COVID-19, based on CNN and using X-ray and CT images [27]. It was used for binary, as well as multi-class classification. The latter was performed in the case of attempting to classify images into three and four categories. This model has good performance. The CNN was used to classify a set of X-ray images to extract deep features from each [28]. Previously-trained models were used, such as ResNet18, ResNet50, ResNet101, VGG16, and VGG19. The support vector machine (SVM) classifier with different kernels, namely linear, quadratic, cubic, and Gaussian, were also used. Deep samples extracted with ResNet50 and the SVM classifier have achieved an accuracy of 94.7%, which was the highest among the results. A new multi-tasking model to identify pneumonia diseases, especially COVID-19, was devised based on DL. It works on CT scans and performs three tasks: classification, reconstruction, and segmentation [29]. The goal of this model is to improve the performance in both classification and segmentation, especially for small datasets.
The multiple kernels ELM (MKs-ELM-DNN) [30] is one of the methods used to identify Coronavirus, based on the DenseNet201 structure. It was previously trained on a set of CT images. It uses the extreme learning machine (ELM) classifier. Panahi et al. [31] introduced a new method for identifying people infected by COVID-19 using X-ray images. It is called fast COVID-19 detector (FCOD), and it depends on the inception architecture, as it reduces the layers of wrapping to reduce the computational cost and time and enable the model to be used in hospitals and in assisting radiology specialists. The COVID-Screen-Net was used in the multi-category classification of datasets of X-ray images, which works to determine the distinctive features of images. These features were drawn from GradCam, and the dataset was collected through hospitals and data available on the web [32].
In this paper, we create a CADTra model, based on CNN, in addition to using an autoencoder to reduce noise in images, in order to achieve an outstanding performance and a high accuracy of diagnosis. The main objective is to automatically identify the type of the disease in the shortest possible time. The proposed model is superior to other models published in previous studies, as seen in the result section.
In this work, we propose an automatic model, using a type of deep CNN called CADTra, to detect and identify infected persons with pneumonia and COVID-19 diseases, as shown in Fig. 1. The proposed CADTra model consists of three stages: a pre-processing stage, an autoencoder denoising stage, and a classification stage using a CNN. The pre-processing stage is responsible for processing and reading the dataset and for augmentation of images. Since the sizes of the images are different, because they have been collected from more than one source, this stage also works on resizing the images to 224 × 224 × 3. These numbers refer to the length, width, and channel of the image, and they are adopted for all images (X-ray and CT) to avoid overfitting, in order to classify images by using the CNN architecture. In the denoising autoencoder stage, various noise types (Gaussian, speckle, and salt and pepper) are treated to reduce their effect on the classification process. In the final classification stage, the FCNN and transfer learning models are used for classification.
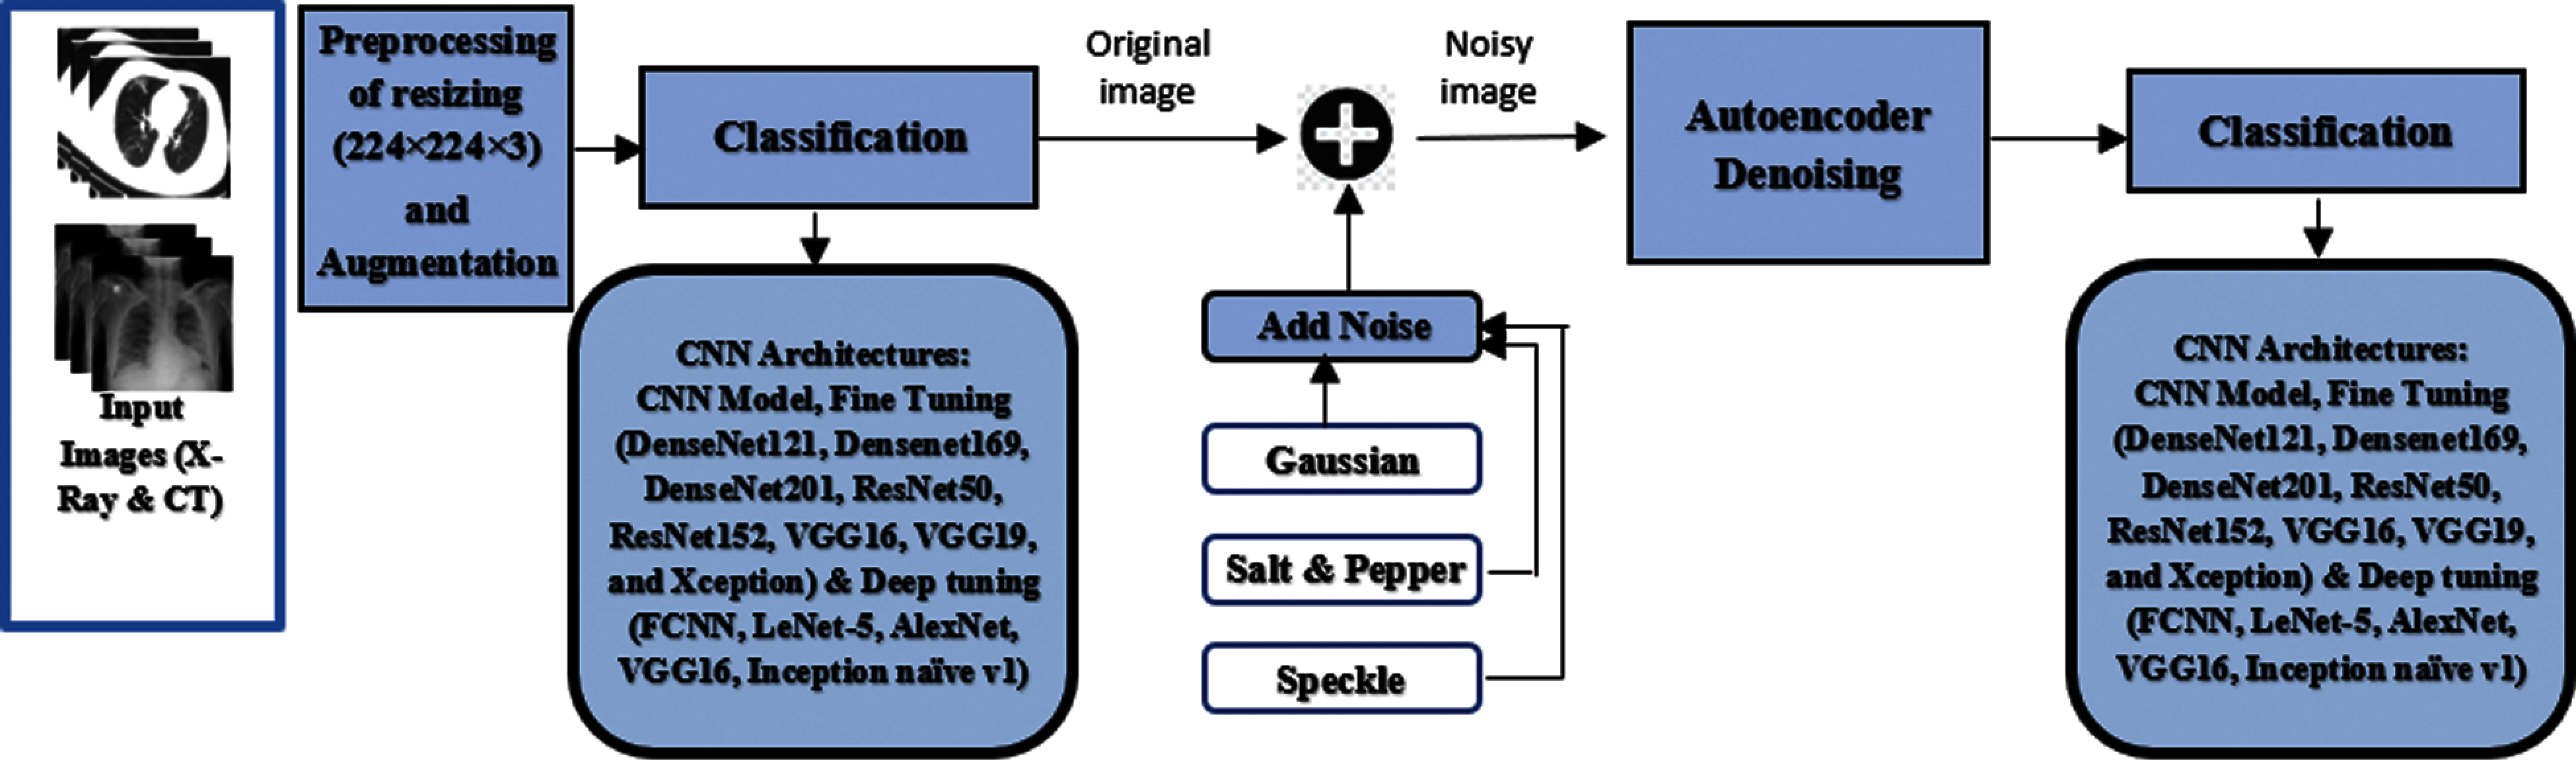
Figure 1: General steps of the proposed CADTra model
3.1 Network of the Denoising Autoencoder
An autoencoder consists of an encoder and a decoder. Each of them contains three layers, in addition to the batch normalization stage at the beginning of the model, as shown in Fig. 2. There are three convolution layers and three convolution-transposed layers (ConvTrans) in the autoencoder described above. An autoencoder extracts features from images and reshapes them. It is made of an input layer, which compresses the image to extract all strong features and eliminate weak ones. The second component of the encoder is the neural network, which is usually shrunk to have the smallest number of nodes possible. From the extracted features, a decoder (to reconstruct the image) is presented, and it works based on the composition and features of the image. The general purpose of this autoencoder is to work on denoising of images. The training process is carried out by comparing the resulting image and the original one and improving the former weights to obtain the most similar image to the original one.
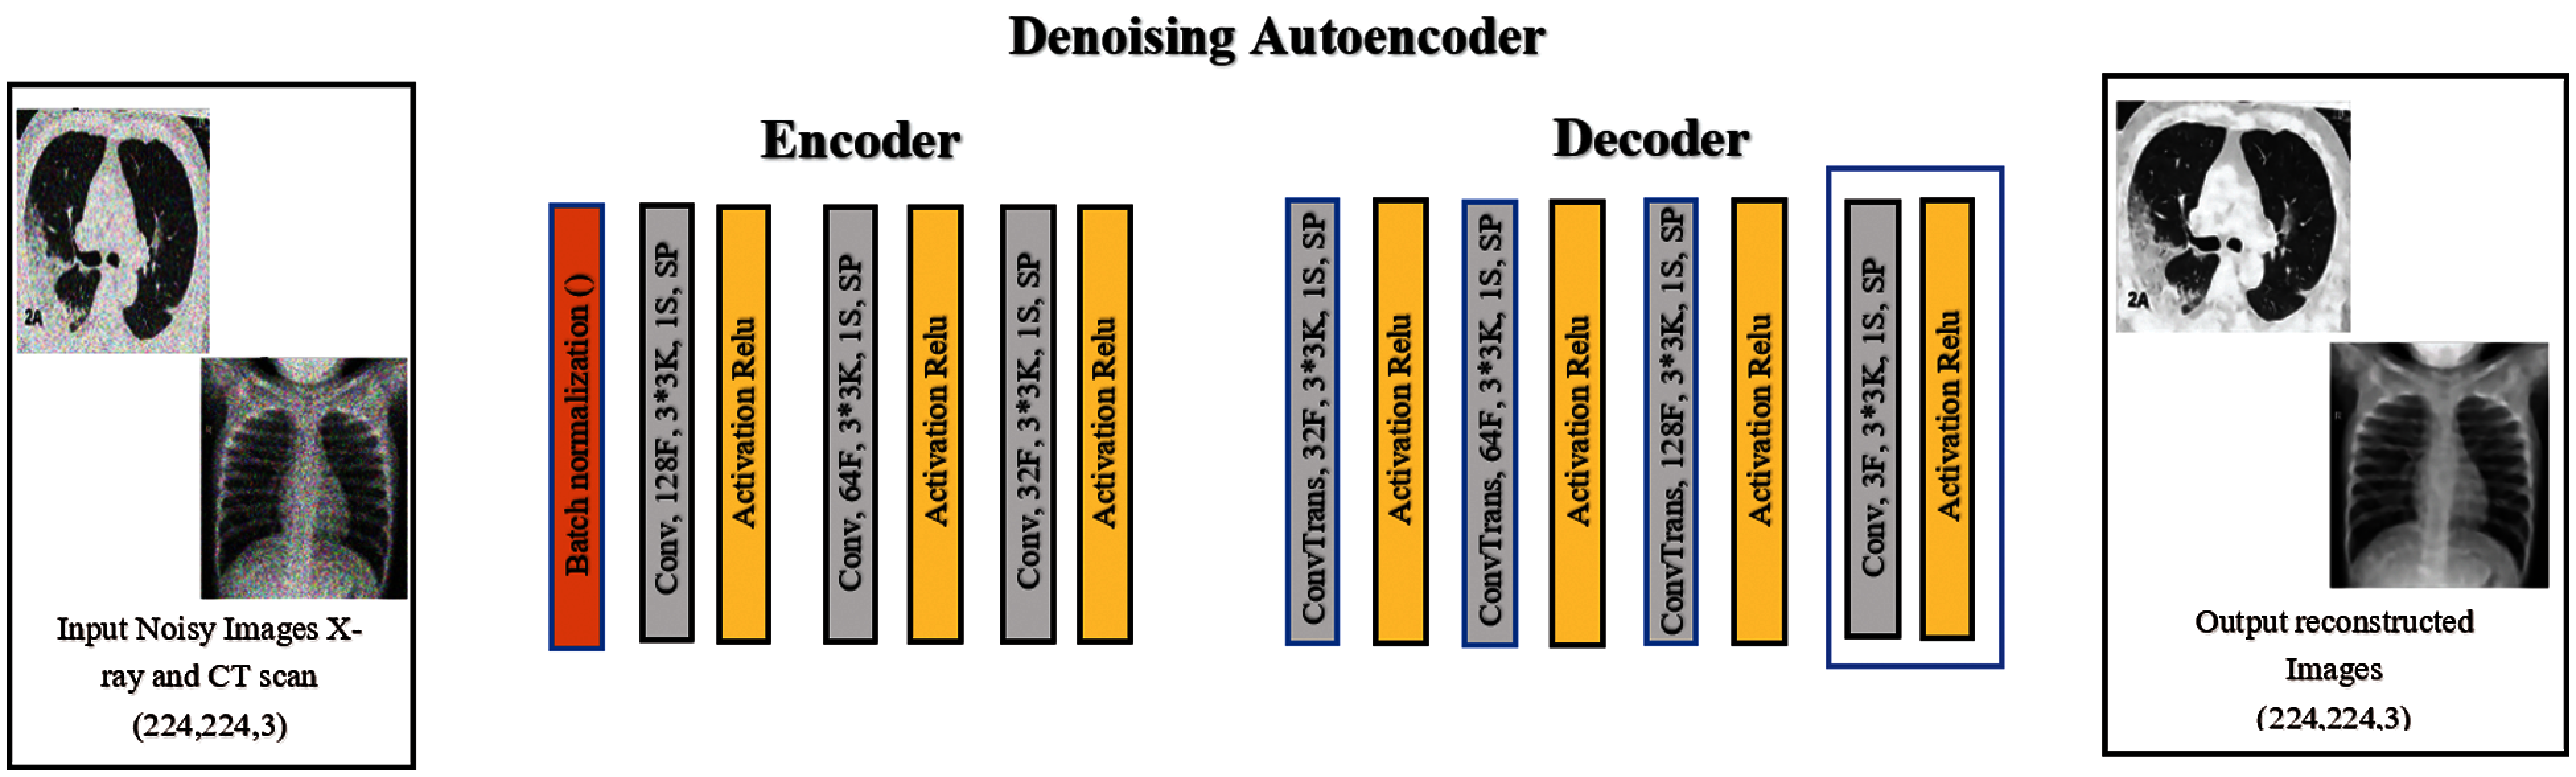
Figure 2: The structure of the denoising autoencoder network layer
In general, the utilization of a smaller number of layers and the achievement of lower computational cost improve the performance of the image denoising process. Image denoising is performed using an eight-layer convolution autoencoder network. The dimensions of the input image are 224 × 224 × 3, and those of the output image are 224 × 224 × 32. This output is the input of the decoder, and its output size is 224 × 224 × 3. In the proposed denoising autoencoder network, the batch normalization layer and the convolution layers form the encoder. The size of the kernels of each layer is 3 × 3, and the numbers of convolution filters for layers 1, 2, and 3 are 128, 64, and 32, respectively. The ConvTrans layers and the output convolution layer form the decoder, and the number of convolution filters for layers 1, 2, and 3 are 32, 64, and 128, respectively. The stride of the convolution calculation is 1. The same applies to the padding operation. The linear rectification unit (Relu) is used as the activation function in every ConvTrans and convolution layer [33]. It can be expressed using the following function:
where
where
3.2 Transfer Learning and Full Learning Models
The CNNs have been used in image classification to detect different types of pneumonia, especially COVID-19. In general, the CNN framework includes the following layers: batch normalization, input, convolutional, fully-connection (FC), pooling, dropout, dense, and output layers. It is well-known that the CNN framework can be prepared endwise to permit selection and extraction of features, and ultimately, prediction or classification. In this work, several full-training and transfer learning models were utilized to compare and test the durableness and efficiency of our CNN model, before and after the proposed AD model, including tuning of CNN frameworks such as AlexNet [15], LeNet-5 [16], VGG16 [17], and Inception (Naïve) V1 [18], used in DL. The DL aims to retrain all the pre-trained network weights from the first to the end layer. The following CNN models of transfer learning are also included: DenseNet121, DenseNet169, DenseNet201 [19], ResNet50, ResNet152 [20], VGG16, VGG19 [17], and Xception [21]. The pre-trained transfer learning models by fine-tuning have achieved outstanding performance in classifying CT and X-ray images [22]. The transfer learning is divided into three main scenarios, namely shallow tuning, deep tuning and fine tuning. They were used for fine tuning. Fine tuning aims to train more layers by tuning the learning weights until a significant performance boost is achieved. A simple FCNN framework is designed to identify cases infected by Coronavirus. It is composed of batch normalization, followed by four convolution layers consisting of 16, 32, 64, and 64 filters, successively, with a rectified linear unit (ReLU) and a kernel size of 3 × 3. It is also composed of two layers of max-pooling with a pool size of 2, three FC layers with dropout probabilities of 0.22 and 0.15, using SoftMax as an activation function, and cross-entropy as a loss function in the classification layer. The comprehensive specifications of our suggested CNN classification framework are shown in Fig. 3.
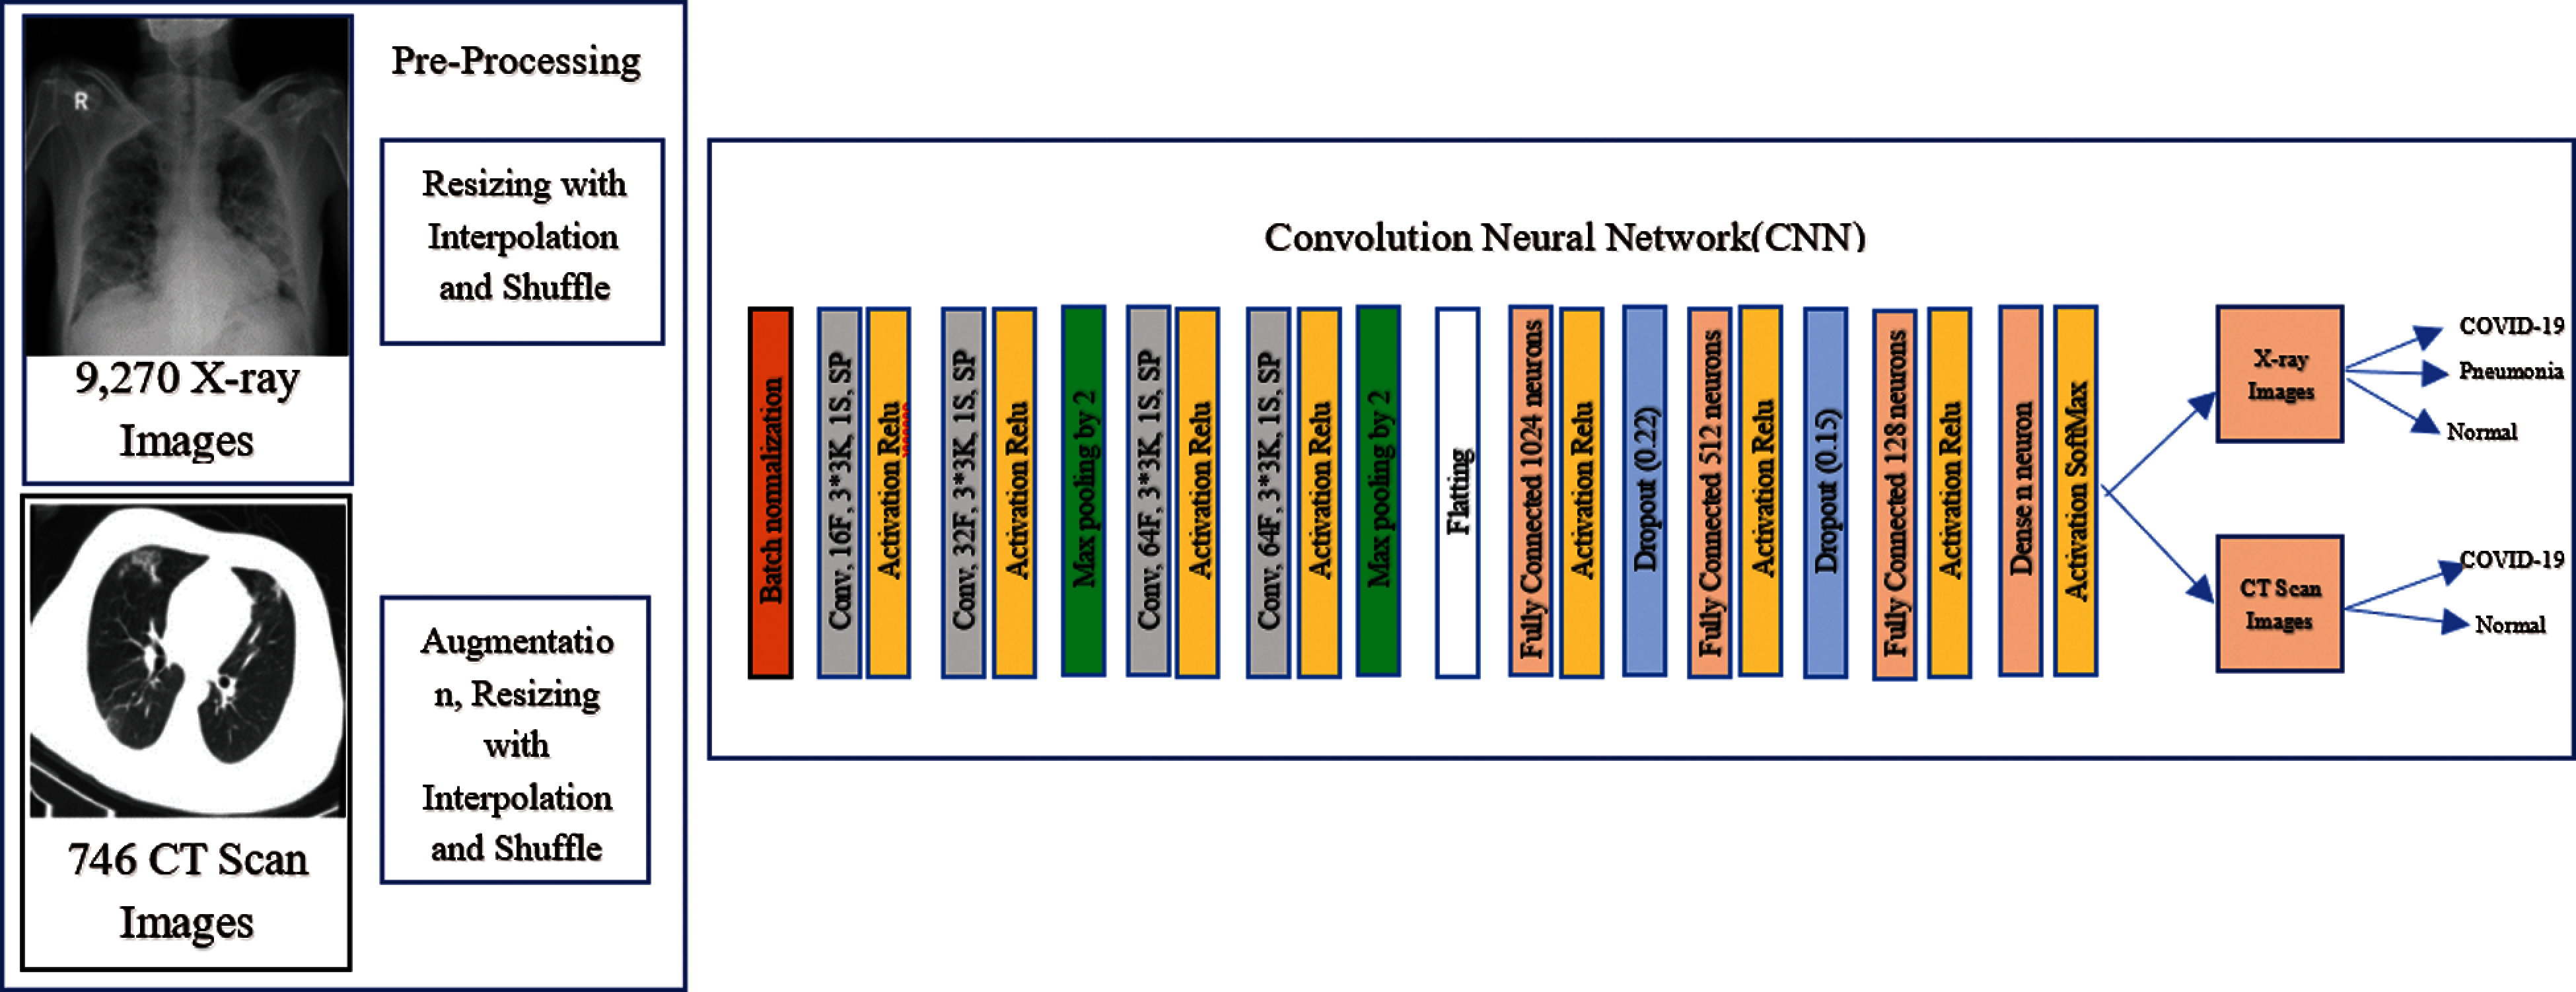
Figure 3: The structure of the FCNN classification network
Transfer learning and FCNN models are independently designed, trained, and used in the binary and multi-class classification performed on chest CT and X-ray datasets. Then, the convolution autoencoder network was designed to extract features from the images and reconstruct them and train them, independently. Based on their structure, the convolution autoencoder network, and transfer learning models were used before and after the denoising stage to test the effect of AD on the classification process. Following this step, fine tuning is performed to improve the network performance in noise reduction and feature extraction. The whole network design can be explained as follows:
Step 1: Constructing the transfer learning and FCNN models.
Step 2: Utilization of the cross-entropy loss function to train the transfer learning and FCNN models. The trained weights are then saved.
Step 3: Constructing the denoising autoencoder network.
Step 4: Utilization of the mean square error (MSE) loss function to train the AD. The trained weights are then saved.
Step 5: Reusing transfer learning and FCNN after AD.
Step 6: Reorganizing the denoising autoencoding network, transfer learning, and FCNN to construct the composite network (CADTra).
Step 7: Keeping the weights of the denoising autoencoding network unchanged in the image denoising process. The trained weights are then saved and used as input for transfer learning and FCNN.
Step 8: Fine tuning of all overall network parameters, based on the weights of the denoising autoencoding network and transfer learning. The final proposed model (CADTra) is then saved.
The above-mentioned network, which has been trained and whose weights have been maintained, is used to adjust the whole network. The complex network parameters to obtain a more accurate performance and higher efficiency have been designed and tested.
4 Experimental Results and Comparative Analysis
To accurately evaluate the performance of the proposed model, we obtained a total of 9201 X-ray images and 2762 CT images. The datasets are available through the links in [36–39]. The X-ray images have three categories, and each category contains several images (1161 COVID-19 images, 4240 pneumonia images, and 3800 normal images). The CT images have two categories, and each category contains 1305 COVID-19 and 1457 normal images that are available publicly. These datasets have been compiled by various platforms and sources. It is noticeable that the dataset of X-ray images has images of different sizes, meaning that it is not balanced. We find that the images of COVID-19 represent 12.5% of the total number of images, while both pneumonia and normal images represent 46.1% and 41.4% of the total number of images, respectively. This may lead to the occurrence of overfitting. In order to avoid this problem, dropout layers are adopted in the proposed model. On the other hand, we find that the numbers of CT images in the two categories are close to each other, which means that the dataset is balanced. In this research, the dataset was divided with different proportions for training and testing, which are [80%:20%], [70%:30%], and [60%:40%]. The images were randomly selected to ensure that the proposed model works with high efficiency with different ratios.
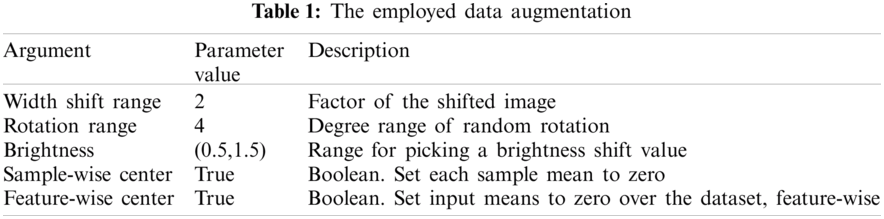
One of the distinguishing factors for obtaining a good classification performance is the dataset used. We notice that the dataset depends heavily on the number of images. We find that the CT datasets are small in size, and this may cause over fitting. An augmentation process was made on the CT dataset to avoid this problem, as shown in Tab. 1. This includes transitions and changes that occur in the images, such as changes in the image width and image rotation. Moreover, the range of brightness and application of augmentation for each part of slice on the digital images were investigated appropriately for each training sample.
Binary and multi-class classification depend on a set of publicly available image datasets (Chest X-ray and CT datasets). The size of the dataset images was changed to 224 × 224 pixels to train the model. We set different batch sizes with different numbers of epochs. Samples for training are assigned and validated according to different ratios. To obtain accurate results, the Adam's optimizer is used in both classification model and CNN autoencoder denoising. We used β1 = 0.9, β2 = 0.999 for optimization in the classification model, and β1 = 0.5, β2 = 0.999 in the autoencoder denoising algorithm. The adaptive learning rate (LR) was set to 0. 00001 for all CNN classification models. It was decreased by 0.5 for each 2 epochs to control loss and validation loss. Early stopping is adopted for 4 epochs for validation loss to obtain lower loss and higher accuracy. The LR is set to 0.0002 for the autoencoder algorithm to decrease noise. Epsilon is used with a value of 10−8. Shuffle is true and verbose has a value of 1. Due to using normalization for medical images from 0 to 1, we used ReLU as an activation function in all layers and softmax for the output layer. After tuning of all hyperparameters, FCNN and CNN models achieved excellent performance in the classification of chest CT and X-ray images. The development and design of the proposed models are carried out using GPU machines for implementation, and the proposed structures are carried out using a Kaggle that offers free access to NVIDIA TESLA P100 GPUs for notebook editors and 13 GB of RAM running on a Professional Windows Microsoft 10 (64-bit). Python 3.7 is used for simulation testing, and TensorFlow and Keras are used as the DL backend.
To evaluate the proposed CAD and transfer learning models used in performing classification of the datasets (chest X-ray and CT images) and to determine the type of disease, we performed a study of the AD effect on the model before and after its use. To ascertain the strength of the model, we segmented the dataset into different proportions for training and testing (80%:20%), (70%:30%), and (60%:40%), successively. Since the proposed model (CADTra) is a model for feature learning classification, the output was tested and compared to those of the models that involve the automated extraction of features. The suggested model outperforms all other models, as per the experimental findings. The models were evaluated by calculating accuracy, loss, precision [40], recall [40], f1-score [40], log loss [41], confusion matrix, precision and recall curve, and ROC curve. The denoising autoencoder model was also evaluated based on SSIM and PSNR [42]. These parameters are defined as follows:
where TN is the true negative, TP is the true positive, FN is the false negative, and FP is the false positive.
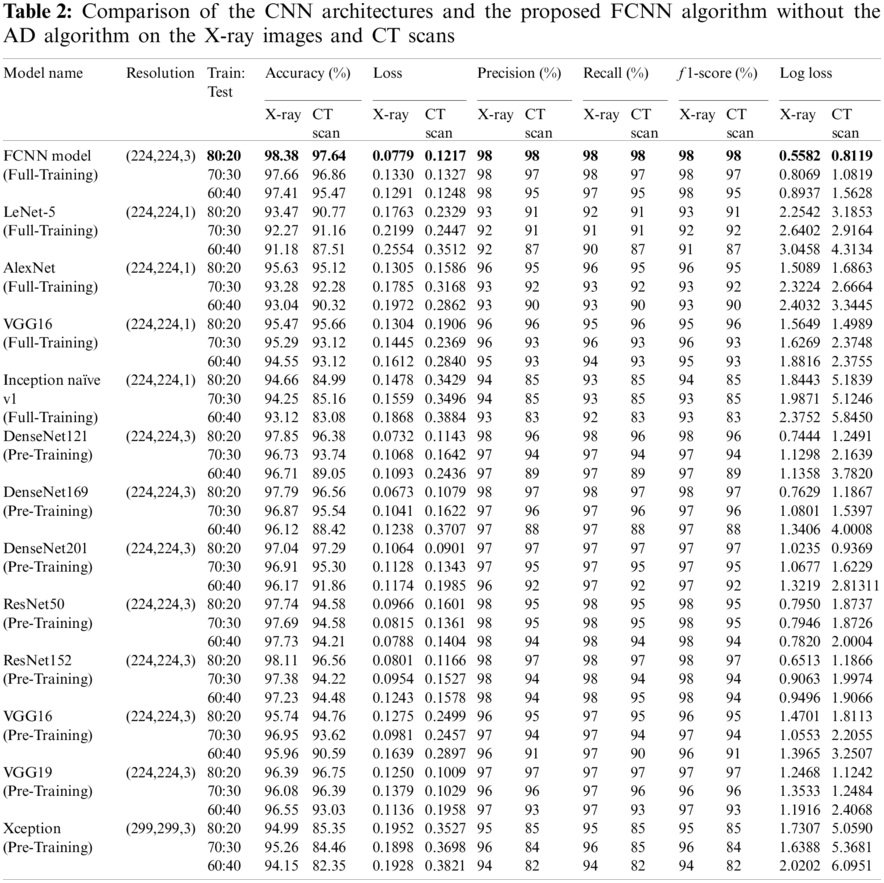
The performance and results of the proposed model, using CNN and transfer learning, were evaluated before and after using the AD to illustrate how it affects the results. The proposed model and the other transfer learning models showed better performance with AD, as shown in Tabs. 2 and 3. The FCNN model achieved average accuracy scores of 98.38% for X-ray images and 97.64% for CT images without the denoising autoencoder. For transfer learning, AlexNet with full training yields 95.63% on X-ray images and 95.12% on CT images. LeNet-5 with full training yields 93.47% on X-ray images and 90.77% on CT images, VGG16 with full training yields 95.47% on X-ray images and 95.66% on CT images, Inception Naïve V1 with full-training yields 94.66% on X-ray images and 84.99% on CT images, DenseNet121 with pre-training yields 97.85% on X-ray images and 96.38% on CT images, DenseNet169 with pre-training yields 97.79% on X-ray images and 96.56% on CT images, DenseNet201 with pre-training yields 97.04% on X-ray images and 97.29% on CT images, ResNet50 with pre-training yields 97.74% on X-ray images and 94.58% on CT images, ResNet152 with pre-training yields 98.11% on X-ray images and 96.56% on CT images, VGG16 with pre-training yields 95.74% on X-ray images and 94.76% on CT images, VGG19 with pre-training yields 96.39% on X-ray images and 96.75% on CT images, and Xception with pre-training yields 94.99% on X-ray images and 85.35% on CT images without the denoising autoencoder.
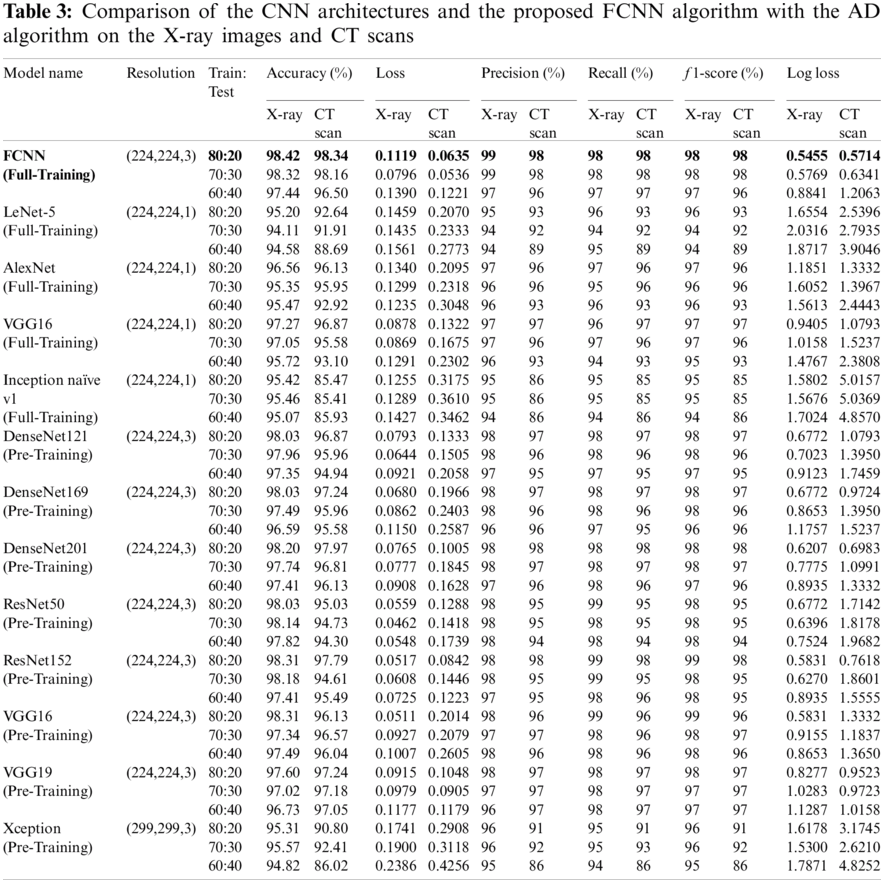
The use of AD to reduce noise and display important characteristics in medical images has achieved great success in enhancing the performance of the models, as shown in Tab. 3. The proposed FCNN model has achieved an average accuracy score of 98.42% on X-ray images and 98.34% on CT images. AlexNet with full training yields 96.56% on X-ray images and 96.13% on CT images, LeNet-5 with full training yields 95.20% on X-ray images and 92.64% on CT images, VGG16 with full training yields 97.27% on X-ray images and 96.87% on CT images, Inception Naïve V1 with full training yields 95.42% on X-ray images and 85.47% on CT images, DenseNet121 with pre-training yields 98.03% on X-ray images and 96.87% on CT images, DenseNet169 with pre-training yields 98.03% on X-ray images and 97.24% on CT images, DenseNet201 with pre-training yields 98.20% on X-ray images and 97.97% on CT images, ResNet50 with pre-training yields 98.03% on X-ray images and 95.03% on CT images, ResNet152 with pre-training yields 98.31% on X-ray images and 97.79% on CT images, VGG16 with pre-training yields 98.31% on X-ray images and 96.13% on CT images, VGG19 with pre-training yields 97.60% on X-ray images and 97.24% on CT images, and Xception with pre-training yields 95.31% on X-ray images and 90.80% on CT images.
In general, the use of AD helps to increase the efficiency and performance of the models. These results represent the culmination of accuracy, loss, precision, recall, f1-score, log loss, confusion matrix, accuracy and loss curve, precision and recall curve, and ROC curve. The denoising autoencoder model has also been evaluated to reduce the noise with different types (Gaussian, salt and pepper, and speckle) and different variances, including 0.05, 0.10, 0.15, 0.20, and 0.25. The AD was also evaluated by calculating SSIM and PSNR, as shown in Tab. 5. It was found that Gaussian noise is the most severe type of noise.
4.5.1 Classification Results of the FCNN Model and Transfer Learning Architectures Without the AD Model
Tab. 2 displays the parameters used in evaluating the FCNN model and transfer learning models in X-ray images and CT scans without AD, which are accuracy, loss, precision, recall, f1-score, and log loss with different ratios of training and testing [80%:20%], [70%:30%], and [60%:40%]. The FCNN model gives the best results, while the LeNet-5 with full training achieves the worst results on X-ray images, while Inception naïve v1 with full training achieves the worst results on CT images.
4.5.2 Classification Results of the CADTra Model and Transfer Learning Architectures with the AD Model
According to Tab. 3, the parameters used in evaluating the proposed FCNN and transfer learning models on X-Ray and CT images with AD, which are accuracy, loss, precision, recall, f1-score, and log loss with different ratios of training and testing [80%:20%], [70%:30%], and [60%:40%]. The FCNN model gives the best results, while LeNet-5 (Full-Training) gives the worst results on X-ray images, and Inception naïve v1 (Full-Training) achieves the worst result on CT images.
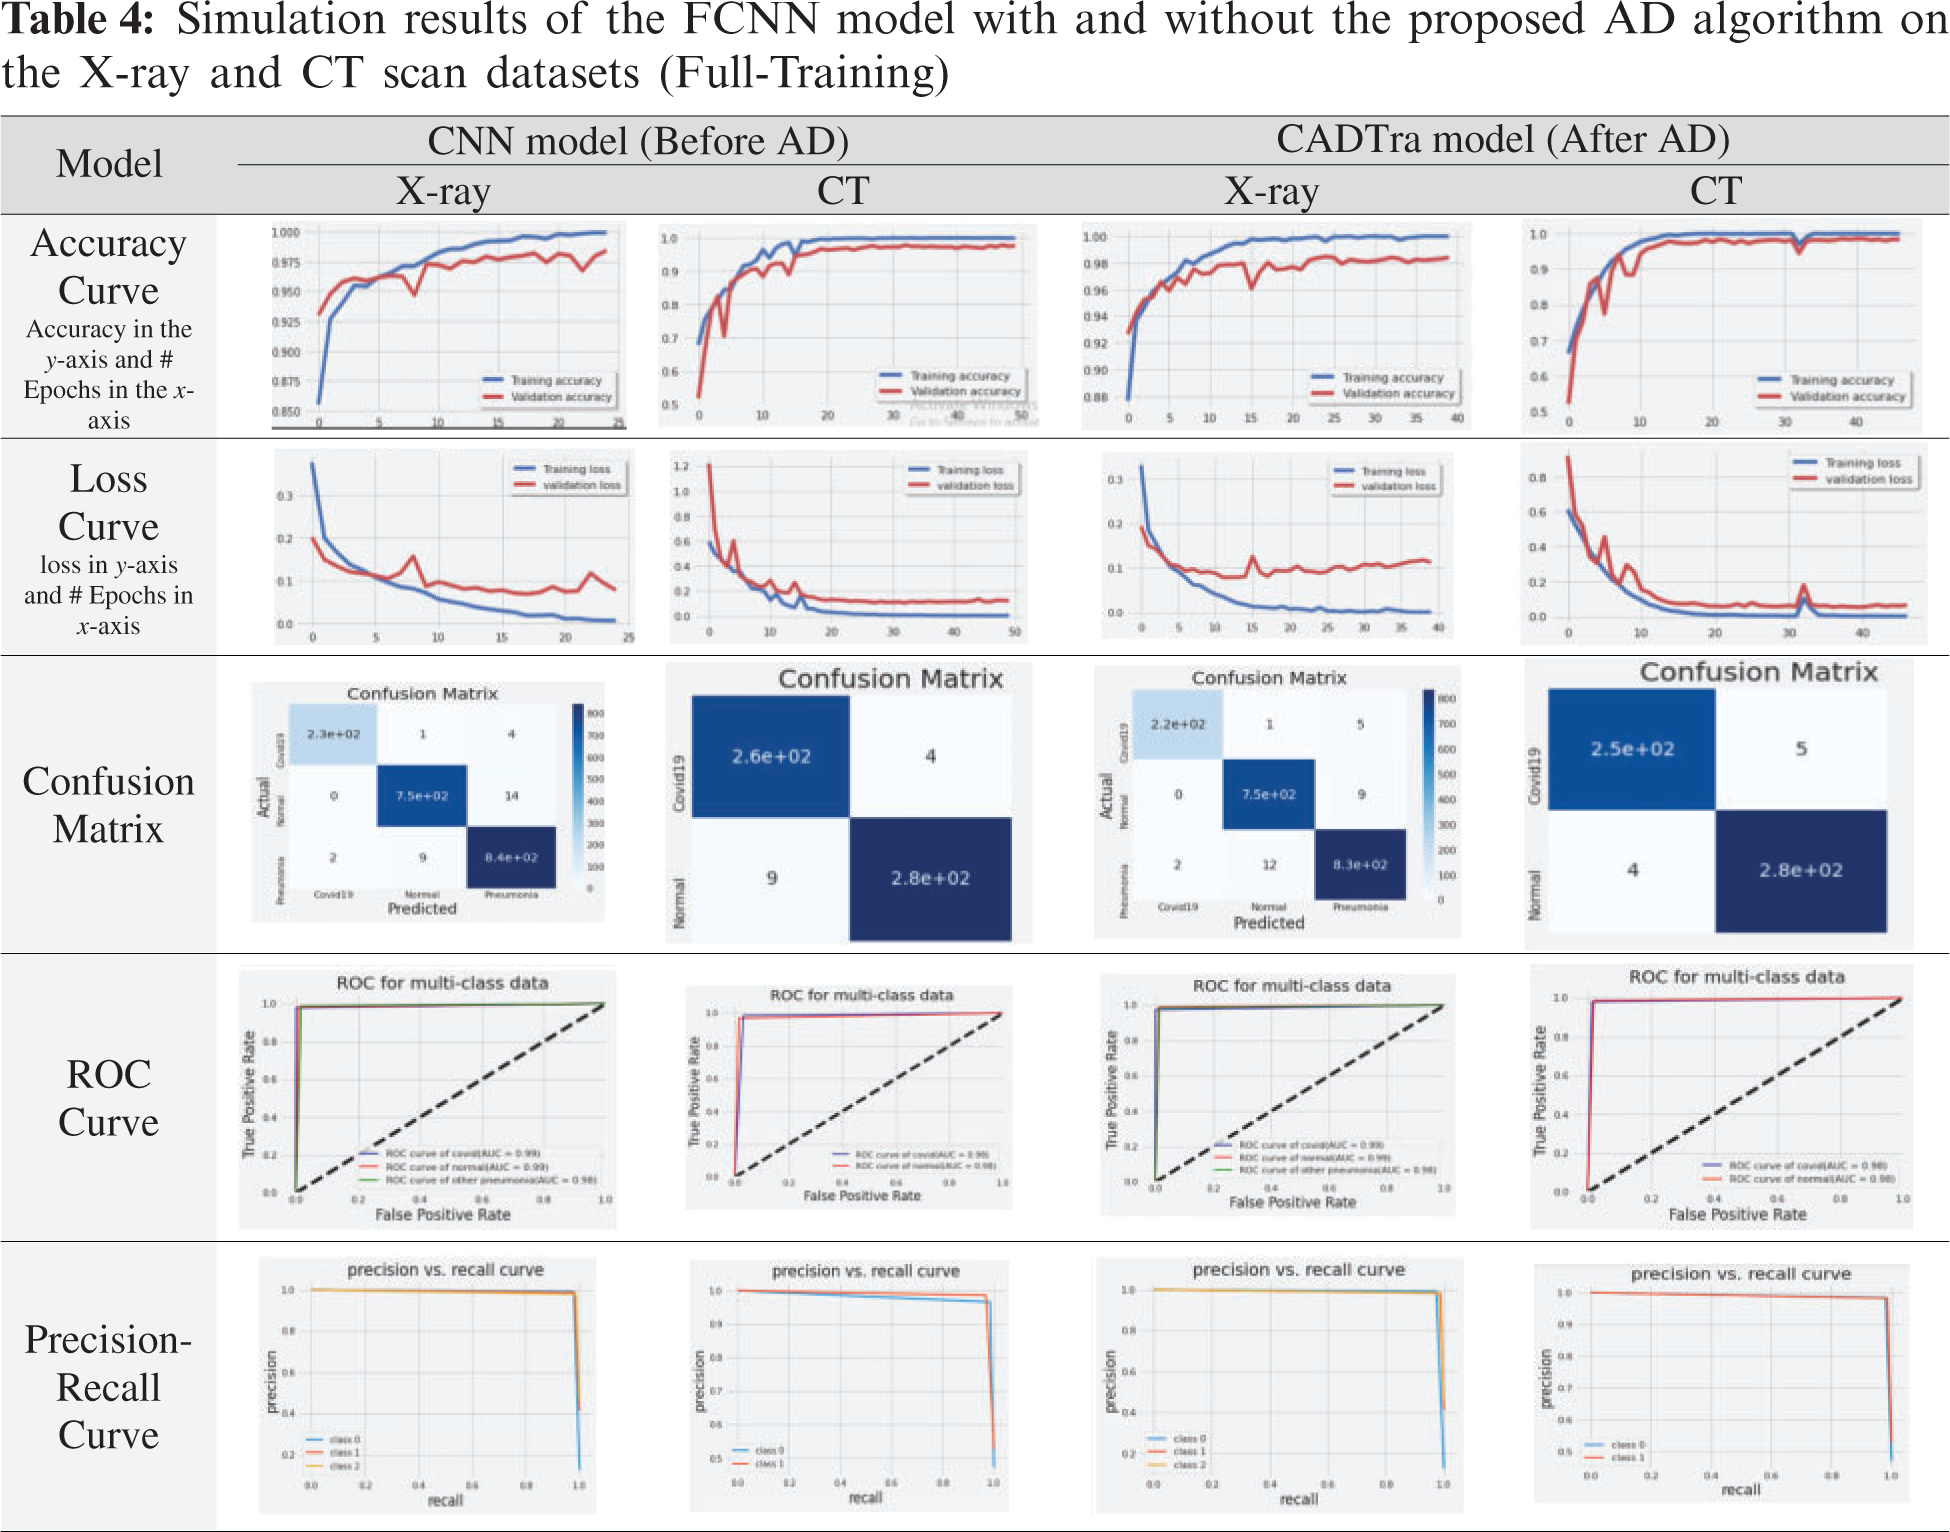
In Tab. 4, simulation results of the proposed model using CNN on X-Ray and CT datasets with and without AD are presented using different evaluation metrics, including the confusion matrix, accuracy and loss curves, precision, and recall curves, and ROC curve. These results demonstrate the superior effect of AD in enhancing the efficiency of CNNs in the classification and diagnosis processes.
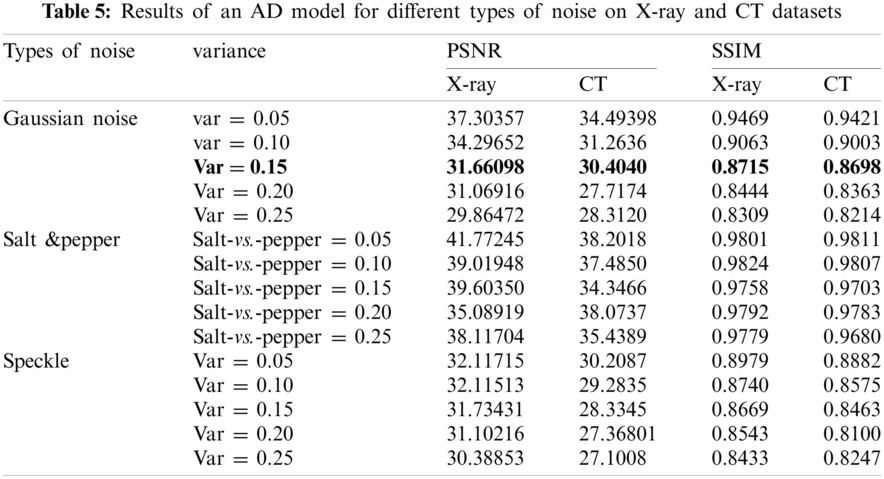
4.5.3 Denoising Results with the AD Model for Different Noise Variances
Tab. 5 shows the results of an AD model on X-Ray and CT datasets, and this is represented by calculating PSNR and SSIM according to Eqs. (9) and (10) for different types of noise (Gaussian, Salt &Pepper, and Speckle noise) using different factors for each type including 0.05, 0.10, 0.15, 0.20, 0.25, respectively.
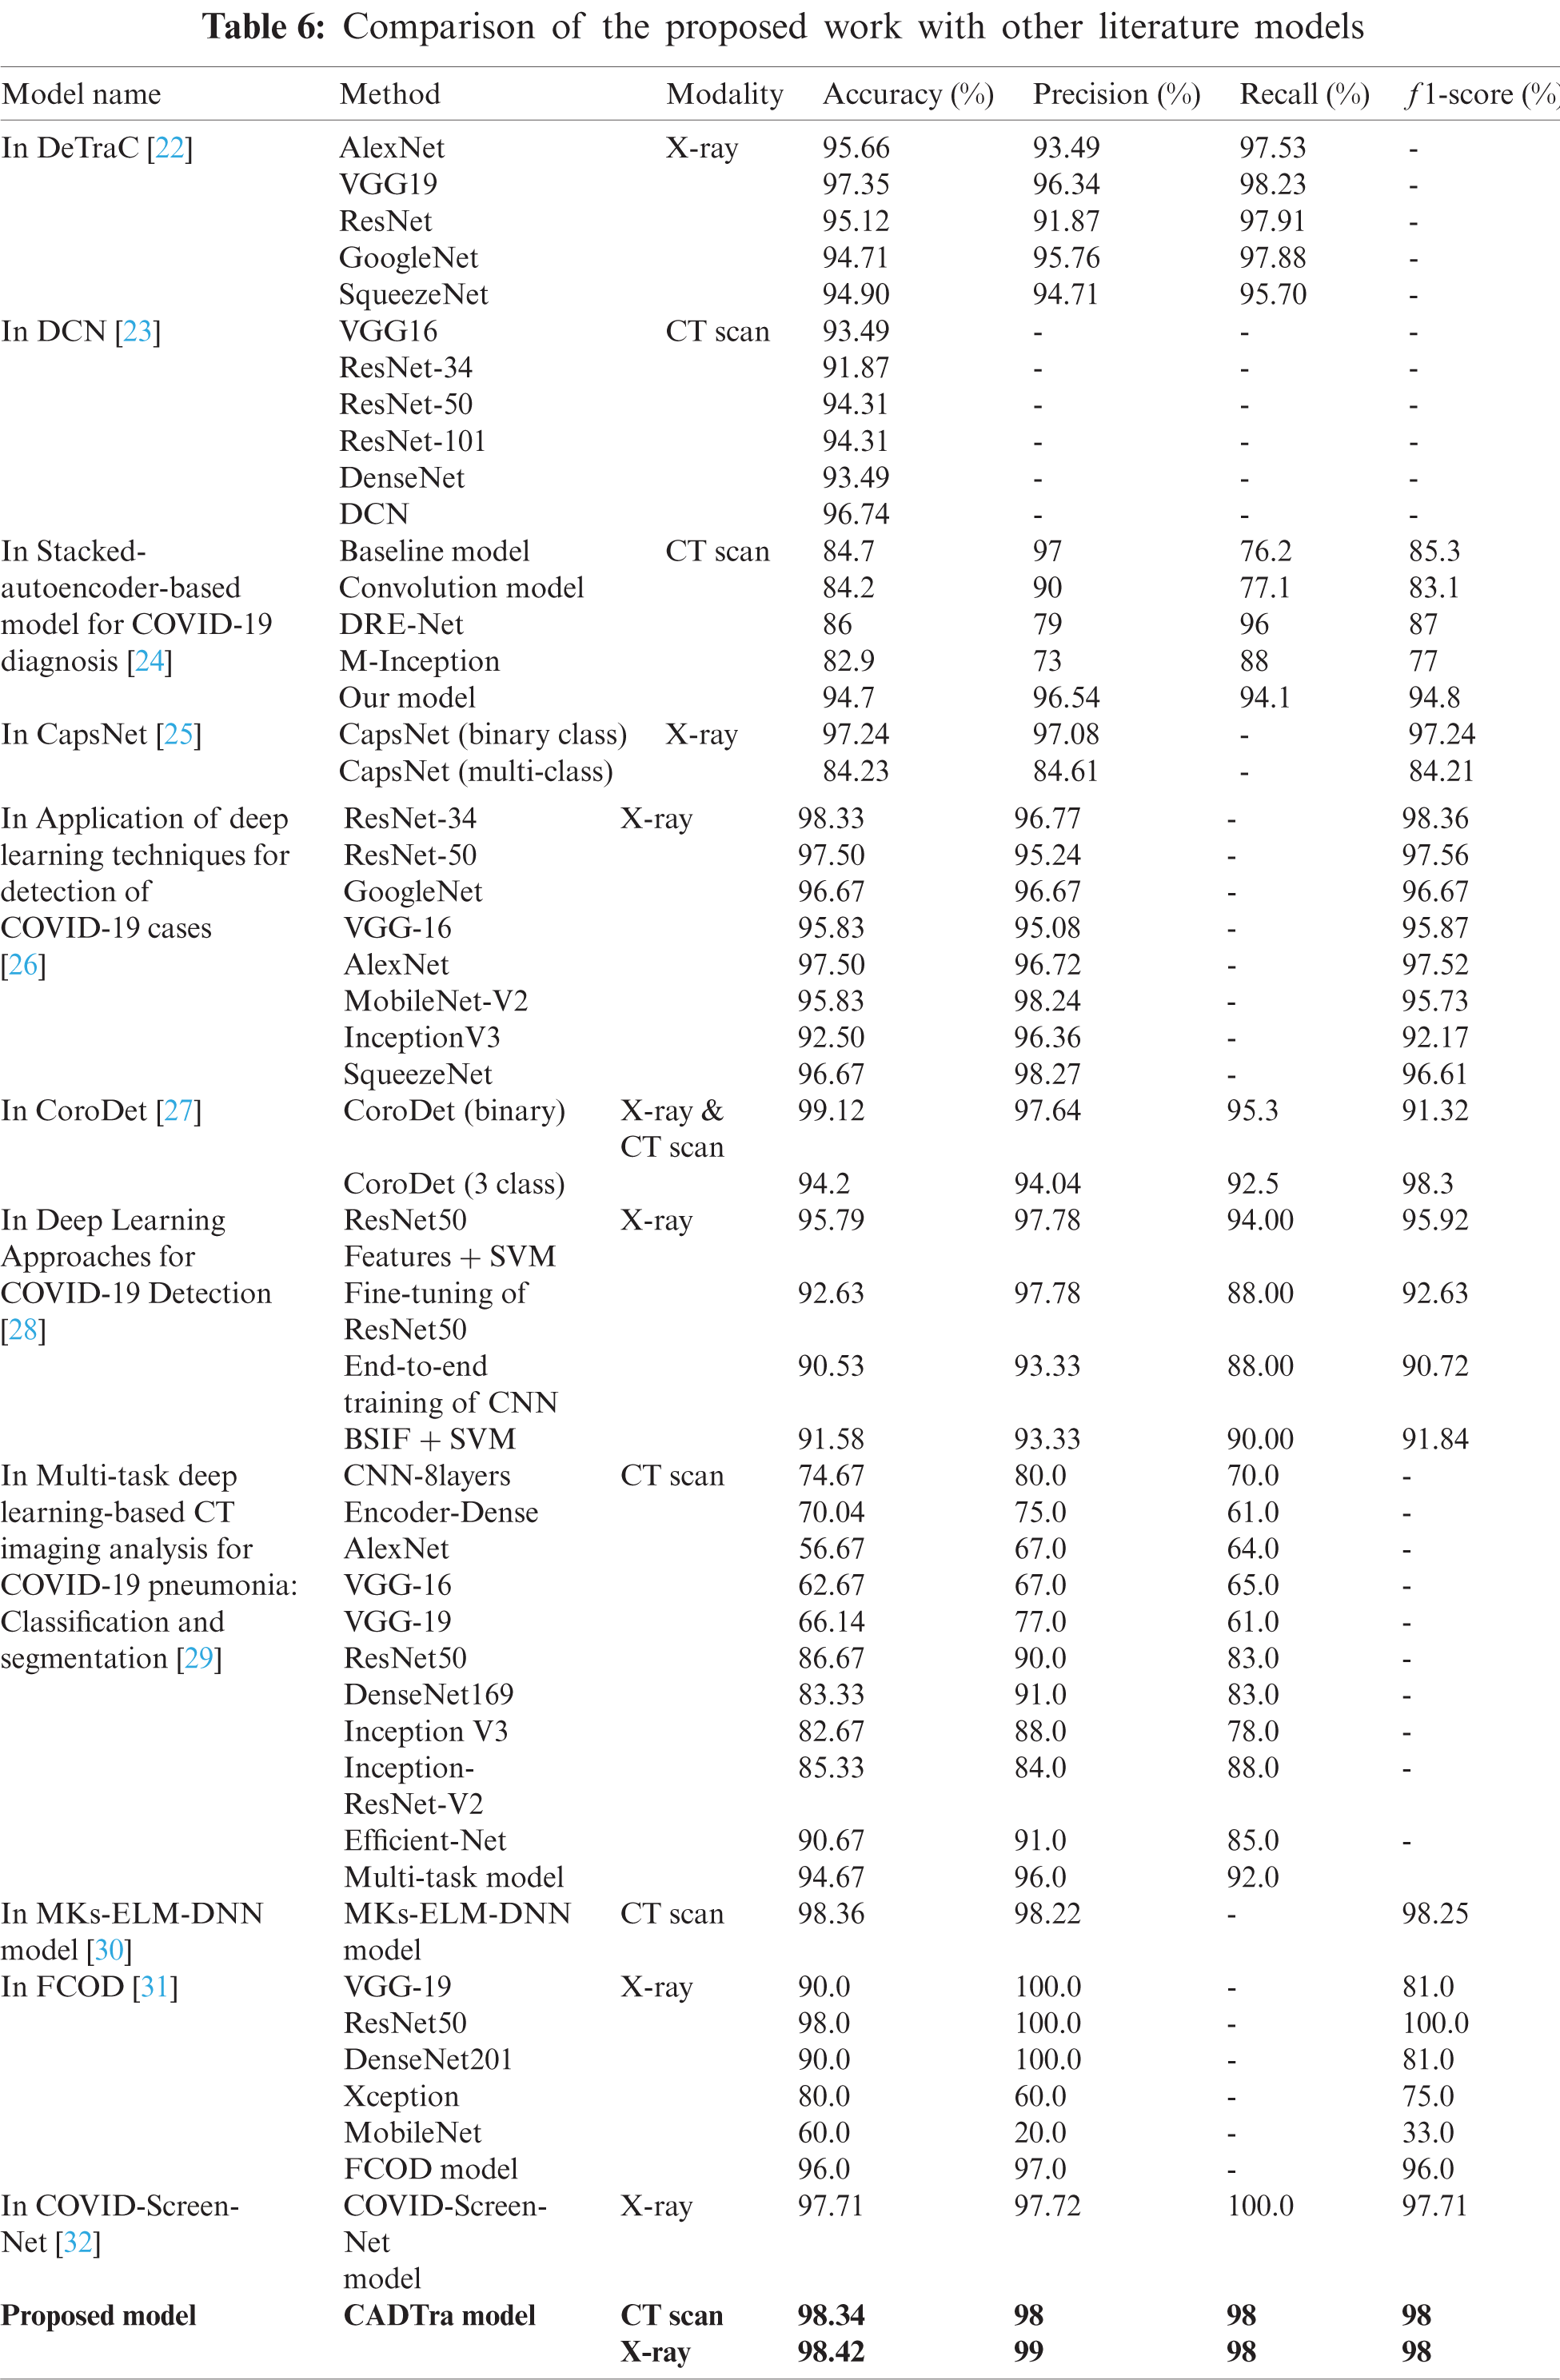
From the previous tables without using AD, the FCNN and transfer learning models showed satisfactory results regarding the use of CNNs in building an automatic model that works to detect and diagnose pneumonia and COVID-19, as shown in Tab. 2. Then, we used AD in the process of feature extraction from medical images and noise reduction. Tab. 5 illustrates the evaluation metrics. These results ensure the distinct performance of the CADTra model with AD and transfer learning. Then, we compared the proposed model with the recent models that work on CT and X-ray datasets. Our work outperforms these models, as shown in Tab. 6.
In this work, we presented a method (CADTra) depending on autoencoder denoising for the early and rapid detection of lung infections to determine the type of disease, using a CNN on datasets of medical images (X-ray and CT). The proposed method has been implemented on FCNN and 12 deep learning architectures, namely AlexNet (full training), LeNet-5 (full training), VGG16 (full training), Inception (Naïve) V1 (full training), DenseNet121 (pre-training), DenseNet169 (pre-training), DenseNet201 (pre-training), ResNet50 (pre-training), ResNet152 (pre-training), VGG16 (pre-training), VGG19 (pre-training), and Xception (pre-training). We performed a comparison with traditional deep learning models for the detection and identification of pneumonia and COVID-19 diseases. The models were evaluated, based on different evaluation metrics, including accuracy, loss, precision, recall, f1-score, log loss, confusion matrix, precision and recall curve, and ROC curve. The experiments were conducted on a chest X-ray dataset, which contains 9,201 images, and a CT dataset containing 2,762 images. X-ray images consist of 1,161 COVID-19 positive images, 4,240 pneumonia-positive images, and 3,800 normal images. For CT images, they were divided into two categories: 1,305 COVID-19-positive images and 1,457 normal images. The proposed model achieved high performance in binary and multi-class classification. In the future research work, we will look at developing and improving the classification model on more datasets and using more in-depth features. Examples include the use of generative adversarial networks (GAN) in super-resolution, after the process of denoising using an autoencoder, which may help to improve the classification performance.
Acknowledgement: The authors would like to thank the support of the Deanship of Scientific Research at Princess Nourah bint Abdulrahman University.
Funding Statement: This research was funded by the Deanship of Scientific Research at Princess Nourah Bint Abdulrahman University through the Fast-track Research Funding Program.
Conflicts of Interest: The authors declare that they have no conflicts of interest to report regarding the present study.
1. T. Ai, Z. Yang, H. Hou, C. Zhan, C. Chen et al., “Correlation of chest CT and RT-pCR testing for coronavirus disease 2019 (COVID-19) in China: A report of 1014 cases,” Radiology, vol. 296, no. 2, pp. E32–E40, 2020. [Google Scholar]
2. M. Y. Ng, E. Y. Lee, J. Yang, F. Li, X. Yang et al., “Imaging profile of the COVID-19 infection: Radiologic findings and literature review,” Radiology, vol. 2, no. 1, pp. E1–E20, 2020. [Google Scholar]
3. W. Wang, Y. Xu, R. Gao, R. Lu, K. Han et al., “Detection of SARS-coV-2 in different types of clinical specimens,” Jama, vol. 323, no. 18, pp. 1843–1844, 2020. [Google Scholar]
4. Y. Fang, H. Zhang, J. Xie, M. Lin, L. Ying et al., “Sensitivity of chest CT for COVID-19: Comparison to RT-pCR,” Radiology, vol. 296, no. 2, pp. E115–E117, 2020. [Google Scholar]
5. C. Huang, Y. Wang, X. Li, L. Ren, J. Zhao et al., “Clinical features of patients infected with 2019 novel coronavirus in wuhan, China,” The Lancet, vol. 395, no. 10223, pp. 497–506, 2020. [Google Scholar]
6. C. Xing, L. Ma and X. Yang, “Stacked denoise autoencoder-based feature extraction and classification for hyperspectral images,” Journal of Sensors, vol. 2016, no. 5, pp. 1–17, 2016. [Google Scholar]
7. H. Sallay, S. Bourouis and N. Bouguila, “Online learning of finite and infinite gamma mixture models for COVID-19 detection in medical images,” Computers, vol. 10, no. 1, pp. 6–19, 2021. [Google Scholar]
8. S. Varela-Santos and P. Melin, “A new approach for classifying coronavirus COVID-19 based on its manifestation on chest X-rays using texture features and neural networks,” Information Sciences, vol. 545, no. 7, pp. 403–414, 2021. [Google Scholar]
9. A. Abbas, M. M. Abdelsamea and M. M. Gaber, “Detrac: Transfer learning of class decomposed medical images in convolutional neural networks,” IEEE Access, vol. 8, pp. 74901–74913, 2020. [Google Scholar]
10. A. Krizhevsky, I. Sutskever and G. E. Hinton, “Imagenet classification with deep convolutional neural networks,” Advances in Neural Information Processing Systems, vol. 25, no. 3, pp. 1097–1105, 2012. [Google Scholar]
11. G. Hinton, L. Deng, D. Yu, G. E. Dahl, A. R. Mohamed et al., “Deep neural networks for acoustic modeling in speech recognition: The shared views of four research groups,” IEEE Signal Processing Magazine, vol. 29, no. 6, pp. 82–97, 2012. [Google Scholar]
12. X. Glorot, A. Bordes and Y. Bengio, “Deep sparse rectifier neural networks,” in Proc. of the Fourteenth Int. Conf. on Artificial Intelligence and Statistics, Montréal, QC, Canada, pp. 315–323, 2011. [Google Scholar]
13. P. Vincent, H. Larochelle, Y. Bengio and P. A. Manzagol, “Extracting and composing robust features with denoising autoencoders,” in Proc. of the 25th Int. Conf. on Machine Learning, New York, United States, pp. 1096–1103, 2008. [Google Scholar]
14. P. Vincent, H. Larochelle, I. Lajoie, Y. Bengio, P. A. Manzagol et al., “Stacked denoising autoencoders: Learning useful representations in a deep network with a local denoising criterion,” Journal of Machine Learning Research, vol. 11, no. 12, pp. 3371–3408, 2010. [Google Scholar]
15. A. Krizhevsky, I. Sutskever and G. E. Hinton, “Imagenet classification with deep convolutional neural networks,” Communications of the ACM, vol. 60, no. 6, pp. 84–90, 2017. [Google Scholar]
16. Y. LeCun, P. Haffner, L. Bottou and Y. Bengio, “Object recognition with gradient-based learning in shape, contour and grouping in computer vision,” Shape, Contour and Grouping in Computer Vision, Springer, Berlin, Heidelberg, vol. 5, pp. 319–345, 1999. [Google Scholar]
17. K. Simonyan and A. Zisserman, “Very deep convolutional networks for large-scale image recognition,” Multimedia Tools and Applications, vol. 6, pp. 1409–1556, 2014. [Google Scholar]
18. C. Szegedy, W. Liu, Y. Jia, P. Sermanet, S. Reed et al., “Going deeper with convolutions,” in Proc. of the IEEE Conf. on Computer Vision and Pattern Recognition (CVPRBoston, MA, USA, pp. 1–9, 2015. [Google Scholar]
19. G. Huang, Z. Liu, L. Van Der Maaten and K. WeinbergerQ, “Densely connected convolutional networks,” in Proc. of the IEEE Conf. on Computer Vision and Pattern Recognition (CVPRHonolulu, HI, USA, pp. 4700–4708, 2017. [Google Scholar]
20. K. He, X. Zhang, S. Ren and J. Sun, “Deep residual learning for image recognition,” in Proc. of the IEEE Conf. on Computer Vision and Pattern Recognition (CVPRLas Vegas, NV, USA, pp. 770–778, 2016. [Google Scholar]
21. F. Chollet “Xception: Deep learning with depthwise separable convolutions,” in Proc. of the IEEE Conference on Computer Vision and Pattern Recognition (CVPRLas vegas, NV, USA, pp. 1251–1258, 2017. [Google Scholar]
22. A. Abbas, M. M. Abdelsamea and M. M. Gaber, “Classification of COVID-19 in chest X-ray images using deTraC deep convolutional neural network,” Applied Intelligence, vol. 51, no. 2, pp. 854–864, 2021. [Google Scholar]
23. K. Gao, J. Su, Z. Jiang, L. L. Zeng, Z. Feng et al., “Dual-branch combination network (DCNTowards accurate diagnosis and lesion segmentation of COVID-19 using CT images,” Medical Image Analysis, vol. 67, no. 10, pp. 1–12, 2021. [Google Scholar]
24. D. Li, Z. Fu and J. Xu, “Stacked-autoencoder-based model for COVID-19 diagnosis on CT images,” Applied Intelligence, vol. 6, no. 2, pp. 1–13, 2020. [Google Scholar]
25. S. Toraman, T. B. Alakus and I. Turkoglu, “Convolutional cabinet: A novel artificial neural network approach to detect COVID-19 disease from X-ray images using capsule networks,” Chaos, Solitons & Fractals, vol. 140, no. 22, pp. 1–23, 2020. [Google Scholar]
26. S. R. Nayak, D. R. Nayak, U. Sinha, V. Arora and R. B. Pachori, “Application of deep learning techniques for detection of COVID-19 cases using chest X-ray images: A comprehensive study,” Biomedical Signal Processing and Control, vol. 64, no. 10, pp. 1–18, 2021. [Google Scholar]
27. E. Hussain, M. Hasan, M. A. Rahman, I. Lee, T. Tamanna et al. “Corodet: A deep learning-based classification for COVID-19 detection using chest X-ray images,” Chaos, Solitons & Fractals, vol. 142, no. 11, pp. 1–17, 2021. [Google Scholar]
28. A. M. Ismael and A. Şengür, “Deep learning approaches for COVID-19 detection based on chest X-ray images,” Expert Systems with Applications, vol. 164, no. 14, pp. 1–16, 2021. [Google Scholar]
29. A. Amyar, R. Modzelewski, H. Li and S. Ruan, “Multi-task deep learning-based CT imaging analysis for COVID-19 pneumonia: Classification and segmentation,” Computers in Biology and Medicine, vol. 126, no. 13, pp. 1–21, 2020. [Google Scholar]
30. M. Turkoglu, “COVID-19 detection system using chest CT images and multiple kernels-extreme learning machine based on deep neural network,” Innovation and Research in BioMedical Engineering, vol. 5, no. 2, pp. 1–15, 2021. [Google Scholar]
31. A. H. Panahi, A. Rafiei and A. Rezaee, “FCOD: Fast COVID-19 detector based on deep learning techniques,” Informatics in Medicine Unlocked, vol. 22, no. 10, pp. 1–14, 2021. [Google Scholar]
32. V. S. Dhaka, G. Rani, M. G. Oza, T. Sharma and A. Misra, “A deep learning model for mass screening of COVID-19,” International Journal of Imaging Systems and Technology, vol. 4, no. 3, pp. 1–22, 2021. [Google Scholar]
33. N. El-Hag, A. Sedik, W. El-Shafai, H. El-Hoseny, A. Khalaf et al., “Classification of retinal images based on convolutional neural network,” Microscopy Research and Technique, vol. 84, no. 3, pp. 394–414, 2021. [Google Scholar]
34. J. Choi, J. K. Rhee and H. Chae, “Cell subtype classification via representation learning based on a denoising autoencoder for single-cell rna sequencing,” IEEE Access, vol. 9, pp. 14540–14548, 2021. [Google Scholar]
35. R. Atienza, “Advanced deep learning with tensorFlow 2 and keras: Apply DL, GANs, VAEs, deep RL, unsupervised learning, object detection and segmentation, and more,” Packt Publishing Ltd., 2020. [Google Scholar]
36. COVID Dataset. [Online]. Available: https://github.com/UCSD-AI4H/COVID-CT [last access on 25–10–2020]. [Google Scholar]
37. W. El-Shafai and F. Abd El-Samie, “Extensive COVID-19 X-Ray and CT chest images dataset,” Mendeley Data, v3, 2020. [Online]. Available: http://dx.doi.org/10.17632/8h65ywd2jr.3. [Google Scholar]
38. COVID Dataset. [Online]. Available: https://www.kaggle.com/paultimothymooney/chest-xray-pneumonia [last access on 25–10-2020]. [Google Scholar]
39. COVID Dataset. [Online]. Available: https://data.mendeley.com/datasets/8h65ywd2jr/1?fbclid=IwZLb04fZMx4CX7fU1B6Ln1Do [last access on 25-10-2020]. [Google Scholar]
40. H. Zhao, Y. Pan and F. Yang, “Research on information extraction of technical documents and construction of domain knowledge graph,” IEEE Access, vol. 8, pp. 168087–168098, 2020. [Google Scholar]
41. J. Jiao, T. A. Courtade, K. Venkat and T. Weissman, “Justification of logarithmic loss via the benefit of side information,” IEEE Transactions on Information Theory, vol. 61, no. 10, pp. 5357–5365, 2015. [Google Scholar]
42. A. Mahmoud, W. El-Shafai, T. Taha, E. El-Rabaie, O. Zahran et al., “A statistical framework for breast tumor classification from ultrasonic images,” Multimedia Tools and Applications, vol. 80, no. 4, pp. 5977–5996, 2021. [Google Scholar]
 | This work is licensed under a Creative Commons Attribution 4.0 International License, which permits unrestricted use, distribution, and reproduction in any medium, provided the original work is properly cited. |