DOI:10.32604/cmc.2022.020093
| Computers, Materials & Continua DOI:10.32604/cmc.2022.020093 | |
| Article |
2D Finite Element Analysis of Asynchronous Machine Influenced Under Power Quality Perturbations
1School of Electrical Engineering, Vellore Institute of Technology, Vellore, India
2School of Computing, SASTRA Deemed University, Thanjavur, India
3Mobility, Logistics, and Automotive Technology Research Centre, Faculty of Engineering, ETEC, Department of Electrical Engineering and Energy Technology, Vrije Universiteit Brussel, Brussel, 1050, Belgium
4Department of Electrical Engineering, College of Engineering, Princess Nourah bint Abdulrahman University, Riyadh, 84428, Saudi Arabia
5Department of Physics, College of Sciences, Princess Nourah bint Abdulrahman University, Riyadh, 11671, Saudi Arabia
*Corresponding Author: Shabana Urooj. E-mail: smurooj@pnu.edu.sa
Received: 08 May 2021; Accepted: 12 July 2021
Abstract: Asynchronous machines are predominantly preferred in industrial sectors for its reliability. Power quality perturbations have a greater impact on industries; among the different power quality events, voltage fluctuations are the most common and that may cause adverse effect on machine's operation since they are longer enduring. The article discusses a numerical technique for evaluating asynchronous motors while taking into account magnetic saturation, losses, leakage flux, and voltage drop. A 2D linear analysis involving a multi-slice time stepping finite element model is used to predict the end effects. As an outcome, the magnetic saturation and losses are estimated using a modified 2D nonlinear time-stepping finite element formulation. The method takes the electromagnetic fields at the ends of the motor into account using limited computer resources. The proposed method will greatly reduce computation time with limited computer resources for analyzing the machine's performance with high precision. The analyzed findings assist in preventing voltage variance issues in the power network system and provide suggestions for developing a robust system.
Keywords: Asynchronous machine; finite element model analysis; voltage variations; power quality; multi-slice model
It is well-known fact that more than 50 percent of global electrical energy is utilized by electrical machines, especially by asynchronous machines. The induction machine is known as asynchronous machine, actually it is a more precise designation. Asynchronous machines are engaged with various industrial applications including, blowers, air conditioning systems, pumps, refrigeration, materials processing and manufacturing sectors. Three-phase asynchronous machines (AM) are widely preferred as they are reliable, robust, self-starting, and require less maintenance. Nevertheless, the power quality problems in grid are inevitable, even in advanced power networks. Hence, most of the industries are influenced by power quality perturbations. IEEE 1159–2019 defined the power quality problems as transients, sag, swell, interruptions, voltage fluctuations, waveform distortion, voltage variations, voltage imbalance and power frequency variations [1]. Among the power quality events, the voltage variations are most frequent, which may cause adverse effect on machine's operation. Although AMs are highly efficient at full load operating conditions, they are highly sensitive to supply voltage variations. When the supply voltage is increased, the magnetic components of the AM are pushed into saturation. These variations in supply voltage could slow down the operation, degrade the machine, even burnout the machine leading to interruption in the process industries. Hence it is vital to investigate the voltage variations on AM [2]. As per the IEEE 1159–2019 Std., Overvoltage and undervoltage are described as a fluctuate in the RMS value of voltage by more than 110 V or less than 90 V for more than one minute at the power frequency. The voltage changes into two categories based on their form and period: under voltage and over voltage differences [3]. These voltage variations, especially over voltage are caused due to incorrect tap settings on transformers, single line to ground fault, and abrupt load deduction. Similarly, the under-voltage is due to sudden loading, system faults, starting of large motors, transformer energization, power system equipment malfunction, severe weather, pollution, and capacitor bank switching off [4]. The three-phase grid voltage variation of a low voltage network is shown in Fig. 1. It can be observed that, the maximum of 465.62 voltage and minimum of 380.56 voltage is recorded in a duration of 7 days.
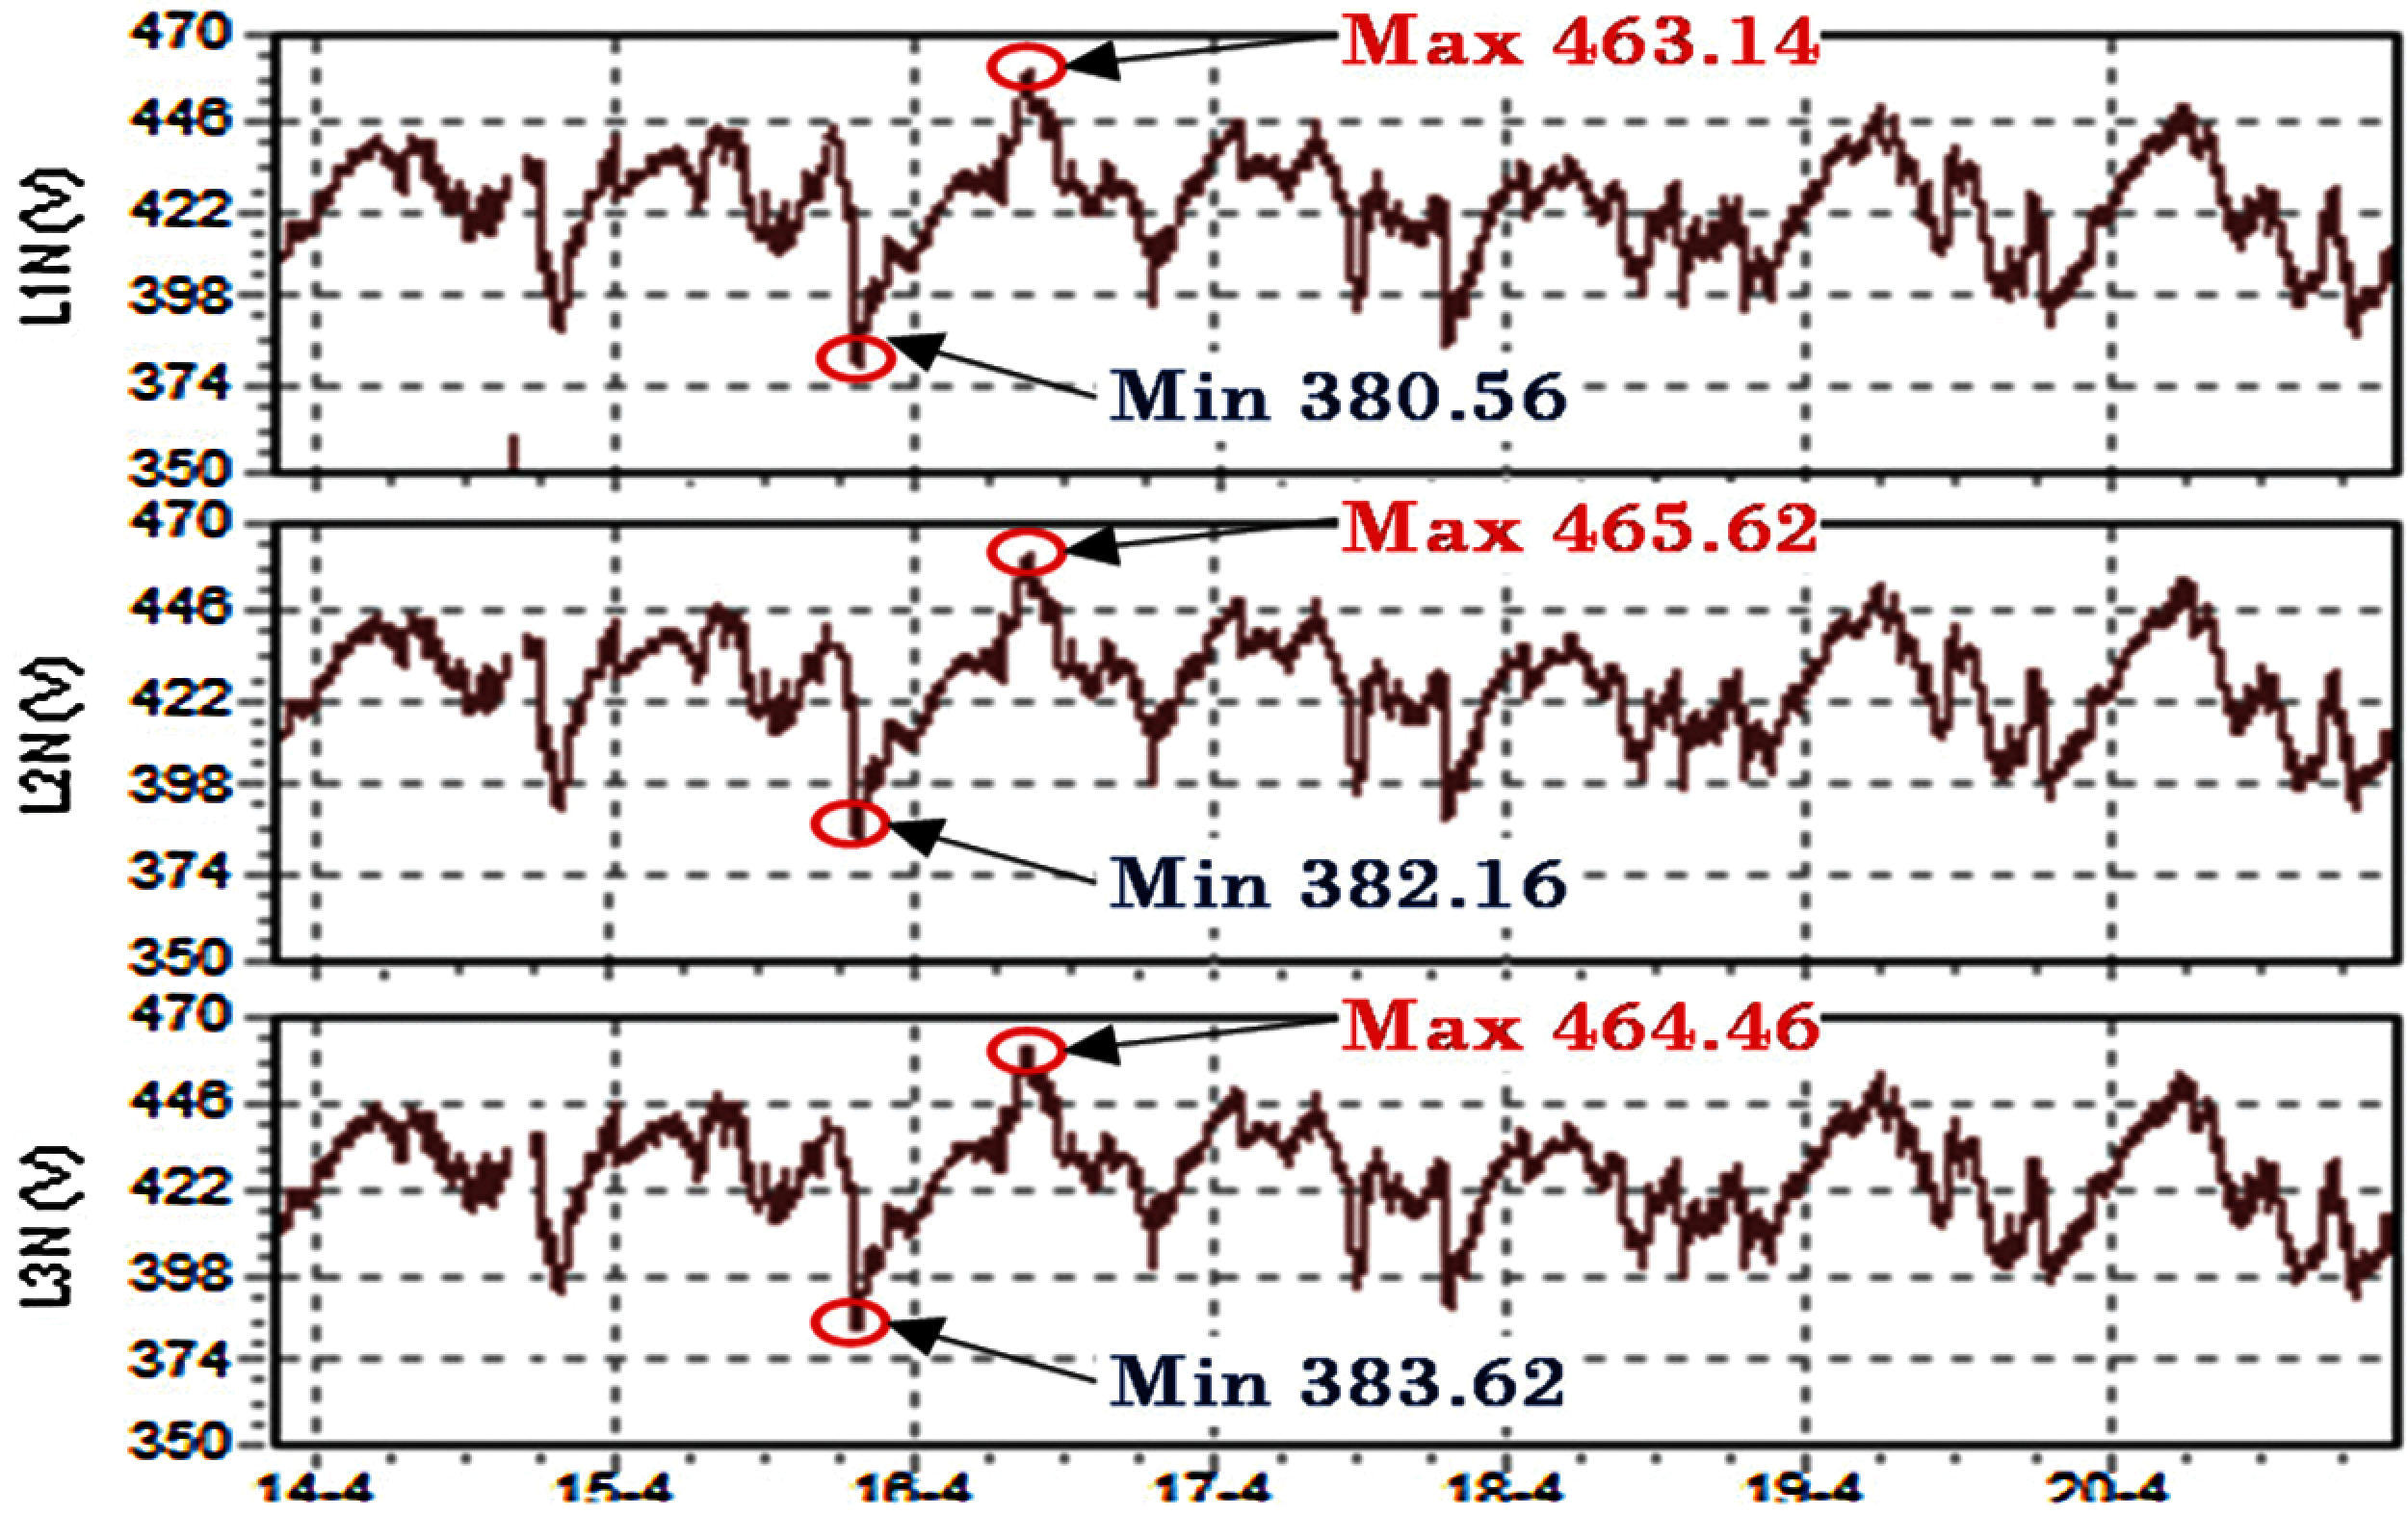
Figure 1: Weekly average three-phase grid voltage profiles
Thus, the performance study of AM under power perturbations becomes more vital. Various types of analysis including magneto-static analysis, time-harmonic analysis, electrostatic analysis, current flow analysis, and thermal stress analysis are performed on AM [5,6]. Automated Finite Element Analysis (FEA) is an efficient tool for analyzing various factors of the machine such as, harmonics of flux linkages, skewed rotor geometries and winding layout. This paper employed finite element model using Motor analysis tool in Matlab environment for detailed analysis of AM. Motor analysis tool is an efficient algorithm for designing and analyzing the AM. The performance and behavior of three phase asynchronous machine under 10 percent over-voltage and under-voltage are analyzed. The parameters such as air gap flux, airgap MMF, magnetic field intensity, iron loss, joule loss, relative permeability, torque, efficiency, power factor, and total losses are studied. Conclusively, a detailed comparative analysis is carried out with abnormal and normal operating conditions. Additionally, through sensitivity analysis the change in critical parameters of the system during voltage variation is identified.
1.1 Problem Overview and Its Significance in the Present Study
The machine's performance is degraded by voltage variations in the electrical grid, and it could trip the system, causing economic loss to industries due to outages. The voltage fluctuation has the potential to affect machine characteristics such as overheating, noise, torque oscillation, vibrations, excessive slip losses, and machine efficiency [1]. The issues with voltage fluctuation are well outlined in this study for developing a dependable system and enhancing driving characteristics. Infusion craters, severe pitting and fluting damage to machine bearings are caused by frequent voltage variations, resulting in a shorter lifespan [7–9]. The machine's thermal stress is increased by the uneven flux distribution in the airgap, which causes overheating of the rotor cage, as well as rotor material abrasion and dynamic stress on the shaft [10]. Asymmetrical operation, pulsing torque, reduced torque, and a decline in machine efficiency result from these losses. The difficulties mentioned above have a greater influence on large and medium industrial machineries. To address these concerns, asynchronous machines are tested using the IEEE 1159–2019 standard, and machine sensitivity is determined using simulation and analytic findings. The test criteria and equipment needed to develop a dependable drive system are clearly outlined in this research. The research contributions are highlighted as follows;
• Performance of asynchronous machines under voltage fluctuation using FEM analysis.
• Two-dimensional FEM analysis of magnetic flux density, iron loss density, joule loss density, and relative permeability as a function of voltage.
• Sensitivity study on asynchronous machines under various voltage circumstances.
• The losses of a textile spinning mill motor subjected to a 10% voltage variation were assessed in a case study.
The article is constructed as; Section 2 deals about generalized magnetic circuit modelling of three phase asynchronous machine with the design parameters. Section 3 describes about the finite element model analysis of 9.2 kW asynchronous machine to explore the magnetic saturation. This section explains how the FEM algorithm works in detail. Section 4 interprets the finite element analysis for a 9.2 kW asynchronous machine and determines its performance under voltage fluctuation. This section also includes a two-dimensional FEM study of magnetic flux density, iron loss density, joule loss density, and relative permeability as a function of voltage. The sensitivity study of asynchronous machines under various voltage circumstances is presented in Section 5. A case study for a textile spinning mill with a 10% voltage fluctuation was developed in Section 6, and their losses were evaluated. Finally, the paper is concluded in Section 7.
2 Magnetic Circuit Modelling of Three-Phase Asynchronous Machine
For the design of asynchronous devices, this session presents a simplified magnetic circuit model. Traditional methods to asynchronous machine design have been used, but they may be inadequately accurate or simplified while taking pole–slot counts into account. As a consequence, the early design stage's layout precision will suffer. Furthermore, since it is hard to ascertain the flux in individual stator teeth, magnetic saturation is often skipped or balanced by correction factors in generalized models. Using the established FEM model, the flux provided by stator winding currents can be measured efficiently and consistently while taking saturation into consideration. The stator side windings are similar with sinusoidally distributed type windings, placed 120° apart, where Ns and Rs are the equivalent turns and resistance of the stator, respectively [6,11]. A typical squirrel-cage asynchronous rotor has vertical bars that are made using copper conductor. To permit current to flow through the system, the bars are fixed to the top and bottom conductive rings. The differing currents in the stator windings generate the spinning magnetic field radially across the rotor. Eddy currents in the vertical bars of the squirrel cage cause it to rotate due to the spinning magnetic field [4]. The rotor and magnetic field rotate at different speeds. Other assumptions for deriving the equations that describe with the uniform airgap and friction is neglected. The flux linkages, as noticed in the voltage equations, can be stated in terms of inductances. Lsr is the magnitude of the mutual inductances between the windings.
The flux linkages can now be stated as
The voltage equations in terms of machine variables referred to the stator winding is given by,
The quantitative accuracy of the air-gap magnetic flux density distribution, however, becomes inadequate when the degree of magnetic saturation by the leakage flux is high [6]. When the motor is driven with a high slip by a grid voltage source, the line current rises many times that of the rated state. Therefore, during high slip operation, the leakage flux should be considered for estimating the motor characteristics. For an instance, motor starting, pull-out torque operation, the large amount of flux leakage occurs in AM. Magnetic saturation due to leakage flux is depicted in Fig. 2 as a magnetic model. This circuit model will account for magnetic saturation caused by leakage flux. This magnetic model is used to measure the constants on the T-type equivalent circuit. When designing induction motors, FEA and algebraic equations research based on the permeance model are used to study the harmonic components of the air-gap flux density distribution [12,13].
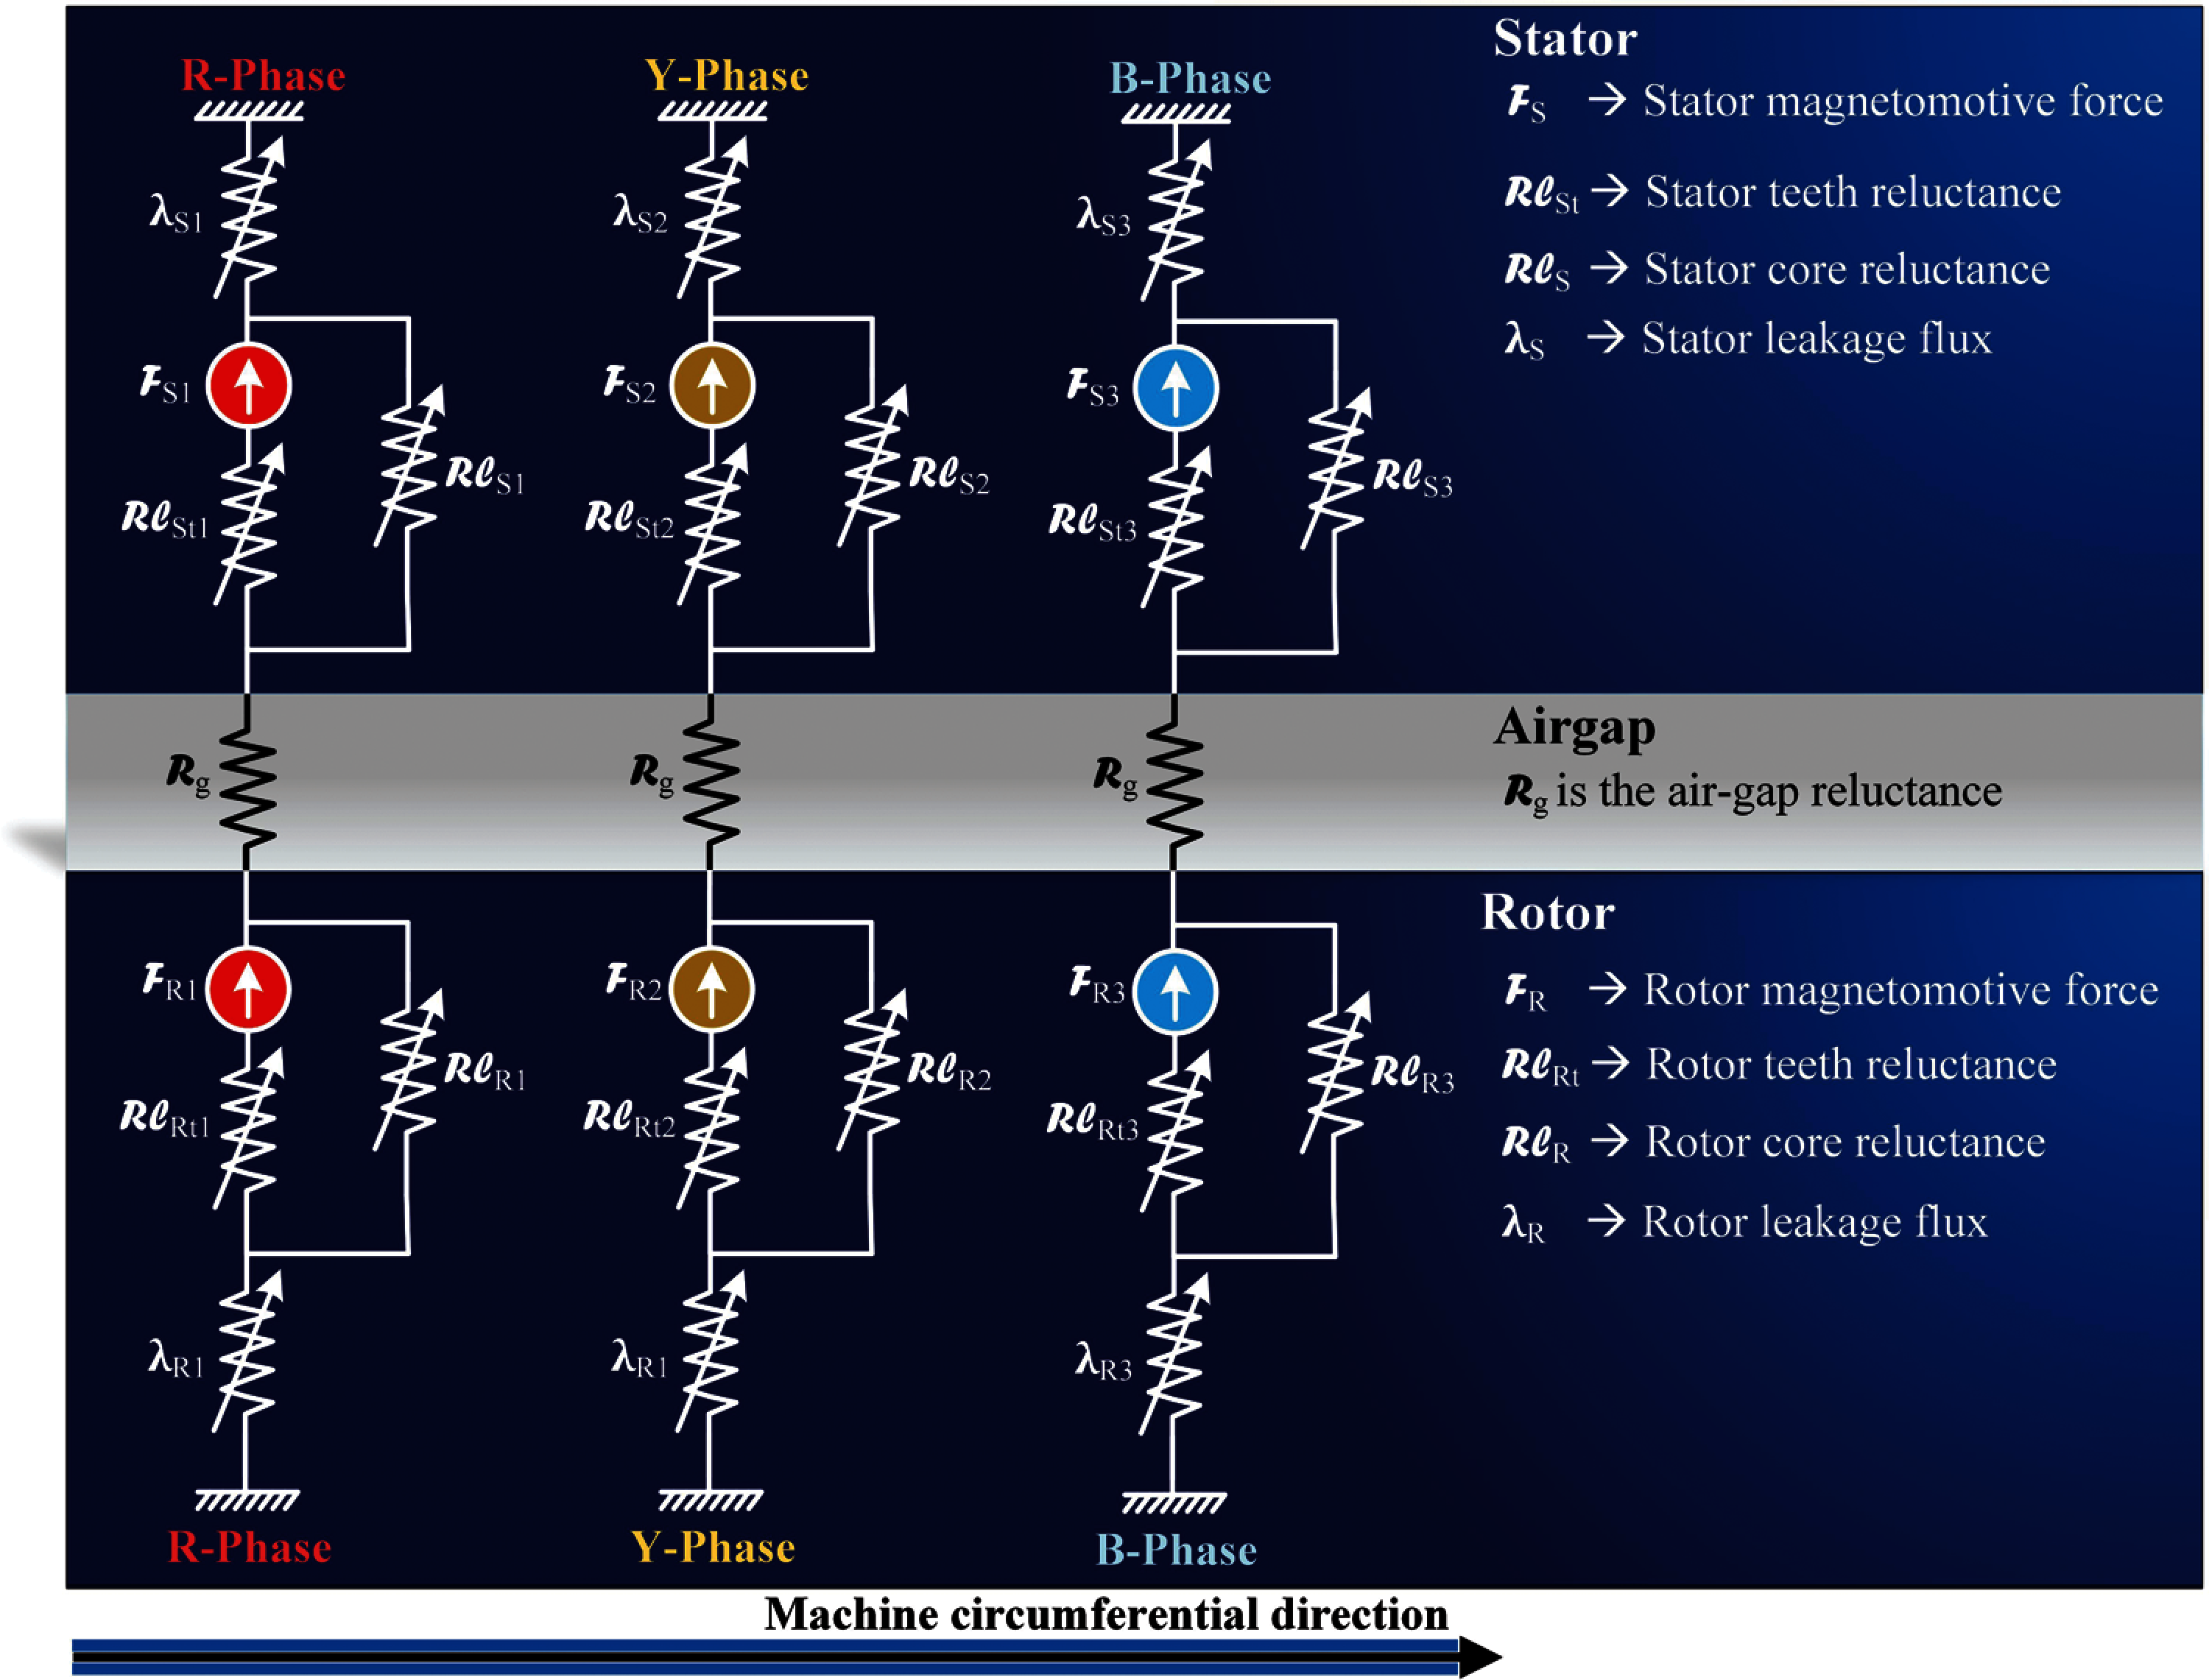
Figure 2: Magnetic circuit modelling of three-phase asynchronous machine
The flux density (B) in air gap is given as
Here, F-MMF and P-Permeance-. The total F is expressed as
Here,
Here, n1-stator turns per phase, fw1-stator fundamental winding factor, g-air-gap length, and kc-carter's coefficient. P-Number of poles, and m-number of phases. Dsc is the inside diameter of stator core, c is the axial length of rotor core and
An electric motor consists of the electrical and mechanical system and requires an equation that couples both.
Here, the number of poles is denoted by P, a moment of inertia is denoted by J, torque linked to the shaft is denoted by TL, and the angular velocity of the rotor is denoted by
3 Finite Element Analysis of Asynchronous Machine
Recently, Finite Element Analysis (FEA) has been mostly used in the machine's analysis and design. To explore the magnetic saturation of 3-phase AM through analyzing the air gap flux component with respect to voltage variation, the finite element model is generated. The voltage variations hardly cause saturation of the entire magnetic circuit; besides, it could produce local saturation in the stator tooth of the motor [10]. Later, two FEA procedures were used to make a direct analysis of the induction motor, and their results were compared to establish the better of the two procedures [6]. The work was carried out in steady-state conditions with constant supply voltage. The behavior of a three-phase AM with unbalance voltage through phase frame analysis is analyzed in [14]. In recent equivalent circuit analysis of AM was carried out using a combination of two fine element models to calculate the equivalent circuit parameters under high magnetic saturation is discussed in [15]. Many other attempts to analyze the AM in 2D using FEM, such as various frequency conditions, the influence of different soft magnetic materials, motor with three different modelling, and flux density over the 2D view of the machine, according to a literature review. However, no clear study has been done on motor efficiency in over voltage and under voltage situations. When opposed to 3D analysis, researchers believe that the smaller the electric machine measurements, the greater the error in output assessment. However, other than knowing the degree of error resulting from the use of 2D analysis, there is no concrete evidence for this assertion [13,16]. As a result, in order to provide a more accurate response to this claim, electrostatic FEM analysis of a selected AM was performed in 2D analysis in this investigation. The degree of error arising from the use of 2D regression is seen to be important. As a result, it is advised that no additional computing workload be incurred as a result of using 3D analysis. Furthermore, owing to assembly defects, AM's production systems suffer from manufacturing tolerances. During undervoltage and overvoltage conditions, this results in undesirable variations in the machine's output and behavior the equivalent circuit parameters are affected [5]. As a result, the authenticity of the electrical specifications of a reference system for prototype machines is questioned. In this paper, the FEA of three-phase asynchronous machine under power quality disturbances is carried out using two different approaches, the first approach is based on the motor's analogous circuit. To evaluate the parameters of the equivalent circuit, the field solutions replicate the indirect (no load and locked rotor) tests. The direct (load) tests are replicated using the second process, which is based solely on the field solution. It blends the field and circuital solutions, directly imposing the motor voltage. Both methods are used on a four-pole 9.2 kW asynchronous computer with a two-dimensional discretized domain.
3.1 Equivalent Circuit Analysis
This analysis consists of a no-load test and load test is based on the calculation of equivalent circuit parameters of the AM. The equivalent circuit is shown in Fig. 6 for the specified operating point. Once parameters of the equivalent circuit are found, the user can examine how motor parameters depend on different operating conditions. The no-load test is based on the nonlinear magneto-static FEA assuming zero current in rotor bars during the test. The accuracy of the FEA solution is defined by the convergence tolerance of FEA solution field; the default value is 1e-005. To run the no-load test, at first specify stator current values used during the test in the stator current values field. Since it is assumed that there is no rotor current during the no-load test (I2 = 0), the stator current is basically equal to the magnetizing current. The load test is based on the nonlinear time-harmonic FEA. The accuracy of the FEA solution is defined by convergence tolerance of the FEA solution field; the default value is 1e-005. The RMS phase current, supply frequency, and rotor speed (or slip) is defined. By default, the speed is set to zero, so the standard locked rotor test can be performed. During the load test, the parameters of the equivalent circuit is computed. The motor parameters are computed assuming that L1, L2, R1, R2, and Rm do not change while Lm changes depending on the magnetizing current according to no-load test data. In reality, L1, L2, R2, and Rm values more or less depending on rotor speed and saturation. AC Analysis is based on the time-harmonic FEA and the equivalent circuit but provides more accurate results comparing with equivalent circuit analysis since it can take into account variation of equivalent circuit parameters at different operating conditions. AC Analysis is performed for the specified operating points defined by the power supply (3-phase voltage source or 3-phase current source), RMS phase voltage (RMS phase current), and supply frequency fields. The speed can be defined whether by the number of rotations per minute or by slip.
Time harmonic finite element method is centered on the assumption of the sinusoidal time-dependence of the field, which allows the computation time to be reduced radically comparing with the stepping FEM [17]. This method provides only steady-state motor parameters and cannot be used for the analysis of transient regimes. Time-stepping finite element method is the representation of the time derivative of the magnetic vector potential for each time step and can be used for the analysis of both transient and steady-state [18]. In both methods, the discretization of the problem over the plane of the machine's cross-section using FEM results in the system of linear equations written form as follows;
Here K is the stiffness matrix, X is the vector of unknowns including values of the magnetic vector potential in mesh node, rotor and stator currents, and voltages, F is right side vector. The residual vector of the gauss
Here, tol-convergence is the tolerance setting the desired accuracy of the solution, the generalized algorithm used in motor analysis for a nonlinear instance of the time-stepping process is shown in Fig. 3. An outer loop of the algorithm represents integration over time with step Δt. The magnetic field issue is addressed on each integration step in the nonlinear solver loop.
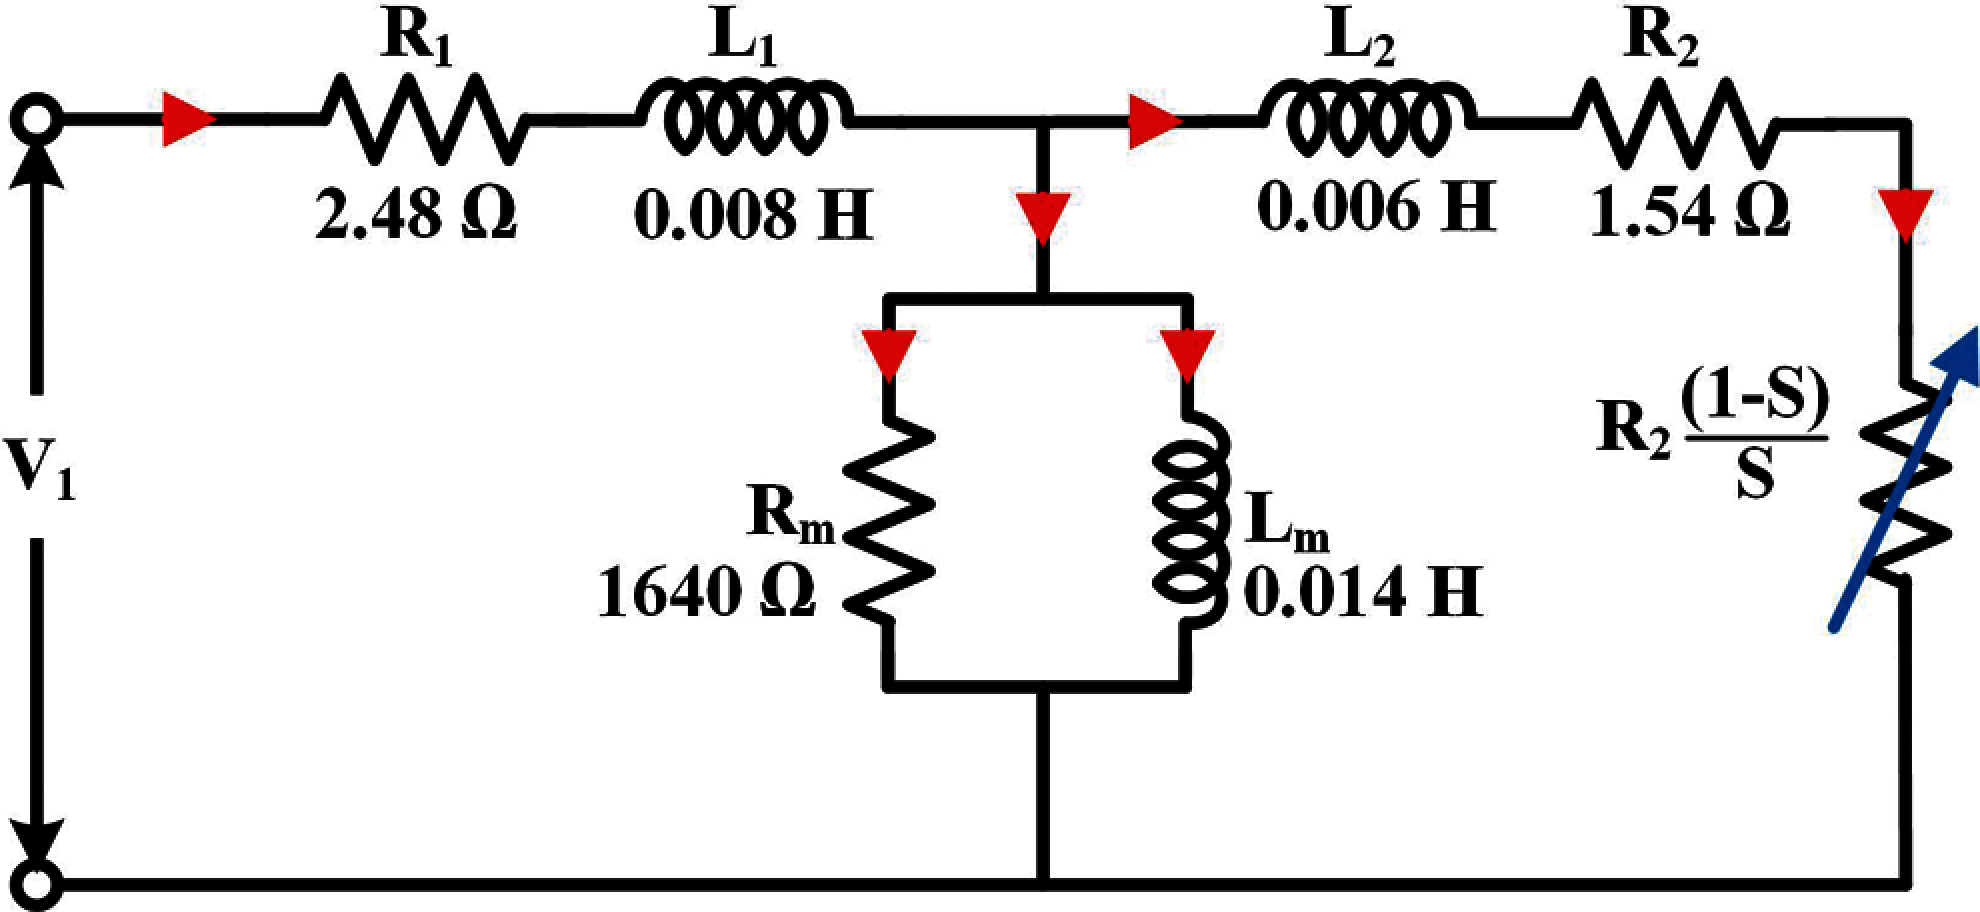
Figure 3: Equivalent circuit of the AM
Gauss-newton iteration continues until the inequality is satisfied [19]. In motor analysis, the first-order triangular finite element mesh is used. Every time while the time-stepping FEA simulation is in progress when the rotor position is changed, the mesh should also be changed. It is implemented by rotation of the rotor mesh connected to the fixed stator mesh via a sliding layer located in the air gap. In motor analysis, the air gap always has an odd number of mesh layers (3, 5, 7, or 9), and the sliding layer is always located at the center of the air gap, as shown in Fig. 4. To reduce the number of finite elements, and as a consequence reduce computation time, periodic/antiperiodic boundary conditions can be applied. Using this type of boundary conditions is based on the periodicity of the magnetic field of the motor [5]. The mesh model is shown in Figs. 5a and 5b.
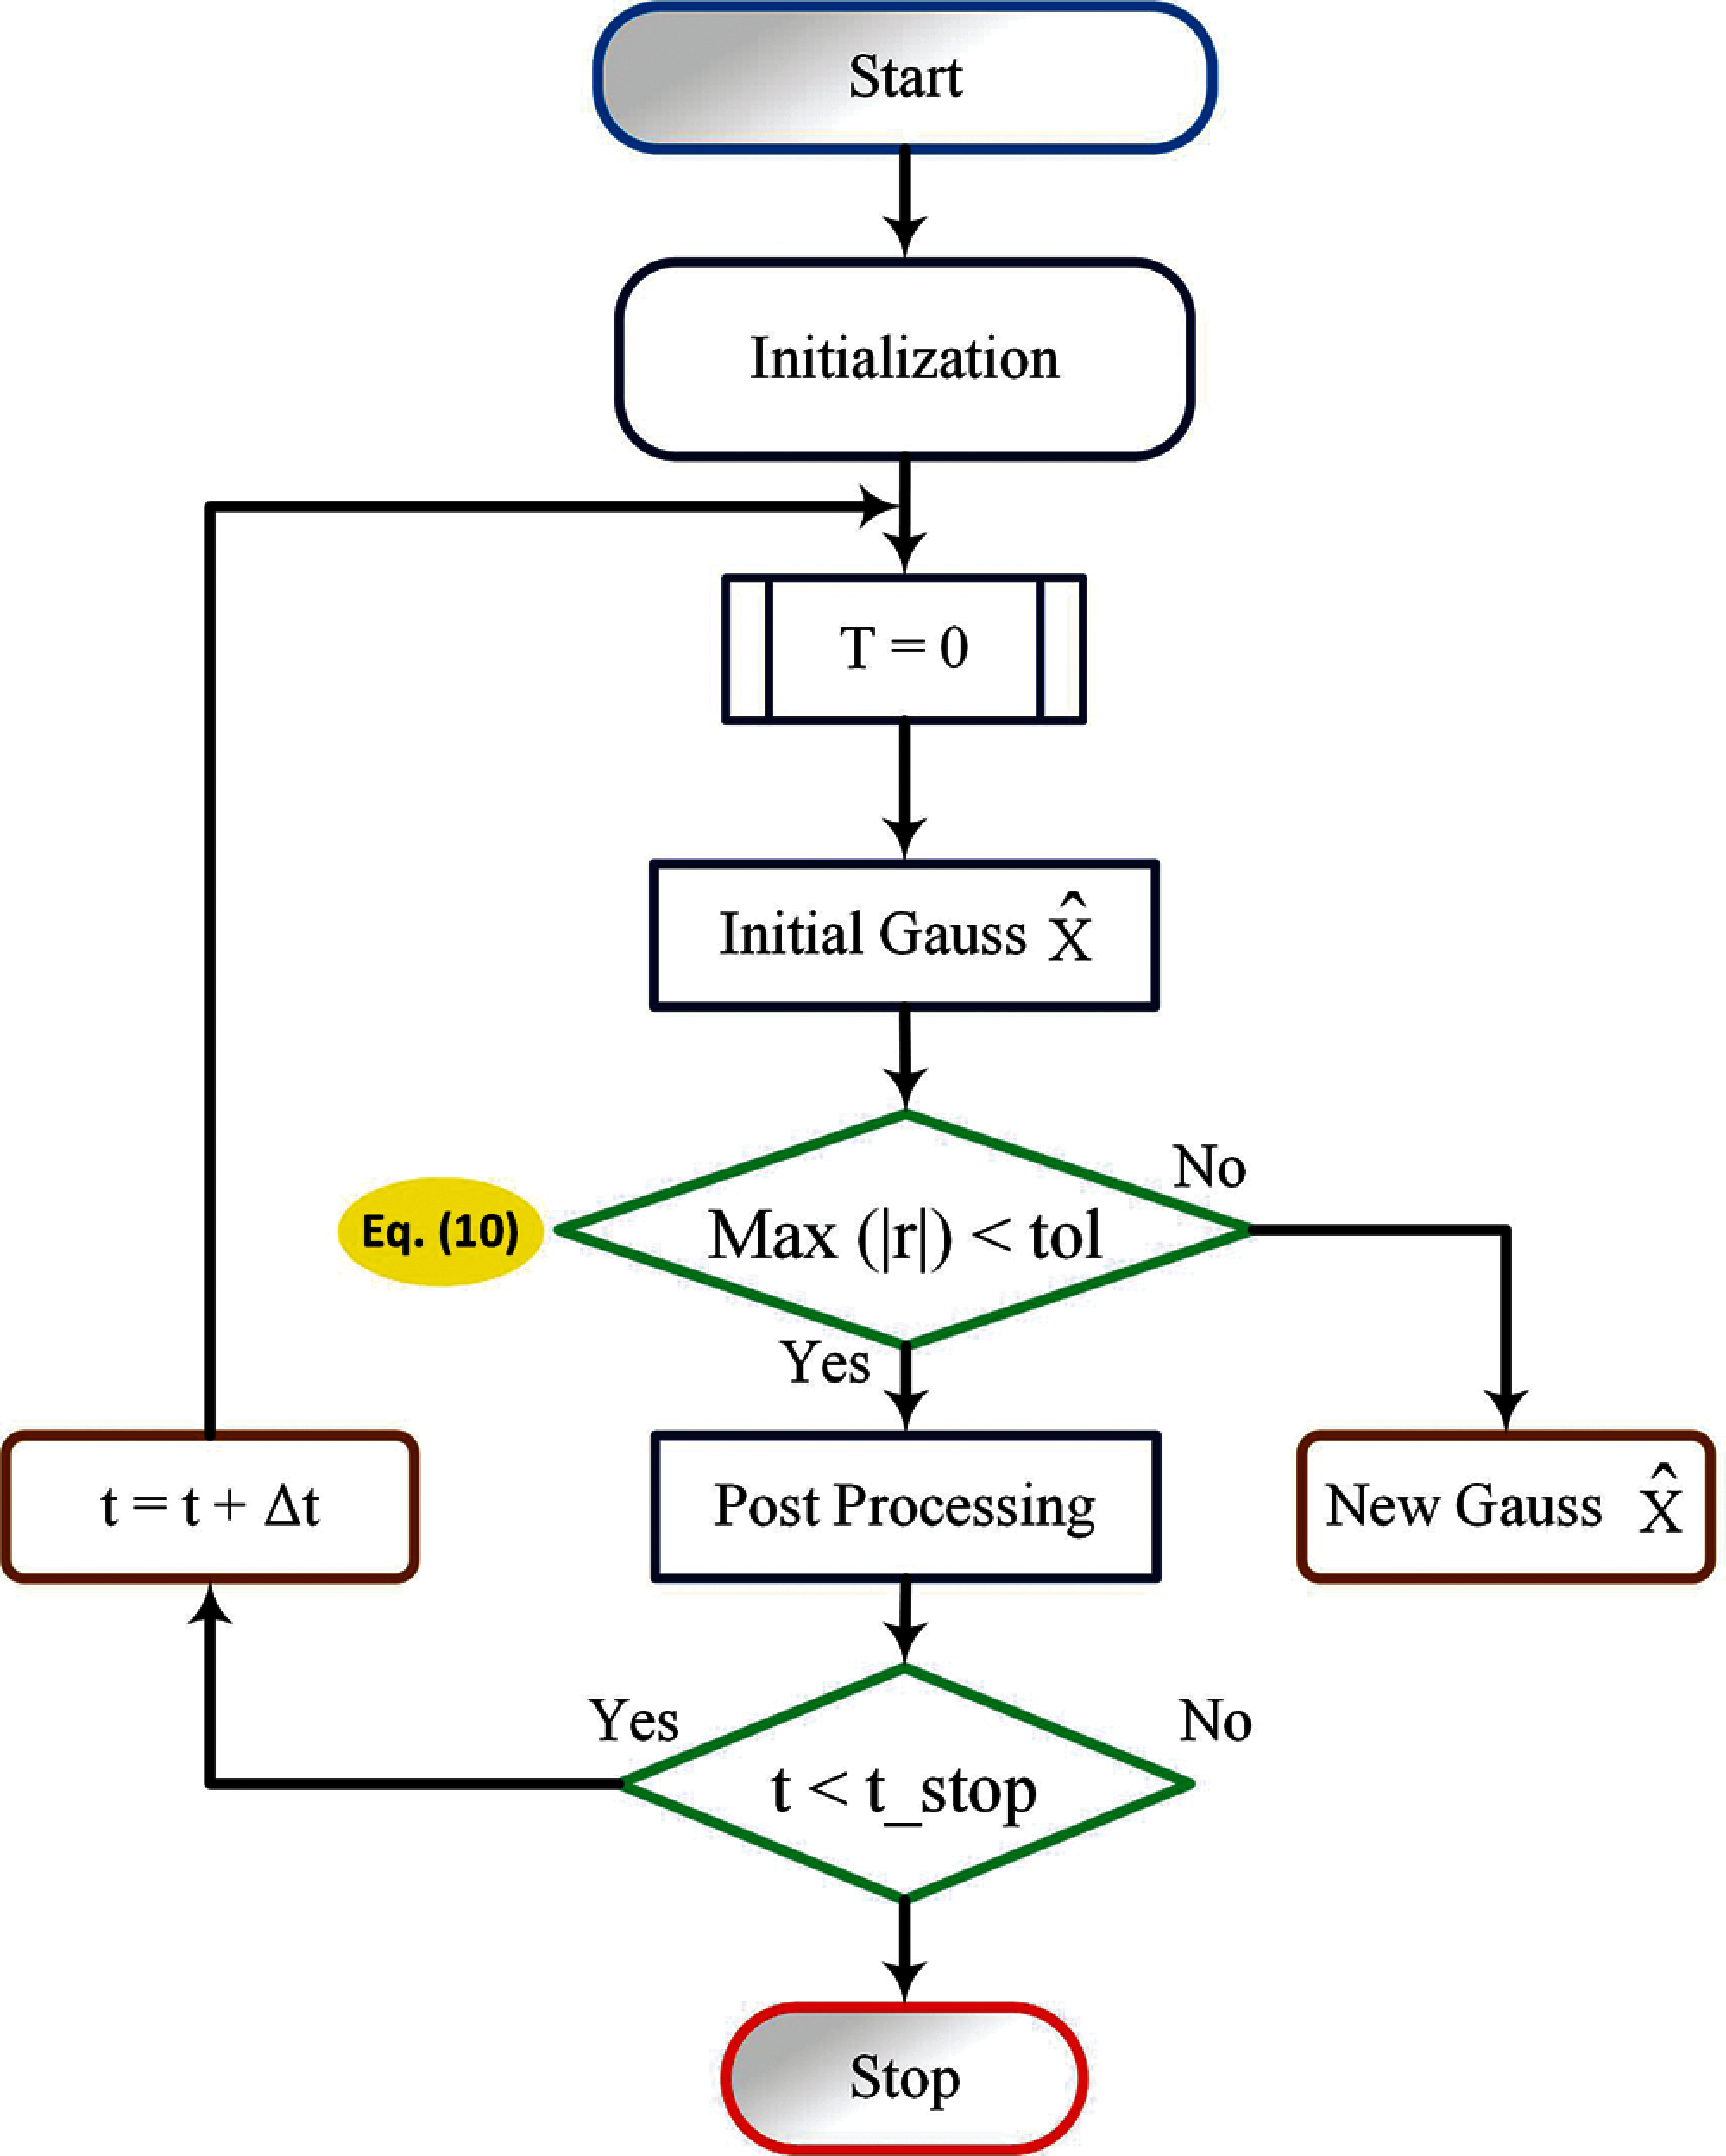
Figure 4: Time-stepping FEM algorithm
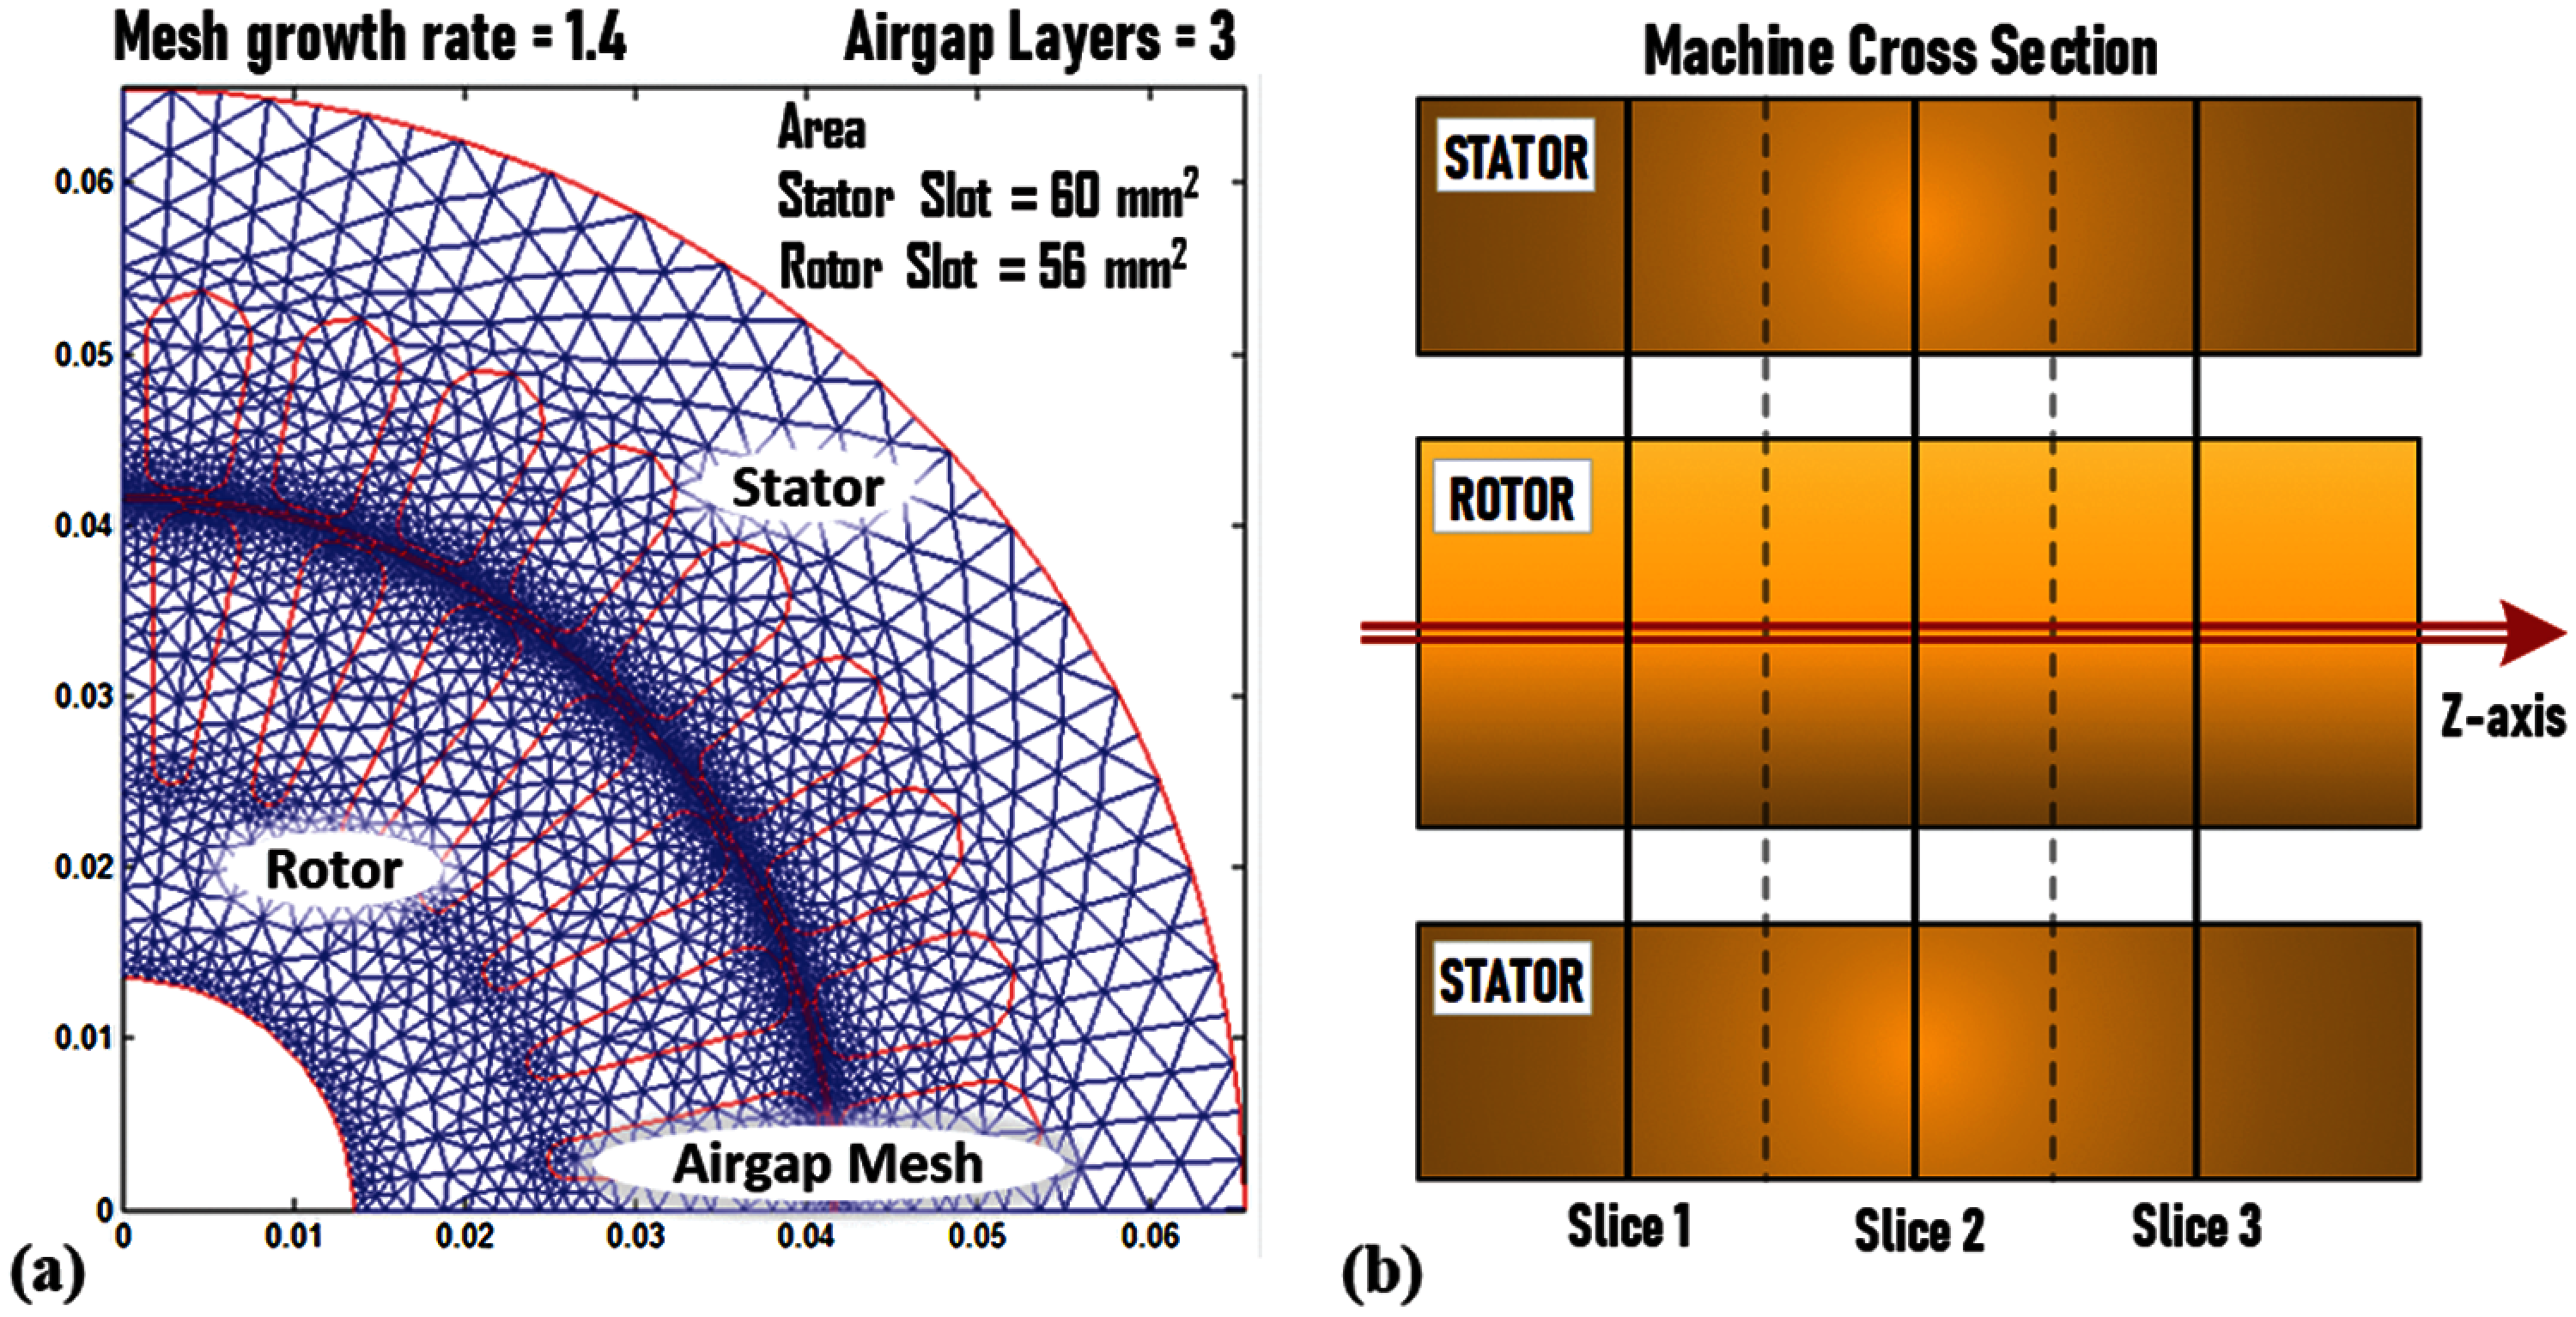
Figure 5: Finite element mesh model. (a) 2D FEM model of 9.2 kW AM; (b) multi-slice FEM model
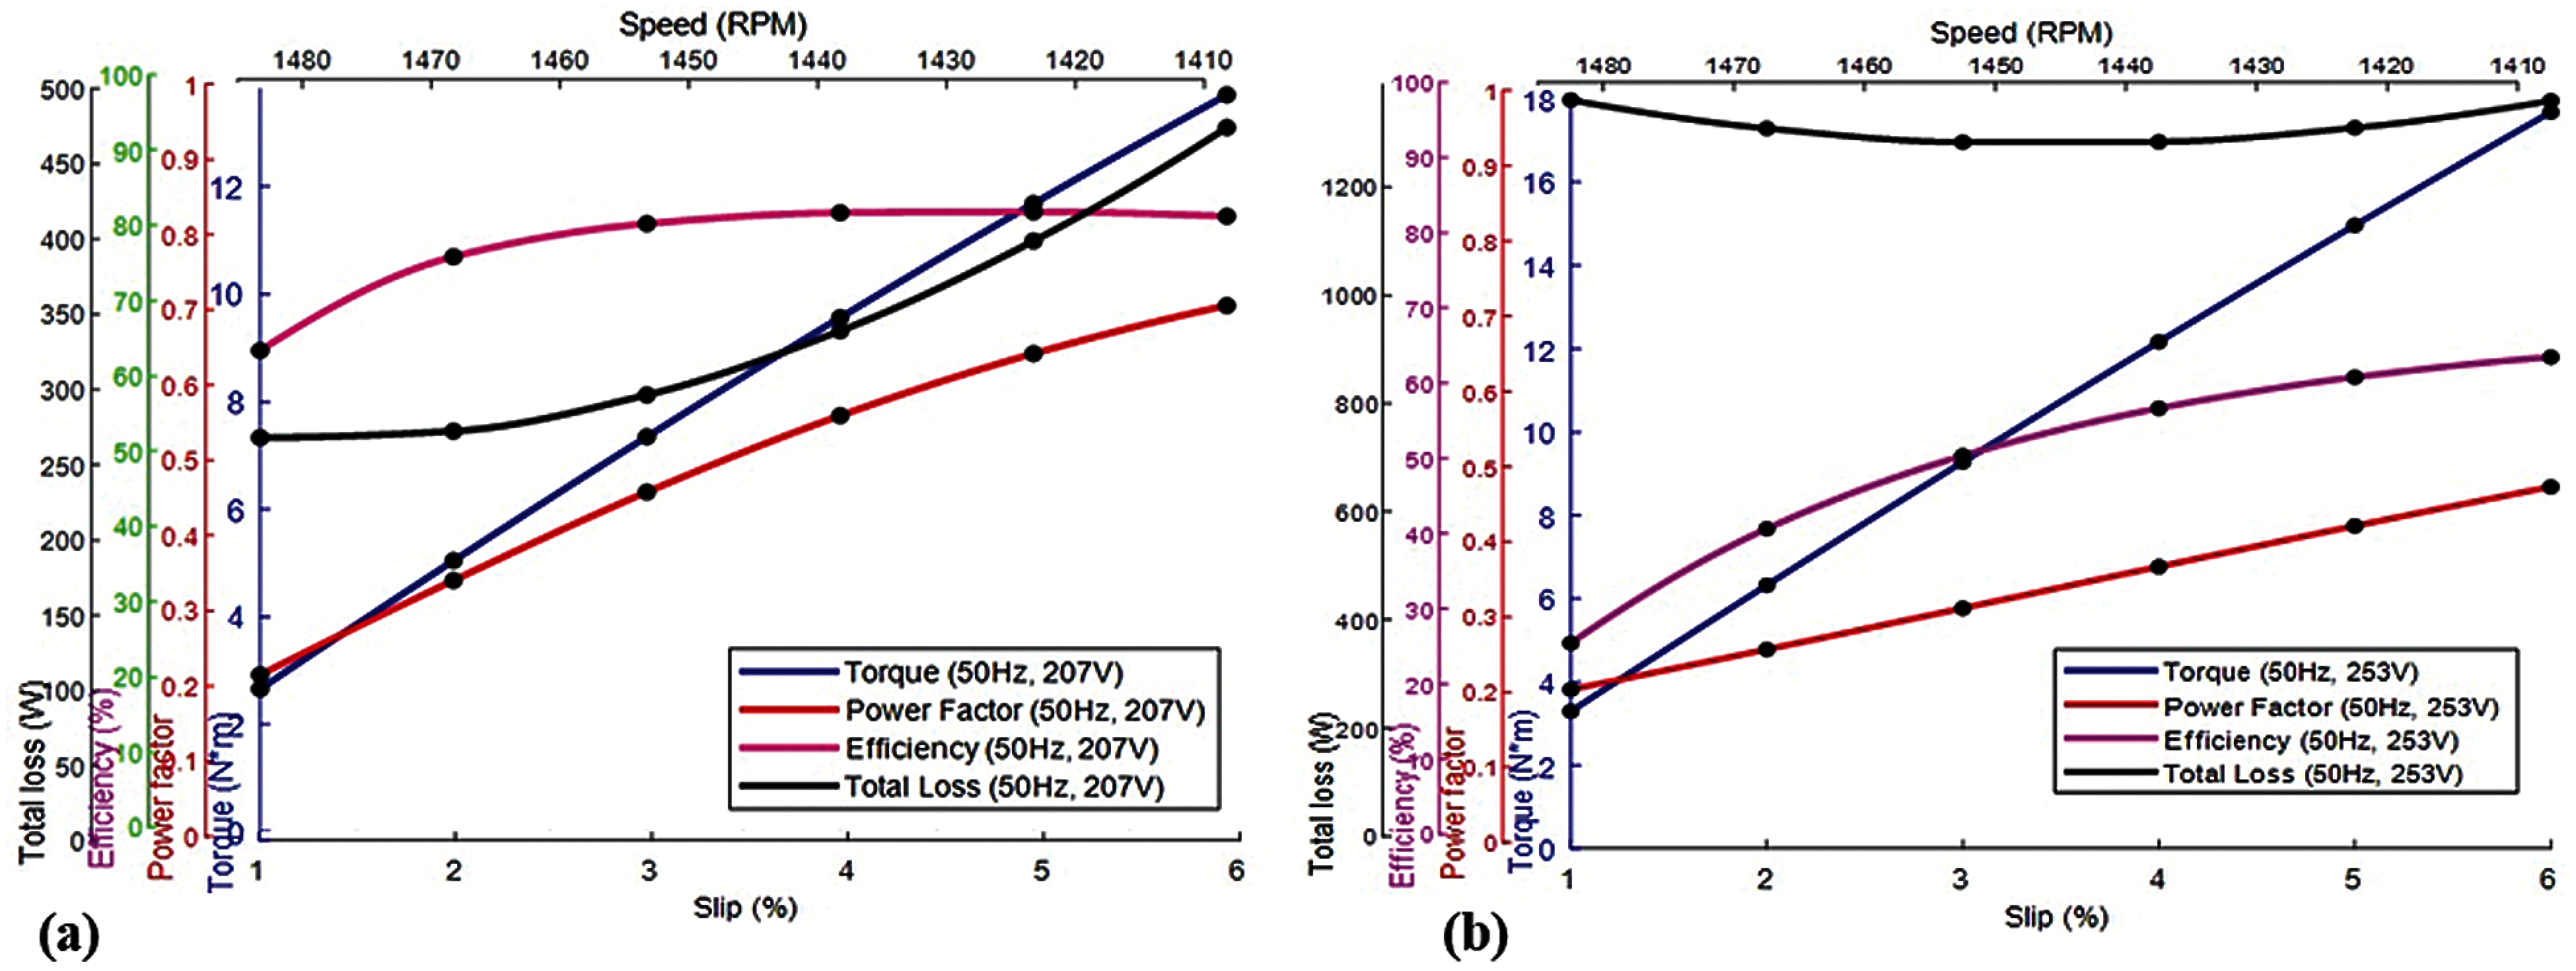
Figure 6: Parameter variations with respect to slip; (a) 10% undervoltage (b) 10% overvoltage
4 Interpretation of Finite Element Analysis
The paper analysis the three-phase asynchronous motor, fed by a symmetrical three phase voltage sources with 10 percent variation. The two different FEA approaches, showing their main characteristics; 1. FEA method for the indirect test simulation2. FEA method for the load tests simulation. Both methods use fixed mesh and eddy current models, they do not consider the field harmonics and they are applied to the same two-dimensional (2D), domain ‘D’.
The field components are supposed varying sinusoidally in time. Thus in a Cartesian coordinate system (x, y, z) the values of the generic quantity G(P, t), in the point P = (x, y, z) and at the instant t, can be written as;
Here, i = x, y, z; ω is the frequency in rad/s and θ denotes the electric phase difference in rad.
It is supposed that the current density vector J and the magnetic potential vector A have only the z-axis components, i.e., J = (0, 0, Jz) and A = (0, 0, Az). Thus, magnetic field strength H and flux density B have only components, on the (x, y) plane perpendicular to the z-axis, i.e., H = (Hx, Hy, 0) and B = (Bx, By, 0). In this way the induction motor analysis may be realised by a 2D finite element analysis, simpler than a three-dimensional (3D) one, without a significant loss of accuracy. The 3D effects have been by suitable circuit elements outside the field solution. The sensitivity of the variables to change in voltage is studied in the sensitivity analysis part of the paper.
4.1 Performance of Asynchronous Machine Under Voltage Variations
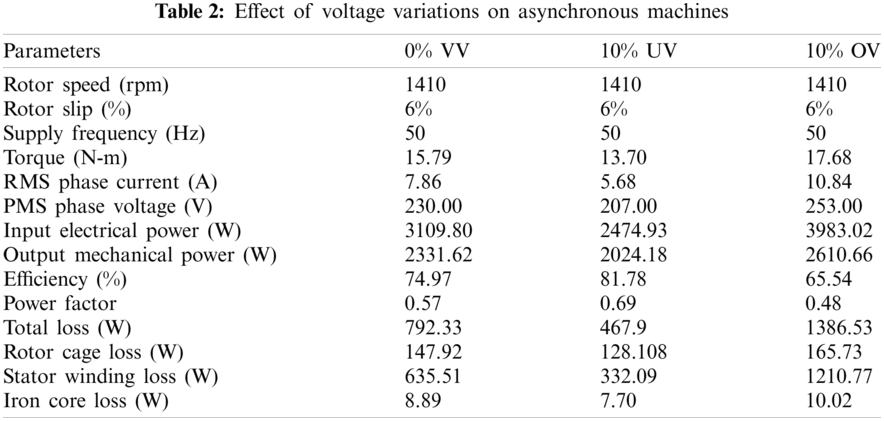
In this first case, the induction motor is modelized by a simplified equivalent circuit Fig. 3. FEA method is used to reproduce the usual indirect tests, that are no load and locked rotor tests. From the field solution the non-linear parameters of the simplified equivalent circuit, essential to evaluate the motor performance, are, calculated. In order to evaluate the total losses and the motor efficiency, R0 the stator resistance R1 is evaluated and presented in Figs. 3 and 6. Similarly, in order to analyse the load operation, the non-linearity of magnetic materials, the current induced in the rotor bars and the rotor movement have to be considered simultaneously. The field problem is a nonlinear and time-invariant one. It presents both motional and induced current density term. The simulation results for the standard asynchronous motor design with 10 percent undervoltage and 10 percent overvoltage is presented in Tab. 2 with 6 percent slip (rated load). As well, the parameter profiles during no load to full load variation with 10 percent undervoltage and 10 percent overvoltage symmetrical supply is shown in Figs. 6a and 6b respectively. It is clearly observed that there is an increase in losses as the supply voltage increase and a reduction in losses when voltage is lowered 10 percent below the nominal voltage. The reduction in losses results in increased efficiency, whereas the efficiency decreases by 10 percent OV. Upon comparison, it can be mentioned that the performance variables of stator winding losses and efficiency is highly affected by the change in voltages. Whereas, torque, input power, and output power are moderately affected by voltage variations.
4.2 Two-Dimensional FEM Analysis
The objective of the analysis is to determine the extent to which flux can be routed in the asynchronous machine to achieve an electronically adjustable output voltage. The flux distribution will be observed around the windings and in each slot. The method chosen for analysis will be simulation using the Finite Element Method. The FEM software package Motor Analysis-IM is used. Ideally a method is required that allows analysis of nonlinear magnetic circuits with three voltage level. Airgap distribution plot allows the view of the distribution of the different parameters such as flux and MMF over the machine air gap beside the air gap harmonic components. The results are obtained for a selected power supply, supply frequency, and slip/speed. Fig. 7 shows the airgap flux distribution, airgap MMF distribution for 10 percent under voltage, 0 percent voltage variation and 10 percent over voltage respectively. It is clearly noticed that the magnitude of the airgap flux and MMF are slightly affected by variations in voltage. The corresponding harmonic component magnitude is also observable. Undervoltage leads to a reduction of airgap flux, and overvoltage leads to a mild increase in flux magnitude, but the flux distribution pattern remains the same. In this paper, more than 800 simulations were performed over 120 degrees of rotor motion. A list of flux linkage vs. time was numerically differentiated with respect to time to yield line-to-neutral voltage. The difference between line-to-neutral voltages was taken to yield line-to-line voltage. Both a Mathematica notebook and a Matlab script performing these calculations.
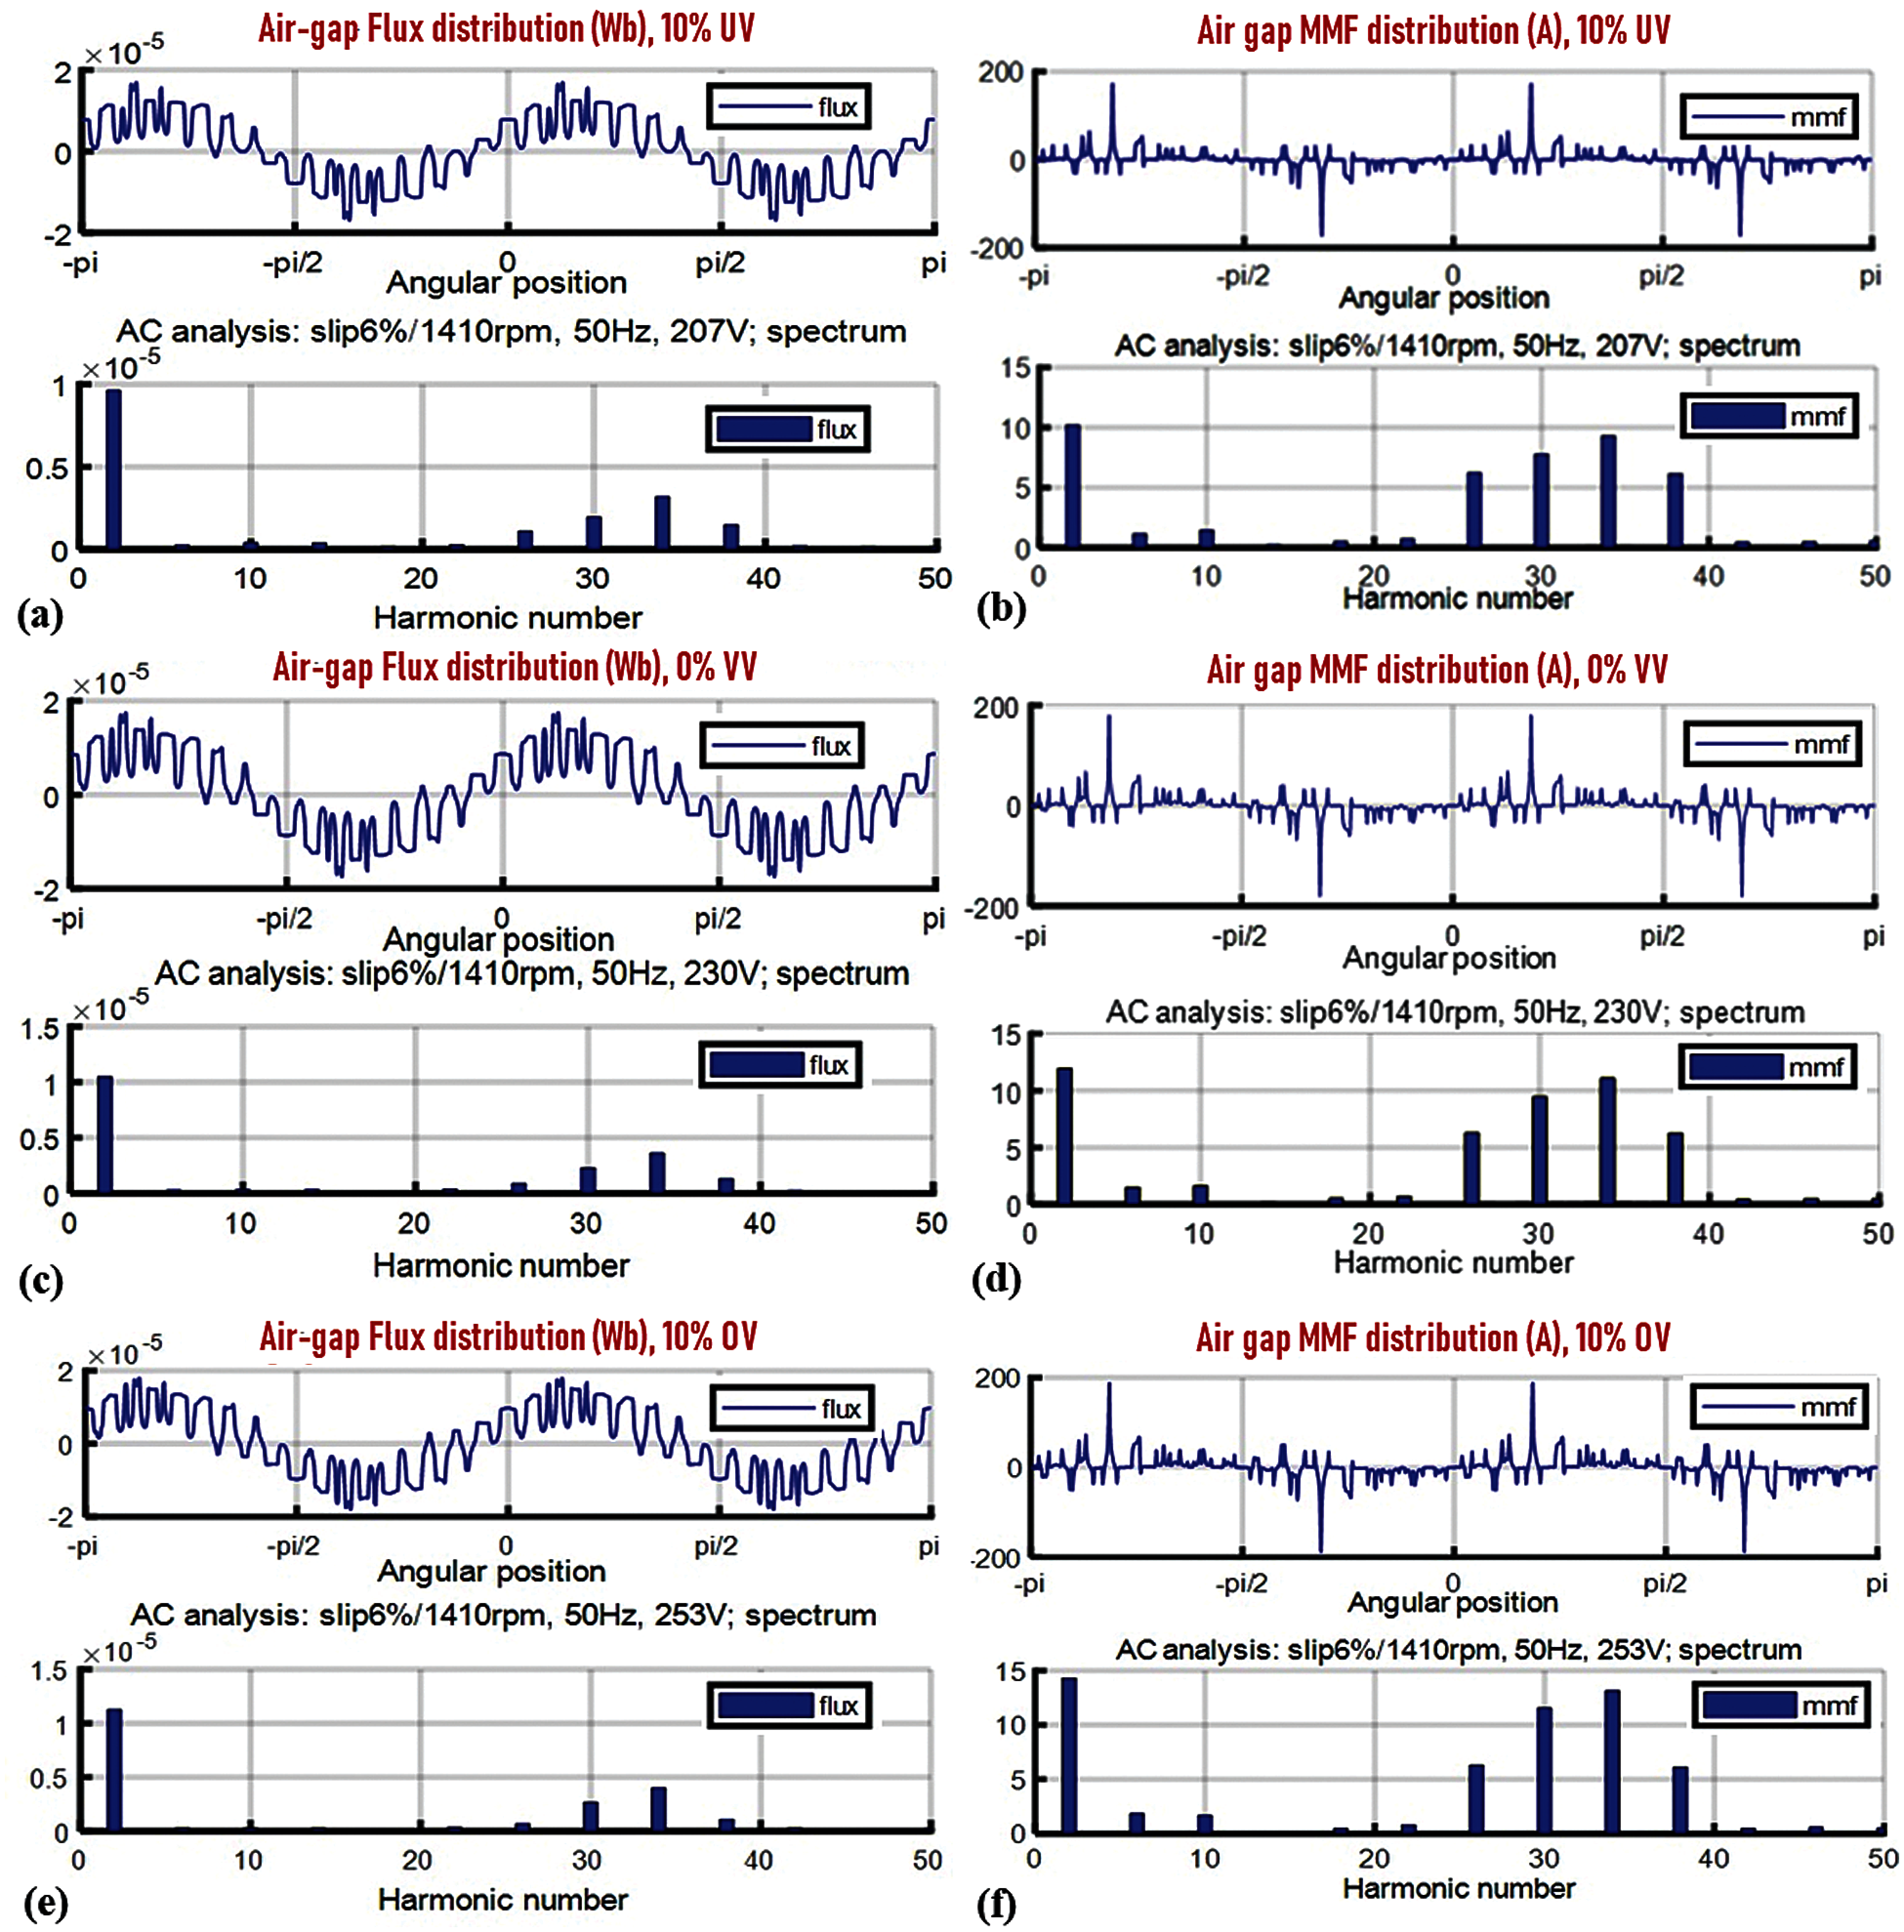
Figure 7: Airgap flux and MMF distribution with harmonic order (a) flux distribution with 10% under voltage; (b) MMF distribution with 10% under voltage; (c) flux distribution with 0% voltage variation; (d) MMF distribution with 0% voltage variation; (e) flux distribution with 10% over voltage; (f) MMF distribution with 10% over voltage
The full cross-section view has been zoomed to show the pattern of distribution of flux lines in the machine. Flux lines are plotted so that the closeness of the flux lines indicates the magnitude of the flux density x-axis and y-axis limits will be determined by the size of the machine's cross-section. Z-axis limits field sets the color scale limits to a specified minimum and maximum values. Values between z-axis limits are linearly mapped to the used color scale (color map). Data values less or greater than specified z-axis limits are mapped to the minimum limit or to the maximum limit, respectively. It is clearly visible from the cross-section plot of magnetic flux density that the magnetic flux density increases with an increase in voltage and decreases under voltage. This is evident from the color scaling. During 10 percent under voltage, the flux density is less in the stator and rotor when compared to the 10 percent over voltage, where the flux density value is higher viewable from the color change of area with pale green to bright yellow under 10 percent over voltage. The increase in flux density also results in an increase in iron losses. The iron losses increase and decrease with overvoltage and under-voltage, respectively, as evident from the color change of the iron loss plot from light blue to greenish-blue in Fig. 8. A possible solution for reducing iron losses will be the choice of good magnetic material with lower specific iron losses.
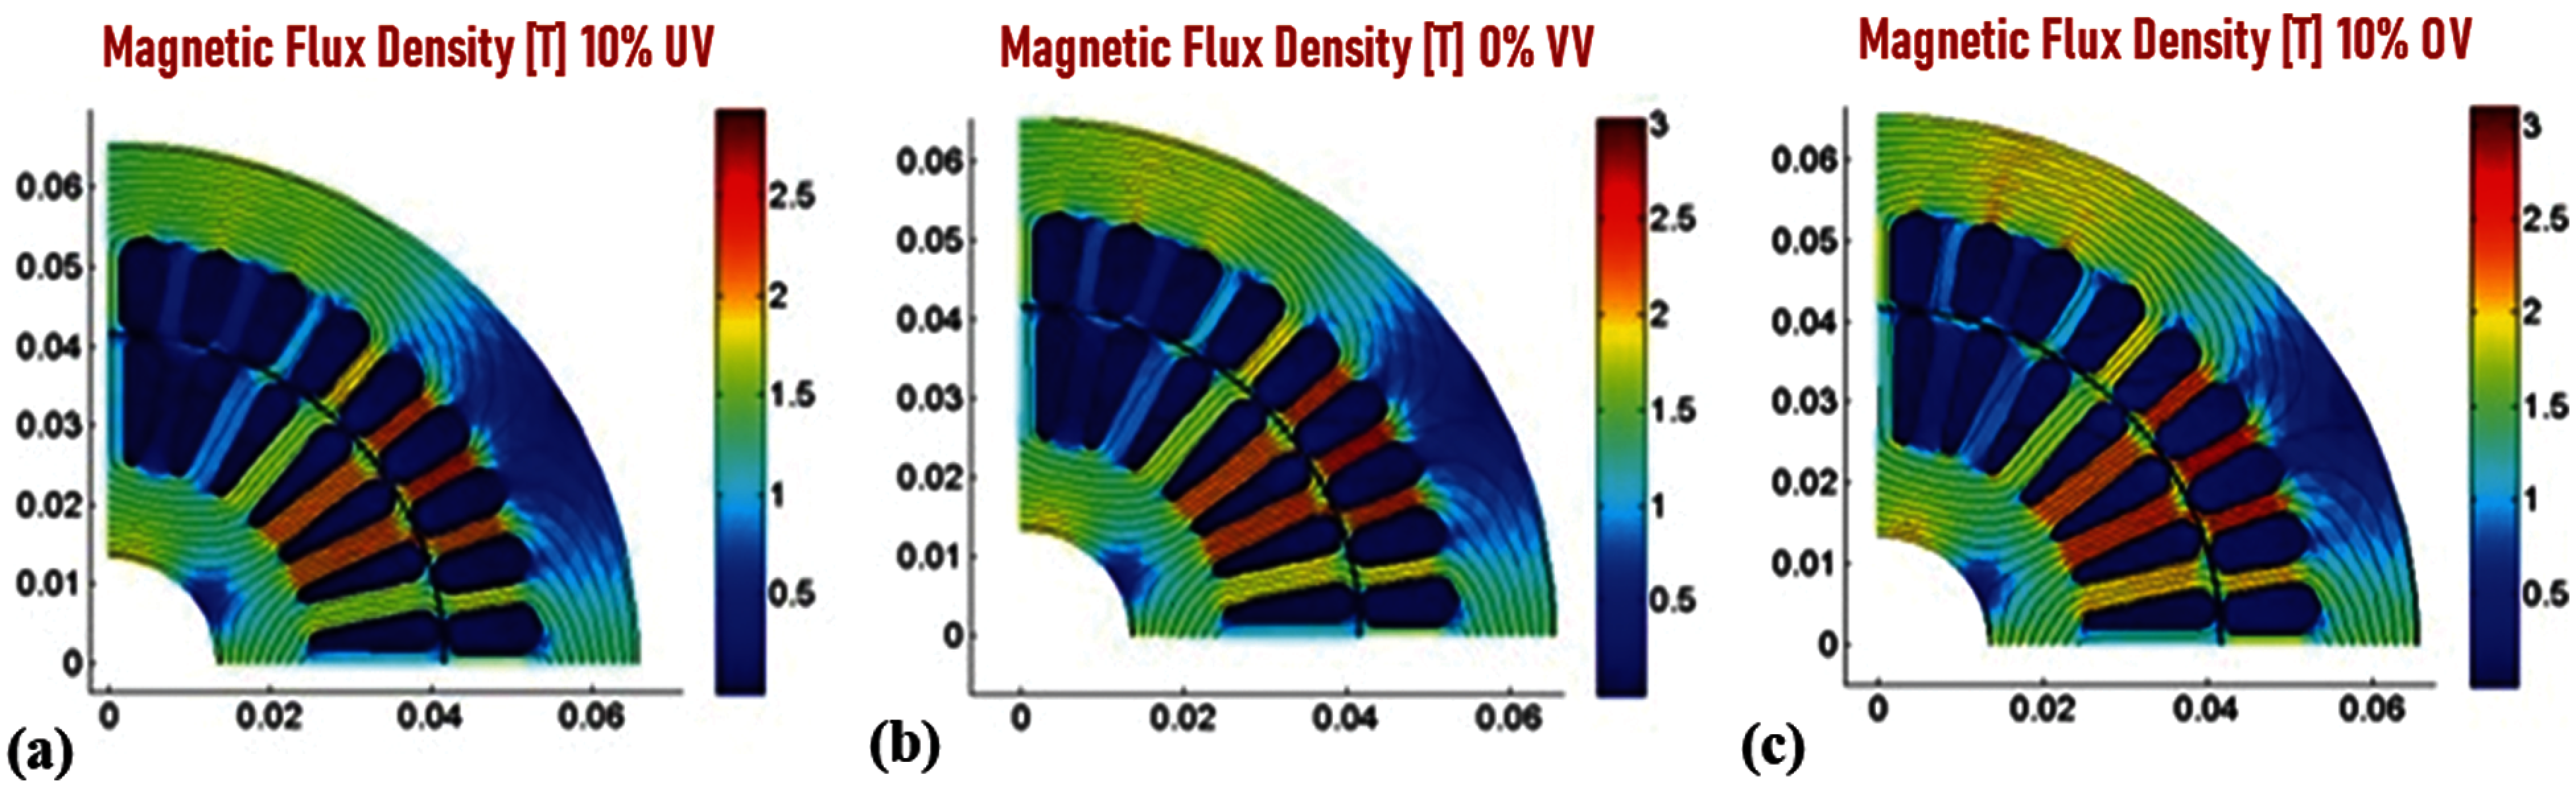
Figure 8: 2D color scale analysis of magnetic flux density-Z-axis of AM (a) 10% under voltage; (b) 0% voltage variation; (c) 10% over voltage
The joule loss density is the copper losses that occur in the windings of the IM. It is also called the I2R loss and is the main source of heat generation in the AM. The joule loss is very sensitive to variation in supply voltage. There is a sharp rise in copper losses under overvoltage and a reduction in losses under 10 percent UV. This can be clearly observed from Fig. 9, where the color change in the stator is evident with fewer losses in 10 percent UV and heavy losses in 10 percent OV. Also, the same can be verified with values from Tab. 2, where the stator winding losses reduces to 332 W from the nominal value of 635.5 W under 10 percent UV and increases to 1210.77 W under 10 percent OV. The huge increase and decrease in losses lead to lower efficiency under over-voltage and higher efficiency at under voltage. From Fig. 9, it can be noticed that the relative permeability increases with over-voltage and reduces in 10 percent UV. High relative permeability can degrade the performance of the machine. For relative permeability of the machine can be altered by using different slot wedges or by using different magnetic materials.
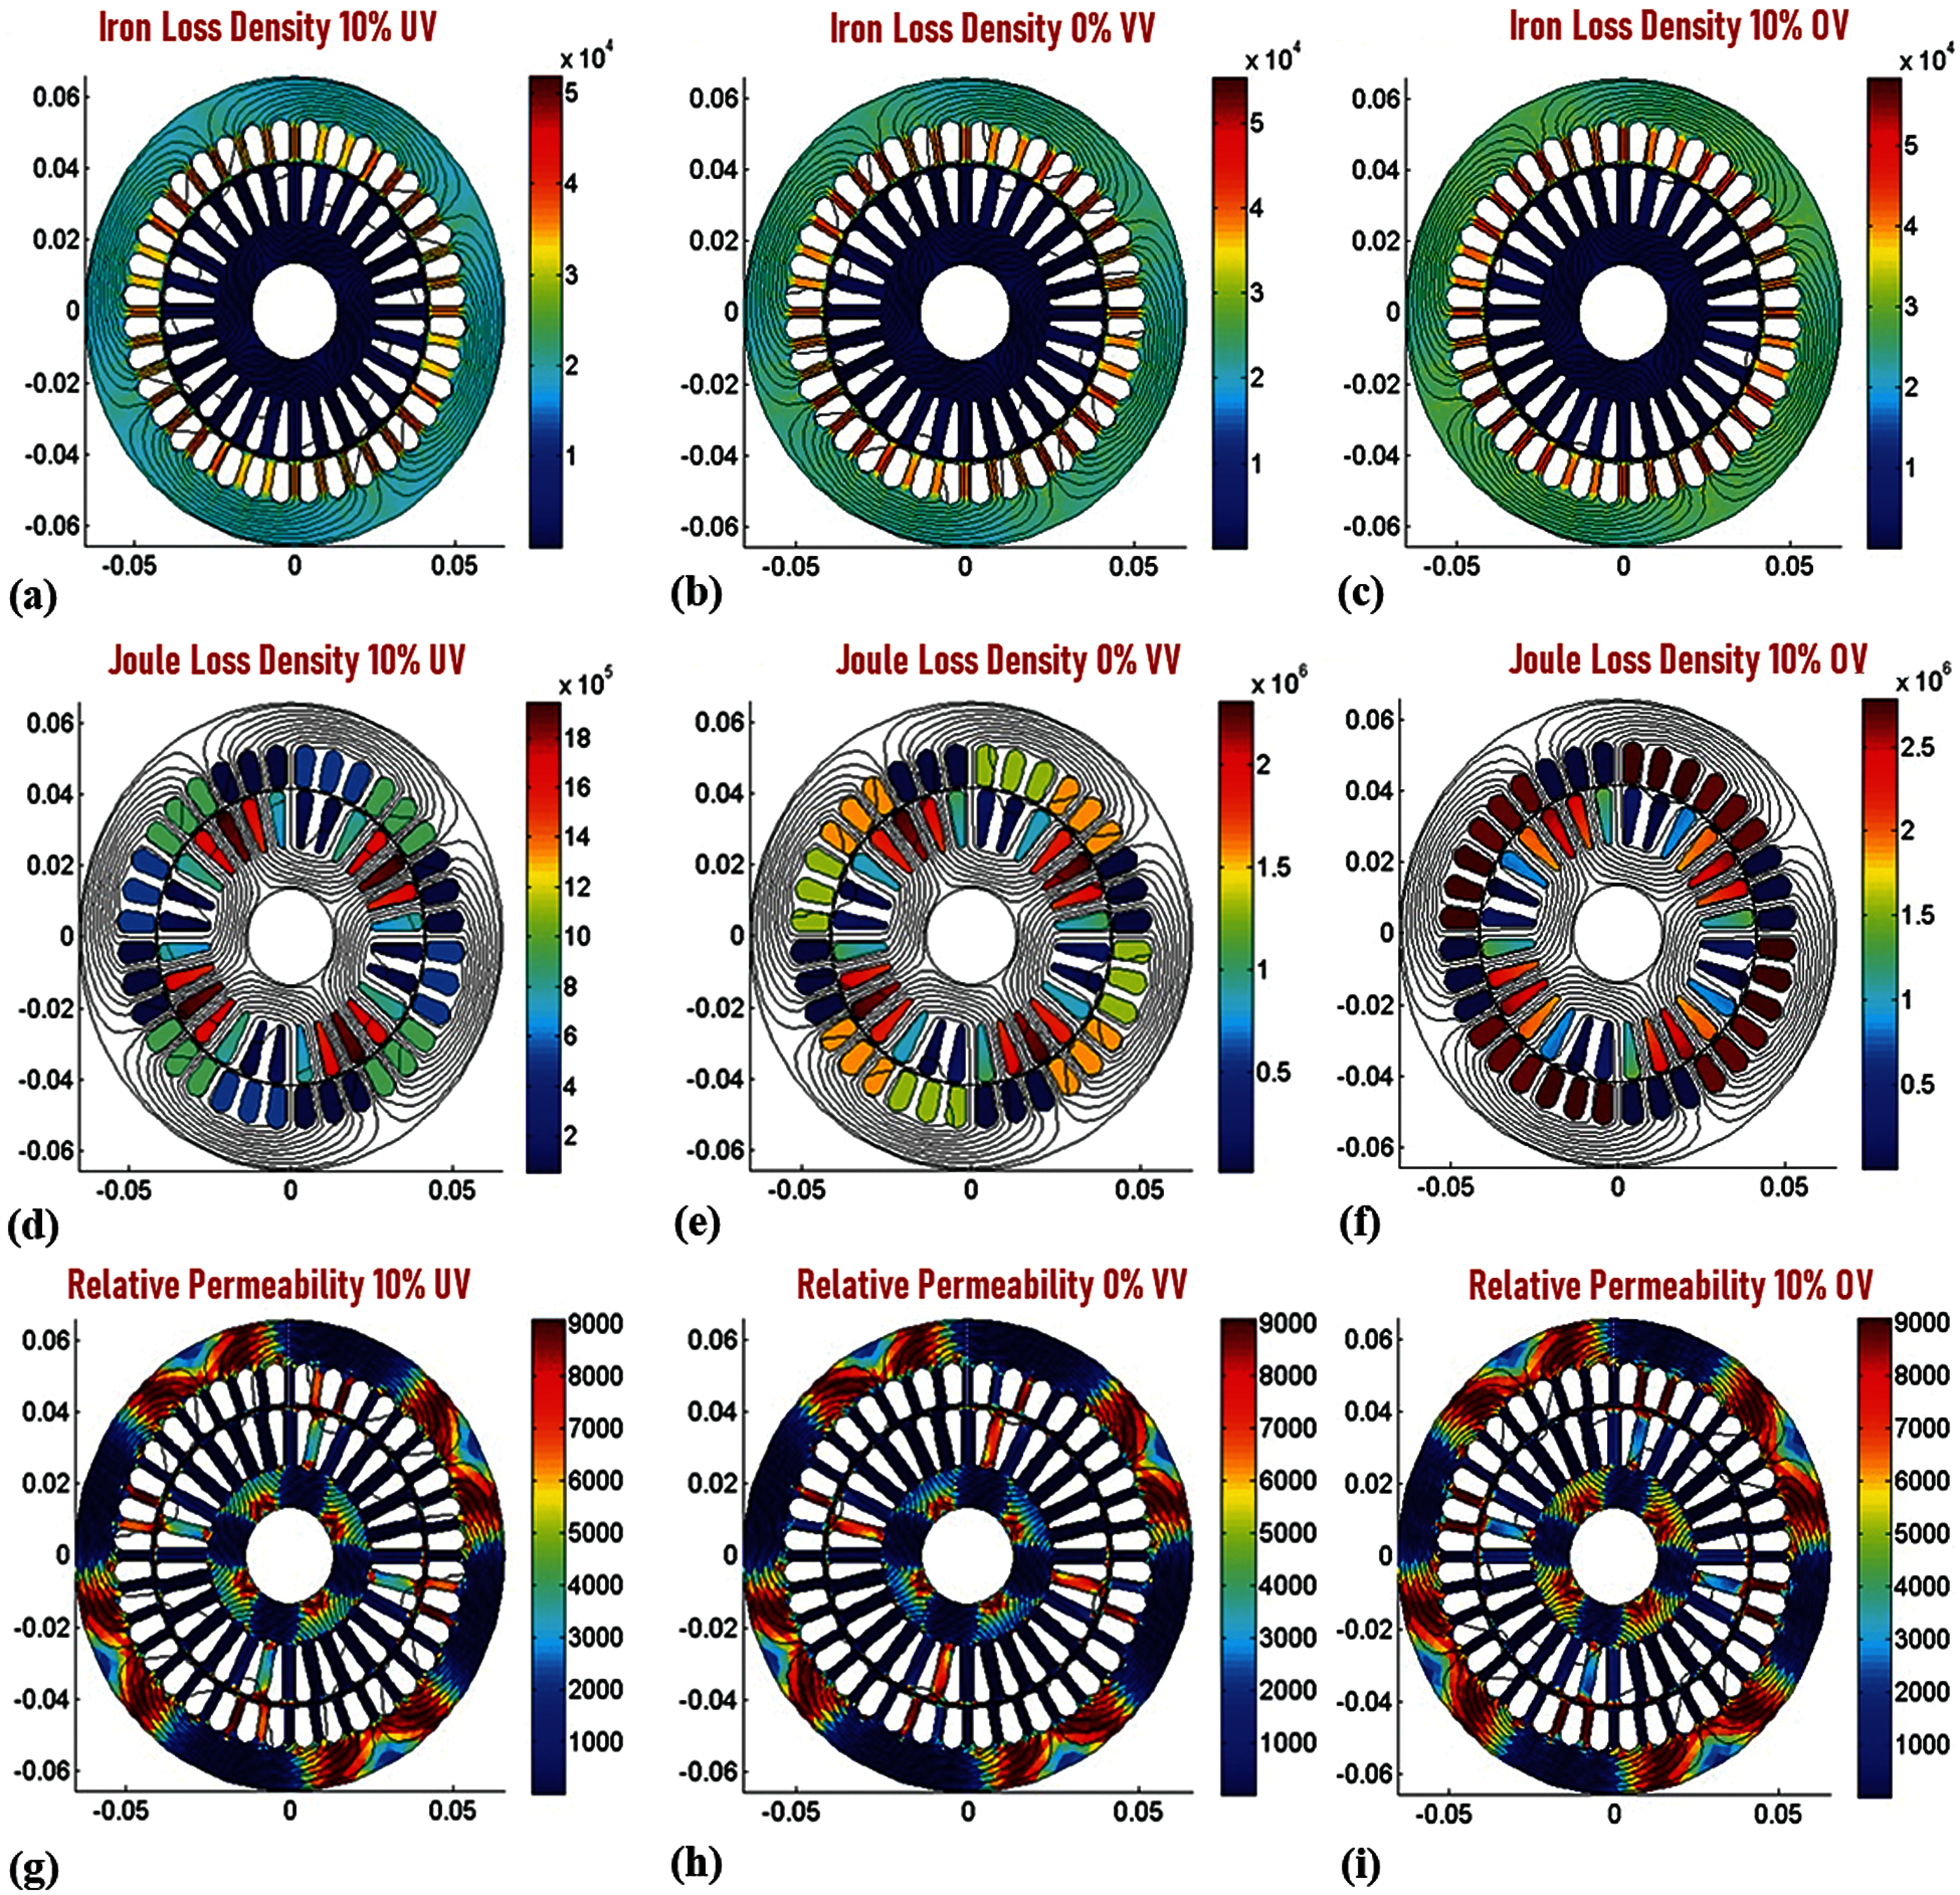
Figure 9: 2D color scale analysis of machine loss densities and relative permeabilities Iron loss density on (a) 10% under voltage; (b) 0% voltage variation; (c) 10% over voltage; Joule loss density on (d) 10% under voltage; (e) 0% voltage variation; (f) 10% over voltage; relative permeability on (g) 10% under voltage; (h) 0% voltage variation; (i) 10% over voltage
A sensitivity analysis is performed in this paper under various voltage conditions. This research is carried out to see how design variables (such as the air gap) affect the electrical parameters [5,20]. Hence, it is proceeded with the analysis, observing how an induction motor performance variable are affected by 10% under-voltage (UV), 10% overvoltage (OV), and 0% voltage variations (VV). Further, sensitivity analysis on the various performance variables is carried out, and the results have been used to identify whether 10% OV or 10% UV impacts the AM most. Sensitivity analysis, also known as simulation analysis, is used to measure the impact of fluctuations on the performance of the system. The analysis involves the measurement of the performance variables of the IM under variations in the input parameter viz. 10% OV and 10% UV to establish the parameter that affects the performance of the AM most. In industries, necessities related to the quality and control of AM are essential. In order to predict the influence of variation in motor parameters on the machine performance, sensitivity analysis is employed by machine engineers and designers. Performance variables such as torque, current, input power, efficiency, total loss, rotor cage loss, stator winding loss, output power, power factor, and iron core loss have been investigated by means of the Motor analysis tool in MATLAB. The sensitivity index of the various performance variables of the AM can be calculated using the relation
where,
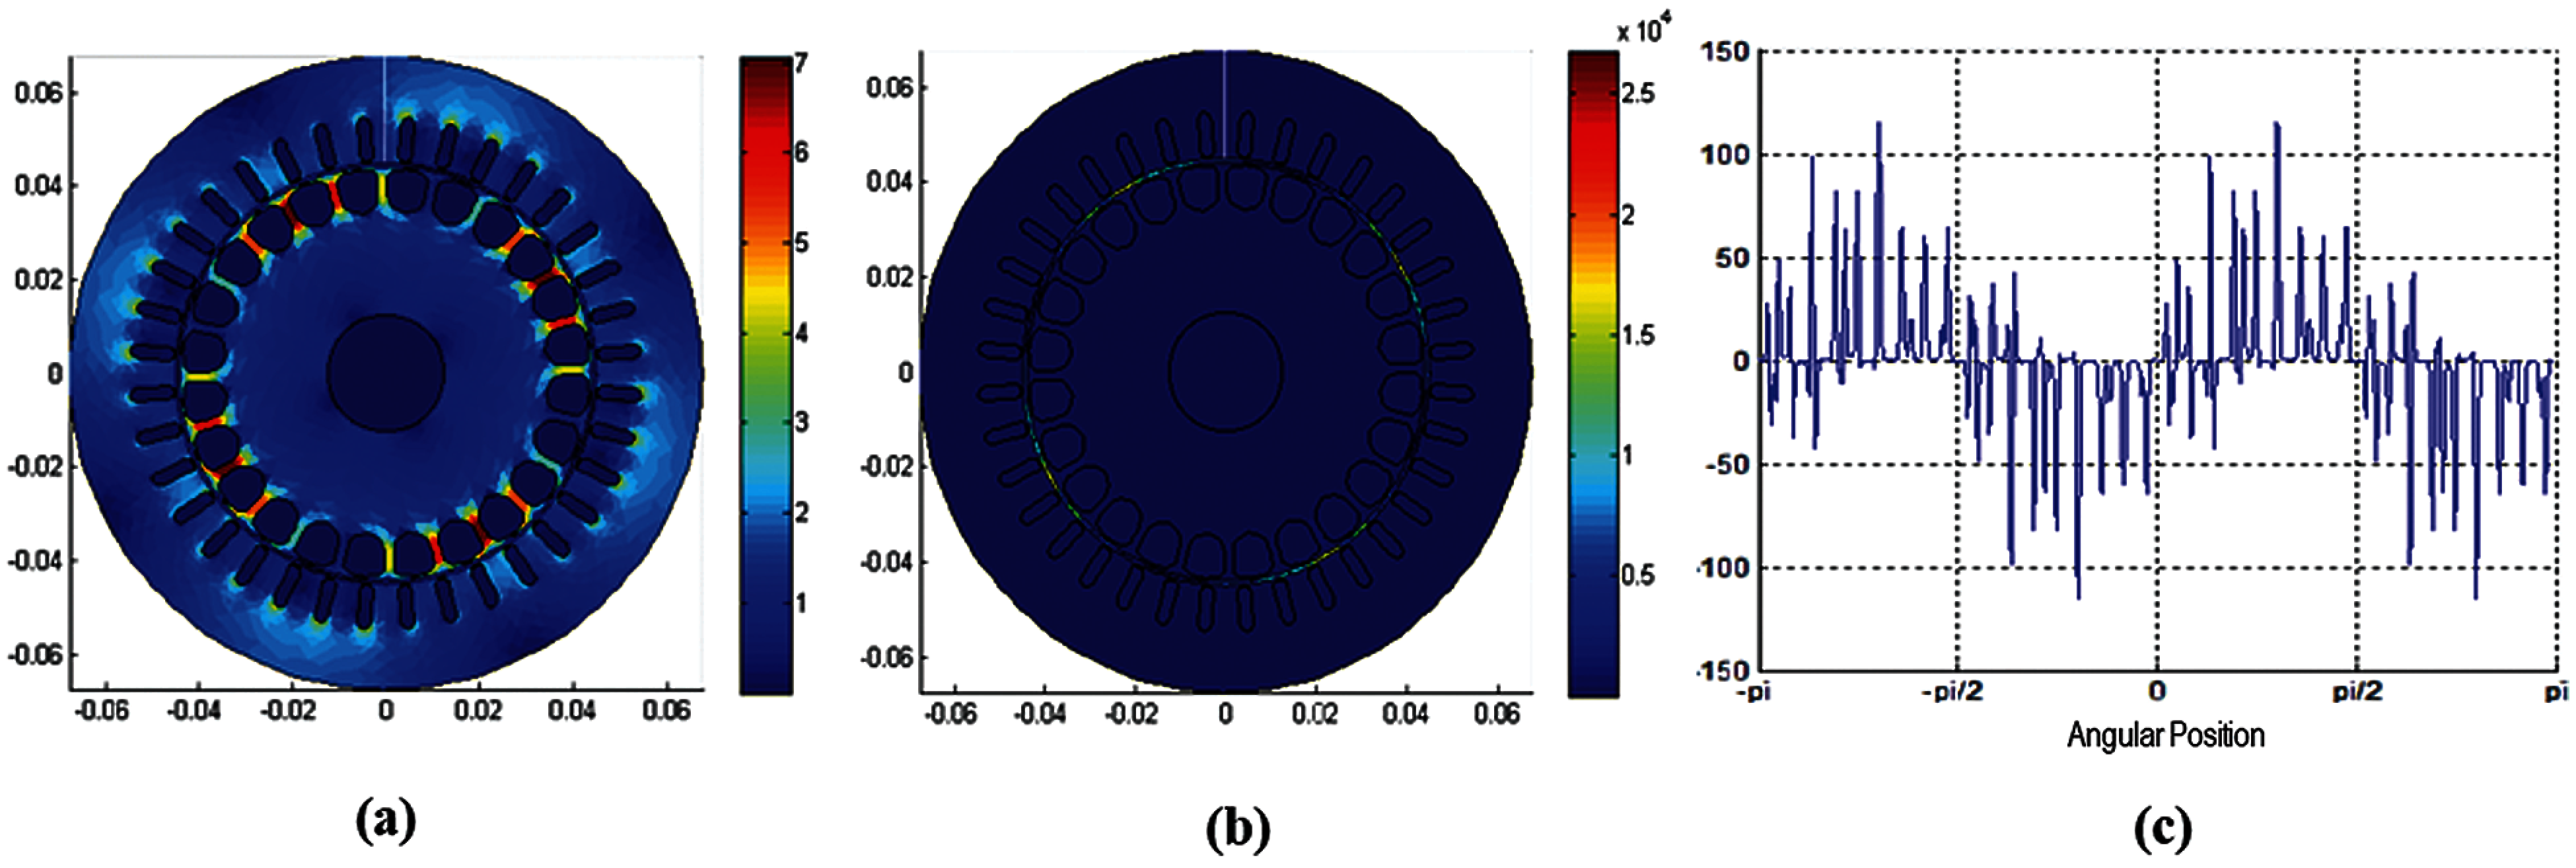
Figure 10: Performance of induction motor during transient period (a) magnetic Flux density plot; (b) energy density plot; (c) Air gap distribution plot
The supply voltage variation has a considerable effect on almost all performance variables. The performance variables like stator winding loss and total loss are highly sensitive with respect to 10% OV and moderately sensitive to 10% UV. Furthermore, the sensitivity of phase current, power factor, and input power are moderately sensitive with respect to 10% UV and 10% OV. Torque, output power, efficiency, rotor cage loss, and iron loss are less sensitive with respect to 10% UV and 10% OV. From the above observation, it is clear that 10% OV has a maximum effect on the performance variables. Hence, we can conclude that the AM is prominently affected more by overvoltage than under voltage. Transient Analysis is based on the time-stepping FEA and has the highest accuracy among other analysis methods allowing to take into account rotation of the rotor, cogging torque, higher harmonics, PWM switching and etc. However, this type of analysis takes considerably more time comparing with previous two analysis types (equivalent circuit and AC analysis). Transient Analysis uses Simulation script file---MATLAB-function which is called on each simulation time step and allows the user to change all simulation settings. The magnetic flux density and energy density distribution plots are shown in Figs. 10a and 10b respectively. The air gap distribution of the MMF at time point of 1 s in the first slice's cross-section is shown in Fig. 10c.
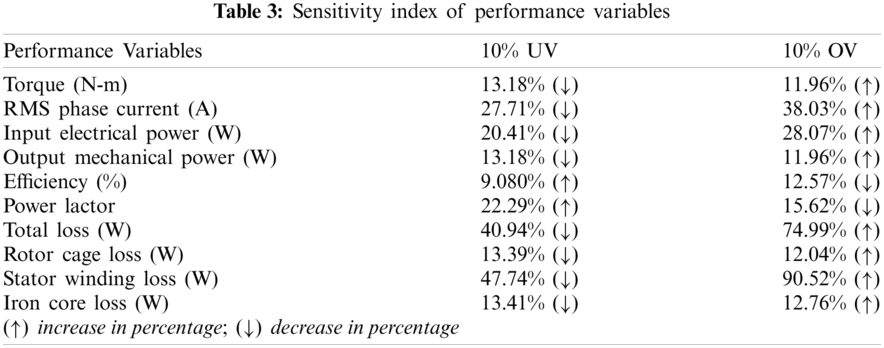
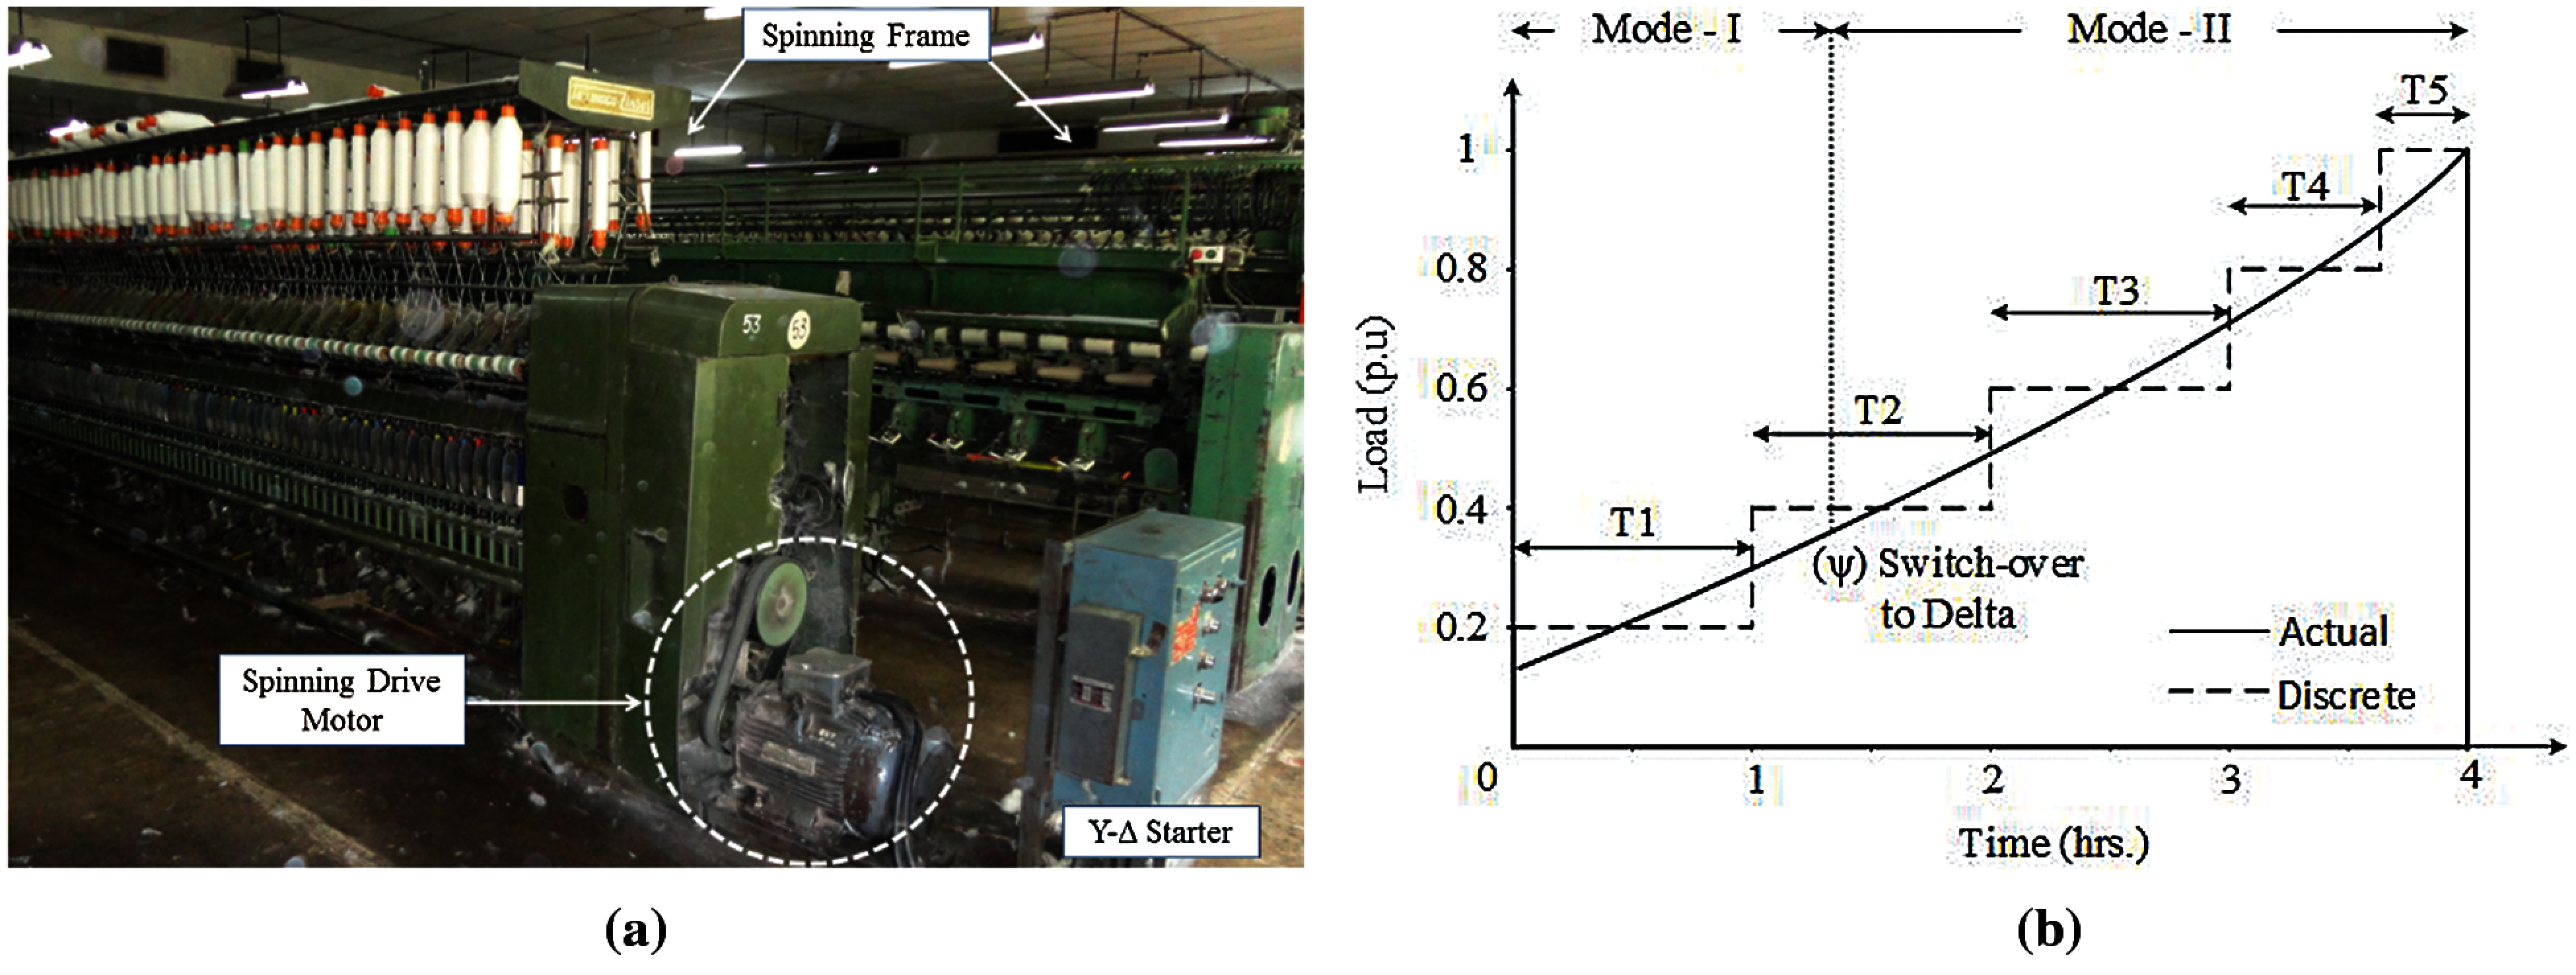
Figure 11: Textile spinning frame with the load diagram (a) spinning frame with drive motor (b) load diagram of spinning drive motor
6 Case Study on Textile Spinning Mill with 10 Percent Voltage Variation
Here, ENom is total energy losses under nominal condition (0% VV) in kWh, EUV is total energy losses in under voltage condition (10% UV) in kWh, EOV is total energy losses in under voltage condition (10% OV) in kWh, n-number of samples, x-process time in hours, yNom-power losses under nominal condition (0% VV) in watts, yUV is power losses in under voltage condition (10% UV) in watts, YOV is power losses in over voltage condition (10% OV) in watts (Fig. 12).
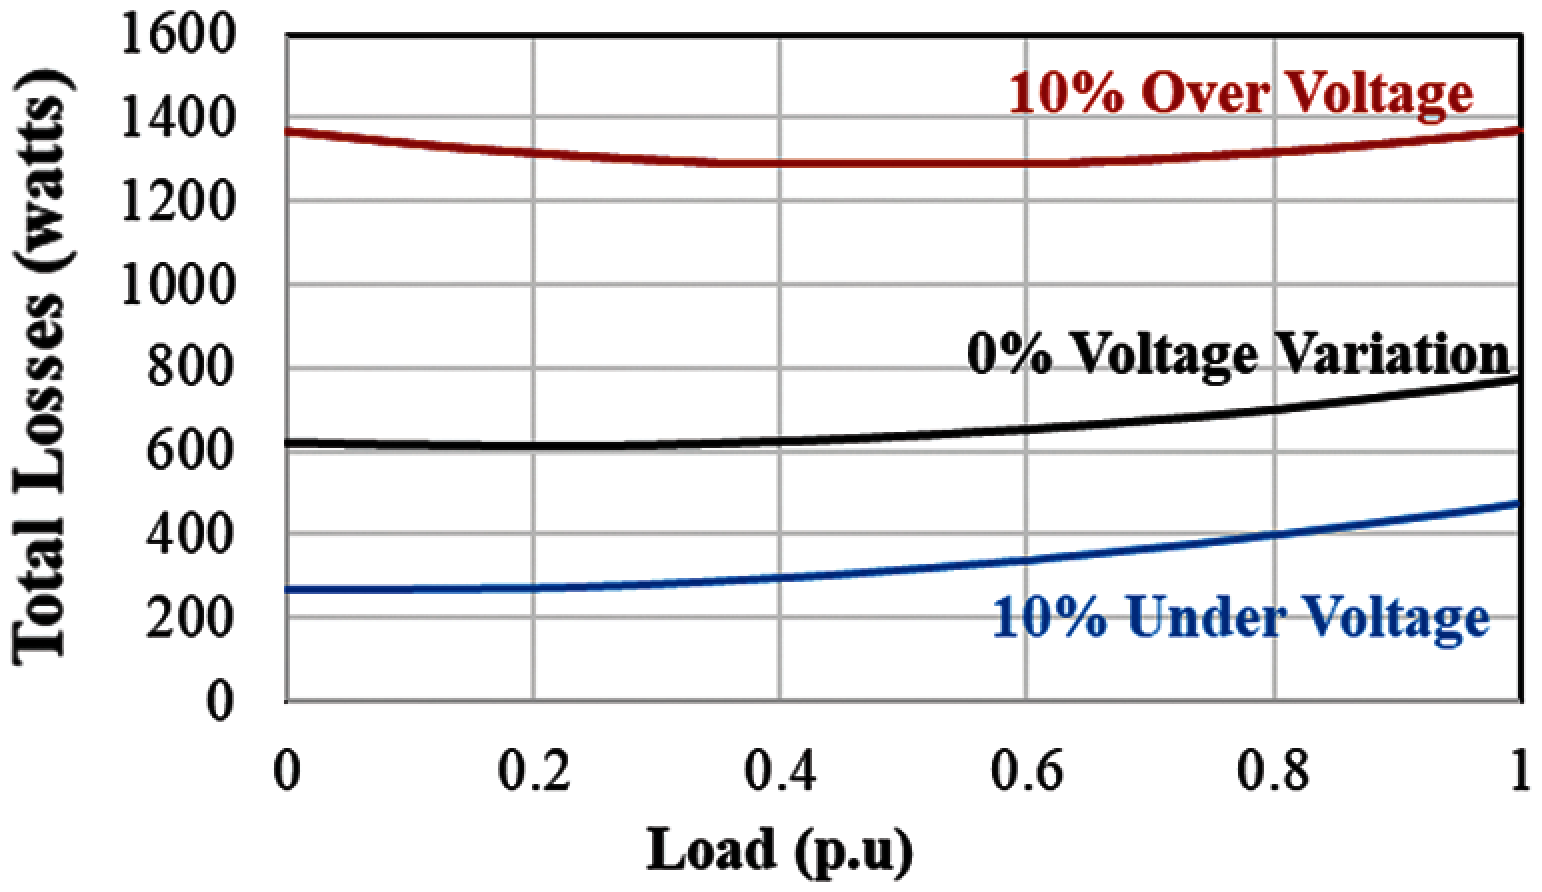
Figure 12: Total losses under different voltages
In this part, a spinning machine in the textile industry is considered and studied in terms of energy conservation analysis. The textile mill uses a variety of processes such as combing, carding, spinning, and so on, with the spinning process accounting for 50% of overall energy consumption [6]. The spinning process, depicted in Fig. 11a, is a mechanized method of obtaining thread from cotton fibers. As shown in Fig. 11b, the amount of thread on the spindle increases slightly from zero to the maximum permissible limit during this operation. As a result, the load on the spinning drive motor grows exponentially from very light to rated value.
Taking the process cycle of the spinning frame in a textile manufacturing driven with 9.2 kW. From the results, noted that the machine with 10 percent over voltage creates 18,93,672 kW losses per year, which is almost 101.4 percent losses increased from the nominal value. Whereas, the AM with 10 percent under voltage creates 4,80,217 kW losses per year, which is almost 48.9 percent losses decreased from the nominal value.
A detailed analysis of the AM under the effect of power quality perturbations of 10% overvoltage and 10% under voltage was done. The effect of variation in voltage on the various performance variables and the distribution of magneto-static quantities in the airgap and cross-section have been studied in detail. Further, sensitivity function was used to determine the sensitivity analysis of the performance parameters like input power, efficiency, current, power factor, torque, power factor, output power, cage, iron, stator winding, and total loss of AM corresponding to voltage variations by using FEA simulations with the help of motor analysis tool in MATLAB. By sensitivity analysis, the impact of parameter variations in IM is analyzed. The 10% UV and 10% OV have a considerable effect on almost all performance variables. The AM is worst affected by 10% OV than 10% UV. An overall view of the AM behavior was acquired, and the results of the analysis are very useful in the design of an AM that can withstand the expected variation of the parameter, which in turn can lead to giving the best performance, long machine life, less machine damage to AM and satisfy the load for various application.
Acknowledgement: This research was funded by the Deanship of Scientific Research at Princess Nourah bint Abdulrahman University through the Fast-track Research Funding Program.
Funding Statement: This research was funded by the Deanship of Scientific Research at Princess Nourah bint Abdulrahman University through the Fast-track Research Funding Program.
Conflicts of Interest: The authors declare that they have no conflicts of interest to report regarding the present study.
1. F. Z. Dekhandji, H. Bentarzi and A. Recioui, “Effects of voltage disturbances on induction motors and adjustable speed drives,” in 2015 4th Int. Conf. on Electrical Engineering, ICEE 2015, Boumerdes, Algeria, pp. 1–4, 2016.
2. A. Aderibigbe, A. Ogunjuyigbe, R. Ayodele and I. Samuel, “The performance of a 3-phase induction machine under unbalance voltage regime,” Journal of Engineering Science and Technology Review, vol. 10, no. 5, pp. 136–143, 2017.
3. IEEE Std 1159, “IEEE recommended practice for monitoring electric power quality,” in IEEE Std 1159-2019, (Revision of IEEE Std 1159-2009pp. 1–98, 2019.
4. R. Raja Singh, C. Thanga Raj, R. Palka, V. Indragandhi, W. Marcin et al., “Energy optimal intelligent switching mechanism for induction motors with time varying load,” IOP Conference Series: Materials Science and Engineering, vol. 906, no. 1, pp. 1–19, 2020.
5. H. Khreis, A. Deflorio, W. L. Lee, M. R. de Larramendi and B. Schmuelling, “Sensitivity analysis for induction machine manufacturing tolerances: Modeling of electrical parameters deviation,” in 2017 12th Int. Conf. on Ecological Vehicles and Renewable Energies, EVER 2017, Monte-Carlo, Monaco, pp. 1–9, 2017.
6. M. Carbonieri, N. Bianchi and L. Alberti, “Direct analysis of induction motor using finite element,” in IEEE Energy Conversion Congress and Exposition (ECCEPortland, USA, pp. 277–283, 2018.
7. P. G. Kini and R. C. Bansal, “Effect of voltage and load variations on efficiencies of a motor-pump system,” IEEE Trans Energy Convers, vol. 25, no. 2, pp. 287–292, 2010.
8. V. Kuptsov, P. Fajri, A. Trzynadlowski, Z. Guoliang and S. Magdaleno-Adame “Electromagnetic analysis and design methodology for permanent magnet motors using motor analysis-PM software,” Machines, vol. 7, no. 4, pp. 1–18, 2019.
9. S. Husach, R. Yatsiuk and D. Mamchur, “Induction motors operation condition evaluation and damage degree estimation methods,” 2020 IEEE Problems of Automated Electro Drive. Theory and Practice (PAEPKremenchuk, Ukraine, pp. 1–4, 2020.
10. S. Sridhar, K. U. Rao and S. J. Sukrutha, “Detection and classification of power quality disturbances in the supply to induction motor using wavelet transform and neural networks,” Balkan Journal of Electrical and Computer Engineering, vol. 4, no. 1, pp. 37–43, 2015.
11. A. A. Adam, Y. Haroen, A. Purwadi and A. S. Rohman, “A study of a three phase induction motor performances controlled by indirect vector and predictive torque control,” in Proceeding-2018 5th Int. Conf. on Electric Vehicular Technology, ICEVT 2018, Surakarta, Indonesia, pp. 204–209, 2018.
12. D. Bhowmick, M. Manna and S. K. Chowdhury, “Online estimation and analysis of equivalent circuit parameters of three phase induction motor using particle swarm optimization,” in IEEE 7th Power India Int. Conf., PIICON 2016, Bikaner, pp. 1–5, 2016.
13. H. H. Hanafy, T. M. Abdo and A. A. Adly, “2D finite element analysis and force calculations for induction motors with broken bars,” Ain Shams Engineering Journal, vol. 5, no. 5, pp. 421–431, 2014.
14. M. Ghaseminezhad, A. Doroudi, S. H. Hosseinian and A. Jalilian, “An investigation of induction motor saturation under voltage fluctuation conditions,” Journal of Magnetics, vol. 22, no. 2, pp. 306–314, 2017.
15. S. I. Shahl, “Simulation model for analysis the induction motor starting methods in term of electrical power quality,” International Journal of Scientific & Engineering Research, vol. 9, no. 7, pp. 816–820, 2018.
16. A. Dalcali and M. Akbaba, “Comparison of 2D and 3D magnetic field analysis of single-phase shaded pole induction motors,” Engineering Science and Technology, An International Journal, vol. 19, no. 1, pp. 1–7, 2016.
17. P. Monk and Y. Zhang, “Finite element methods for Maxwell's equations,” arXiv, vol. 1, pp. 1–17, 2019.
18. T. Liu, M. Jiang, D. Zhang, H. Zhao and F. Shuang, “Effect of symmetrical voltage sag on induction motor considering phase-angle factors based on a new 2-d multi-slice time-stepping finite element method,” IEEE Access, vol. 8, pp. 75946–75956, 2020.
19. G. Starke, “Gauss–Newton multilevel methods for least-squares finite element computations of variably saturated subsurface flow,” Computing, vol. 64, no. 4, pp. 323–338, 2000.
20. R. K. Gupta, M. Sreejeth and M. Singh, “Sensitivity analysis of induction motor performance variables,” in IEEE 1st Int. Conf. on Power Electronics, Intelligent Control and Energy Systems (ICPEICESIndia, pp. 1–6, 2016.
 | This work is licensed under a Creative Commons Attribution 4.0 International License, which permits unrestricted use, distribution, and reproduction in any medium, provided the original work is properly cited. |