DOI:10.32604/cmc.2022.019354
| Computers, Materials & Continua DOI:10.32604/cmc.2022.019354 | |
| Article |
Efficient Deep CNN Model for COVID-19 Classification
1Department Electronics and Electrical Communications, Faculty of Electronic Engineering, Menoufia University, Menouf, 32952, Egypt
2Security Engineering Lab, Computer Science Department, Prince Sultan University, Riyadh, 11586, Saudi Arabia
3Department of Computer Engineering, College of Computers and Information Technology, Taif University, Taif, 21944, Saudi Arabia
4Department of Information Technology, College of Computer and Information Sciences, Princess Nourah Bint Abdulrahman University, Riyadh, 84428, Saudi Arabia
*Corresponding Author: Walid El-Shafai. Email: eng.waled.elshafai@gmail.com
Received: 11 April 2021; Accepted: 18 June 2021
Abstract: Coronavirus (COVID-19) infection was initially acknowledged as a global pandemic in Wuhan in China. World Health Organization (WHO) stated that the COVID-19 is an epidemic that causes a 3.4% death rate. Chest X-Ray (CXR) and Computerized Tomography (CT) screening of infected persons are essential in diagnosis applications. There are numerous ways to identify positive COVID-19 cases. One of the fundamental ways is radiology imaging through CXR, or CT images. The comparison of CT and CXR scans revealed that CT scans are more effective in the diagnosis process due to their high quality. Hence, automated classification techniques are required to facilitate the diagnosis process. Deep Learning (DL) is an effective tool that can be utilized for detection and classification this type of medical images. The deep Convolutional Neural Networks (CNNs) can learn and extract essential features from different medical image datasets. In this paper, a CNN architecture for automated COVID-19 detection from CXR and CT images is offered. Three activation functions as well as three optimizers are tested and compared for this task. The proposed architecture is built from scratch and the COVID-19 image datasets are directly fed to train it. The performance is tested and investigated on the CT and CXR datasets. Three activation functions: Tanh, Sigmoid, and ReLU are compared using a constant learning rate and different batch sizes. Different optimizers are studied with different batch sizes and a constant learning rate. Finally, a comparison between different combinations of activation functions and optimizers is presented, and the optimal configuration is determined. Hence, the main objective is to improve the detection accuracy of COVID-19 from CXR and CT images using DL by employing CNNs to classify medical COVID-19 images in an early stage. The proposed model achieves a classification accuracy of 91.67% on CXR image dataset, and a classification accuracy of 100% on CT dataset with training times of 58 min and 46 min on CXR and CT datasets, respectively. The best results are obtained using the ReLU activation function combined with the SGDM optimizer at a learning rate of 10−5 and a minibatch size of 16.
Keywords: COVID-19; image classification; CNN; DL; activation functions; optimizers
The epidemic of COVID-19, which appeared in Wuhan city in China, results in pneumonia with fever and cough as the main indications of infection. A study performed on CT images to detect the disease infection proved that the detection rate from CT images is better than that from the RT-PCR. So, a chest CT scan was recommended [1–5].
Classification is an essential process in learning tasks, and it is a fundamental problem in the recognition area, which aims to classify medical images into several different categories. The classification of medical images includes two main steps. Firstly, the most helpful image features are extracted. Secondly, these features are used in building the models for dataset classification. Usually, specialists use their feature extraction experience to categorize medical images into different categories, making the classification sometimes tricky and time-wasting. Recently, DL has arisen due to its high quality and vast application domains in several research areas, especially for classifying medical images since pre-processing or feature extraction is not required before training the model. A CNN is one of the latest progressions in machine learning (ML) area. It can be used for the analysis of medical images.
With the massive growth of neural networks and DL, finding an optimum model architecture for each application is necessary. Much work has been carried out to achieve the desired performance level and to obtain the best accuracy in any classification task. Activation layers such as Sigmoid, Tanh, and ReLU define the non-linearity of the neuron output [6,7]. A CNN comprises several layers ordered as the input layer, convolution layer, activation layer, fully-connected layer, classification layer, and output layer. Moreover, as machine learning algorithms are optimized, a significant improvement in their performance can be achieved. Therefore, finding a suitable activation function and optimizer are basic tasks [6,7].
The objective of this work is to carry out comparisons between different activation functions and different optimizers for the classification of CXR and CT image datasets for COVID-19 detection. The CNNs have proved efficient performance in the classification of medical images. Therefore, this paper presents a CNN model for COVID-19 detection from CXR and CT images with a new training strategy. This strategy depends on the proper selection of the optimizer and the activation function. The rest of this paper is structured as follows. Section 2 summarizes the related work in this field. Section 3 gives short notes about the CNN. Section 4 describes the materials and methods used in the paper. Section 5 illustrates the proposed model architecture. Section 6 shows the experimental results and discussions. Section 7 provides the conclusions.
The World Health Organization (WHO) has stated that COVID-19 rapidly spread in several countries worldwide. Early detection of COVID-19 cases can significantly control the spread of this virus. Much work has been performed on this topic due to its importance. This paper depends on DL to automatically detect COVID-19 from CXR and CT images. The performance of different classifiers is investigated to determine the optimum one [1–3]. The CXR and CT images can be used to detect COVID-19 cases. The CNN is one of the most popular and effective tools that identify COVD-19 from medical images [1–3]. Several review studies have been presented to highlight recent contributions to COVID-19 detection [8–16]. Several works used radiology images to identify and classify COVD-19 cases. Zheng et al. [13] proposed a DL model to classify pneumonia. Xu et al. [14] presented a model to classify pneumonia from CXR images based on compressed sensing (CS) with a deep transfer learning model. Sethy et al. [17] used the SVM classifier to classify the features acquired from several CNN models applied on CXR images. They achieved the best performance using the ResNet50 model with SVM.
Wang et al. [18] suggested transfer learning model called COVID-Net to detect COVID-19 from CXR images. Their model achieved 92.4% accuracy for three classes: Normal, Non-COVID pneumonia, and COVID-19. Hemdan et al. [19] applied DL models to detect COVID-19 from CXR images and suggested a model called COVIDXNet. Their model achieved a 0.95 AUC value and a 0.96 sensitivity. Additionally, there is an online service to diagnose COVID-19 from CT images [20]. Wang et al. [21] used a CNN based on the Inception network model to identify COVID-19 cases from CT images. Ioannis et al. [22] proposed a DL model using 224 confirmed COVID-19 images. The authors of [23] proposed a model to classify COVID-19, influenza, and healthy CT image cases. Their model achieved an accuracy of 86.7%. In [24], the authors proposed a learning model to separate the main features in CT images in a pre-processing stage. Their model achieved accuracies of 89.5% and 79.3% with and without the pre-processing stage, respectively. Ozturk et al. [25] suggested a model that classifies CXR COVID-19 images. Their model has been applied to classify three main classes: COVID, No-COVID, and pneumonia, and achieved a classification accuracy of 87.02%. Alsharman et al. [26] used CNNs to classify CT COVID-19 images. They used a pretrained Google-Net CNN architecture and achieved an accuracy of 82.14%.
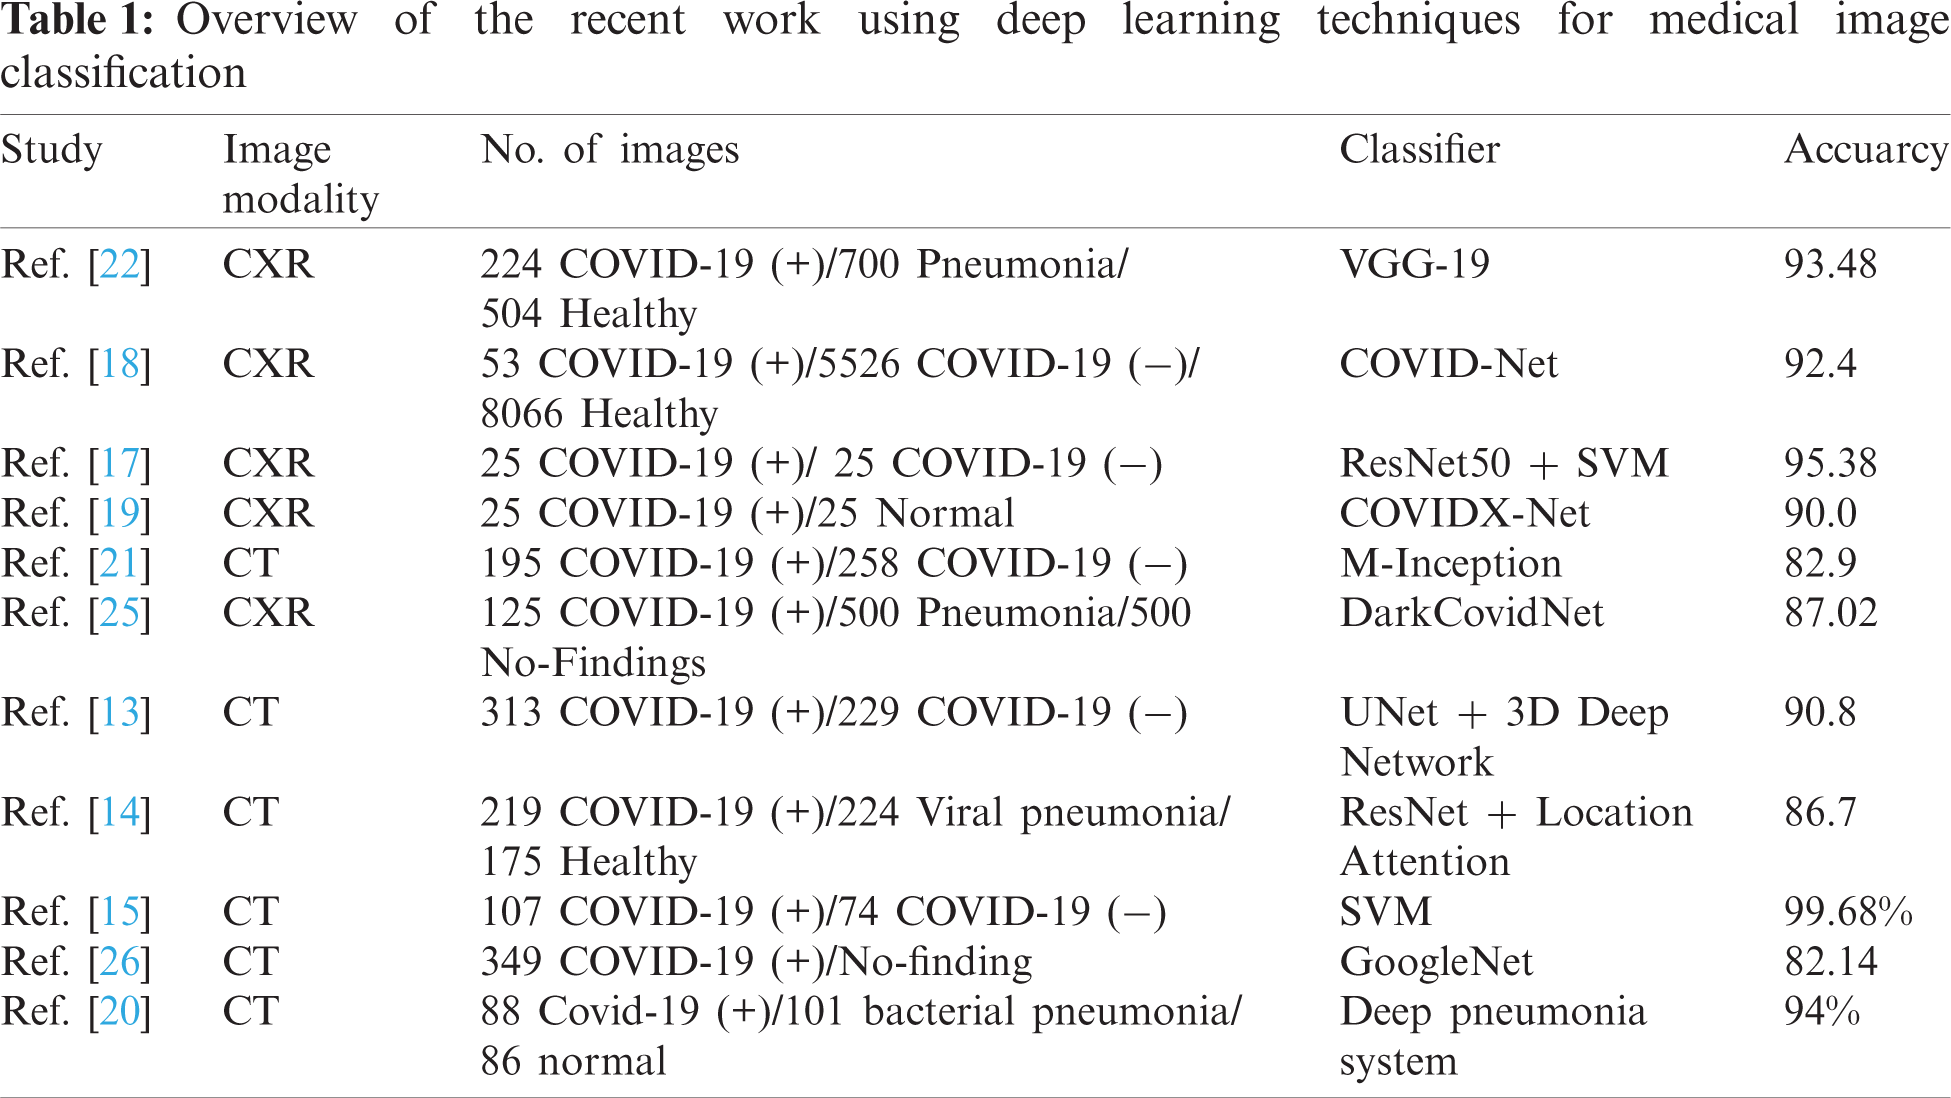
The DL growth has a significant effect on the medical field due to the better ability to classify medical images. Several image classification techniques can give radiologists another opinion. The recent research works on medical image classification are summarized in Tab. 1.
In this paper, a DL model is presented to classify COVID-19 CXR and CT images. The proposed model has been trained from scratch without using any feature extraction approaches. It has been trained with 1000 CXR and 1000 CT medical images. One of the essential advantages of well-trained DL models is that they can extract features that are not apparent to the human eye. Hence, accurate classification can be performed.
3 Convolutional Neural Networks (CNNs)
Recently, DL has arisen due to its efficiency in a variety of application domains in several research areas, especially for classifying medical images since pre-processing or feature extraction is not required before the training process. The CNN has gained a significant importance, and it was utilized in most of the state-of-the-art applications. They were extensively used to detect and identify diseases in different medical images. The main difference between a CNN and an ANN is that the CNN has a large number of hidden layers. So, the CNN constitutes a deep architecture. It consists of several stacked layers ordered as input layer, convolution layer, pooling layers, activation layer, fully-connected layer, classification layer, and output layer.
The input layer enhances the image using pre-processing such as normalization and scaling. The convolution layer convolves the image with several suitably adjusted filters. This convolution results in feature maps. Then, the pooling layers are used to minimize the dimensions of the generated feature maps. Pooling is carried out using a window with a proper stride. Either max-pooling or average pooling is used. In max pooling, the maximum value is chosen.
On the other hand, in average pooling, the average value is estimated and used. The activation functions define the non-linearity of the model. Finally, the fully-connected layer is the output layer that clarifies the classification result using the SoftMax classifier to determine the image class.
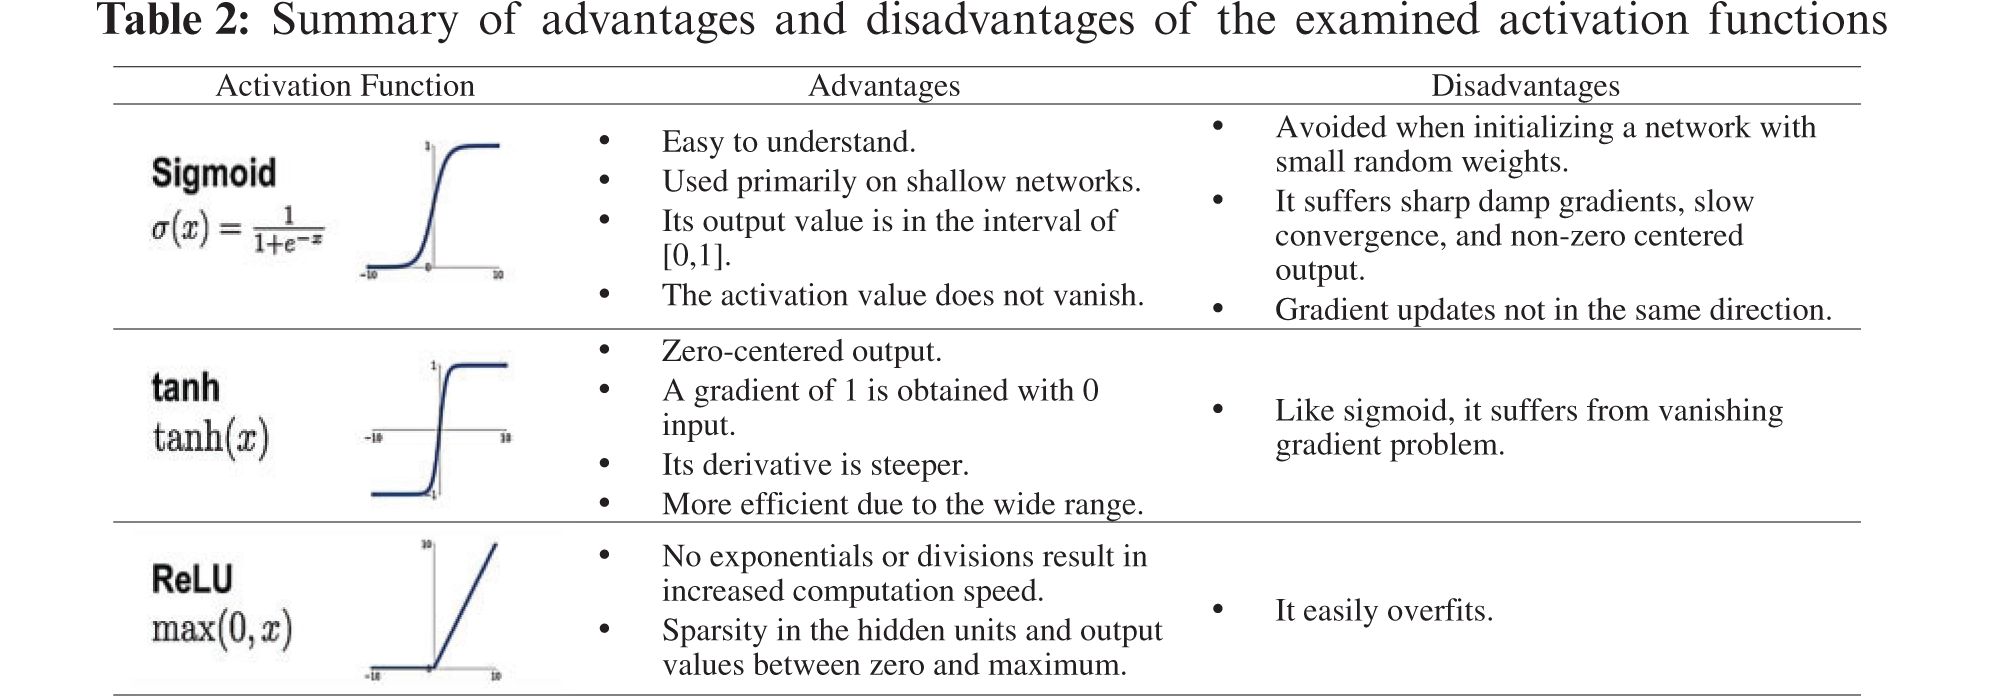
The appropriate activation functions must be carefully chosen, because they significantly affect the neural network performance. The main target of activation functions is that they provide non-linearity to their input. There are three famous activation functions, namely, Sigmoid, Tanh, and ReLU. These functions are used and studied in this work. They are summarized as follows:
• Logistic Curve (Sigmoid)
The Sigmoid function is defined as follows:
The sigmoid activation function converts its input range from [−∞; +∞] to [0; 1]. The main disadvantage of the sigmoid is that it is computationally expensive, and it cannot solve the problem of vanishing gradients.
• Hyperbolic Tangent (Tanh)
The Tanh is a non-linear function. It converts the range of the input to [−1, 1]. It can be defined as:
An advantage is that Tanh has steeper derivatives than the sigmoid function. On the other hand, it cannot solve the vanishing gradient problem.
• Rectified Linear Units (ReLU)
The ReLU is the most common activation function, and is the mostly-used one. Using the ReLU function in a model makes it easier to train and often achieve better performance. The ReLU function is defined as follows:
The main advantage of the ReLU function is that it contains no exponential terms or divisions, which results in increased the computation speed. However, it easily overfits. The benefits and limitations of different employed activation functions examined through the simulation tests are summarized in Tab. 2.
• Stochastic Gradient Descent with Momentum (SGDM)
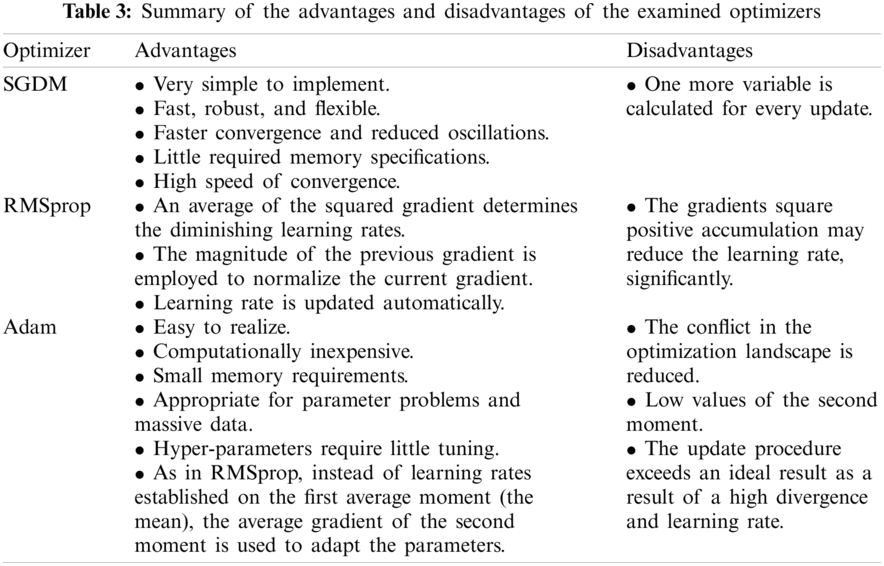
Optimization of the model greatly contributes to minimizing the loss function. The SGDM is one of the powerful and most-commonly used optimizers. It is an improvement of the SGD optimizer. It depends on the current gradient and the past momentum to estimate the momentum in each dimension. It also accumulates the gradient of the past steps to determine the direction to go. The SGDM optimizer saves the update at each iteration and decides the following update as a function of the current gradient and the previous momentum update.
This leads to:
where
• Root Mean Square Propagation (RMSprop)
Another optimizer is the RMSprop, which also breaks the learning rate using the average exponential decay of squared gradients. It depends on the momentum to minimize the loss function relatively faster. Like momentum, the RMSprop also tries to decrease the oscillations using another method. It automatically adjusts the learning rate by choosing a different one for each parameter. It calculates the running average using the mean square error. It also depends on the past gradient to estimate the learning rate.
where γ is the forgetting factor, and the updated parameters are given as:
• Adaptive Moment (Adam)
Adam algorithm merges the properties of momentum and some of the benefits of the RMSprop. Adam optimizer determines the adaptive learning rates for each parameter. Like momentum, Adam optimizer retains an exponential decay average of the past gradient descent
The Adam optimizer update rule is given by:
where
This motivation of this work is to offer a proposed simple deep CNN structural design for categorizing and classifying COVID-19 and Non-COVID-19 cases. This section describes all datasets used in this paper. In this study, simulation experiments are conducted on 1000 chest CXR and 1000 CT images of COVID-19 and Non-COVID-19 obtained from the open-source Mendeley datasets [29].
The dataset is divided into a 70% training set and a 30% validation set. The partitioned datasets of the training and testing help in data cross-validation. The cross-validation checks whether the suggested classifier precisely classifies the normal vs. COVID-19 images or not. A sample of employed datasets is shown in Fig. 1.
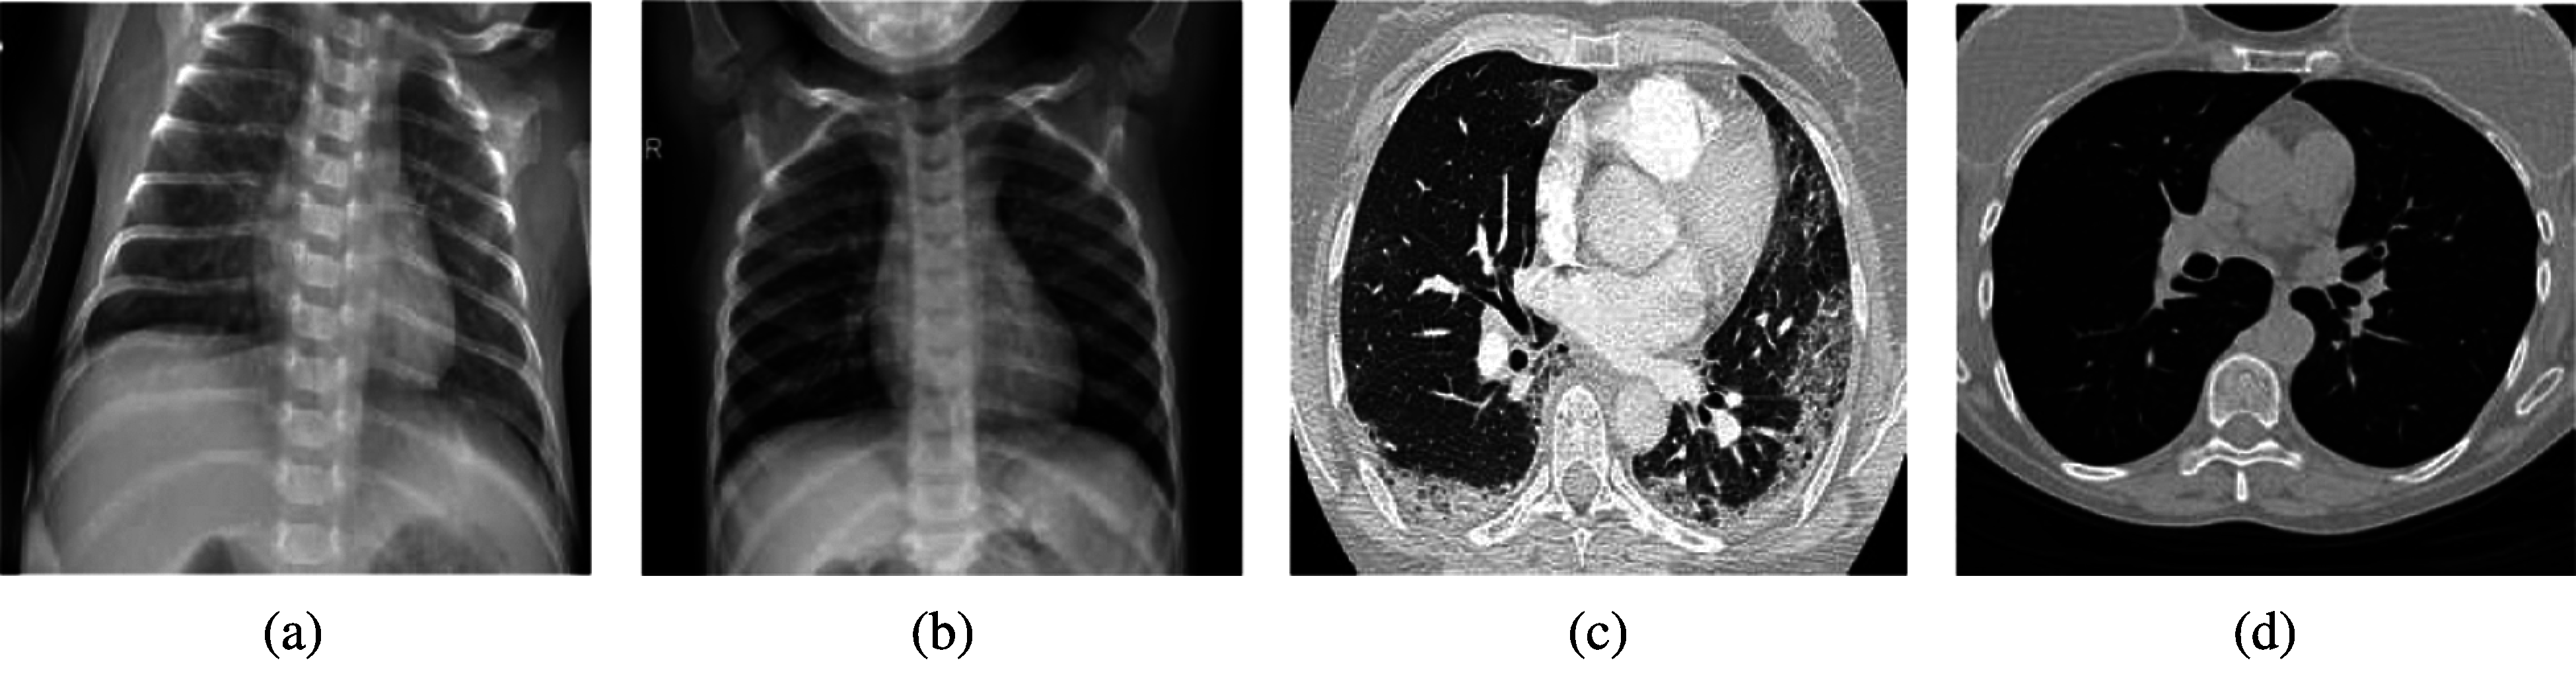
Figure 1: Samples of CXR and CT COVID-19 and non-COVID-19 images (a) CXR COVID-19 images (b) CXR non-COVID images (c) CT COVID-19 images (d) CT non-COVID images
If we examine the performance of a CNN, it is evident that the network performance is enhanced with the increase in network depth. This comes at the cost of large memory requirements. We try in the proposed deep learning model to make a trade-off between network size and network performance. The proposed CNN model is made up of 14 layers, as illustrated in Fig. 2. The input image size is 227 × 227 pixels, and it is fed into the first convolution layer that has eight filters with size 3 × 3 and stride 1. The input image is zero-padded to get the output image size the same as that of the input image size. The output is fed into the ReLU function, and finally, it is max-pooled with a window size 2 × 2 and stride of 2 to down-sample the image. These layers are followed by two similar structures. The first one depends on 16 filters of size 3 × 3 and stride one, and the second depends on 32 filters of size 3 × 3 and stride 1 also. The last max-pooling layer is eliminated. We use a SoftMax classifier to convert each class score into a probability distribution, and then use the cross-entropy as the loss function.
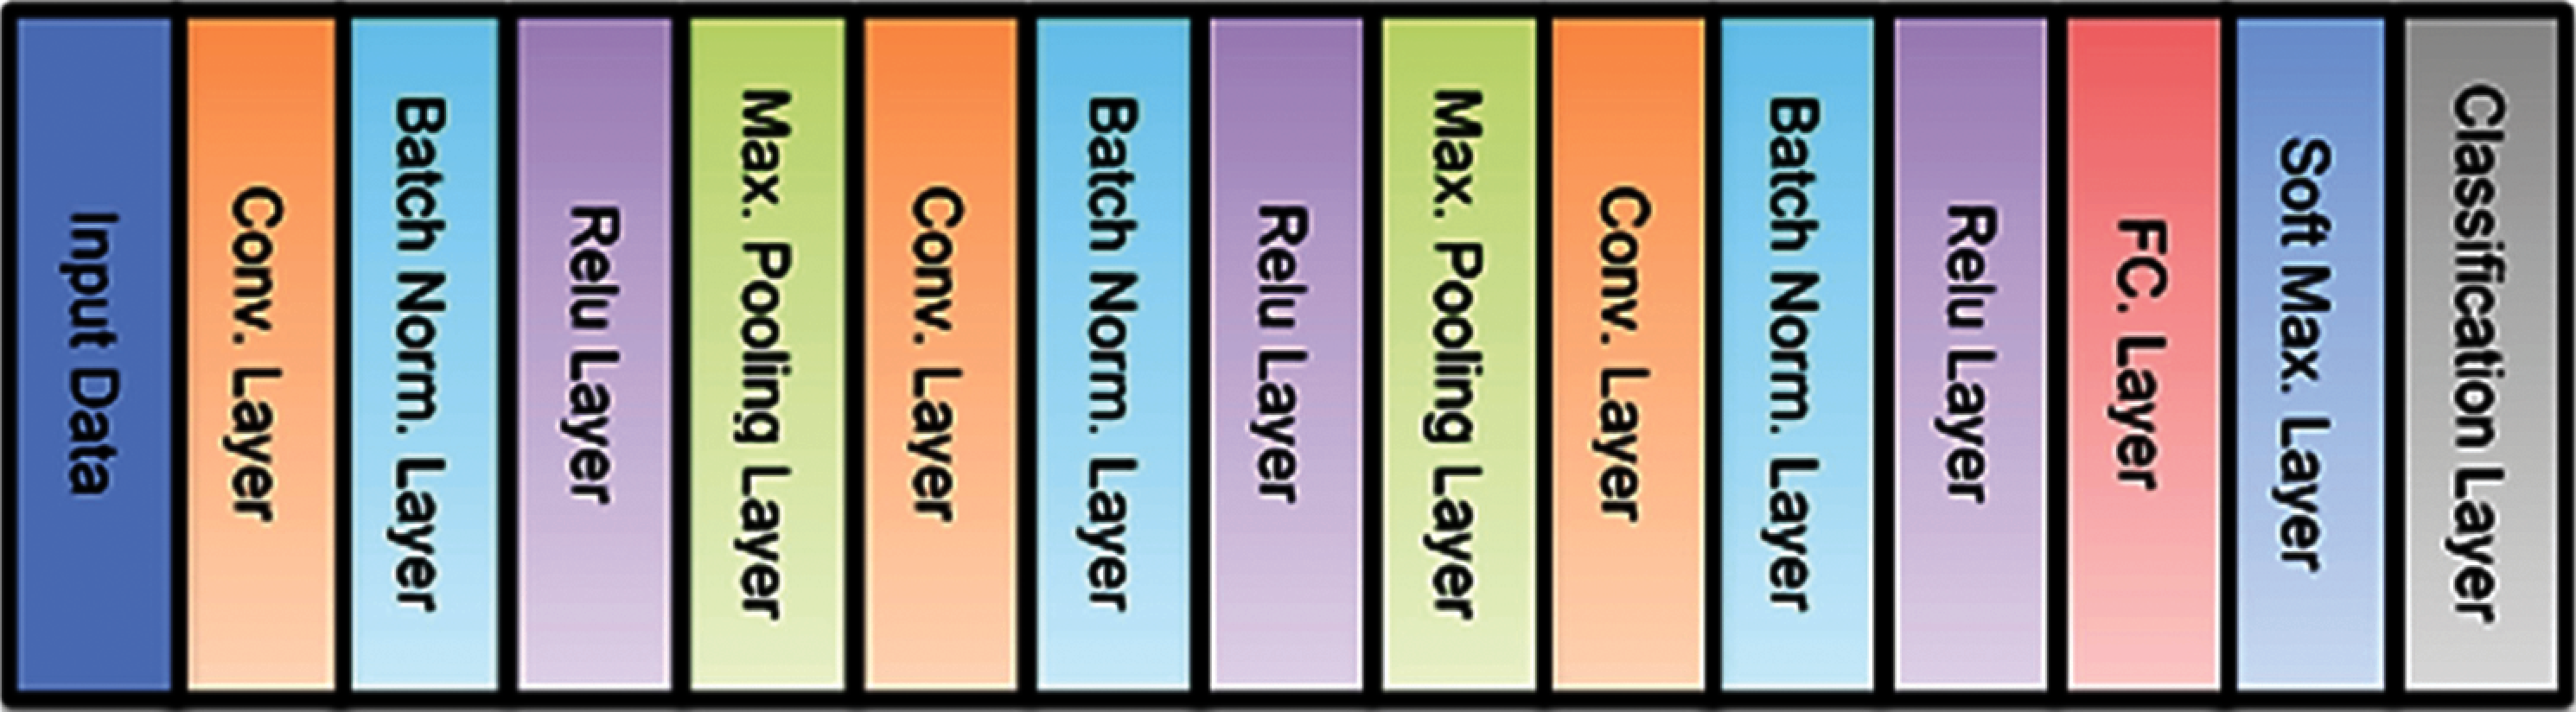
Figure 2: Proposed deep CNN model
6 Experimental Results and Discussions
To validate the suggested CNN model performance, the training procedure is repeated several times with different values of hyperparameters. Different activation functions and optimizers are tested to validate the performance of the proposed model on different CXR and CT images. In this section, the proposed CNN model is firstly trained to categorize and classify the CXR and CT medical images into two categories: COVID-19 and Non-COVID-19.
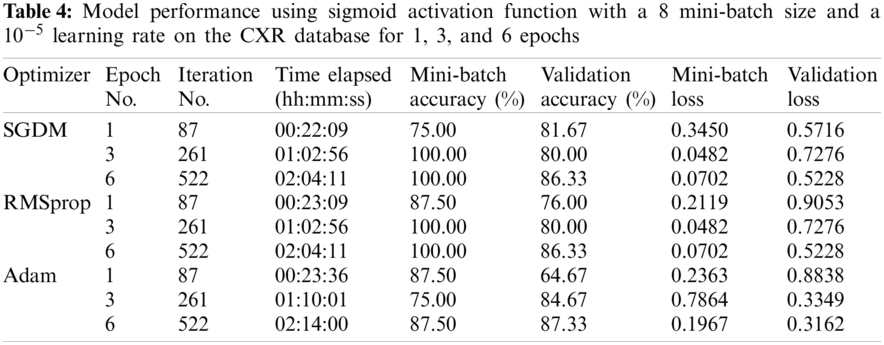
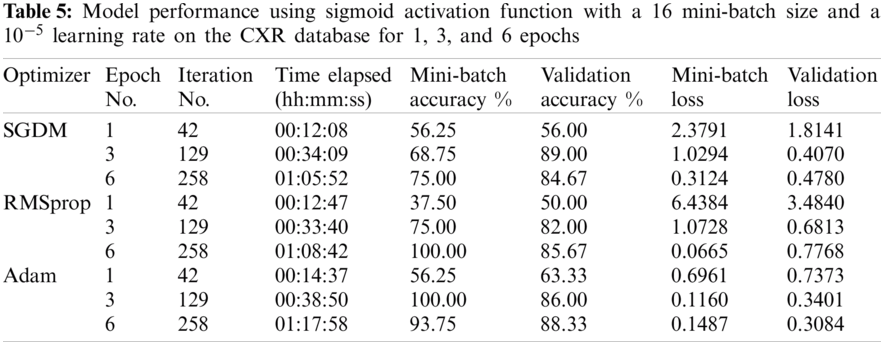
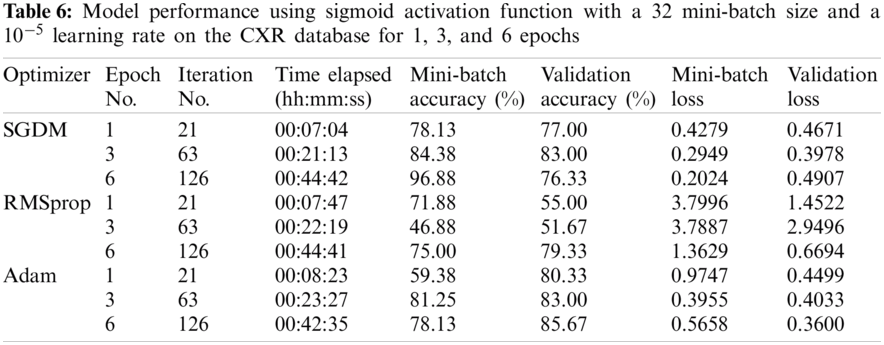
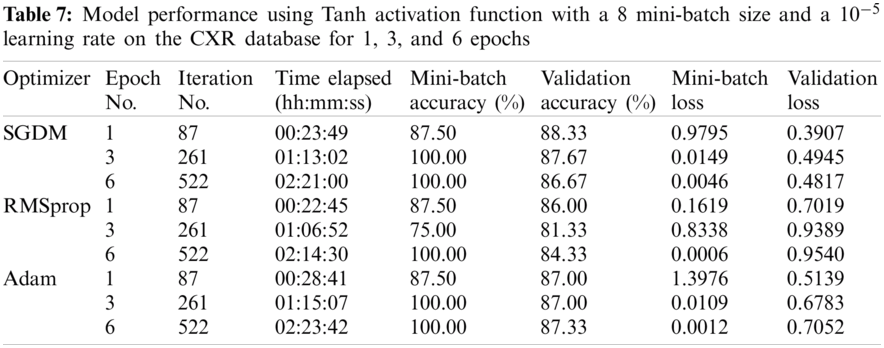
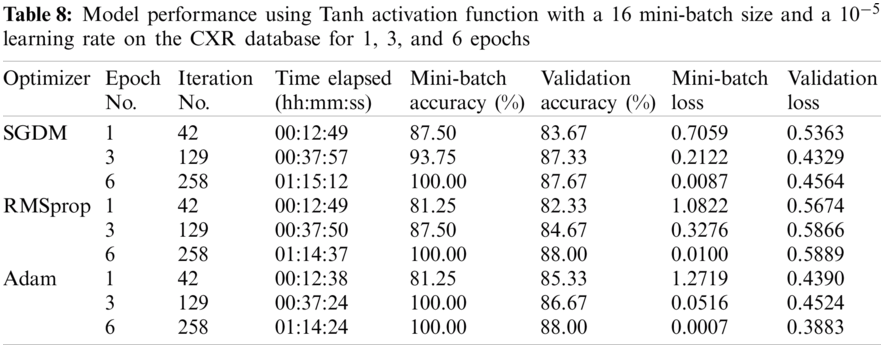
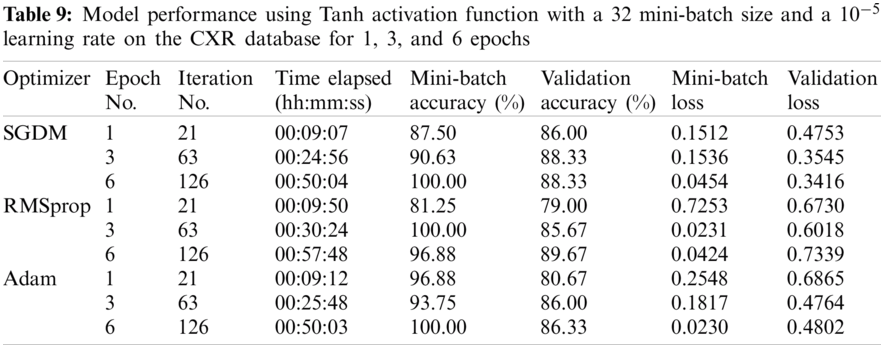
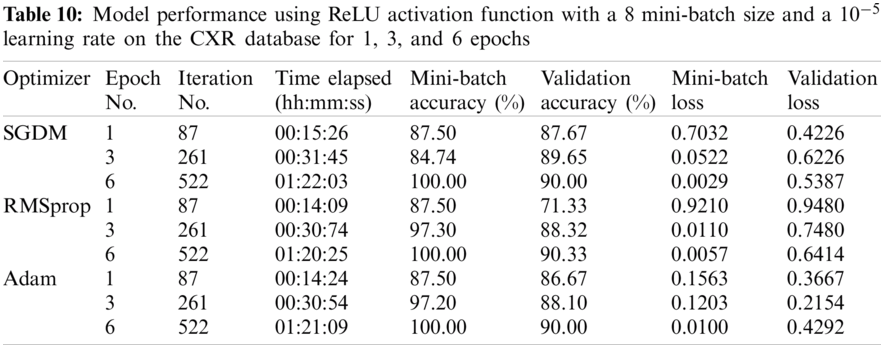
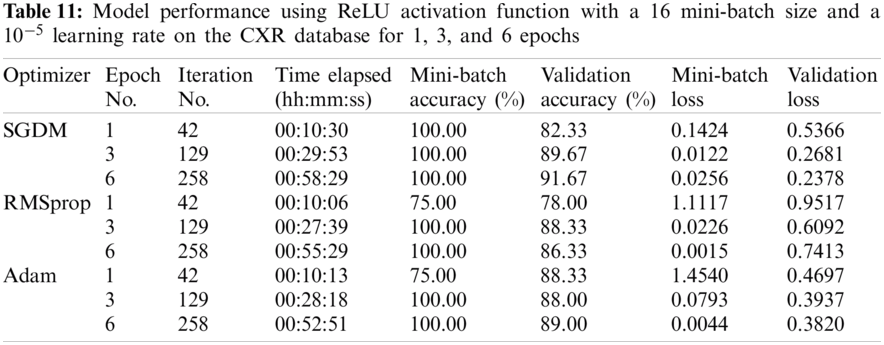
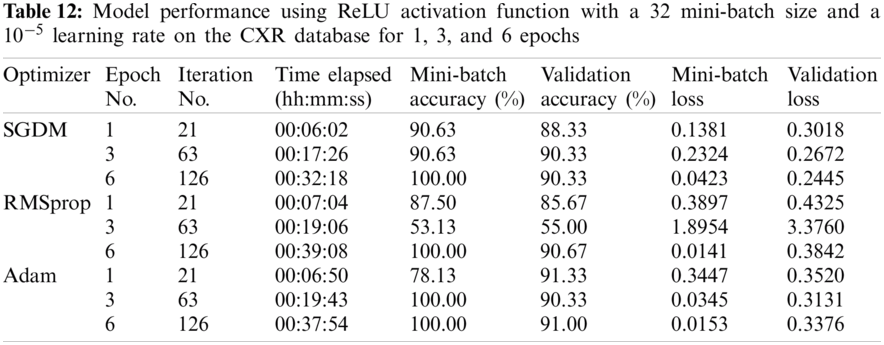
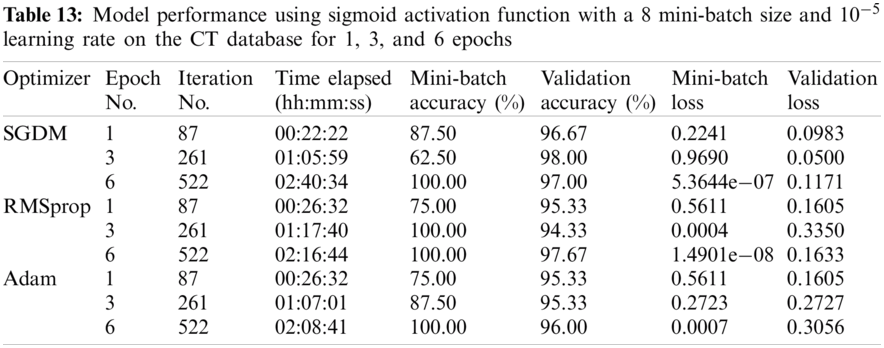
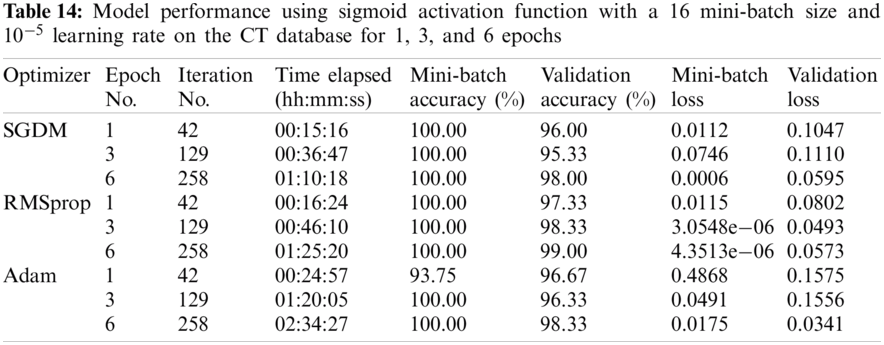
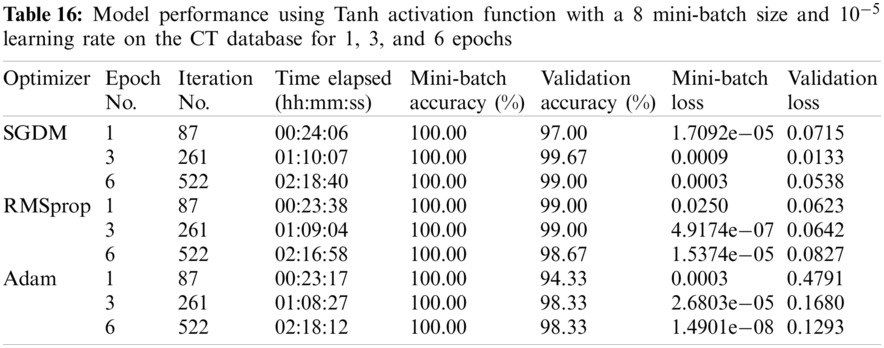
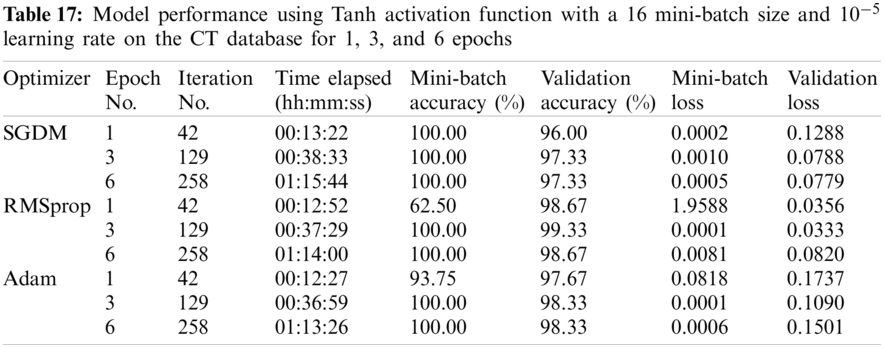
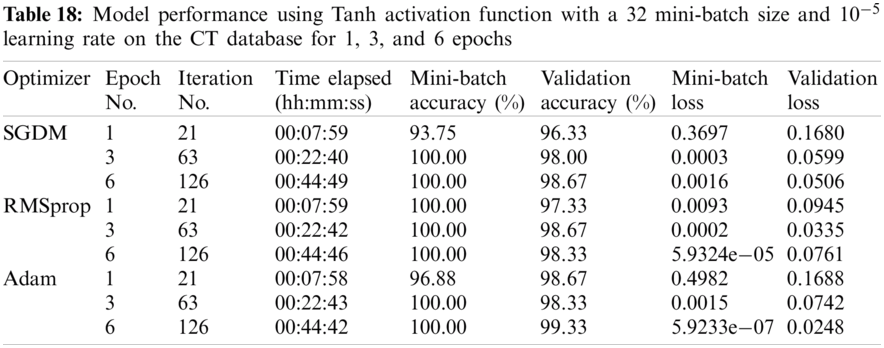
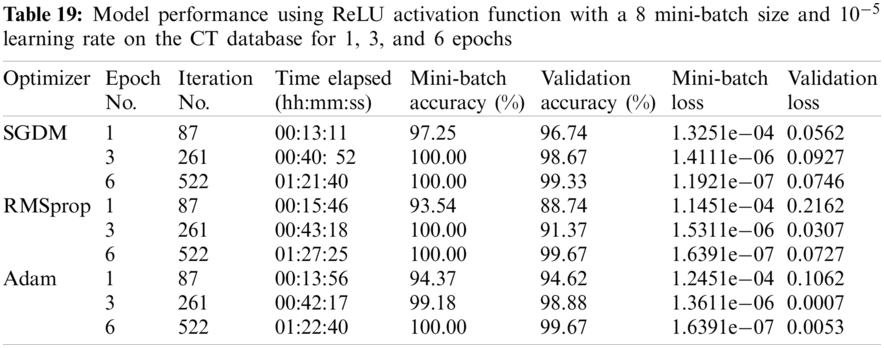
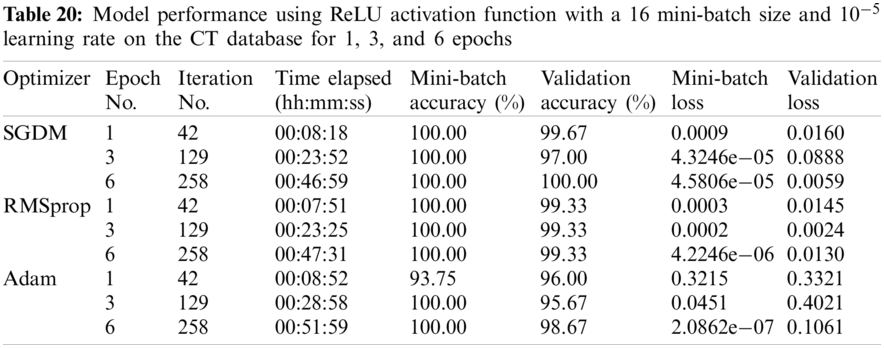
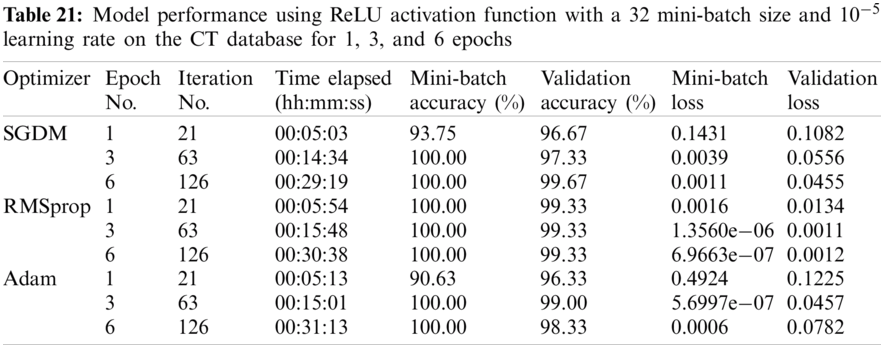
The first performed experiment is for performance comparison of different activation functions on the two used datasets. The tested neural networks are carried out for six epochs with batch sizes of 8, 16, and 32. In the first tested scenario, the analyzed neural networks are equipped with the SGDM, RMSprop, and Adam optimization techniques. The utilized learning rate is 10−5 for the three optimization algorithms. The learning rate is kept constant in the simulation tests, but the network structure and the activation functions are variable. The obtained results using the sigmoid function on the CXR dataset are shown in Tabs. 4–6, and Tabs. 13–15 for the CT database. In addition, the results of the Tanh function applied on the same dataset are shown in Tabs. 7–9 and Tabs. 16–18 for the CT database. Finally, the ReLU function results are shown in Tabs. 10–12 and Tabs. 19–21 for the CT database.
The second performed experiment is for performance comparison of the Adaptive (Adam), Root Mean Square propagation (RMSprop), and Stochastic Gradient Descent with Momentum (SGDM) optimizers at a fixed learning rate of 10−5. All neural networks run on the two datasets, using the previously mentioned activation functions. Additionally, 1, 3, and 6 epochs allow assessment by averting duplicate accuracy values and avoiding overfitting cases.
• Performance of the Proposed Model on CXR Database
• Performance of The Proposed Model on CT Database

• Finding the Optimal Configuration
In this section, the effect of combining different optimizers with activation functions is studied and analyzed for improved COVID-19 detection. So, the third experiment scenario is the performance comparison of combining different optimizers and activation functions. The CXR dataset shows that the combination of SGDM with the ReLU activation function gives the best accuracy for 16 mini-batch sizes and a learning rate of 10−5. The training process and the confusion matrix are shown in Fig. 3. Therefore, the employed neural network with a combination of the SGDM optimizer and the ReLU function work better than other combination scenarios. Thus, the SGDM/ReLU configuration can find a smaller local minimum with few epochs. Performing the same test on the CT database, it is also proved that combining the SGDM optimizer with the ReLU activation function gives the best accuracy for 16 mini-batch sizes and a 10−5 learning rate. An accuracy of 91.67% is achieved on the CXR dataset (with 93.3% Precision, 93.1% Sensitivity, and 90.3% Specificity). It is increased to 100% on the CT dataset (with 100% Precision, 100% Sensitivity, and 100% Specificity).
• Result Discussion
This paper concentrates on the benefits of using different activation functions and optimizers to build a model that can classify the COVID-19 from CXR and CT medical images. The test findings reveal that the suggested deep CNN model is very effective and helpful in discovering and classifying COVID-19 cases. It is recommended to use a CT scan, because the best classification results can be obtained on CT images. The CXR dataset can be increased in size for more improved classification accuracy. It is shown that the main advantage of the sigmoid function is that it is easy to implement on shallow networks. Its output value is in the range of 0 to 1, when the input is in the range of −∞ to +∞. Hence, the activation value does not vanish.
Conversely, the sigmoid function is not suitable, when the neural network is initialized for small weights. The Tanh function outperforms the sigmoid function as it gives a superior performance. It has a steeper derivative leading to fast learning. Similar to the sigmoid function, the Tanh function suffers from the vanishing gradient problem. Sigmoid and Tanh functions activate the majority of the neurons in the same way.
The ReLU function is preferred over the sigmoid function or Tanh function with generalized increased computation speed, since it does not depend on exponentials or divisions. However, the ReLU function has a restriction that it overfits compared to the sigmoid function.
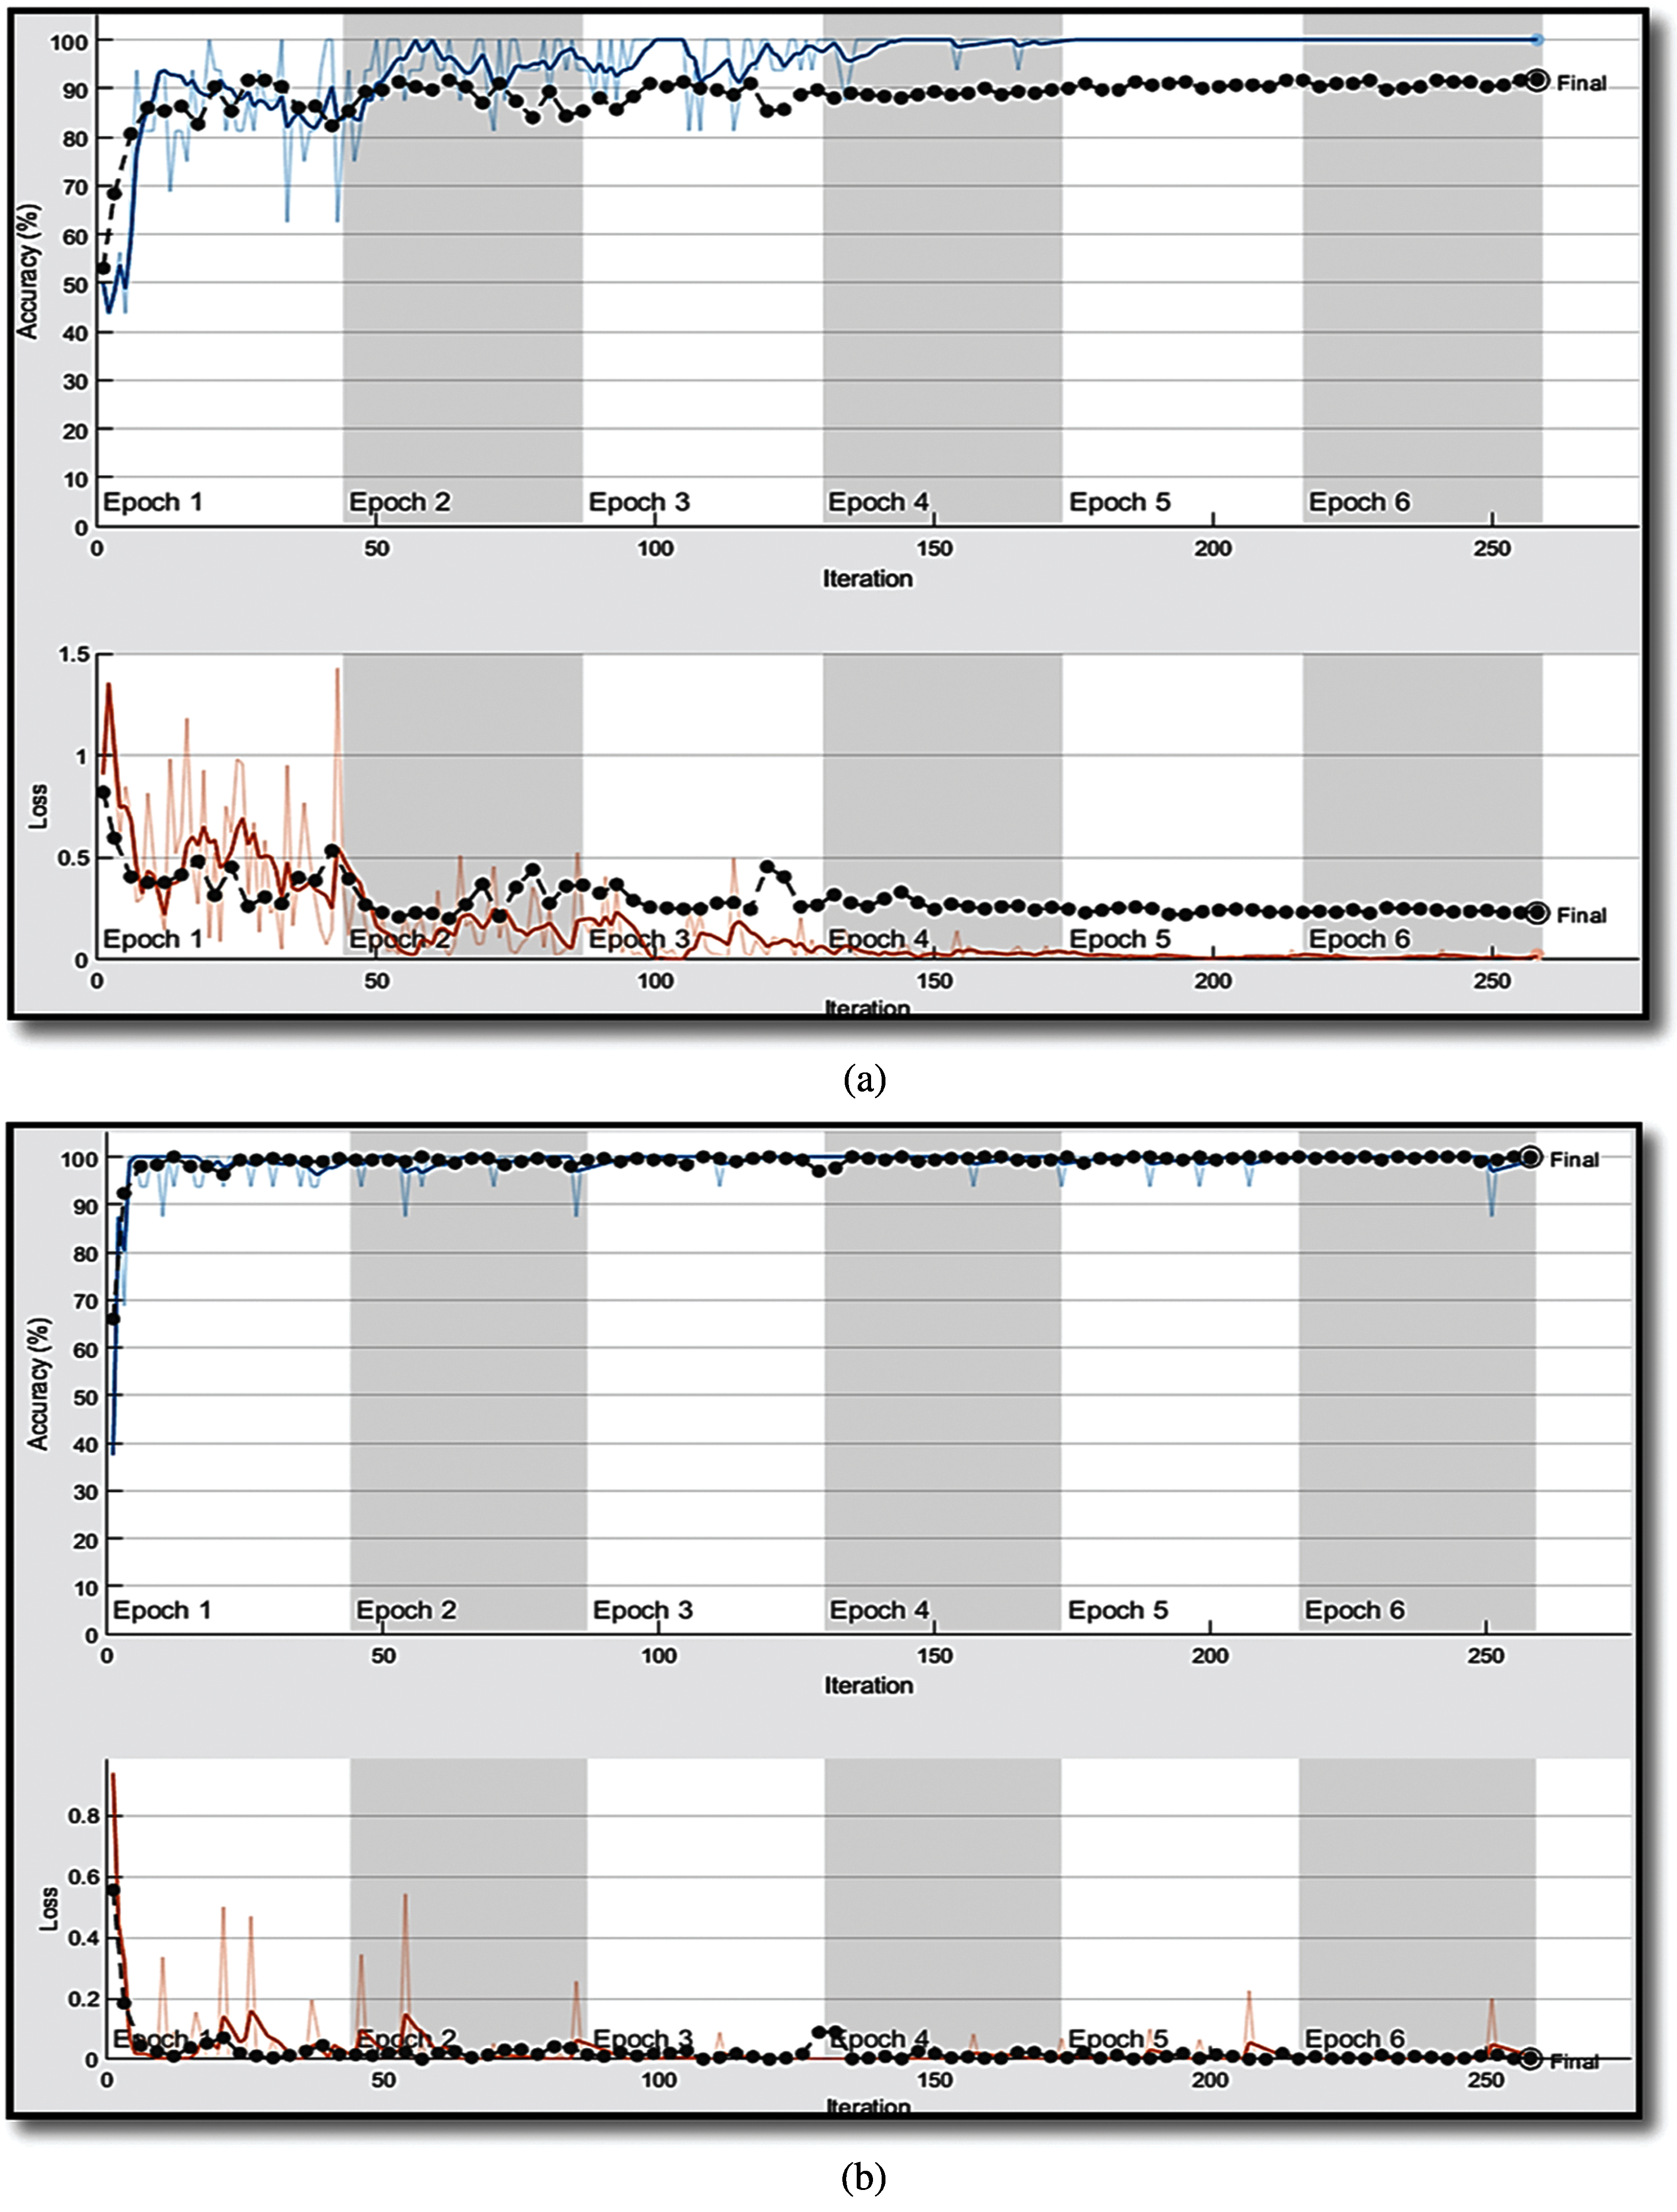
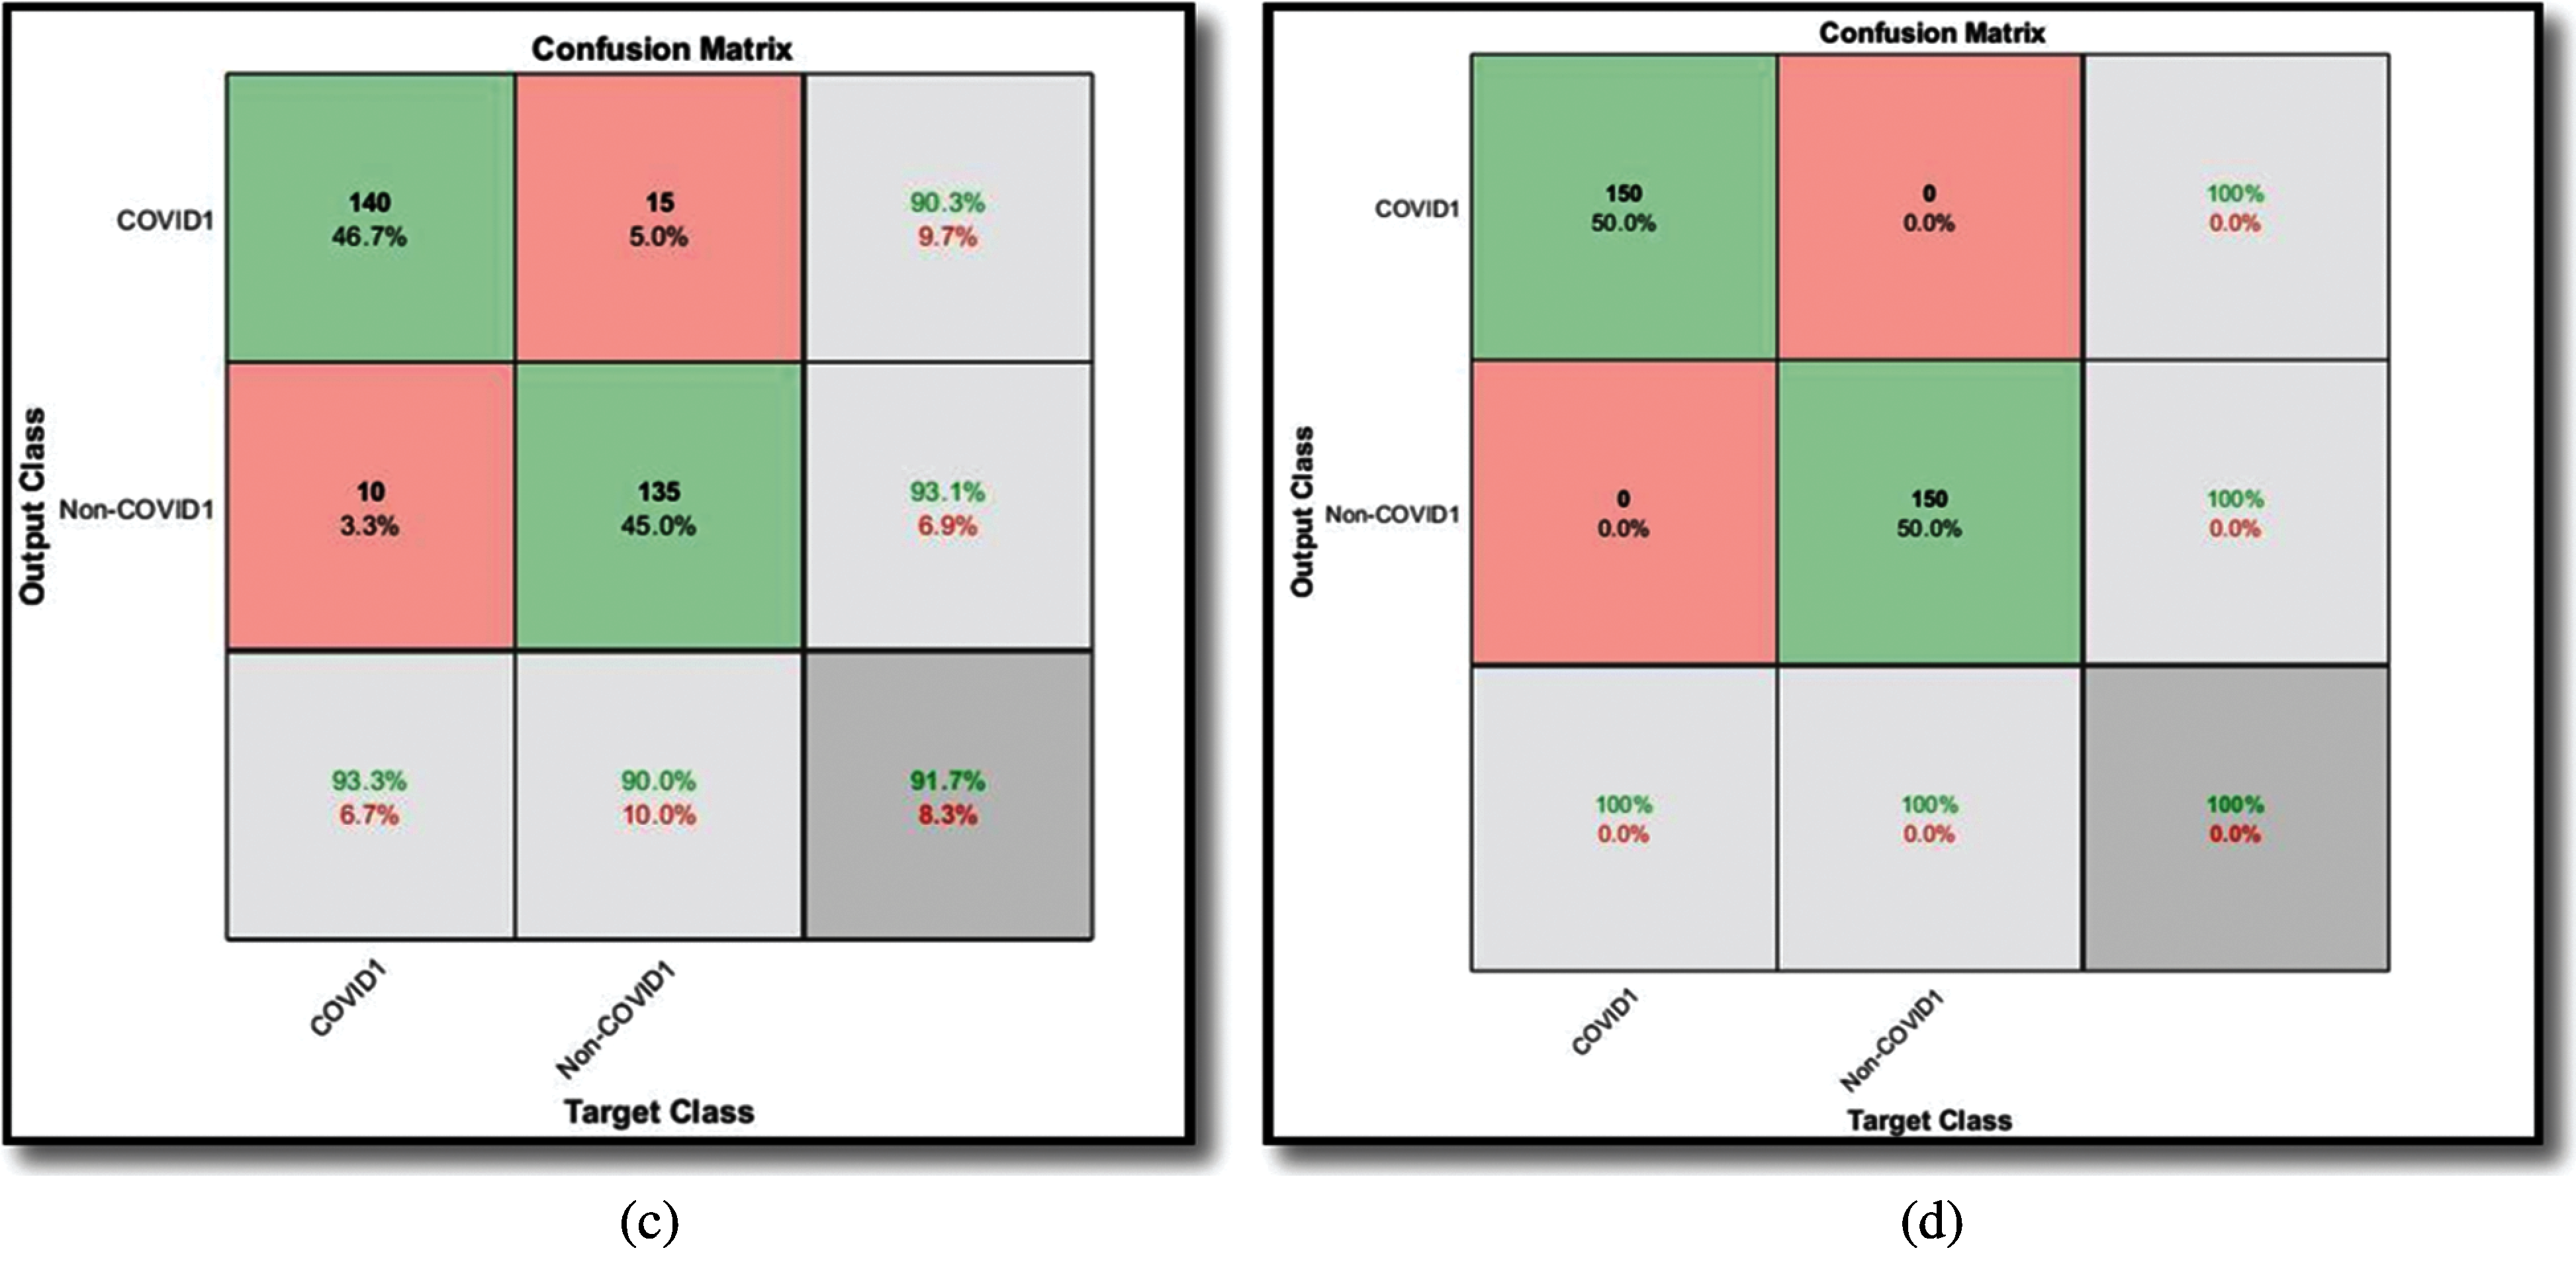
Figure 3: Performance of the proposed SGDM/ReLU model with 16 minibatch sizes at a learning rate of 1e-5. (a) The training and validation processes of the proposed model on the CXR dataset (b) The training and validation processes of the proposed model on the CT dataset (c) The confusion matrix of the proposed model on the CXR dataset (d) The confusion matrix of the proposed model on the CT dataset
The SGDM optimizer can find a less minimum without overshooting on fewer epochs. Unlike the SGD optimizer, the SGDM optimizer tends to move in one direction to avoid oscillations. The Adam optimizer is another optimizer that determines the adaptive learning rate of first and second moments for each parameter. It also decreases the learning rates. Adam optimizer can be viewed as a combination of momentum and RMSprop. It also carries out the exponential moving gradients mean to update the learning rate instead of a simple average as in RMSprop. It maintains an exponentially decaying average of previous gradients, and is computationally effective with little memory specifications.
This paper revealed the benefits of using different activation functions and optimizers to build a model capable of identifying COVID-19 cases based on CXR and CT images. Three optimization algoeithms, namely SGDM, RMSprop, and Adam, have been studied. These optimizers are often described as adaptive optimizers, because the learning step is modified corresponding to the contour topology. Out of the above three algorithms, it is found that the SGDM is the best algorithm. Simulation results revealed that all algorithms can converge to various optimal local minima offered by the same loss. Adam optimizer combines the best attributes of the momentum and RMSprop algorithms. It is relatively easy to configure and it can handle sparse gradients. The simulation outcomes demonstrated that the proposed deep CNN approach is valuable and cost-effective in discovering COVID-19 cases. The simulation findings can be enhanced for a future plan, when acquiring massive CXR images and CT images.
Acknowledgement: The authors would like to acknowledge the support received from Taif University Researchers Supporting Project Number (TURSP-2020/147), Taif University, Taif, Saudi Arabia.
Funding Statement: This work was funded and supported by the Taif University Researchers Supporting Project Number (TURSP-2020/147), Taif University, Taif, Saudi Arabia.
Conflicts of Interest: The authors declare that they have no conflicts of interest to report regarding the present study.
1. K. Sharma, R. Sharma and V. Sharma, “Corona virus epidemiology: A review article,” International Journal of Community Medicine and Public Health, vol. 7, no. 12, pp. 5219–5224, 2020. [Google Scholar]
2. C. Huang and Y. Wang, “Clinical features of patients infected with 2019 novel coronavirus in Wuhan, China,” The Lancet, vol. 395, no. 10223, pp. 497–506, 2020. [Google Scholar]
3. T. Singhal, “A review of coronavirus disease-2019 (COVID-19),” Indian J. Pediatrics, vol. 87, no. 4, pp. 281–286, 2020. [Google Scholar]
4. C. Lai, T. Shih, W. Ko, H. Tang and P. Hsueh, “Severe acute respiratory syndrome coronavirus 2 (SARS-Cov-2) and coronavirus disease-2019 (COVID-19The epidemic and the challenges,” Int. J. Antimicrob. Agents, vol. 55, no. 3, pp. 1–15, 2020. [Google Scholar]
5. F. Wu, S. Zhao and B. Yu, “A new coronavirus associated with human respiratory disease in China,” China Nature, vol. 579, no. 7798, pp. 265–269, 2020. [Google Scholar]
6. C. Bircanoğlu and N. Arıca, “A comparison of activation functions in artificial neural networks,” in Proc. 26th Signal Processing and Communications Applications Conf. (SIUIzmir, Turkey, pp. 1–4, 2018. [Google Scholar]
7. C. Nwankpa, W. Ijomah, A. Gachagan and S. Marshall, “Activation functions: Comparison of trends in practice for deep learning,” Journal of Neural Engineering, vol. 16, no. 3, pp. 1–14, 2019. [Google Scholar]
8. D. Dong, Z. Tang, S. Wang, H. Hui, L. Gong et al., “The role of imaging in the detection and management of COVID-19: A review,” IEEE Review in Biomedical Engineering, vol. 5, no. 2, pp. 1–19, 2020. [Google Scholar]
9. L. Li, L. Qin, Z. Xu, Y. Yin, X. Wang et al., “Artificial intelligence distinguishes COVID-19 from community acquired pneumonia on chest CT,” Radiology, vol. 7, no. 4, pp. 1–14, 2020. [Google Scholar]
10. F. Shi, J. Wang, J. Shi, Z. Wu, Q. Wang et al., “Review of artificial intelligence techniques in imaging data acquisition, segmentation and diagnosis for COVID-19,” IEEE Reviews in Biomedical Engineering, vol. 4, no. 7, pp. 1–19, 2020. [Google Scholar]
11. A. Narin, C. Kaya and Z. Pamuk, “Automatic detection of coronavirus disease (COVID-19) using x-ray images and deep convolutional neural networks,” Pattern Analysis and Applications, vol. 2, no. 1, pp. 1–21, 2021. [Google Scholar]
12. W. Kong and P. Agarwal, “Chest imaging appearance of COVID-19 infection,” Radiology Cardiothoracic Imaging, vol. 2, no. 1, pp. 819–824, 2020. [Google Scholar]
13. C. Zheng, X. Deng, Q. Fu, Q. Zhou, J. Feng et al., “Deep learning-based detection for COVID-19 from chest CT using weak label,” medRxiv, 2020. [Google Scholar]
14. X. Xu, X. Jiang, C. Ma, P. Du, X. Li et al., “Deep learning system to screen coronavirus disease 2019 pneumonia,” Engineering, vol. 6, no. 10, pp. 1122–1129, 2020. [Google Scholar]
15. M. Barstugan, U. Ozkaya and S. Ozturk, “Coronavirus (COVID-19) classification using CT images by machine learning methods,” International Journal of Imaging Systems and Technology, vol. 31, no. 1, pp. 5–15, 2021. [Google Scholar]
16. X. Chen, L. Yao and Y. Zhang, “Residual attention U-net for automated multi-class segmentation of COVID-19 chest CT images,” IET Image Processing, vol. 10, no. 2, pp. 1–14, 2021. [Google Scholar]
17. P. Sethy and S. Behera, “Detection of coronavirus disease (COVID-19) based on deep features,” International Journal of Mathematical, Engineering and Management Sciences (IJMEMS), vol. 8, no. 2, pp. 1–17, 2020. [Google Scholar]
18. L. Wang and A. Wong, “COVID-Net: A tailored deep convolutional neural network design for detection of COVID-19 cases from chest radiography images,” Sci. Rep., vol. 10, no. 1, pp. 1–12, 2020. [Google Scholar]
19. E. Hemdan, M. Shouman and M. Karar, “A framework of deep learning classifiers to diagnose COVID-19 in X-ray images,” Complex & Intelligent Systems, vol. 7, no. 1, pp. 235–247, 2021. [Google Scholar]
20. Y. Song, S. Zheng, L. Li, X. Zhang, Z. Huang et al., “Deep learning enables accurate diagnosis of novel coronavirus (COVID-19) with CT images,” IEEE/ACM Transactions on Computational Biology and Bioinformatics, vol. 5, no. 2, pp. 1–14, 2021. [Google Scholar]
21. S. Wang, B. Kang, J. Ma, X. Zeng, M. Xiao et al., “A deep learning algorithm using CT images to screen for corona virus disease (COVID-19),” European Radiology, vol. 5, no. 2, pp. 1–9, 2021. [Google Scholar]
22. D. Ioannis and B. Tzani, “Automatic detection from X-ray images utilizing transfer learning with convolutional neural networks,” Physical and Engineering Sciences in Medicine, vol. 43, no. 2, pp. 635–640, 2021. [Google Scholar]
23. M. Holshue and C. DeBolt, “First case of 2019 novel coronavirus in the United States,” New England Journal of Medicine, vol. 3, no. 1, pp. 1–14, pp. 2020. [Google Scholar]
24. S. Wang, B. Kang, J. Ma, X. Zeng, M. Xiao et al., “A deep learning algorithm using CT images to screen for corona virus disease (COVID-19),” European Radiology, vol. 4, no. 2, pp. 1–9, 2021. [Google Scholar]
25. T. Ozturk, M. Talo, E. Yildirim, U. Baloglu, O. Yildirim et al., “Automated detection of COVID-19 cases using deep neural networks with X-ray images,” Computers in Biology and Medicine, vol. 121, no. 4, pp. 235–245, 2020. [Google Scholar]
26. N. Alsharman and I. Jawarneh, “Googlenet CNN neural network towards chest CT-coronavirus medical image classification,” Journal of Computer Science, vol. 16, no. 5, pp. 620–625, 2020. [Google Scholar]
27. P. Kingma and B. Jimmy, “Adam: A method for stochastic optimization,” Scientific Reports, vol. 11, no. 1, pp. 1–8, 2019. [Google Scholar]
28. J. Reddi, S. Kale and S. Kumar, “On the convergence of adam and beyond,” arXiv preprint arXiv: 1904.09237, 2019. [Google Scholar]
29. W. El-Shafai and F. Abd El-Samie, “Extensive COVID-19 X-ray and CT chest images dataset,” Mendeley Data, v3, [Online]. Avaliable: http://dx.doi.org/10.17632/8h65ywd2jr.3, 2020. [Google Scholar]
 | This work is licensed under a Creative Commons Attribution 4.0 International License, which permits unrestricted use, distribution, and reproduction in any medium, provided the original work is properly cited. |