DOI:10.32604/cmc.2022.017824

| Computers, Materials & Continua DOI:10.32604/cmc.2022.017824 |  |
| Article |
A Hybrid Neural Network and Box-Jenkins Models for Time Series Forecasting
1Department of Information Technology, College of Computer, Qassim University, Buraydah, Saudi Arabia
2Department of Computer Science, College of Applied Sciences, Taiz University, Taiz, Yemen
3Intelligent Analytics Group (IAG), College of Computer, Qassim University, Buraydah, Saudi Arabia
4Faculty of Computer Sciences and Information Systems, Thamar University, Thamar, Yemen
5Faculty of Administration Science, Ibb University, Ibb, Yemen
6Department of Computer Science, College of Computer, Qassim University, Buraydah, Saudi Arabia
*Corresponding Author: Mohammed Hadwan. Email: m.hadwan@qu.edu.sa
Received: 13 February 2021; Accepted: 28 July 2021
Abstract: Time series forecasting plays a significant role in numerous applications, including but not limited to, industrial planning, water consumption, medical domains, exchange rates and consumer price index. The main problem is insufficient forecasting accuracy. The present study proposes a hybrid forecasting methods to address this need. The proposed method includes three models. The first model is based on the autoregressive integrated moving average (ARIMA) statistical model; the second model is a back propagation neural network (BPNN) with adaptive slope and momentum parameters; and the third model is a hybridization between ARIMA and BPNN (ARIMA/BPNN) and artificial neural networks and ARIMA (ARIMA/ANN) to gain the benefits of linear and nonlinear modeling. The forecasting models proposed in this study are used to predict the indices of the consumer price index (CPI), and predict the expected number of cancer patients in the Ibb Province in Yemen. Statistical standard measures used to evaluate the proposed method include (i) mean square error, (ii) mean absolute error, (iii) root mean square error, and (iv) mean absolute percentage error. Based on the computational results, the improvement rate of forecasting the CPI dataset was 5%, 71%, and 4% for ARIMA/BPNN model, ARIMA/ANN model, and BPNN model respectively; while the result for cancer patients’ dataset was 7%, 200%, and 19% for ARIMA/BPNN model, ARIMA/ANN model, and BPNN model respectively. Therefore, it is obvious that the proposed method reduced the randomness degree, and the alterations affected the time series with data non-linearity. The ARIMA/ANN model outperformed each of its components when it was applied separately in terms of increasing the accuracy of forecasting and decreasing the overall errors of forecasting.
Keywords: Hybrid model; forecasting; non-linear data; time series models; cancer patients; neural networks; box-jenkins; consumer price index
Forecasting refers to the process of examining the behavior of a particular phenomenon in the past to predict what can happen for it now and in the future based on events from the past and present [1]. Prediction is known as planning, setting assumptions about future events, using special techniques in different periods. This explains why managers and decision-makers depend on prediction to develop assumptions about future conditions [2].
The time-series prediction is among the critical areas where artificial neural networks (ANNs) and conventional neural networks (CNNS) are used heavily as a substitute for the statistical methods that are applied for the time-series prediction [3,4], such as the moving-average, exponential smoothing, and Box-Jenkins models [4]. Generally, these methods are known as time series analysis methods. According to [5] and [6], ANNs models overcome the traditional forecasting methods by providing higher accuracy results in many tested cases. The complex time-series have the characteristics of linear and nonlinear models [7–9]. Accordingly, it is not appropriate for predicting complex time-series to use non-linear models due to the concern that it might ignore the linear qualities available in the time-series [10].
Recently, scholarly attention focused on predicting time-series in many statistical models [10,11]. The most common model of these entire models is the autoregressive integrated moving average (ARIMA) as it offers a complete statistical modeling methodology and covers a wide range of different styles, including stability, lack of stability, and the seasonal time-series [11]. The Box-Jenkins models are used in forecasting and time series analysis of linear events but it shows less efficiency in the field of complex nonlinear time series.
Generally, artificial neural networks (ANNs) are an important method in Artificial Intelligence (AI), particularly in machine learning [12]. Many ANNs have been used for data analysis in similar research areas that are known for traditional statistics methods. ANNs offer a suitable illustration of the relationship between variables that are dissimilar to traditional methods [13]. A back propagation neural network (BPNN) is a neural network architecture that is widely used for forecasting because of its simplicity and capability of identifying the nonlinear features available in the data of time series [14].
In many cases, it has been found that it is appropriate to apply hybrid models to deal with the linear and non-linear qualities. In [14], the models of ANNs and ARIMA are integrated to find a composite model of typical ARIMA neural networks using different styles. Currently, the hybridization of several models is commonly used to improve the accuracy of forecasting since the well-known M-competition [15]. Consumer price index (CPI) is used to examine the resident's purchases and the goods consumption and change level of services cost in trends. CPI is a significant indicator of the level of observed inflation. Predicting CPI is one of the main concerns of investors, markets, and policymakers [16].
For economic indicators, CPI can be a means of regulating income. It serves to predict future value indices to ensure accuracy of the data in order to imitate the purchase patterns of the consumers in the Yemeni market. Cancer is one of the very dangerous and malignant diseases which is one of the main causes of death all over the world including approximately 14 million deaths related to cancer in 2014 [17]. Cancer can be predicted through the expected increase of patients infected with this malignant disease. This helps in making the right decisions to avail of medicines and medical therapeutic doses and health attachments to cope with the disease [17].
In this research, a novel forecasting time series method based on a hybrid model between BPNN and statistical models is proposed. The proposed method is applied to predict the consumer's indices in the Republic of Yemen. The prices cover the period from January 01, 2005 until December 01, 2014. The proposed methods is also used to predict the number of people inflicted with cancer diseases in Ibb governorate, Yemen, during the period January 01, 2010 to December 01, 2016.
Many studies have used statistical methods and ANNs forecasting of time series [1,8,10,11]. In [15], a hybrid ARIMA–ANNs model is introduced to predict the time series data. The proposed model, based on the volatility nature, was investigated using a moving-average filter, followed by models of ARIMA and ANNs. The results showed that the hybrid model produced higher prediction accuracy for all the used data sets (both one-step-ahead and multistep-ahead forecasts).
A popular hybrid model is presented in [18], where the auto-regressive fractionally integrated moving average (ARFIMA) model and the feed forward neural network (FFNN) model is introduced. The results revealed that the proposed model in [18] yielded the highest accuracy of prediction when compared to other models. In [19], discrete wavelet transform (DWT) is suggested for forecasting by separating a time series dataset into linear and nonlinear components. DWT is used to decompose the in-sample training dataset of the time series into linear (detailed) and non-linear (approximate) parts. Subsequently, the ARIMA and ANNs models were applied separately to identify and predict the reconstructed details. This method utilized the strengths of DWT, ARIMA, and ANNs in order to enhance the accuracy of forecasting.
For sales forecasting, hybridization between ARIMA and BPNN models is proposed in [20]. They used the ARIMA forecasting model to train a BPNN-based forecasting model. The results obtained showed that the proposed forecasting model outperformed conventional techniques that did not take into consideration the popularity of title words.
Another hybrid-forecasting model for a short-term prediction is presented in [21]. This model explores the feature of ARIMA and the dendritic neural network model (SA-D model). The results based on mean square error (MSE), mean absolute percentage error (MAPE), and correlation coefficient confirm that using the SA-D model has better accuracy of prediction compared to other models. In [22], a comparison between two types of hybrid ANNs and exponential generalized autoregressive conditional heteroscedasticity (GARCH-type) models are presented. This research compared the volatilities performance forecast. Empirical results showed that the hybrid EGARCH-ANNs model outperformed other models to forecast the volatilities of log-returns series for an energy market in China. In [23], the authors proposed a hybrid model that adopts additive and linear regression methods to mixed linear and non-linear models. Three models were discovered, namely, ARIMA, the exponential model (EXP), and ANNs. Results revealed the superiority of the hybrid model over other models with an error measure accuracy of 0.82% MAPE.
In the current study, a forecasting method based on ARIMA/BPNN and ARIMA/ANN models is proposed. Momentum parameters and adaptive slope with basic BPNN to accelerate learning to update weights are used. The main contribution is the hybridization of the ANN model and ARIMA model. This shows great improvement in the forecasting accuracy due to the use of the network's output as feedback to the input of the neural network along with the actual output values. The inputs come from the ANN and the ARIMA models, in addition to the use of parallel architecture for all the inputs, which is the basis for training neural networks. This paper is organized as follows. The proposed forecasting method is given in section 2, the computation results and comparative study are outlined in sections 3 and 4 respectively, and the conclusion and future work are discussed in section 5.
2 The Proposed Forecasting Methods
This section outlines the details of the proposed hybrid forecasting method. The hybridization between BPNN and ARIMA models is presented in the following sub-sections.
2.1 The Proposed BPNN Architectural Model
The layers number, neurons number for every layer, and the weighted connection between neurons determine the neural network topology. The determination of the topology is among the highly important steps in the development of a model for any given problem [24].
Network architecture consists of three layers. These are (i) the hidden layer (ii), the input layer, and (iii) the output layer. These layers are completely linked together through interfaces that carry weights. The proposed architecture of the BPNN model is determined through testing several different compositions and trade-offs between them through several statistical standards, including mean absolute error (MAE), MSE, root mean square error (RMSE), and MAPE, between inputs and outputs as illustrated in Tab. 1. The forecasting process is described according to Eq. (1) as follows:

The proposed network includes 5 neurons for the input layer and one neuron for the output layer. Fig. 1. illustrates the architecture of the proposed BPNN, where Ak−4, Ak−3, Ak−2, Ak−1, Ak, denote the inputs of the network, and Ak+1 denotes the output of the network. An appropriate hidden layer number in this architecture by continuous statistical experimentation is 5 elements.
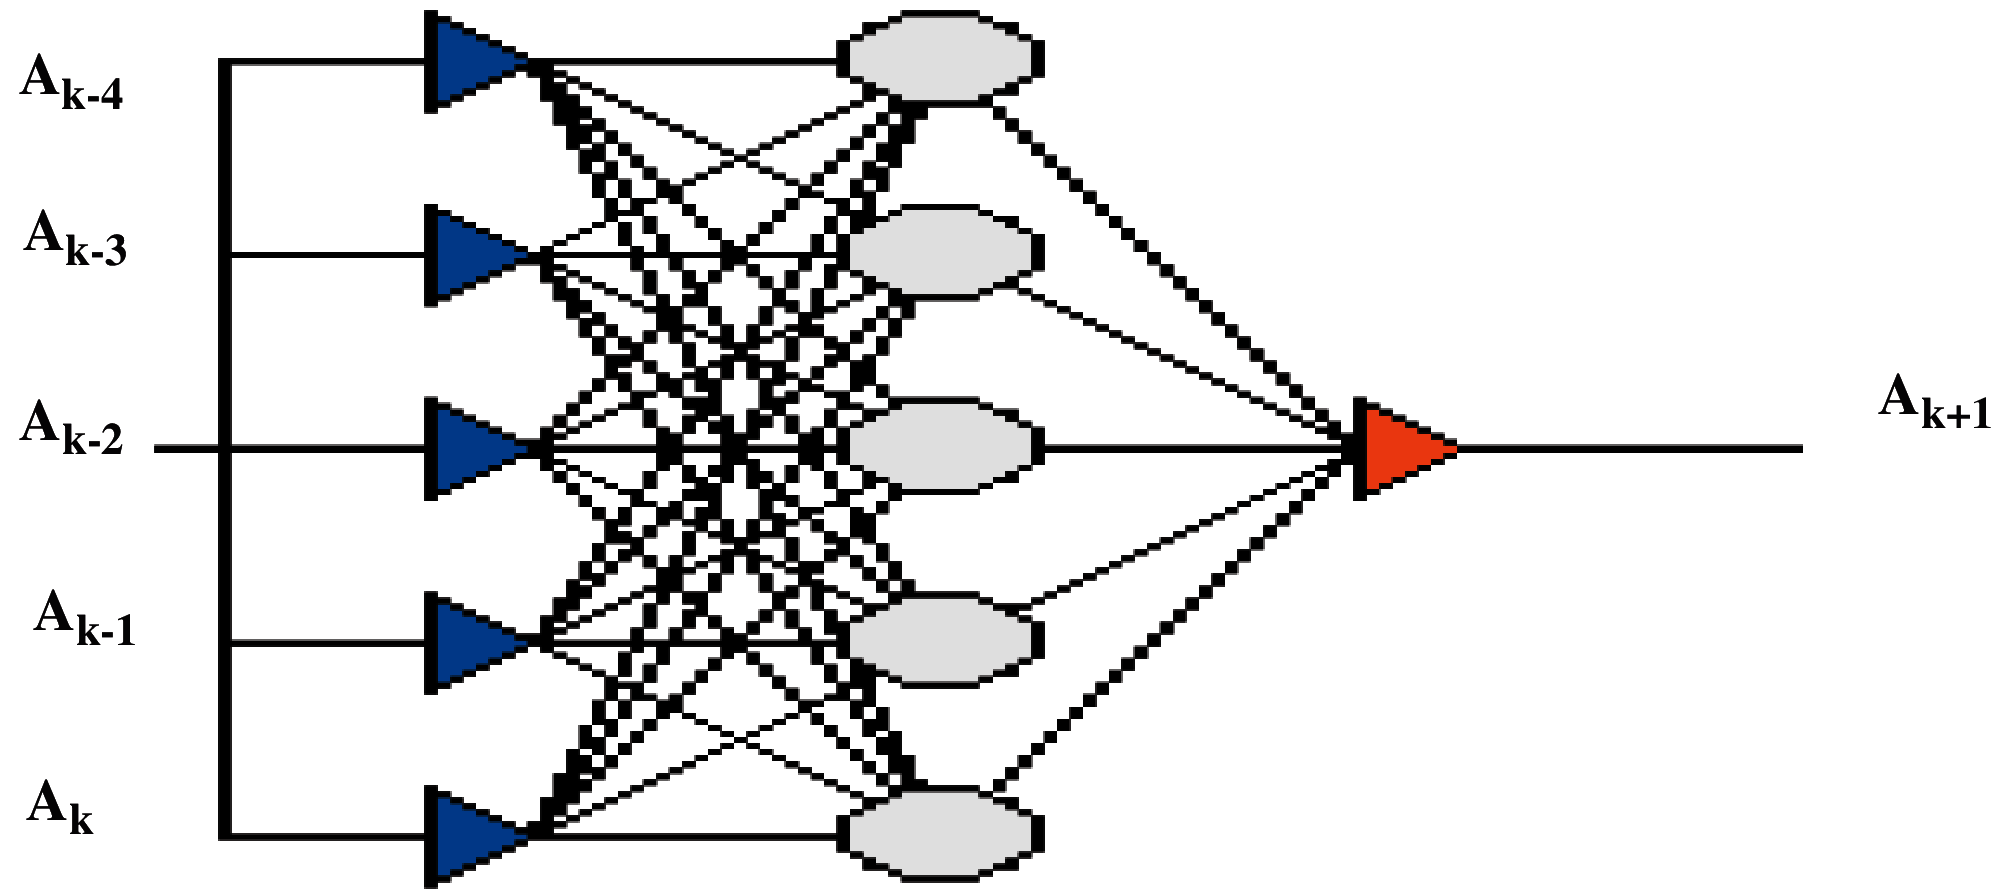
Figure 1: The proposed BPNN architecture [5.5.1]
2.2 Box-Jenkins Time Series Model
The Box-Jenkins method is a popular time series forecasting. It is also called the ARIMA model [25]. The popularity of the ARIMA model is attributed to its statistical properties. The ARIMA model's approximation to deal with complex nonlinear problems is not adequate [11]. The advantages of Box-Jenkins models include [26]:
• The flexibility because of the inclusion of autoregressive and moving average terms.
• Based on the world decomposition theorem, the ARIMA model can approximate a stationary process.
• Practically, finding the approximation may not be an easy task.
On the other hand, the construction of the ARIMA model needs a high-level of experience more than statistical methods such as regression.
Box-Jenkins analysis indicates a methodical process of identifying, fitting, checking, and using ARIMA time series models [27]. The model is suitable for time series of medium to long length (at least 50 observations) [19]. This methodology provides a powerful perspective to solve many time series problems. It gives accurate predictions of the time series. The ARIMA model is a systematic methodology to build and analyze the models that depend on the data of the time series to discover the optimal one. The optimal model is obtained by minimizing the errors. It is considered optimal if all information is statistically significant, and errors in the model are distributed independently [26]. The Box-Jenkins method is used for stable time-series and it can be used with unstable time-series after converting them into stable ones by taking their differences. Also, the Box-Jenkins method is used to address the multivariate models. Due to its high accuracy, this method is used to gain models to predict the studied variables and the accuracy is enhanced as it uses the means of analysis based on the electronic calculator models [28,29]. ARIMA model is shown in Eq. (2) as follows:
Residuals or prediction errors are the real values subtracted from the estimated values of what is called the White Noise series. The SPSS statistical package is utilized to recognize the suitable model for the data. SPSS uses autocorrelation function and partial autocorrelation function. ARIMA (0,1,0) is the identified model for this data as it successfully estimated parameters of the significance test, in addition to its success in the residual analysis test. Tab. 2. demonstrates the measurement of forecast error that shows the values assumed of the ARIMA (0,1,0) model parameters and the appropriateness of the CPI time series dataset.

Data standard cancer patients shows that model ARIMA (1,0,0) achieved fewer measurement values of model fit statistics, and lower values of these metrics whenever the model is used in more accurate prediction. From the sample of ACF and PACF between cancer patients series model, it is noticed that residuals follow the white noise pattern, which is a confirmed value parameter by autocorrelation and partial autocorrelation functions of residuals within a period of confidence 95%. It means that it is independent and naturally distributed with an arithmetic mean of (0) and variance of (2σ). Tab. 3. illustrates the measurements of forecast error that show the estimated values of the ARIMA (1,0,0) model parameters and the appropriateness of the cancer patients’ time series dataset.

A hybrid model is any combination of two or more independent models. The purpose of hybridization is to raise the prediction accuracy of the model. The Box-Jenkins model deals with linear characteristics of the time series, while neural networks deal with the nonlinear characteristics. The ARIMA/BPNN hybrid model is used to find an efficient way of predicting and defined as in Eq. (3) as follows:
where F1 represents the time series linear part, and F2 represents the time series non-linearity part.
As the reason for constructing a hybrid model is to have better forecasting, the main point here is to find out how to combine independent models to produce the best possible results. The proposed model is classified into two-hybrid model schemes as follows:
2.3.1 The Hybrid ARIMA/BPNN Model Scheme
The success of both the ARIMA and the BPNN models has been proven to tackle linear and nonlinear domains. Nevertheless, none of them is considered a universal model suitable for all circumstances [30]. As it is hard to completely recognize the features of the real problem data, the capabilities of a hybridized method that has both linear and nonlinear modelling can be a good approach for particle use [31,32].
The proposed methodology includes two main phases. In the first phase, the linear part of the problem is analyzed based on time series data as input of the ARIMA model as the ARIMA model cannot capture the nonlinear data structure. The residuals of the linear model will enclose nonlinearity information. Therefore, in the second step, the BPNN model is developed and the inputs of BPNN are a product of constructed ARIMA model. This product of the ARIMA model can include residuals, outputs estimations, or predictions. The BPNN model produces the final hybrid model output. Fig. 2. shows the first hybrid model scheme.
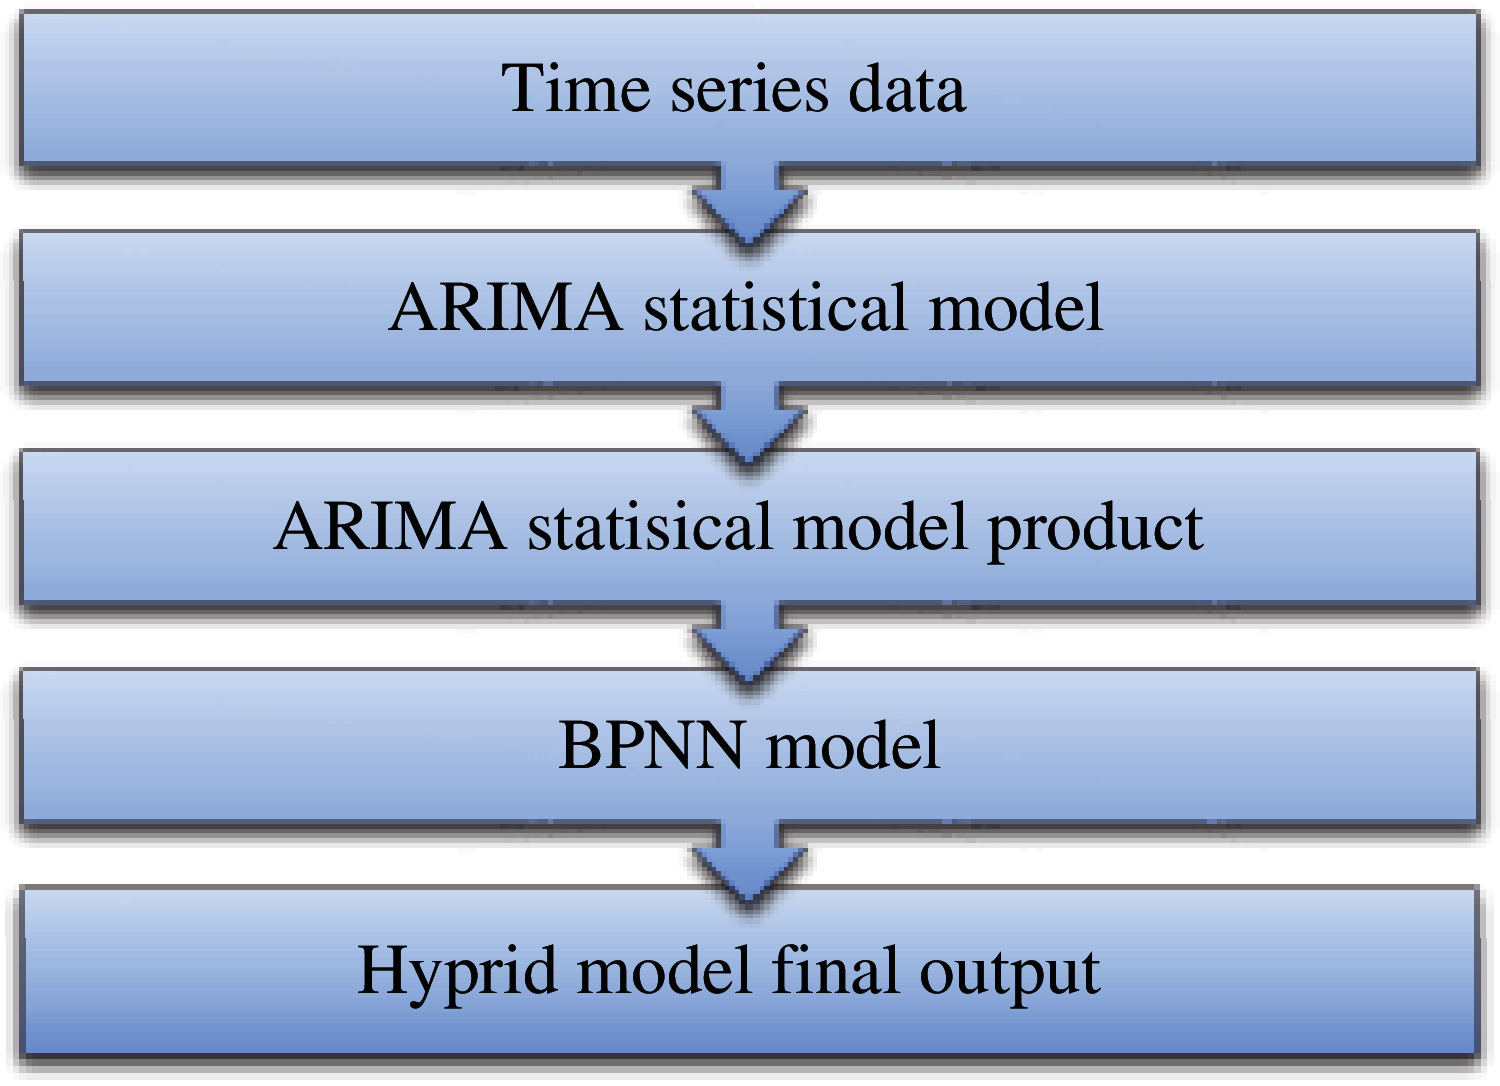
Figure 2: General overview of the hybrid ARIMA/BPNN model scheme
2.3.2 The Hybrid ARIMA/ANN Model Scheme
In the hybrid ARIMA/ANN model scheme, the input of the ANNs model and ARIMA model are time-series data. Besides, the output of these two constructed models enters a new hybrid ANNs model [3.5.1] with feedback input (y-1) coming from the output (y). The final output of this hybrid model scheme is produced from the new hybrid ANNs model as shown in Fig. 3.
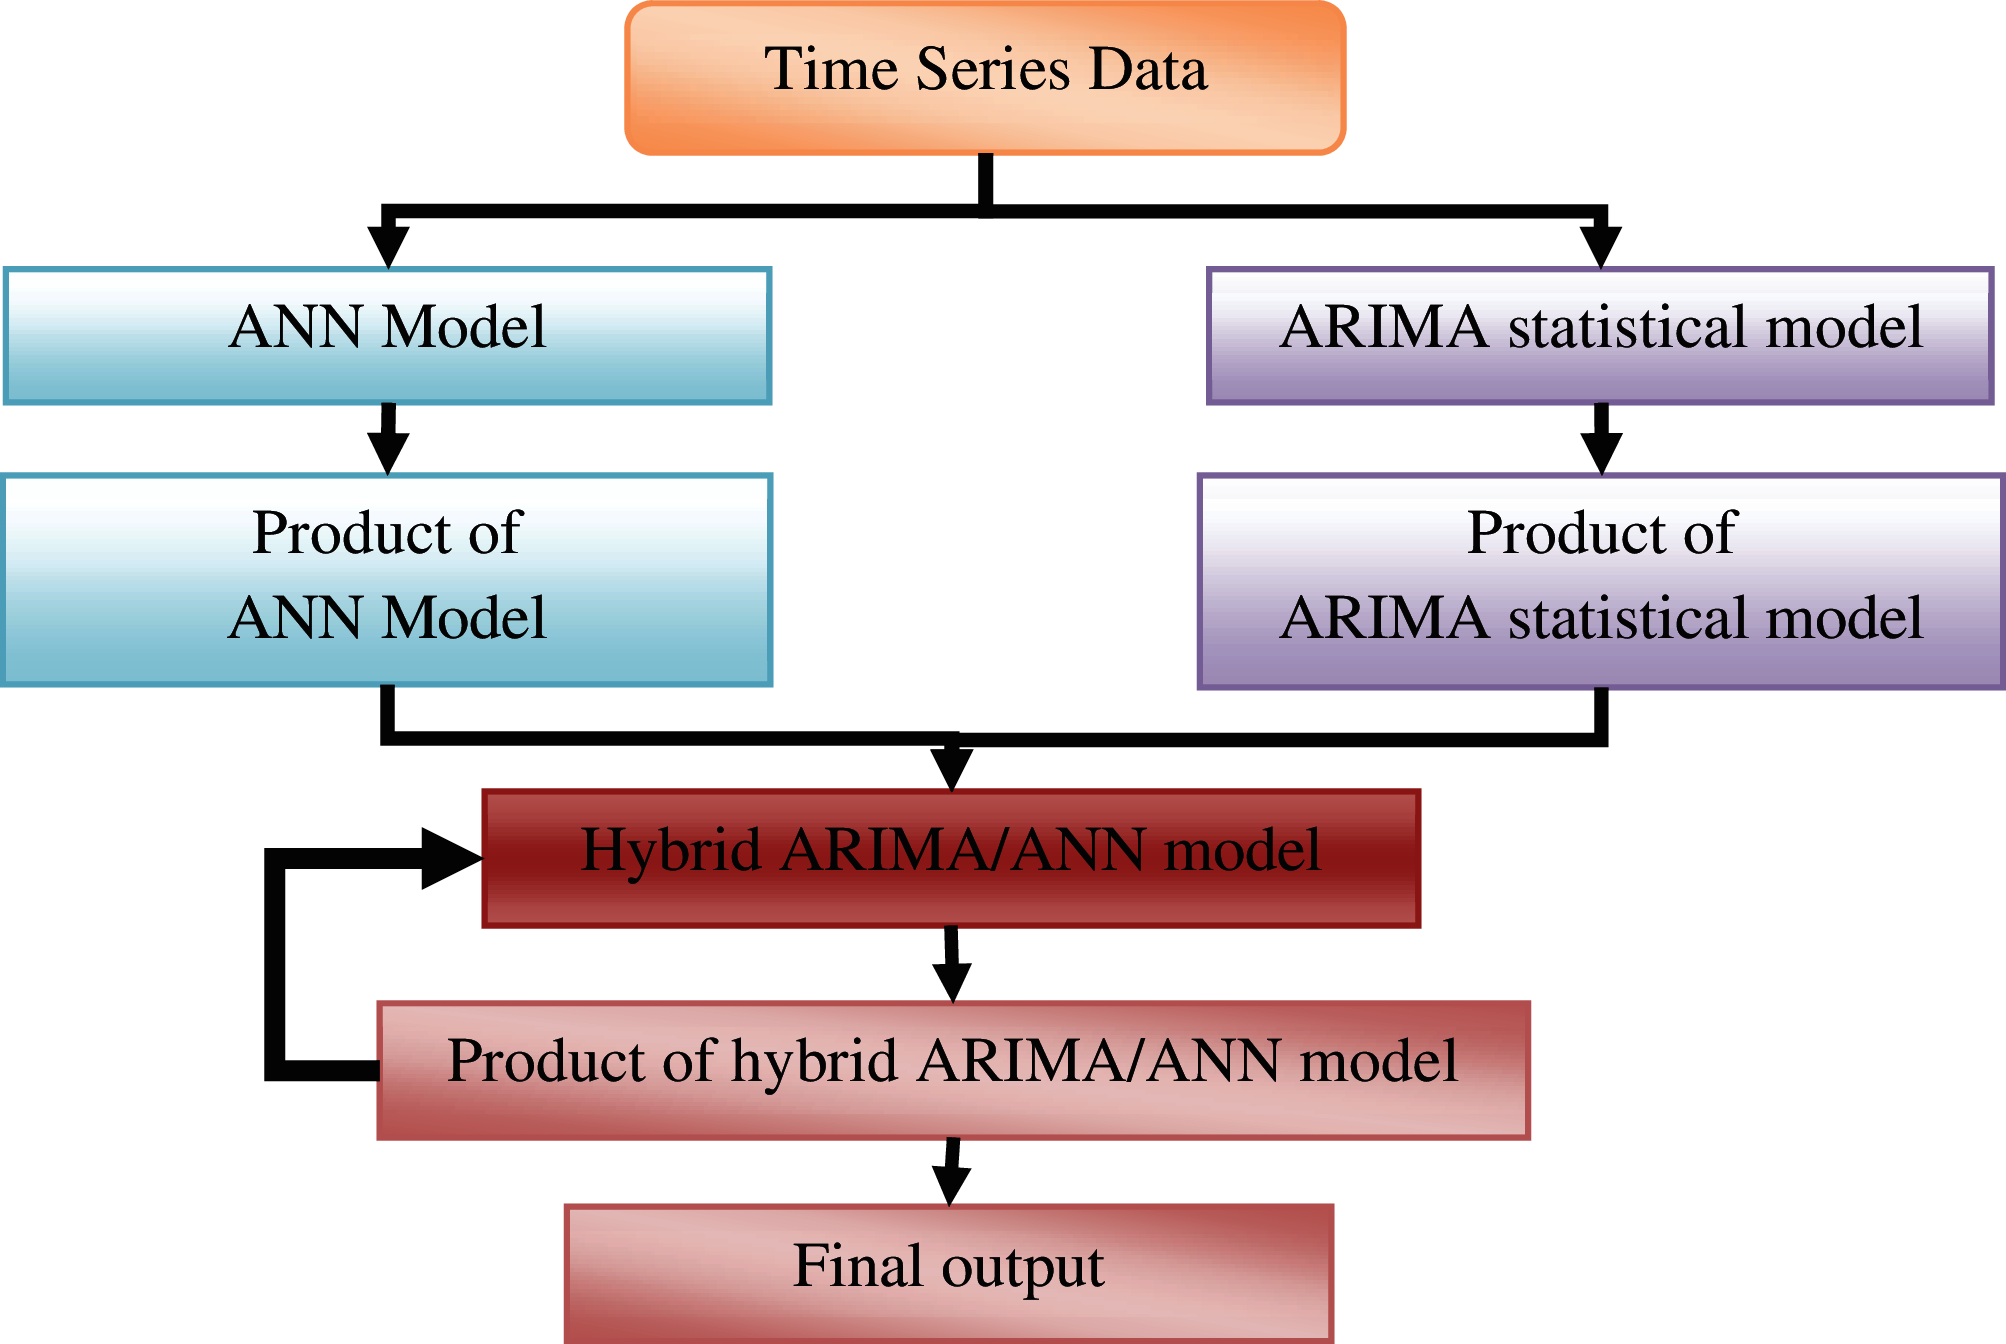
Figure 3: General overview of the hybrid ARIMA/ANN model scheme
Fig. 4. displays the architecture of the new hybrid ARIMA/ANN model. In this model, Z1 represents the input that comes from the ANN model, Z2 represents the second inputs that comes from the ARIMA model, and y-1 represents the feedback data.
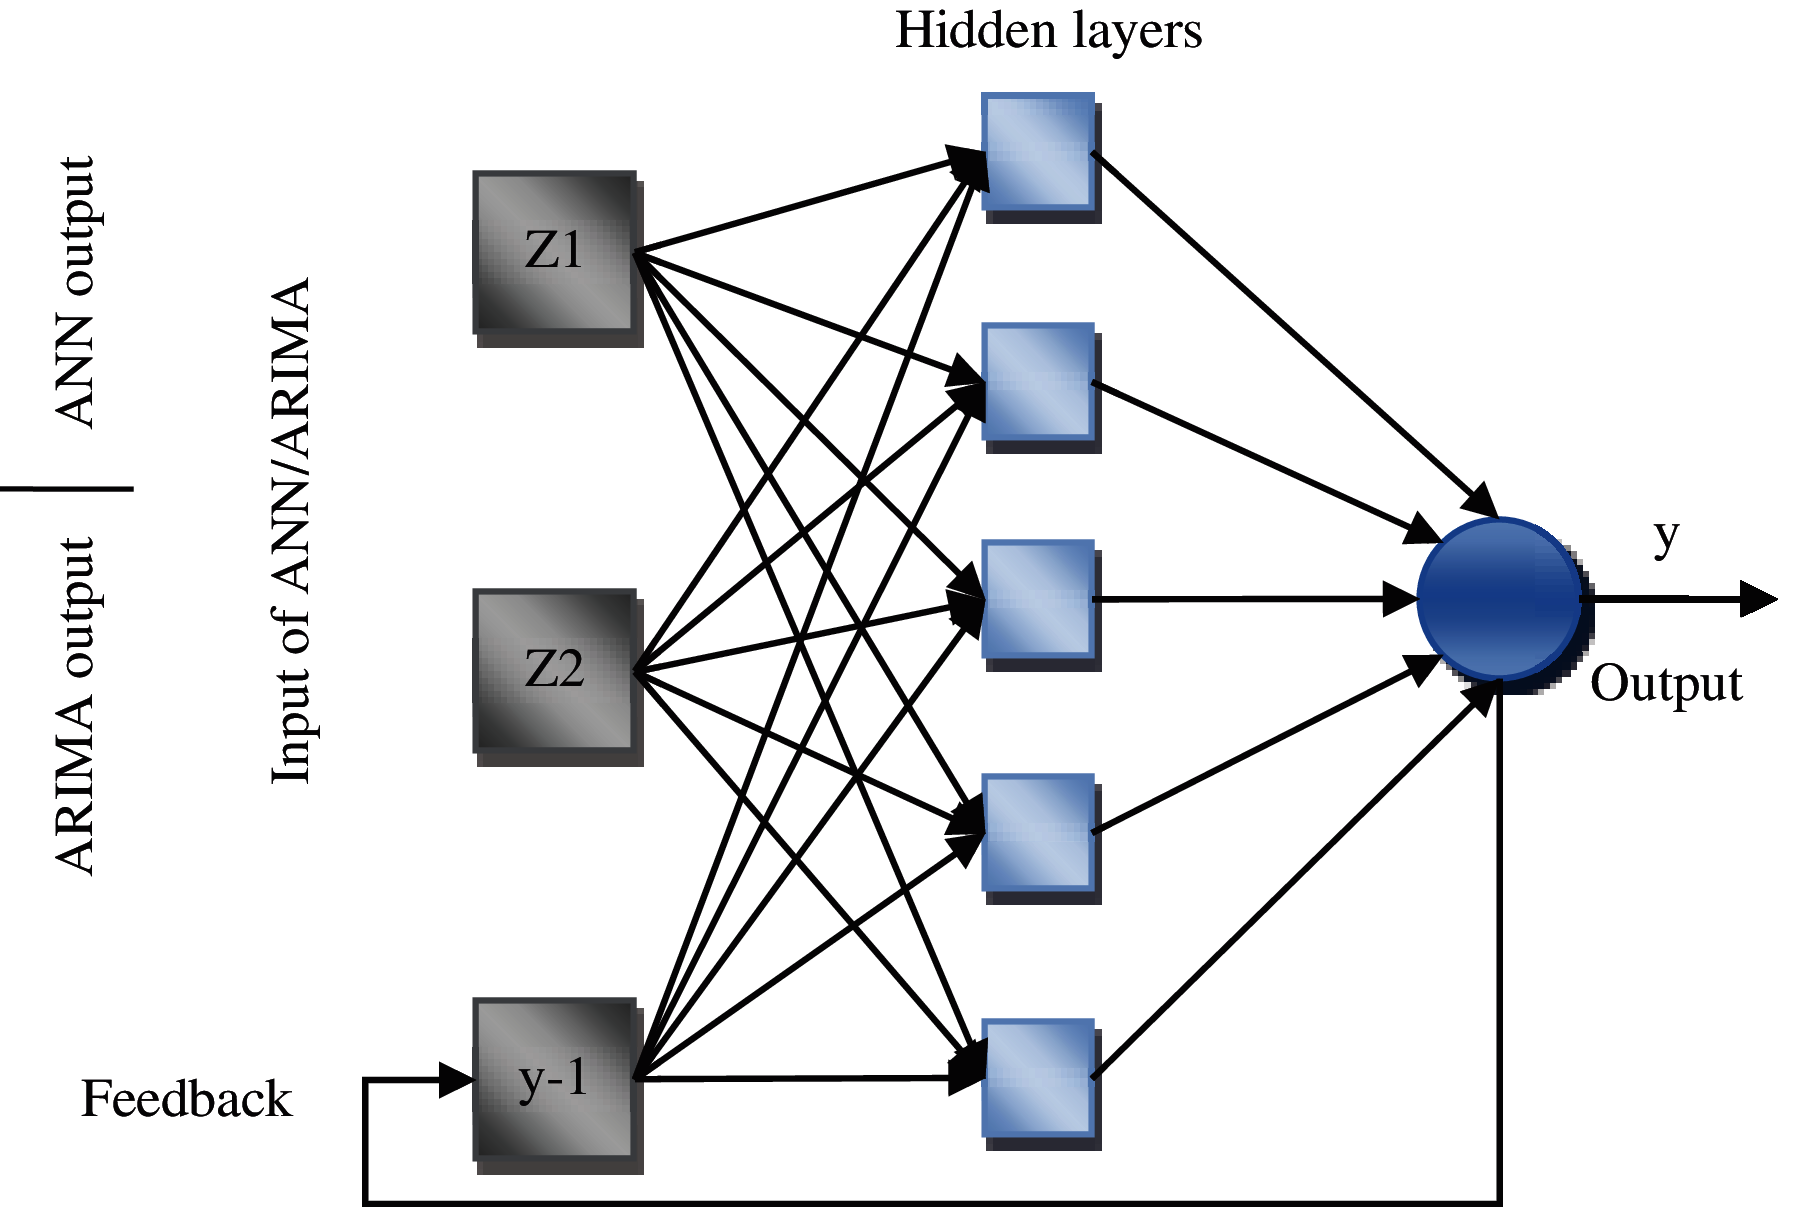
Figure 4: The architecture of the hybrid ARIMA/ANN model
This section presents the dataset description that was used for conducting the experiments. Several experiments and comparative analyses were performed to evaluate the performance of the proposed forecasting method. The obtained results and related discussions are presented below.
Two datasets are used to exhibit the effectiveness of the proposed forecasting methods. The first is the CPI dataset in Yemen from January 01, 2005 until December 01, 2014. The second is a newly collected cancer patient's dataset from different hospitals in Ibb governorate, Yemen, from January 01, 2010 to December 01, 2016. The time series have different statistical characteristics.
Tab. 4. shows the descriptive metrics of the CPI dataset, while Fig. 5 shows the time-series graph of the data where the consumer price, the Yemeni Riyal (YR), is illustrated on the vertical axis and the time, in months, on the horizontal axis.

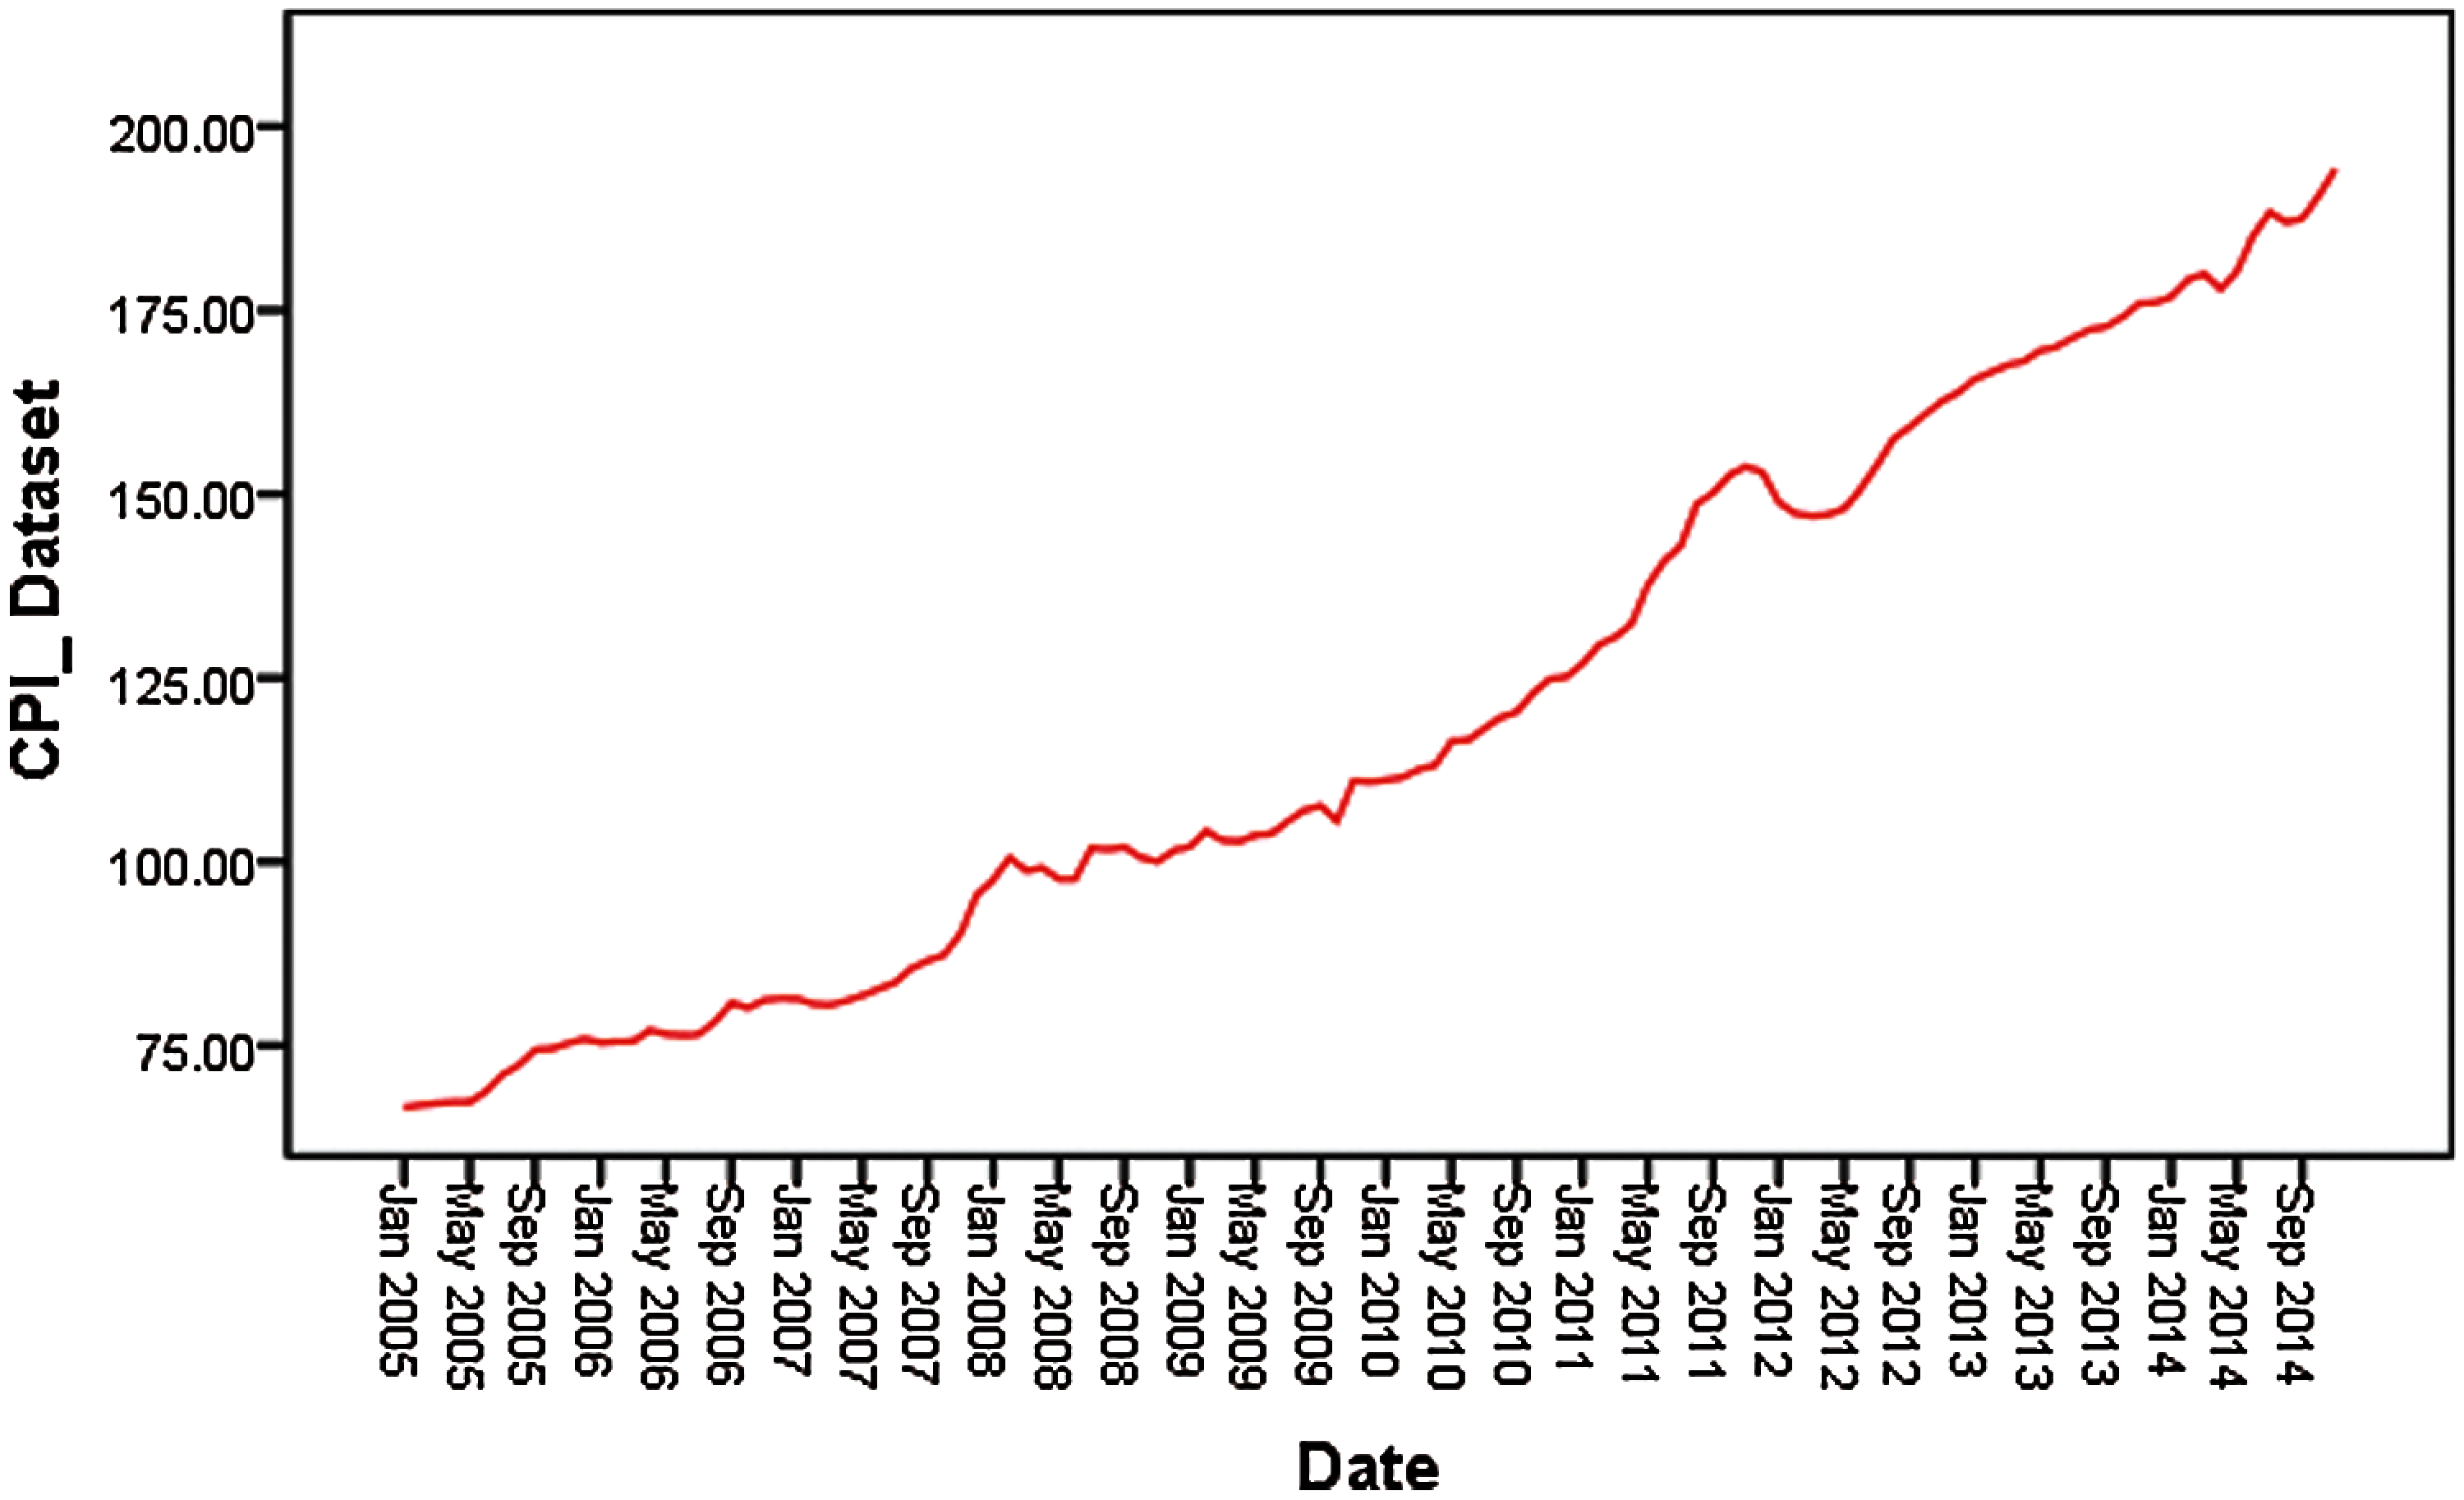
Figure 5: Consumer prices indices time series
Tab. 5. shows descriptive metrics of the cancer patients’ dataset. The range values are between 6 and 54, the mean is 22.83333, the standard deviation is 11.34164, the variability is 84.87698, and coefficient of variation is 0.403483. The time series of the dataset is presented in Fig. 6.

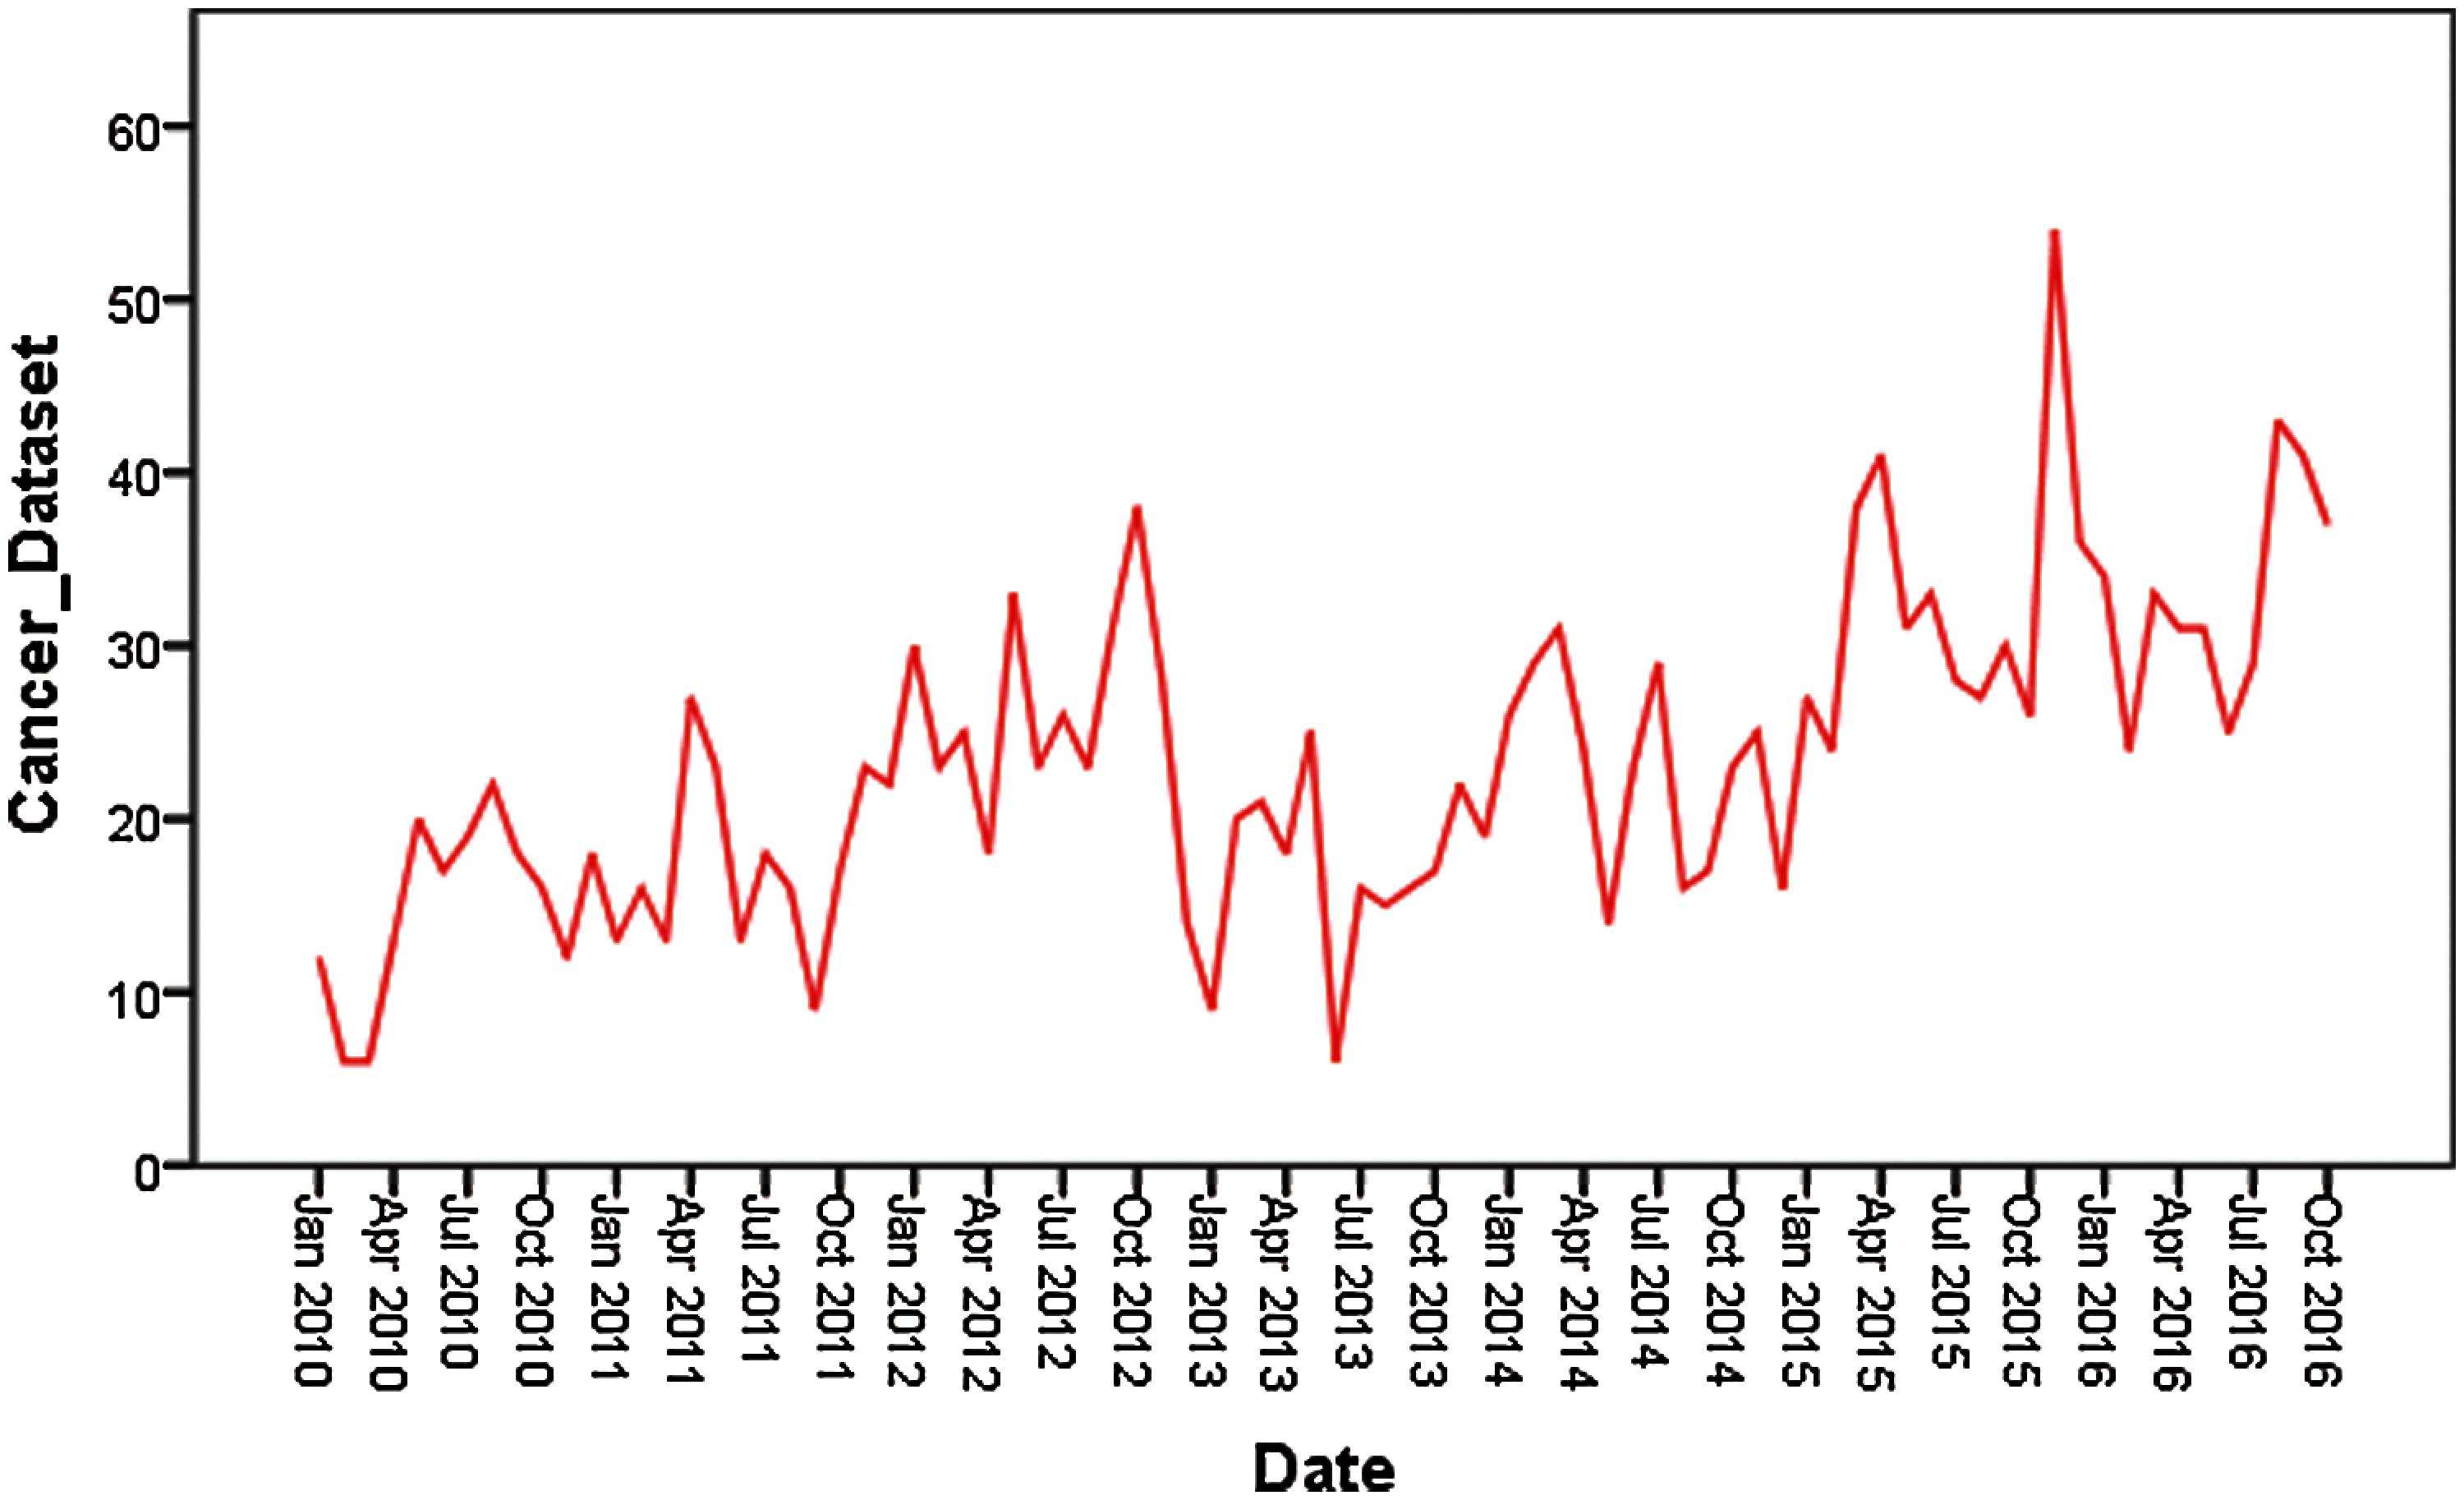
Figure 6: Cancer patients time series
The assessment of the performance of forecasting for different models takes into consideration the fact that each dataset is divided into two samples of training and testing. The input and output datasets are real values and elementary weights are chosen randomly.
3.2 Prediction Using Hybrid Model for CPI Dataset
The proposed hybrid model is built in two hybrid models. The results obtained using the first hybrid model for both training and testing are presented in Tab. 6.

The actual values and the forecast values for the CPI dataset are compared to each other as illustrated in Fig. 7, where the consumer price (in Yemeni Riyal) is presented on the vertical axis while time (in months) on the horizontal axis. Furthermore, the results obtained from the CPI dataset using the second hybrid model for both training and testing phases are given in Tab. 7.
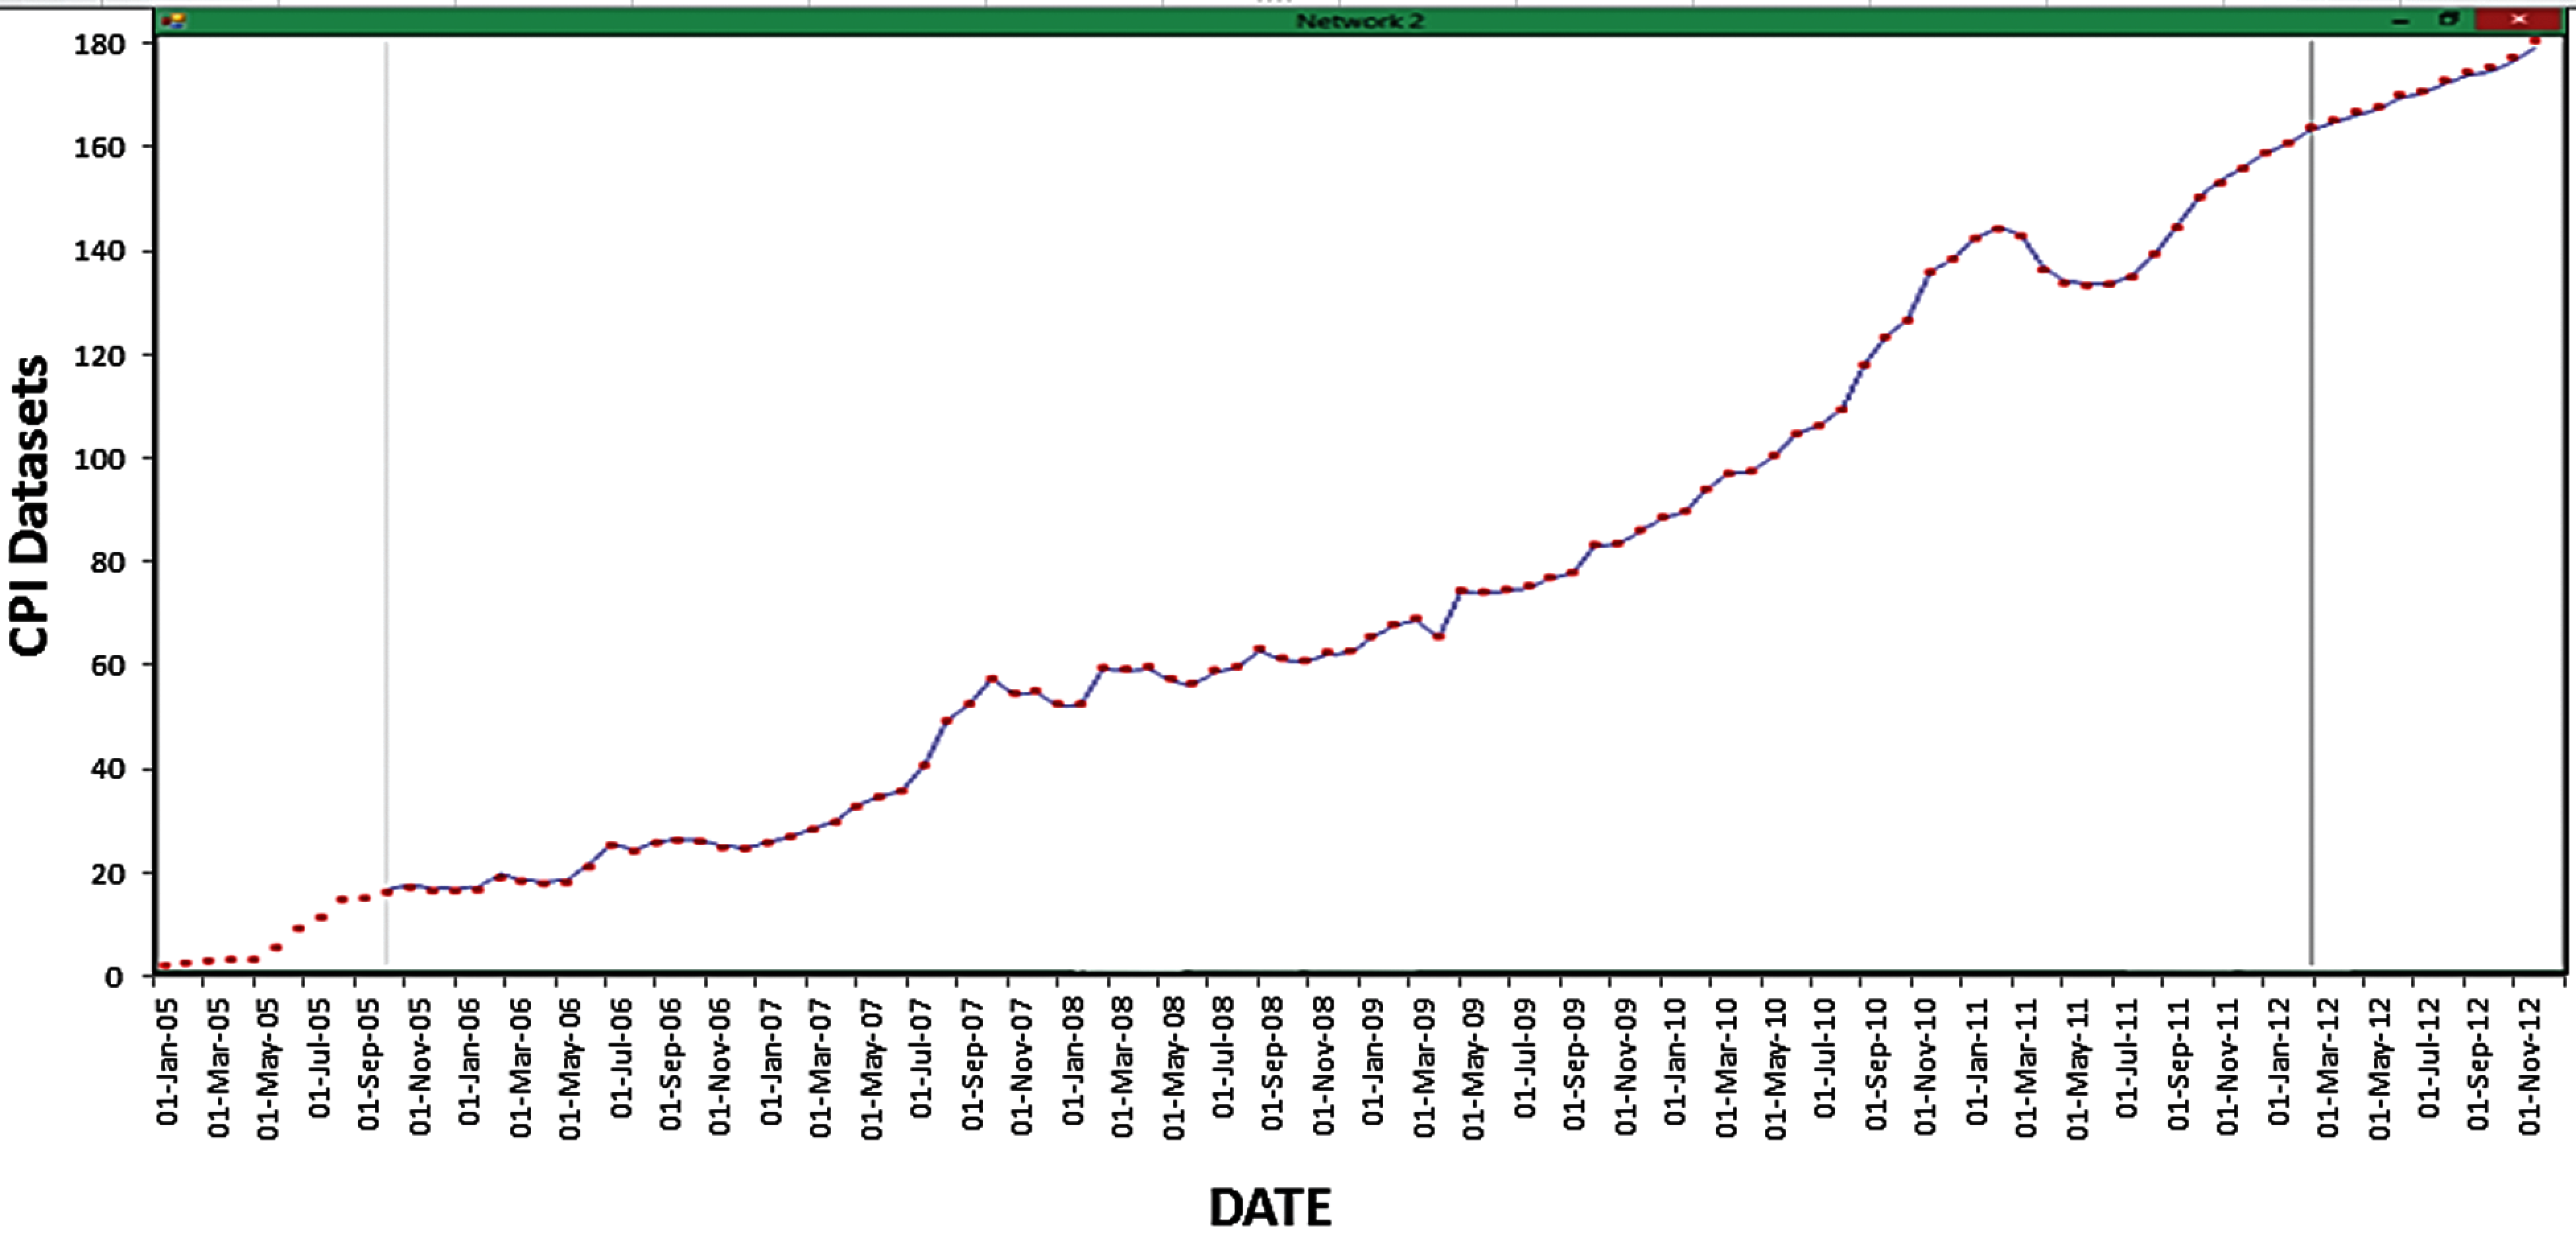
Figure 7: Prediction results of CPI dataset using the hybrid ARIMA/BPNN model scheme

The results for the prediction are shown in Fig. 8. where the consumer price at the vertical axis while time (in months) at the horizontal axis.
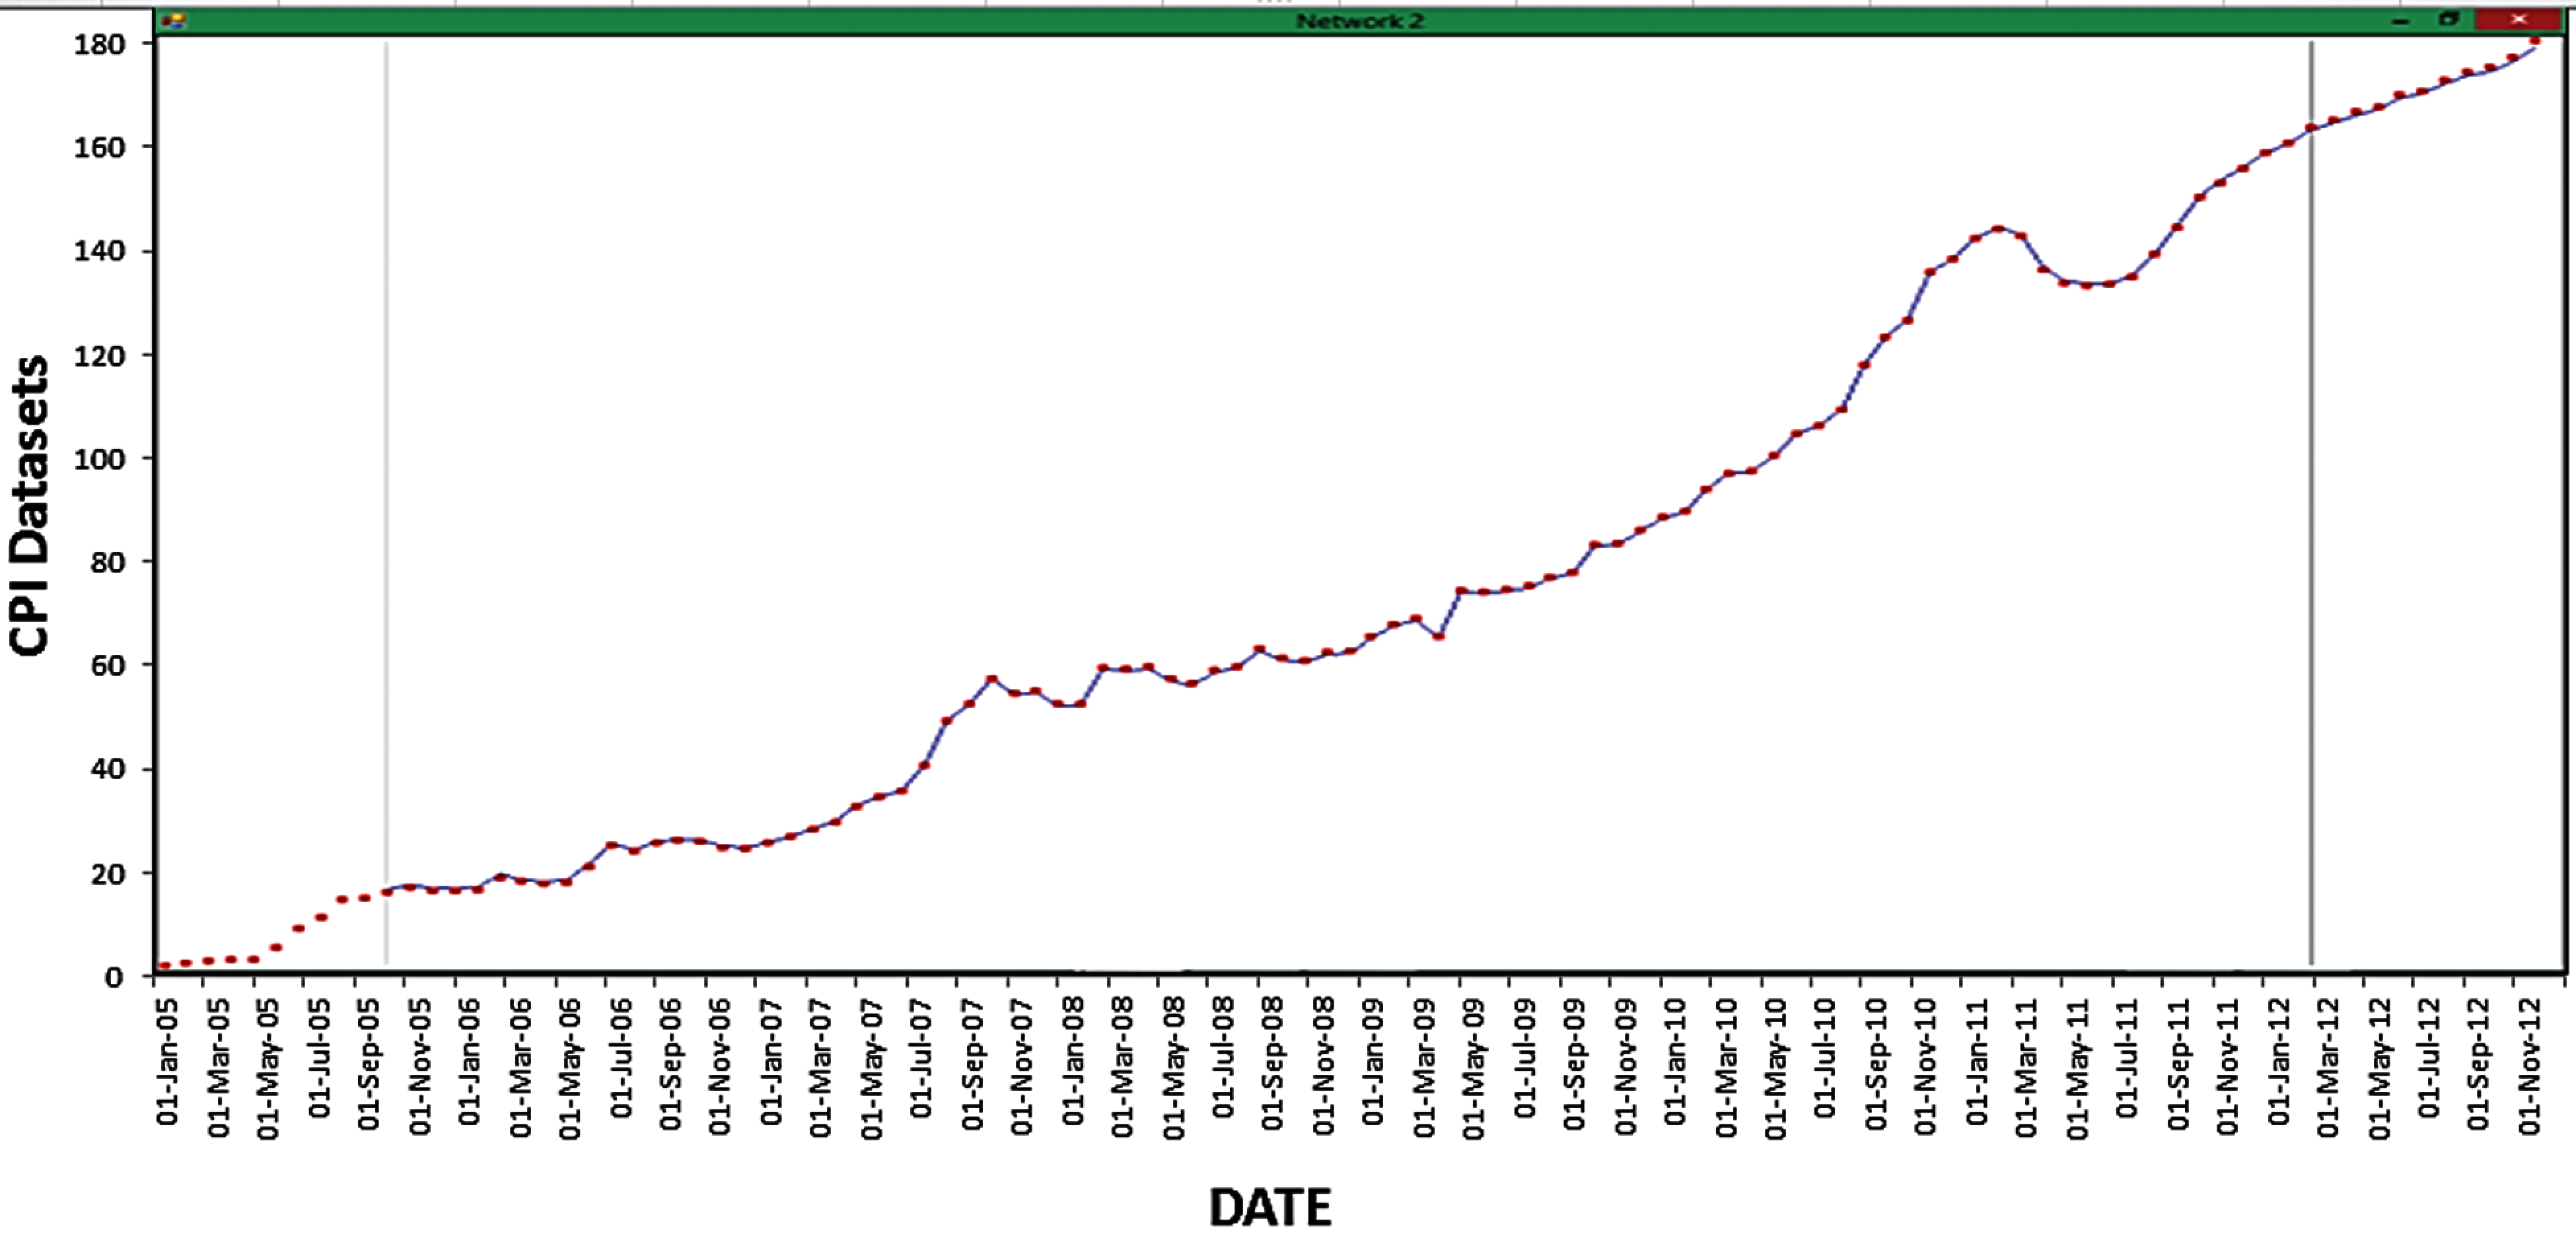
Figure 8: Prediction results of CPI dataset using the hybrid ARIMA/ANN model scheme
3.3 Forecasting for Cancer Patients Dataset
3.3.1 The ARIMA/BPNN Model Scheme for Cancer Patients Dataset
The obtained results of both training and testing phases for the cancer patient's dataset are given in Tab. 8.

In addition, the prediction results produced by the hybrid ARIMA/BPNN model of the cancer patients’ data set are given in Fig. 9, where the number of the cancer patient is on the vertical axis and the time is on the horizontal axis.
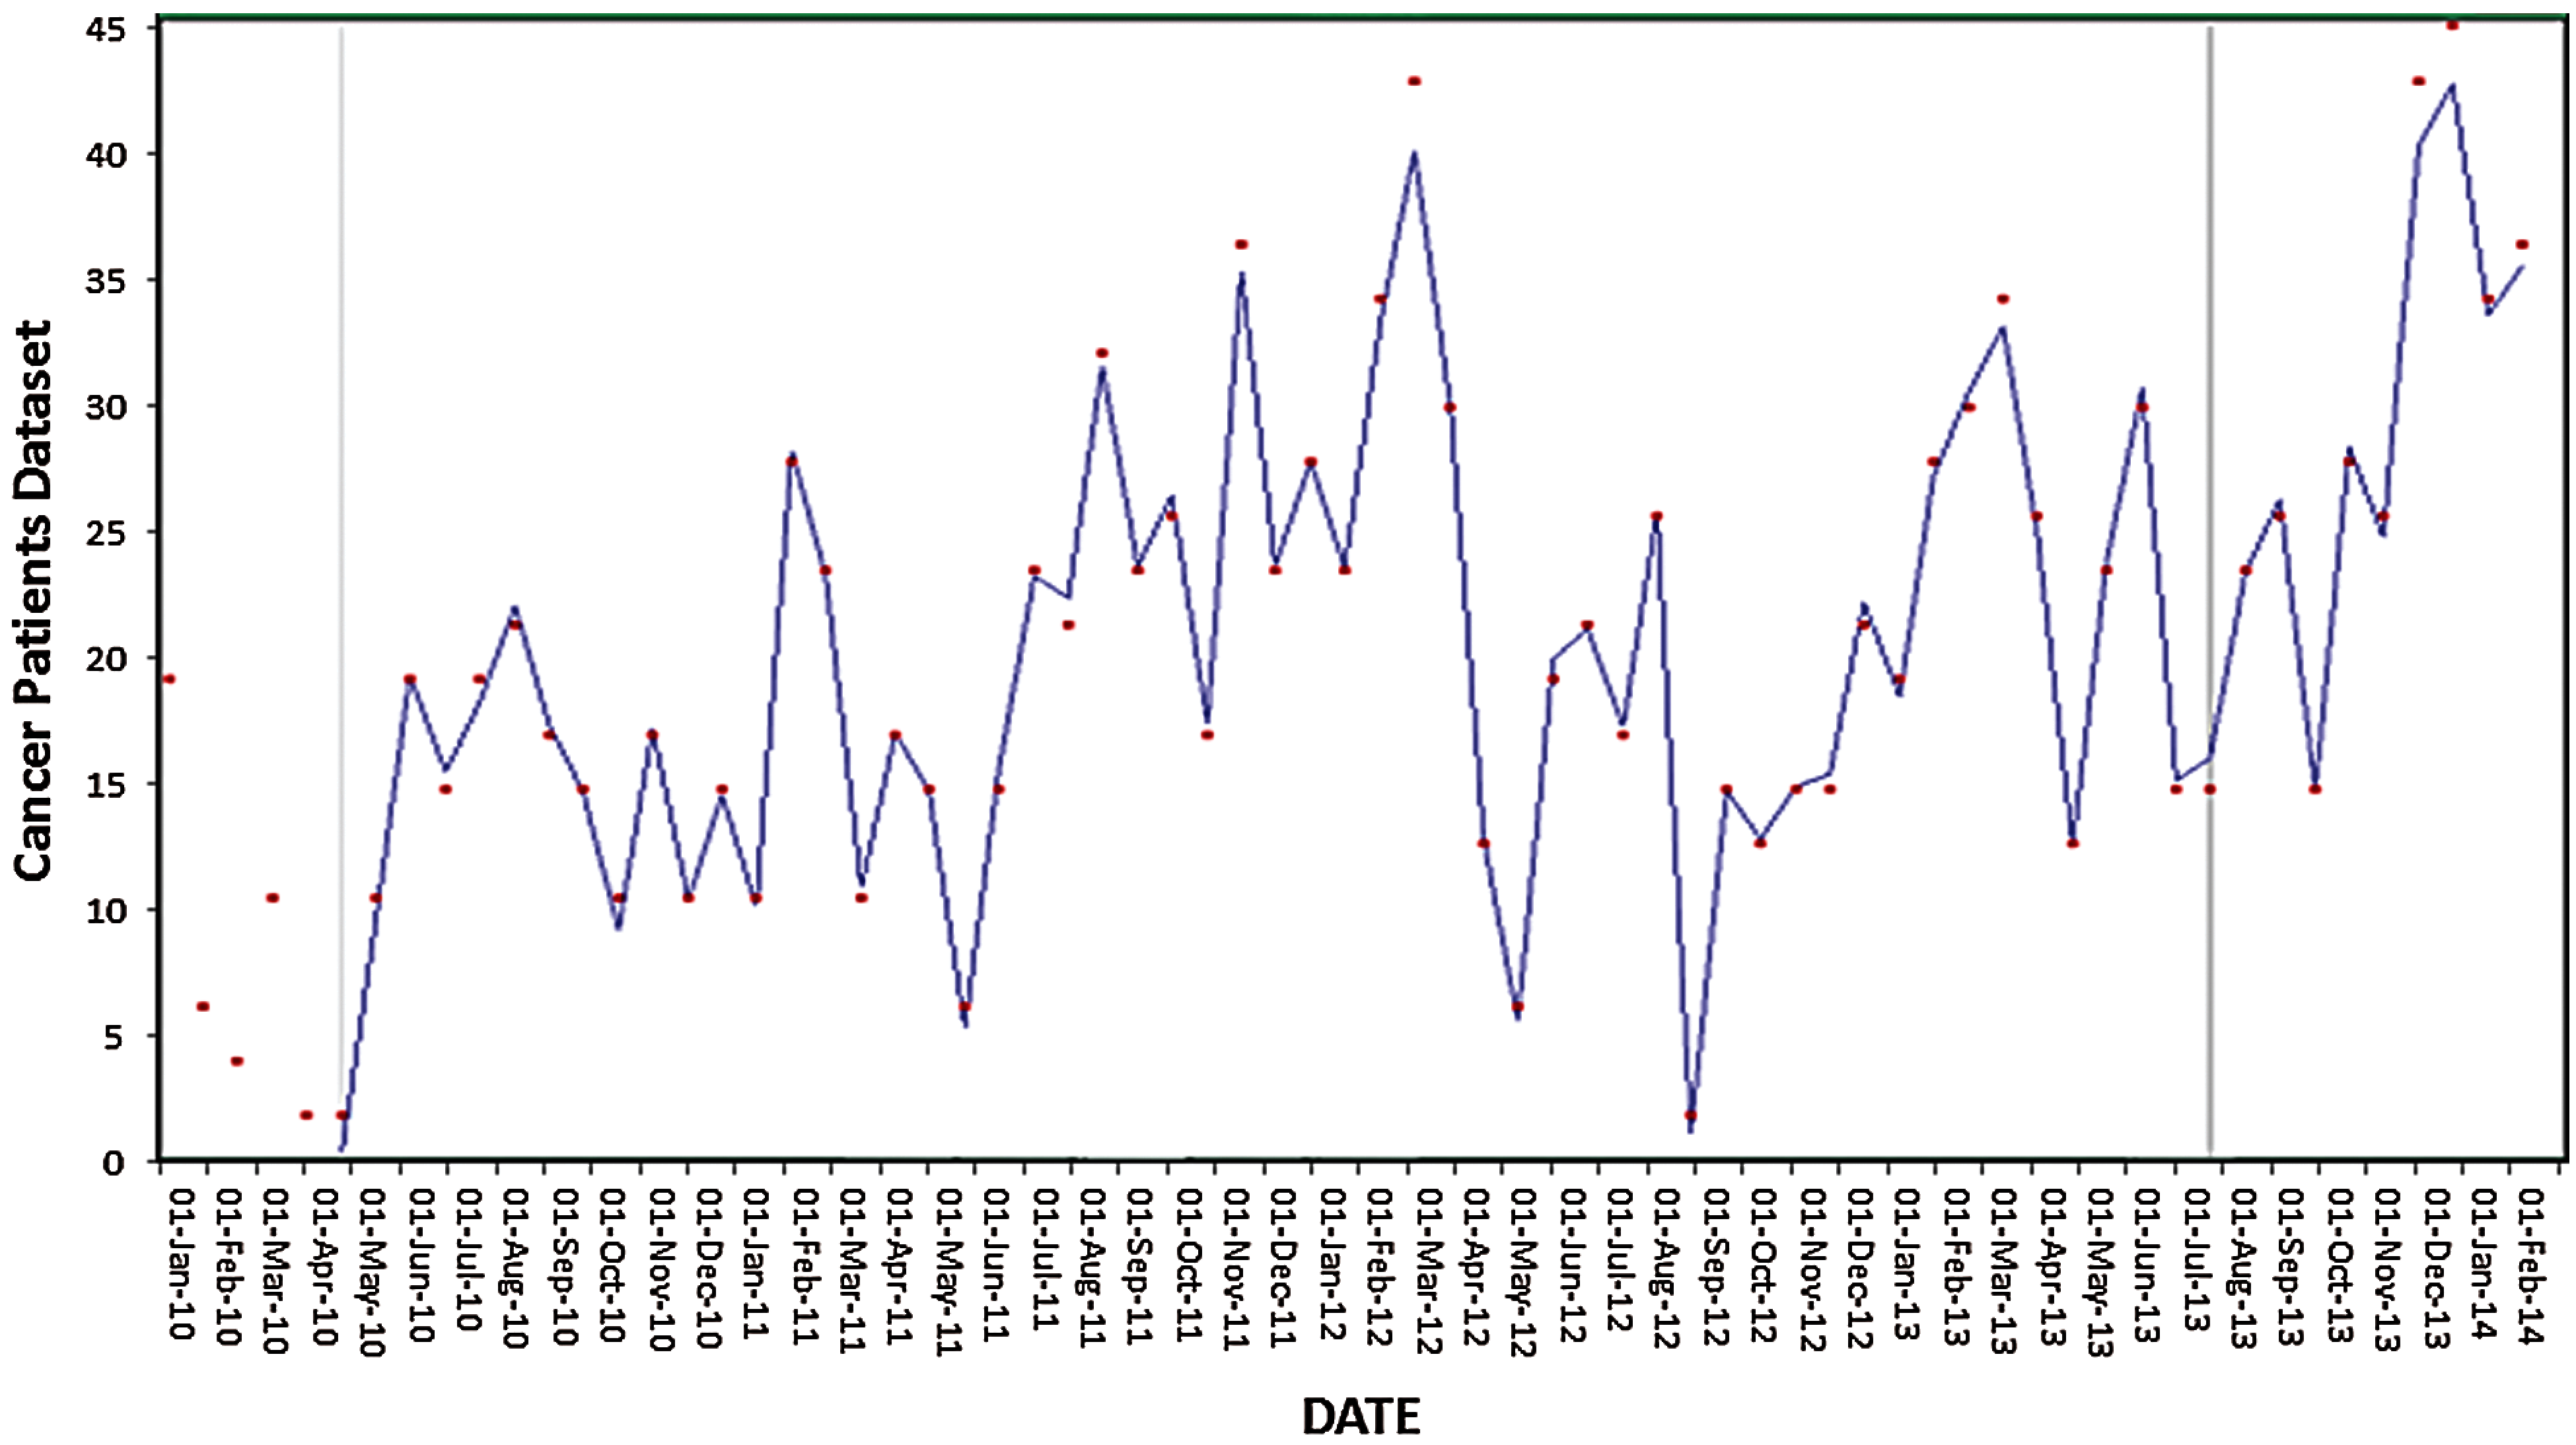
Figure 9: Prediction results of Cancer Patients dataset using the hybrid ARIMA/BPNN model scheme
3.3.2 The Hybrid ARIMA/ANN Model Scheme for Cancer Patients Dataset
The results obtained using the hybrid ARIMA/ANN model scheme for the cancer patients’ dataset for both the training and the testing are presented in Tab. 9.

Prediction results of the cancer patients’ dataset using the hybrid ARIMA/ANN model scheme are shown in Fig. 10, where the vertical axis refers to the cancer patients and the time on the horizontal axis.
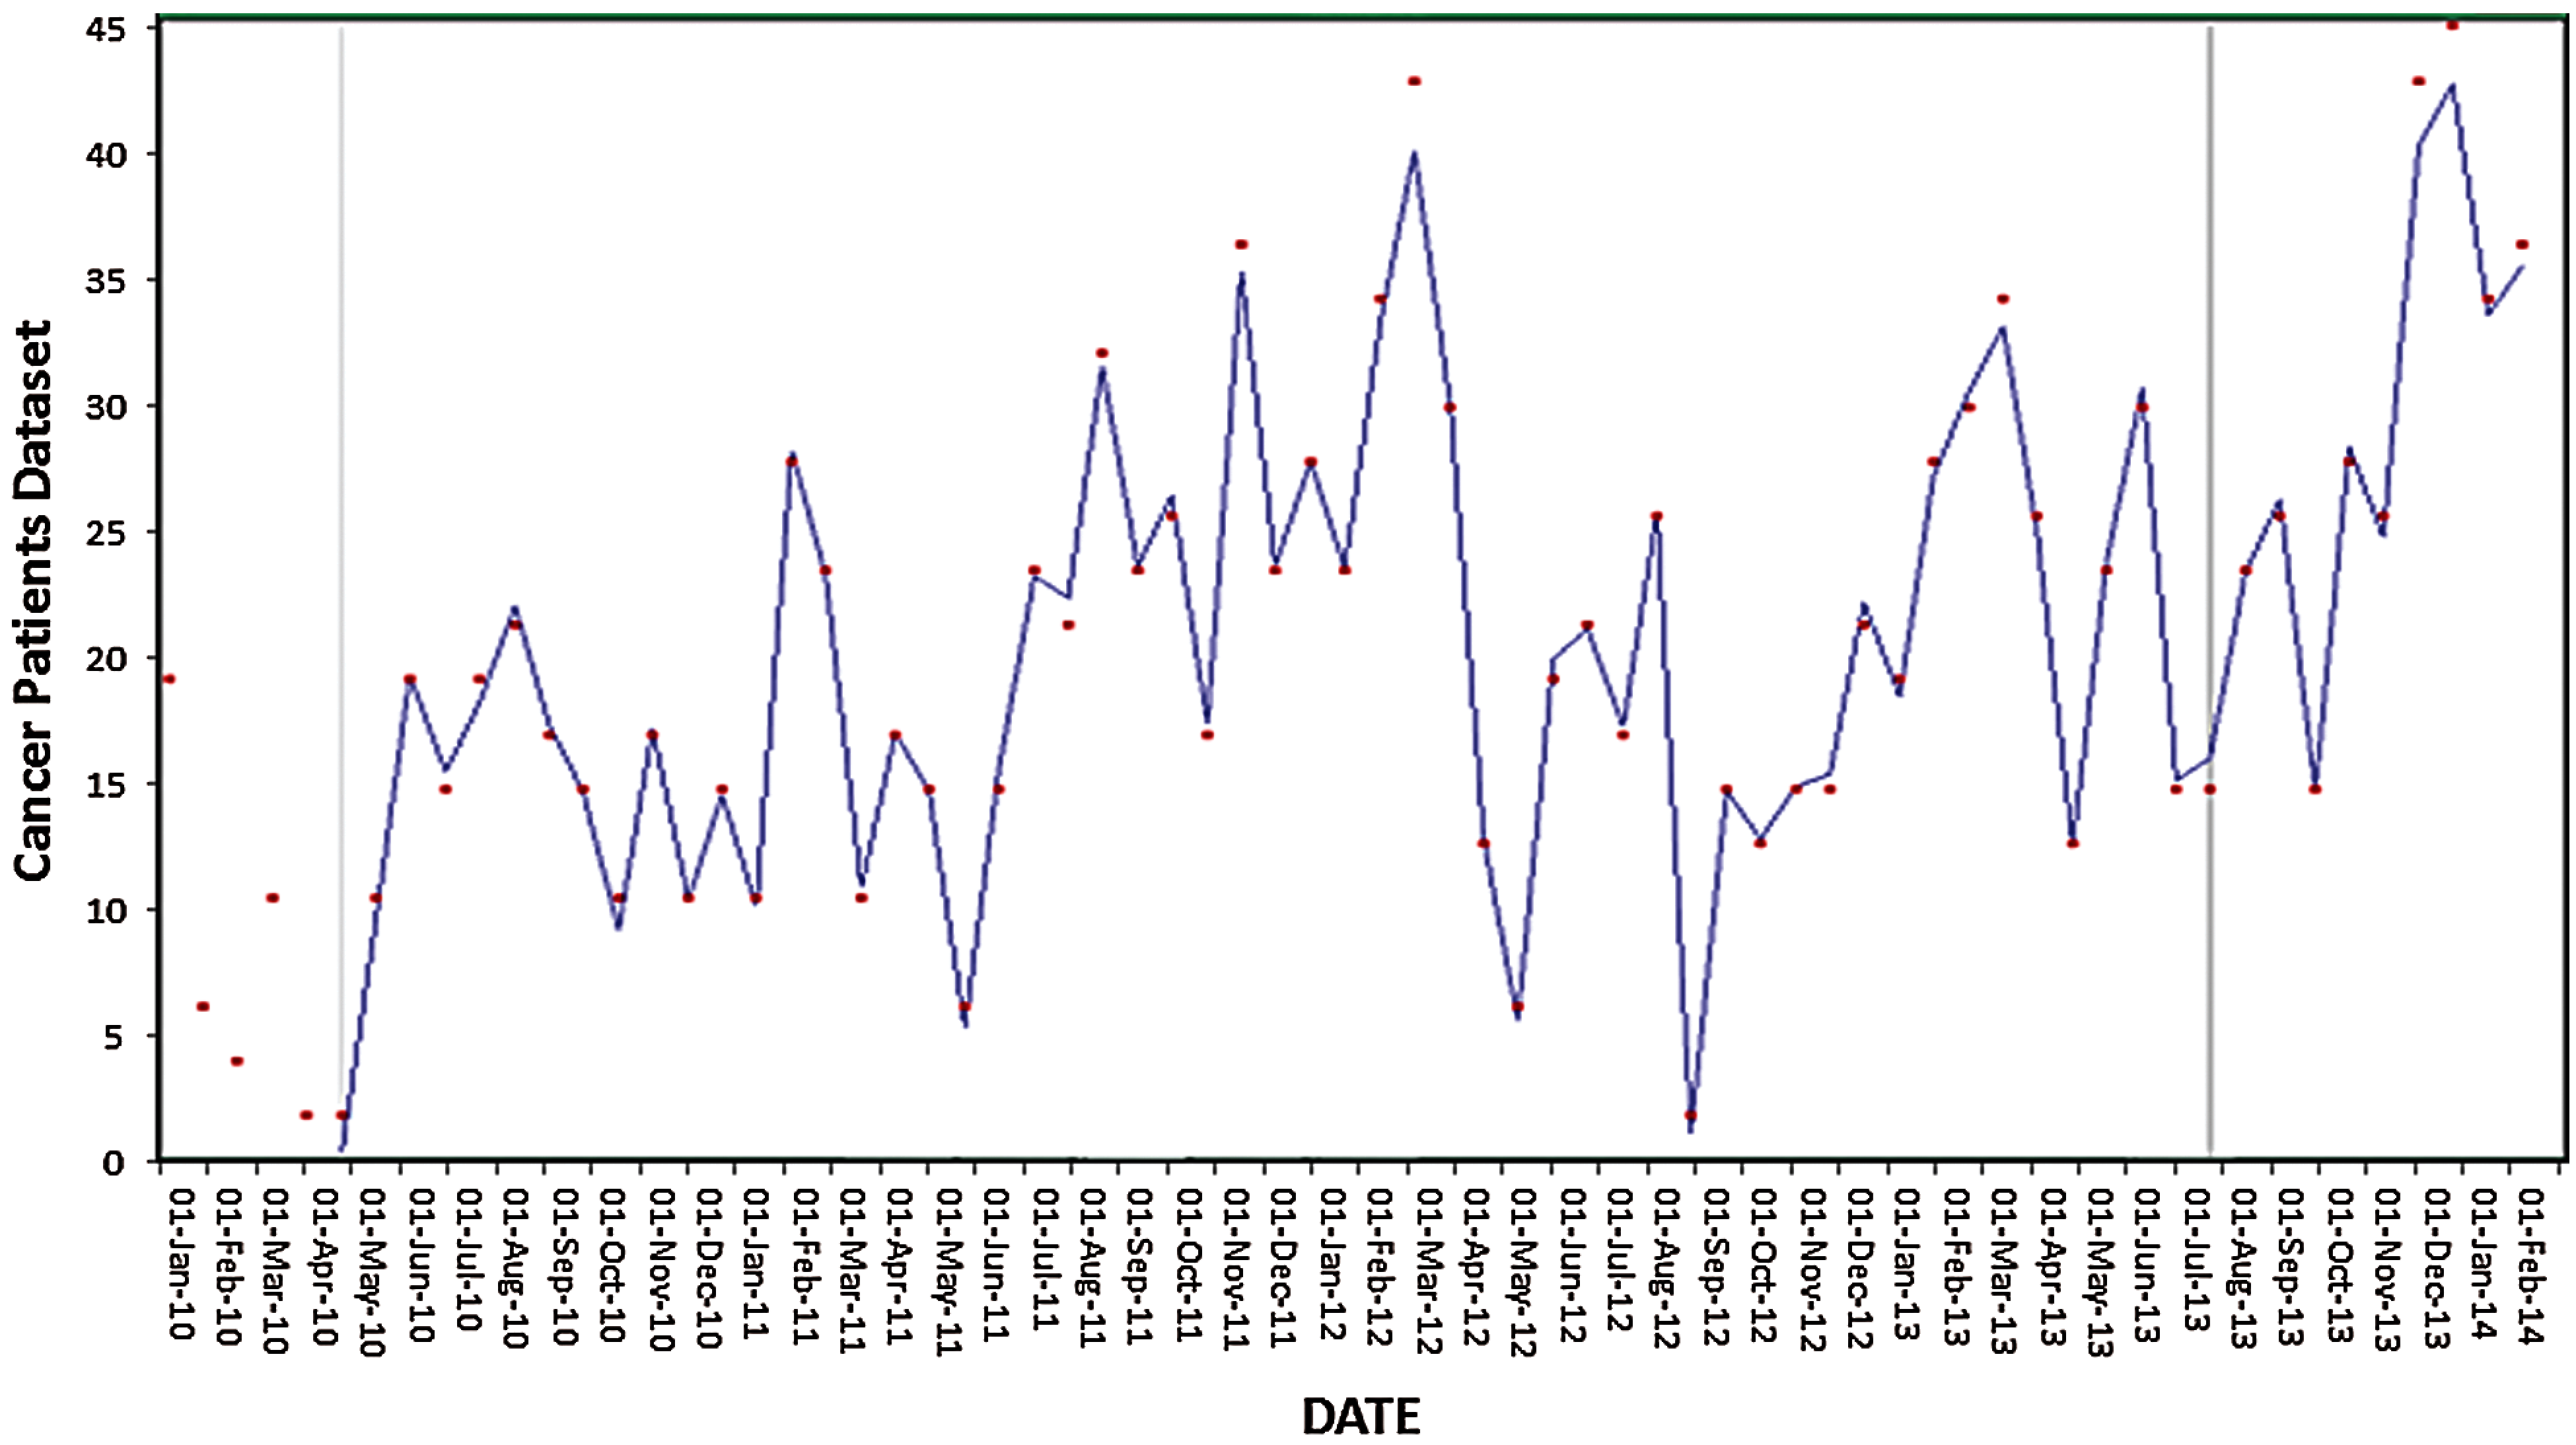
Figure 10: Prediction results of Cancer Patient's dataset using the hybrid ARIMA/ANN model scheme
Comparative analysis of individual models was performed to demonstrate the efficiency of the proposed models. The MAE, MSE, RMSE, and MAPE are selected to be the measures for the accuracy of forecasting. CPI data for the period from February 01, 2013 to December 01, 2014 and cancer patients’ data for the period January 01, 2015 to December 01, 2016 are used in this study. Tab. 10. gives the forecasting results for the CPI data.

Results indicate that when the BPNN model is applied alone, it can increase the accuracy of the forecasting over the ARIMA model by capturing all of the data patterns. The results also show that the hybrid model that combines two models can reduce the errors of forecasting significantly. More precisely, the hybrid ARIMA/ANN model scheme outperforms all other three models with the lowest forecasting errors as indicated by the results. Similarly, the comparison results of cancer patients’ data are given in Tab. 11.

The hybrid model gains the benefits of the ARIMA and the BPNN strength in linear and nonlinear modelling. The hybridization method is proven to improve forecasting performance. The results show that the ARIMA/ANN model scheme outperformed all the other three models used in this research. The more changes occurred in the time series models, the less efficient we can be by using forecasting models in isolation compared to the hybrid models
5 Conclusion and Future Enhancements
For many decision-makers the accuracy of time series forecasting is fundamentally important. In this research, two hybridization models were proposed to increase the forecasting accuracy. These models are the ARIMA/BPNN and the ARIMA/ANN models. A new dataset collected from Yemeni's hospital for cancer patients in Ibb province is used to evaluate the proposed models in addition to the CPI dataset. The proposed models were used jointly for linear and nonlinear models aiming to capture different relationship patterns in the data of time series. For each model, the results are given and analyzed based on statistical standard measures including MAE, MSE, RMSE, and MAPE. The results revealed that the hybrid prediction models reduced the randomness degree, the changes affecting the time series, and the data non-linearity. The results of two real-datasets confirmed the strength of the ARIMA/ANN model over other hybrid and single models introduced in this research. ARIMA/ANN model outperformed each component model used separately by increasing the accuracy of forecasting and decreasing the overall errors. On the other hand, modeling time series using the BPNN demands performing plenty of experiments since BPNN includes a huge number of parameters. These parameters that need to be set up include learning speed, hidden layers numbers, input neurons, iterations number, size of the training set, size of validation, and updating weights.
For future research work, we highly recommend involving the application of the proposed methods in this research to other real-world datasets of a bigger size. In this case, techniques that are more sophisticated need to be explored, such as a deep neural network.
Funding Statement: Researchers would like to thank the Deanship of Scientific Research, Qassim University for funding the publication of this project.
Conflicts of Interest: The authors declare that they have no conflicts of interest to report regarding the present study.
1. N. Kourentzes, D. K. Barrow and S. F. Crone, “Neural network ensemble operators for time series forecasting,” Expert Systems with Applications, vol. 41, no. 9, pp. 4235–4244, 2014.
2. S. Hatem, “Artificial neural networks and their application in the social sciences using SPSS,” Ph.D. Thesis, Institute of Statistical Studies and Research Department of Biostatistics and Population, Cairo University, 2013.
3. X. Shao, C. S. Kim and D. G. Kim, “Accurate multi-scale feature fusion CNN for time series classification in smart factory,” Computers, Materials & Continua, vol. 65, no.1, pp. 543–561, 2020.
4. Y. Almorad, “Comparison between classical regression and artificial neural networks to predict the levels of the results of research students of the faculty of physical education,” Iraqi journal of statistical sciences, faculty of science and mathematics and computing,” University of Mosul, vol. 200, no. 1, pp. 286–303, 2013.
5. A. D. Pwasong and P. Sathasivam, “Forecasting performance of random walk with drift and feed-forward neural network models,” International Journal Intelligent Systems and Applications, vol. 7, no. 9, pp. 49–56, 2015.
6. K. Chen and C. Wang, “A hybrid SARIMA and support vector machines in forecasting the production values of the machinery industry in Taiwan,” Expert System with Applications, vol. 32, no. 1, pp. 254–264, 2007.
7. C. H. Aladag, M. A. Basaran, E. Egrioglu, U. Yolcu and V. R. Uslu, “Forecasting in high order fuzzy times series by using neural networks to define fuzzy relations,” Expert Systems with Applications, vol. 36, no. 3, pp. 4228–4231, 2009.
8. T. Koskela, M. Lehtokangas, J. Saarinen and K. Kaski, “Time series prediction with multilayer perceptron, fir and elman neural networks,” in World Congress on Neural Networks: Int. Neural Network Society 1996 Annual Meeting California, San Diego, USA. pp. 491–498, 1996.
9. S. Mathur, A. Kumar and M. Chandra, “A feature based neural network model for weather forecasting,” International Journal of Computational Intelligence, vol. 4, no. 3, pp. 209–216, 2007.
10. H. Yip, H. Fan and Y. Chiang, “Predicting the maintenance cost of construction equipment: Comparison between general regression neural network and Box-jenkins time series models,” Automation in Construction, vol. 38, no. 1, pp. 30–38, 2014.
11. T. Proietti and H. Lütkepohl, “Does the Box–Cox transformation help in forecasting macroeconomic time series?,” International Journal of Forecasting, vol. 29, no. 1, pp. 88–99, 2013.
12. S. K. Nanda, D. P. Tripathy, S. K. Nayak and S. Mohapatra, “Prediction of rainfall in India using artificial neural network (ANN) models,” International Journal of Intelligent Systems and Applications, vol. 12, no. 5, pp. 1–22, 2013.
13. P. Pai and C. Lin, “A hybrid ARIMA and support vector machines model in stock price forecasting,” Omega, vol. 33, no. 6, pp. 497–505, 2005.
14. J. Singh and P. Tripathi, “Time series forecasting using back propagation neural network with ADE algorithm,” International Journal of Engineering and Technical Research (IJETR), vol. 7, no. 5, pp. 19–23, 2017.
15. F. Toro, G. Meire, F. Glvez and F. Riverola, “A hybrid artificial intelligence model for river flow forecasting,” Application Software Computing, vol. 13, no. 8, pp. 3449–3458, 2013.
16. C. Babu and B. E. Reddy, “A moving-average filter based hybrid ARIMA–ANN model for forecasting time series data,” Applied Software Computing, vol. 23, no.1, pp. 27–38, 2014.
17. “Cancer Facts & Figures” Special Section: Childhood & Adolescent Cancers see page 25, American Cancer Society. Cancer Facts & Figures 2014. Atlanta: American Cancer Society, 2014.
18. N. Chaâbane, “A hybrid ARFIMA and neural network model for electricity price prediction,” International Journal of Electrical Power and Energy Systems, vol. 55, no. 1, pp. 187–194, 2014.
19. I. Khandelwal, R. Adhikari and G. Verma, “Time series forecasting using hybrid ARIMA and ANN models based on DWT decomposition,” Procedia Computer Science, vol. 48, no. 1, pp. 173–179, 2015.
20. H. Omar, V. H. Hoang and D. Liu, “A hybrid neural network model for sales forecasting based on ARIMA and search popularity of article titles,” Computational Intelligence and Neuroscience, vol. 20, no. 3, pp. 1–9, 2016.
21. Y. Yu, Y. Wang, S. Gao and Z. Tang, “Statistical modeling and prediction for tourism economy using dendritic neural network,” Computational Intelligence and Neuroscience, vol. 12, no. 1, pp. 1–9, 2017.
22. X.Lu, D. Que and G. Cao, “Volatility forecast based on the hybrid artificial neural network and GARCH-type models,” Information Technology and Quantitative Management, vol. 91, no. 1, pp. 1044–1049, 2016.
23. M. Khairalla, X. Ning and N. T. AL-Jallad, “Hybrid forecasting scheme for financial time series data using neural network and statistical methods,” International Journal of Advanced Computer Science and Applications, vol. 8, no. 9, pp. 1–9, 2017.
24. M. Gupta, J. Liang and N. Homma, “Static and dynamic neural networks: From fundamentals to advanced theorys,” Wiley-IEEE Press, vol. 17, pp. 5–11, 2003.
25. S. Khah, M. Moghaddam and S. El-Eslami, “Price forecasting of day ahead electricity markets using a hybrid forecast method,” Energy Convers Manage, vol. 52, no. 5, pp. 2165–2169, 2011.
26. D. Salman, “Multiple linear regression the concept model is implemented using statistical program SPSS,” Ph.D. Thesis, University of Baghdad, Iraq, 2013.
27. B. M. Al-Maqaleh, A. A. Al-Mansoub and F. N. Al-Badani, “Forecasting using artificial neural network and statistics models,” International Journal Education and Management Engineering, MECS, vol. 3, no. 1, pp. 20–32, 2016.
28. N. Revathy and T. Guhan, “Face recognition system using back propagation artificial neural networks,” International Journal of Advanced Engineering Technology, vol. 3, no. 1, pp. 1–15, 2012.
29. S. Jere and E. Moyo, “Modelling epidemiological data using Box-jenkins procedure,” Open Journal of Statistics, vol. 6, pp. 295–302, 2016.
30. M. Khashei and M. Bijari, “A novel hybridization of artificial neural networks and ARIMA models for time series forecasting,” Application Software Computing, vol. 11, no. 2, pp. 2664–2675, 2011.
31. H. Camelo, P. Lucio, J. Junior, D. Santos and P. Carvalho, “Innovative hybrid modeling of wind speed prediction involving time-series models and artificial neural networks,” MDPI, vol. 9, pp. 1–18, 2018.
32. R. L. Aquino and R. Addawe, “A hybrid ARIMA and neural network model applied to forecast catch volumes of selar crumenophthalmus,” AIP Conference Proceedings, vol. 1905, pp. 1–16, 2017.
 | This work is licensed under a Creative Commons Attribution 4.0 International License, which permits unrestricted use, distribution, and reproduction in any medium, provided the original work is properly cited. |