DOI:10.32604/cmc.2022.020713
| Computers, Materials & Continua DOI:10.32604/cmc.2022.020713 | |
| Article |
Optimal Deep Convolution Neural Network for Cervical Cancer Diagnosis Model
1Department of Medical Equipment Technology, College of Applied Medical Sciences, Majmaah University, Al Majmaah, 11952, Saudi Arabia
2Faculty of Applied Computing and Technology, Noroff University College, Kristiansand, 4608, Norway
3Research Group of Embedded Systems and Mobile Application in Health Science, College of Arts, Media and Technology, Chiang Mai University, Chiang Mai, 50200, Thailand
*Corresponding Author: Orawit Thinnukool. Email: orawit.t@cmu.ac.th
Received: 03 June 2021; Accepted: 04 July 2021
Abstract: Biomedical imaging is an effective way of examining the internal organ of the human body and its diseases. An important kind of biomedical image is Pap smear image that is widely employed for cervical cancer diagnosis. Cervical cancer is a vital reason for increased women’s mortality rate. Proper screening of pap smear images is essential to assist the earlier identification and diagnostic process of cervical cancer. Computer-aided systems for cancerous cell detection need to be developed using deep learning (DL) approaches. This study introduces an intelligent deep convolutional neural network for cervical cancer detection and classification (IDCNN-CDC) model using biomedical pap smear images. The proposed IDCNN-CDC model involves four major processes such as preprocessing, segmentation, feature extraction, and classification. Initially, the Gaussian filter (GF) technique is applied to enhance data through noise removal process in the Pap smear image. The Tsallis entropy technique with the dragonfly optimization (TE-DFO) algorithm determines the segmentation of an image to identify the diseased portions properly. The cell images are fed into the DL based SqueezeNet model to extract deep-learned features. Finally, the extracted features from SqueezeNet are applied to the weighted extreme learning machine (ELM) classification model to detect and classify the cervix cells. For experimental validation, the Herlev database is employed. The database was developed at Herlev University Hospital (Denmark). The experimental outcomes make sure that higher performance of the proposed technique interms of sensitivity, specificity, accuracy, and F-Score.
Keywords: Biomedical images; deep learning; cervical cancer; pap smear images; computer aided diagnosis; herlev database
In recent times, biomedical imaging tools have become popular and widely employed to visualize the internal parts of the body in the diagnostic process. Since it is non-invasive, biomedical imaging provides accurate identification of metabolites which can be employed as a biomarker for disease detection and classification. One among the biomedical image is pap smear images that are used to diagnose cervical cancer and are the main reason for death from cancer in women. Cervical Cancer is an anomalous growth of cells from the cervical portion of the female’s body. It can be deliberated as second most popular type of cancer following breast cancer [1]. However, it is established to be higher risks compared to breast cancer since it possibly doesn’t show other kinds of feasible symptoms till it attains the severe condition of the disease. The life time of the cervical cancer person is based on the earlier stage of its recognition and henceforth cervical cancer should be detected at the earlier stage via proper check-ups [2]. The significant detecting test is certain to cervical cancers like pelvic analysis, colposcopy, Human Papillomavirus investigation, Pap smear test [3]. Pap smear based screening tests is established to be substantial between present cervical cancer detecting test presents in the medicinal field. In this Pap Smears based screening test, the speculum is injected as to a vaginal portion of females for opening wider the vagina and cervix in to collect cells for investigation [4]. The problem that rises in the procedure of accurate diagnoses of Pap smear cell based cervical cancer recognition is poor contrast and inconsistent stain of cell makes the extraction procedure on cervical cells are highly complex. Despite huge amount of present commercial approaches to diagnose cervical cancer anomalies, they are deliberated costly and require human expertise to operate [5]. Furthermore, the instance smear is utilized to investigate that contains cell amount ranges from 1000 to 10000 that makes the procedure of automatic examination a difficult process.
The conventional diagnosis technique is to screen for cervical cancer using automatic examination. But, it has few drawbacks in this conventional technique. For instance, there are several uncontrollable impact aspects and certain errors with automatic examinations. Simultaneously, AI has established very quickly in the smart medicine field. Thus, an increased amount of researchers have initiated to investigate the utilization of computer image processing techniques for detecting cervical cancer. The DL, a significant technique of AI, was broadly utilized in image detection [6]. Further, the CNN attains outstanding efficiency in image classification between the many DL techniques. The network could process directly the original image, avoid the requirement for pre-processing complex images. It integrates the 3 factors of pooling, local receptive field, and weight sharing that significantly decreases the training variables of NN [7]. Consequently, study on utilization of CNN for diagnosing medical images is raising. Commonly artificial features are utilized by researchers mostly consist of texture, colour, and morphology. Generally, the extraction of colour features are depending upon RGB colour. Additionally, the HSI colour space is broadly utilized. Afterward carefully monitoring of cervical cells, [8] presented twenty morphological features, containing circumference, area, and nuclear cytoplasmic (N to C) ratio. The GLCM is a technique often utilized if the researcher extracts texture feature of the cell that mostly includes entropy, contrast, and energy [9].
This study introduces an intelligent deep convolutional neural network for cervical cancer detection and classification (IDCNN-CDC) model using biomedical pap smear images. The proposed IDCNN-CDC model involves four major processes like preprocessing, segmentation, feature extraction, and classification. Primarily, the Gaussian filter (GF) technique is applied to enhance data through noise removal process in the Pap smear image. The Tsallis entropy technique with the dragonfly optimization (TE-DFO) algorithm determines the segmentation of an image to identify the diseased portions properly. The cell images are fed into the DL based SqueezeNet model to extract deep-learned features. Finally, the extracted features from SqueezeNet are applied to the weighted extreme learning machine (ELM) classification model to detect and classify the cervix cells. For experimental validation, the Herlev database is employed.
Ghoneim et al. [10] presented cervical cancer cell classification and detection scheme depending upon CNN. The cell images are fed to CNN module for extracting DL features. Later, an ELM based classification categorizes the input image. CNN module is utilized by fine tuning and TL. Other AE, ELM, and MLP based classifications are examined. The goal of this work [11] is the automated diagnosis of cervical cancer. Due to this, a dataset having thirty attributes, 668 instances, and four targeted parameters (Hinselmann, Citology, Schiller, and Biopsy) from UCI database has been utilized in testing and training stages. Softmax classification with stacked AE, most DL approaches were utilized for classifying datasets. Initially, with the utilization of stacked AE to raw datasets, a dimensional reduction dataset is attained.
Dong et al. [12] presented a cell classification technique that integrates artificial features and Inception v3 that efficiently enhances the accurateness of cervical cell detection. Additionally, for addressing the under fitting problems and execute efficient DL training with comparatively smaller number of medicinal data, this study inherits the robust learning capability in TL and attains effective and accurate cervical cell image classification depending upon Herlev dataset. Perlin et al. [13] presented a DL technique to detect cervix cancer in pap-smear images. Instead of training and designing CNN from scratch, they display that it could utilize pre-trained CNN framework as feature extractor and utilize output feature as input for training SVM Classification.
William et al. [14], unlike local adaptive histogram equalization, was utilized for image improvement. Cell segmentation has been attained by Trainable Weka Segmentation classification, and sequence rejection method has been utilized for debris elimination. The FS has been attained by simulative annealing combined by wrapper filter, whereas classification has been attained by fuzzy c-means technique. Alyafeai et al. [15] developed fully automated pipeline for cervical cancer classification and cervix recognition from cervigram images. The presented pipeline contains 2 pretrained DL modules for automated cervical tumor classification and cervix recognition.
Devi et al. [16] emphases on the advantages of NGCS assisted on preprocessed cervical image. This NGCS based segmentation is mostly utilized to investigate the overlapping context of cervical smear preprocessed images for optimum classifier accurateness. This NGCS based segmentation is in charge for separating input pre-processed image to differentiated amount of non-overlapping areas that helps in optimum insight at ease. In William et al. [17], Scene segmentation has been attained by y Trainable Weka Segmentation classification and sequence rejection method has been utilized to debris elimination. The FS has been attained by simulative annealing combined by wrapper filter, whereas classification has been realized by fuzzy C-means method. Though several methods are available in the literature, it is still needed to explore the DL based cervical classification process using pap smear images.
The working principle of the IDCNN-CDC model is illustrated in Fig. 1. The proposed IDCNN-CDC method contains four major processes namely GF based preprocessing, TE-DFO based segmentation, SqueezeNet based feature extraction, and WELM based classification. Primarily, GF approach is employed for enhancing the pap smear image quality by the reduction of noise with no blurring of edges. These modules are elaborated in the succeeding sections.
Next to image pre-processing, the TE-DFO based segmentation technique is employed to determine the infected regions in the pap smear image. Commonly, entropy is connected to a disorder metric in this technique. But, Shannon modified the concept of entropy to measure uncertainty depending upon data content of the system. It is further guaranteed that the Shannon entropy retains the additive property as determined under.
By the concepts of multiple fractals, the Tsallis entropy is extended to non-extensive module using a general entropy formation:
where
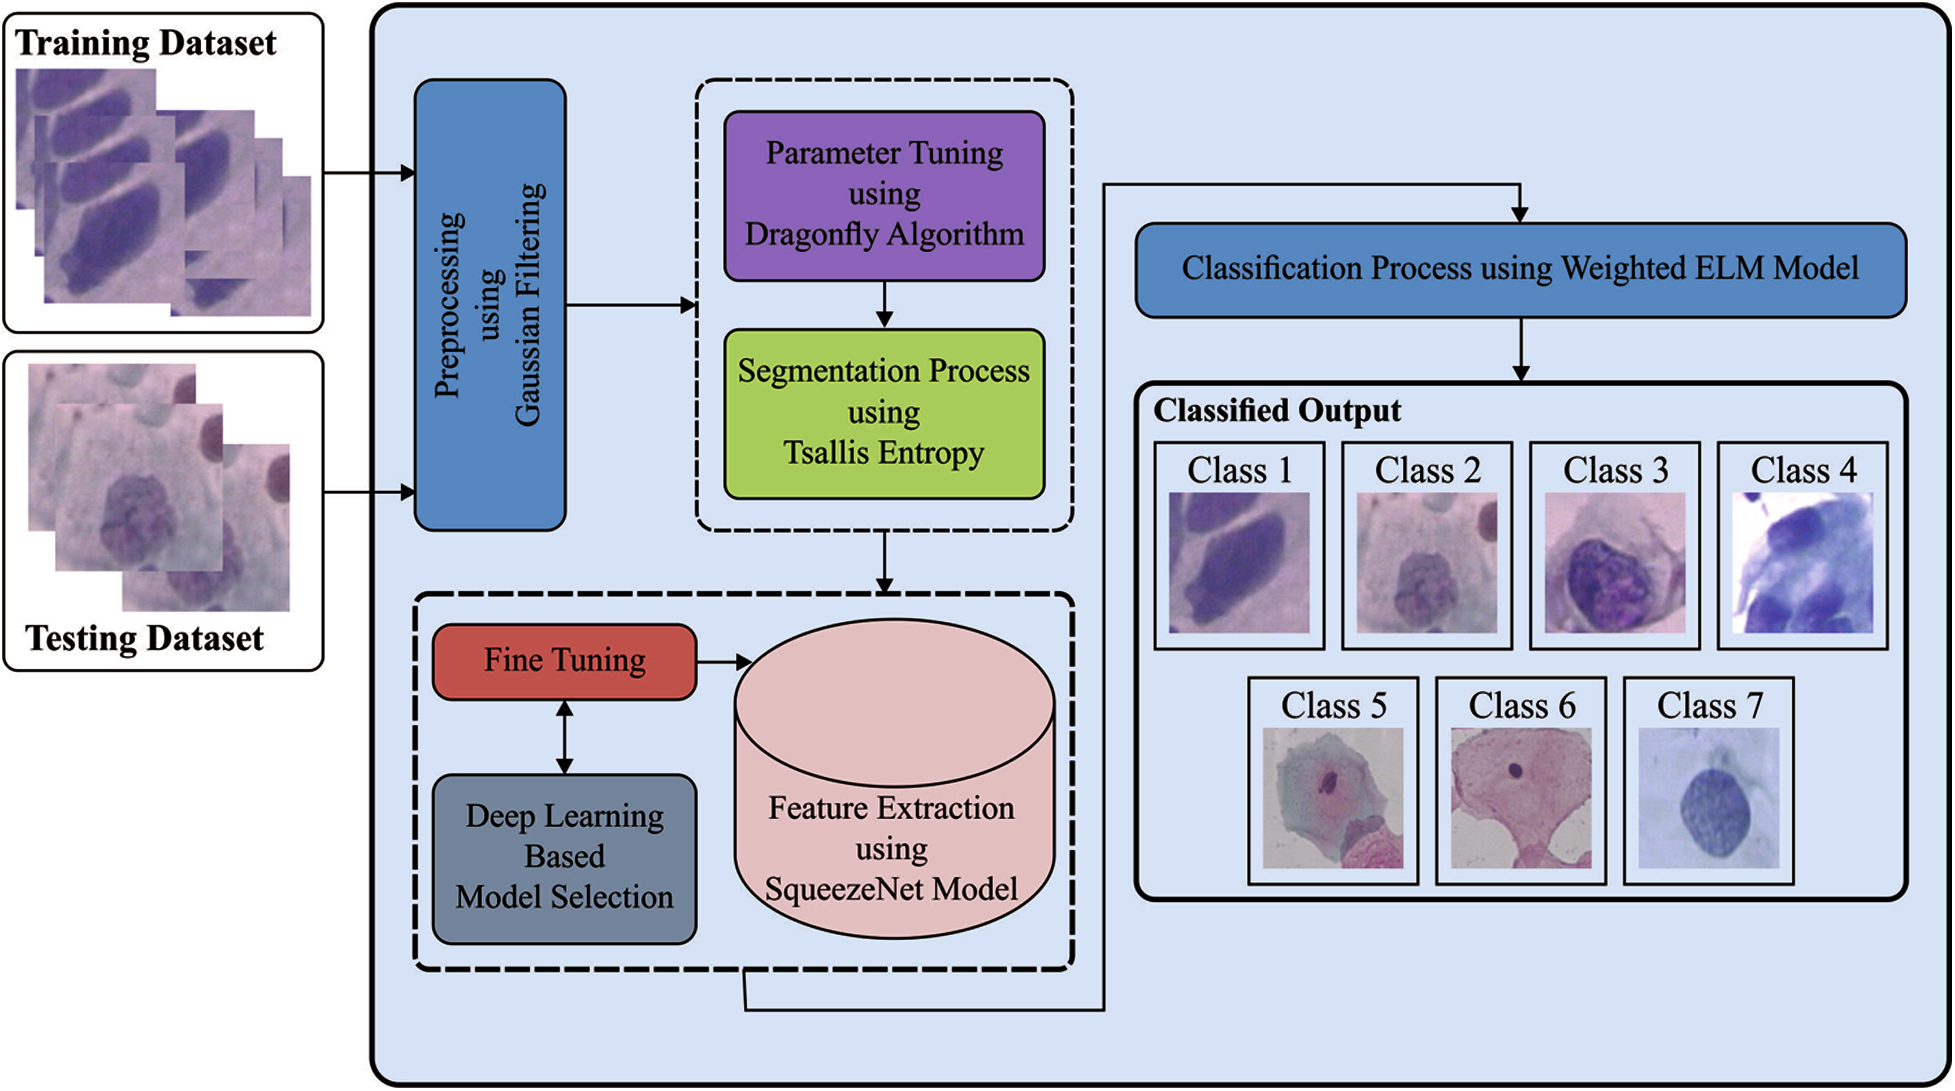
Figure 1: The overall process of IDCNN-CDC model
This idea is currently used for thresholding images. Assume grayscale levels
Subject to the succeeding limitation of:
whereas
It is noteworthy that the limitations are guaranteed in the proposed method to offer consistency. An optimal threshold value ‘
whereas
as well as
Subject to the group of limitations denoted by:
where,
The DFO algorithm was established in Mirjalili [19]. Is method is a metaheuristic technique depending upon swarm intelligence (SI), is stimulated using dynamic and static behaviors of dragonflies in nature. It contains exploitation and exploration phases. These 2 stages have been implemented using dragonflies, whether statically/dynamically seeking food/avoid the enemy.
It has 2 cases whereas SI develops in dragonflies: migration and feeding. Feeding is implemented as static swarm from optimization; migration is implemented as dynamic swarm. Based on this, the swarm contains 3 certain behaviors: cohesion, separation, and alignment. Now, the idea of separation implies an individuals from the swarm avoids static collision with their neighbors (Eq. (8)). Alignment indicates speed where the agents are coordinated using the neighboring individual (Eq. (9)). Lastly, the idea of cohesion displays the propensity of individuals to the center of herd (Eq. (10)).
The 2 further behaviors include these 3 fundamental behaviors in
In aforementioned equation,
For updating the location of artificial dragonflies in search space and simulated their movement, 2 vectors are deliberated: step (X) and location (X).
whereas values of
During feature extraction process, the SqueezeNet model is utilized on the segmented pap smear image to generate feature vectors. Squeeze Net is a DL module that comprises 15 layers with 5 different layers as 3 max pooling layers, 1 global average pooling layer, 8 fire layers, one output softmax layer, and two convolution layers. The input of network contains 227 * 227 dimensional with RGB channel. The input image is generalized by max pooling and convolution functions. The convolution layer would convolute between weight and small region in the input volume with 3 * 3 kernel. It uses from fire layer which incorporates expansion and squeeze phases amongst the convolutional layers. The input of the fire and output tensor scale is stable. The squeeze phase utilizes the filters of size 1 * 1, whereas the expansion utilizes the size of the filters of 1 * 1 and 3 * 3. Primarily, the input tensor H × W × C allows via squeeze and the amount of convolutions are corresponding to C/4 of input tensor channel amount. Eventually, the expansion results are arranged in the depth dimension of input tensor using concatenation operation.
At the final stage, the WELM technique is implemented to allocate proper class labels to the input pap smear image. ELM is employed for classifying the balanced dataset where WELM is utilized for classifying imbalanced dataset. The framework of ELM is illustrates in Fig. 2.
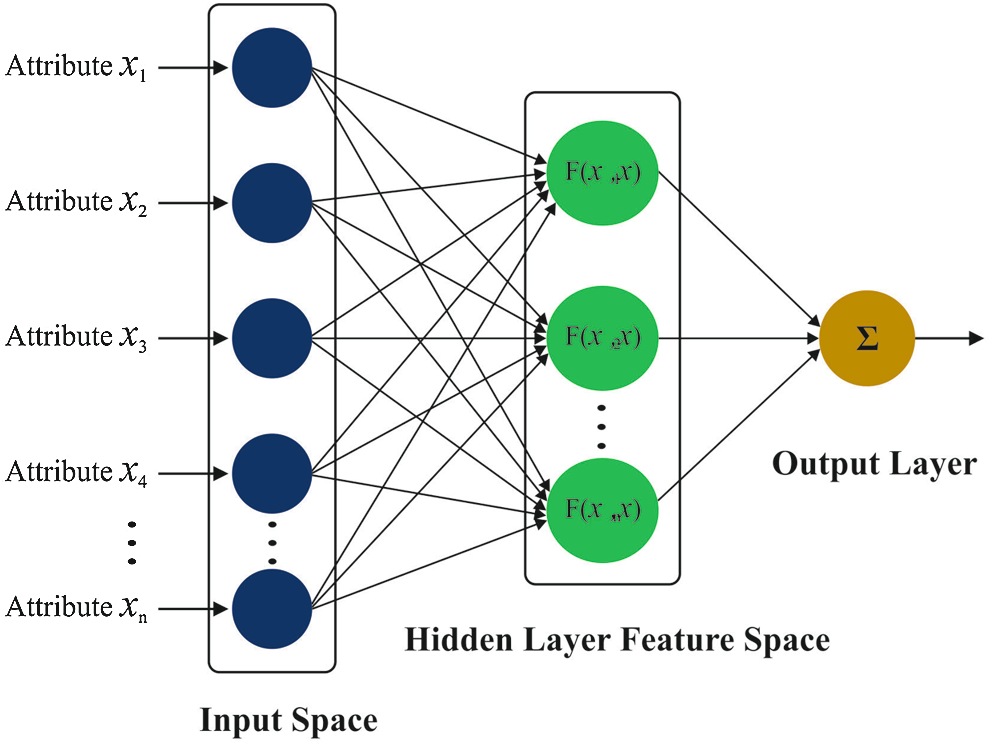
Figure 2: Structure of ELM
Hence, this segment defines the creation of WELM [21]. The trained dataset has
whereas
whereas
where
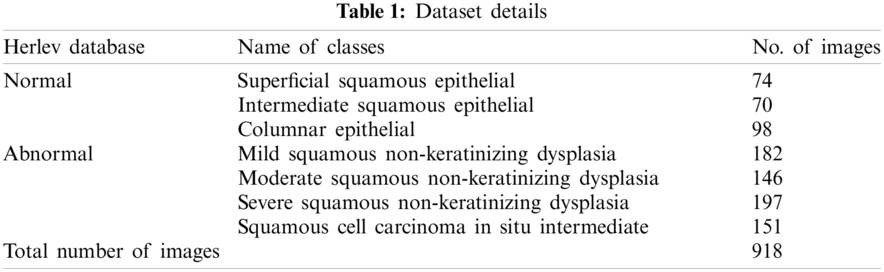
For experimental analysis, Herlev database is utilized, which comprises 918 cells and 7 class labels. Among the 7 classes, 3 classes come under normal class and 4 classes come under abnormal class. Totally, 242 images fall into normal class and 675 images fall into abnormal class. Fig. 3 depicts the sample test images and the dataset details are provided in Tab. 1.
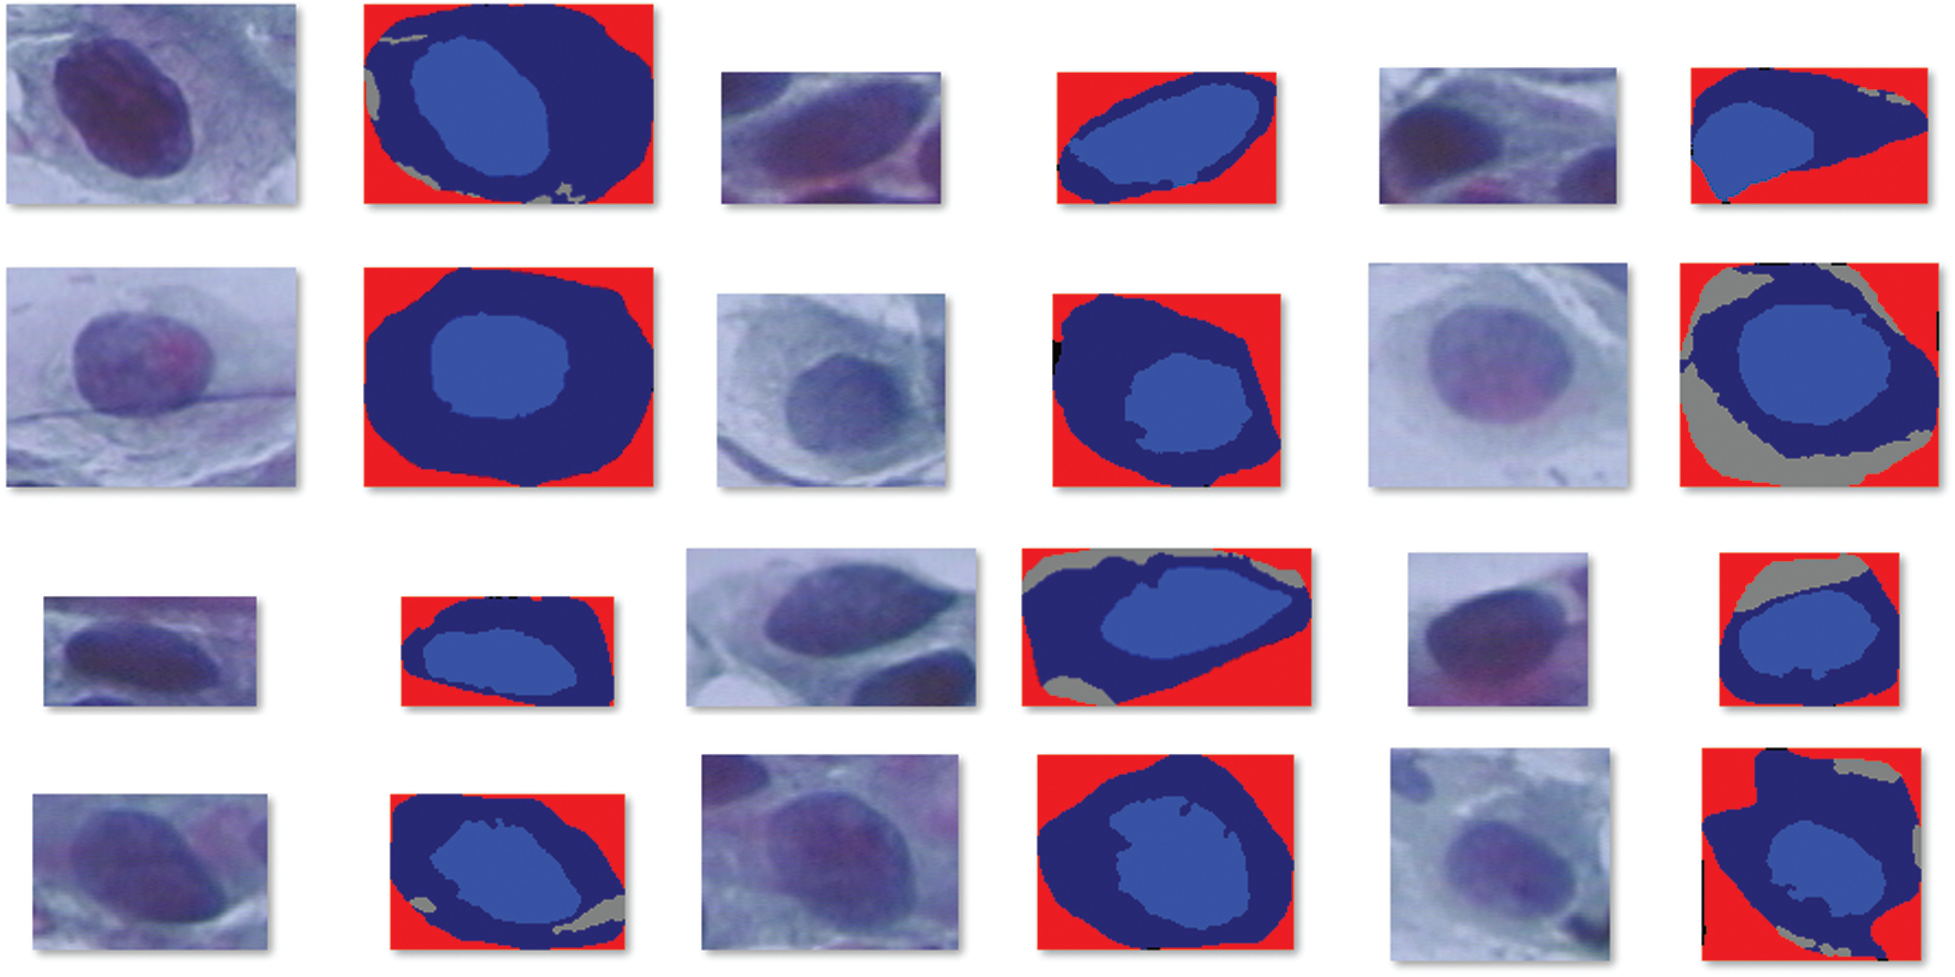
Figure 3: Sample test images
Tab. 2 examines the classification performance of the IDCNN-CDC with other ML models under different folds of cross-validation (CV).
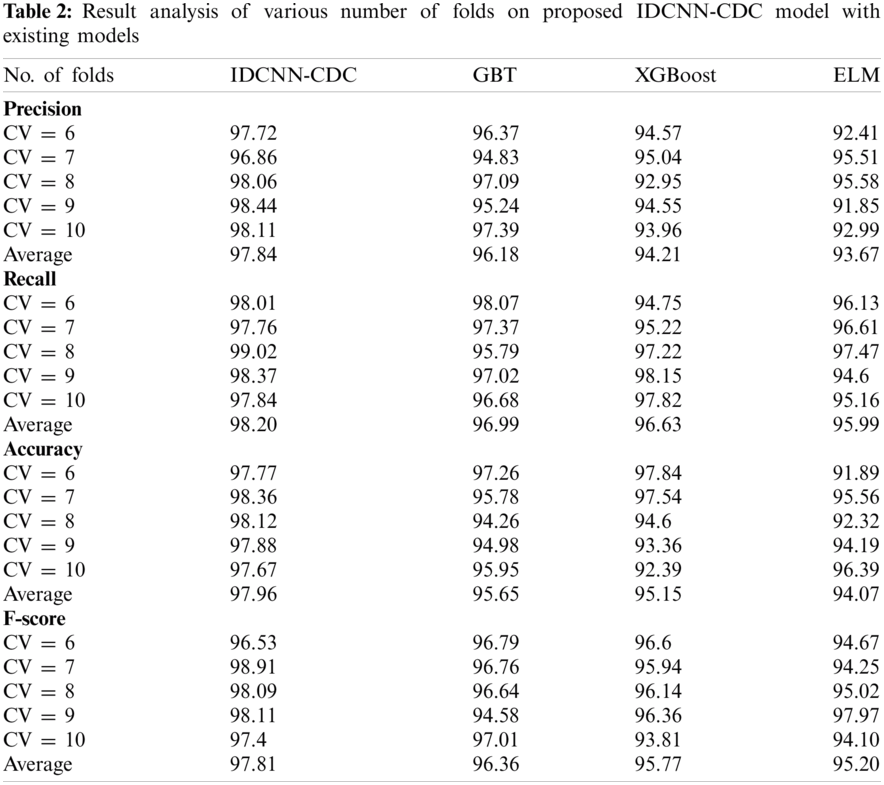
Fig. 4 demonstrates the precision analysis of the IDCNN-CDC model under distinct CV. The figure exhibited that the IDCNN-CDC model has accomplished superior performance with higher precision values. For instance, with CV = 6, the IDCNN-CDC model has attained a higher precision of 97.72% whereas the GBT, XGBoost, and ELM approaches have reached a lesser precision of 96.37%, 94.57%, and 92.41% respectively. Likewise, with CV = 8, the IDCNN-CDC method has attained a maximal precision of 98.06% whereas the GBT, XGBoost, and ELM approaches have reached a lesser precision of 97.09%, 92.95%, and 95.58% correspondingly. Similarly, with CV = 10, the IDCNN-CDC manner has attained a superior precision of 98.11% whereas the GBT, XGBoost, and ELM algorithms have obtained a minimal precision of 97.39%, 93.96%, and 92.99% correspondingly.
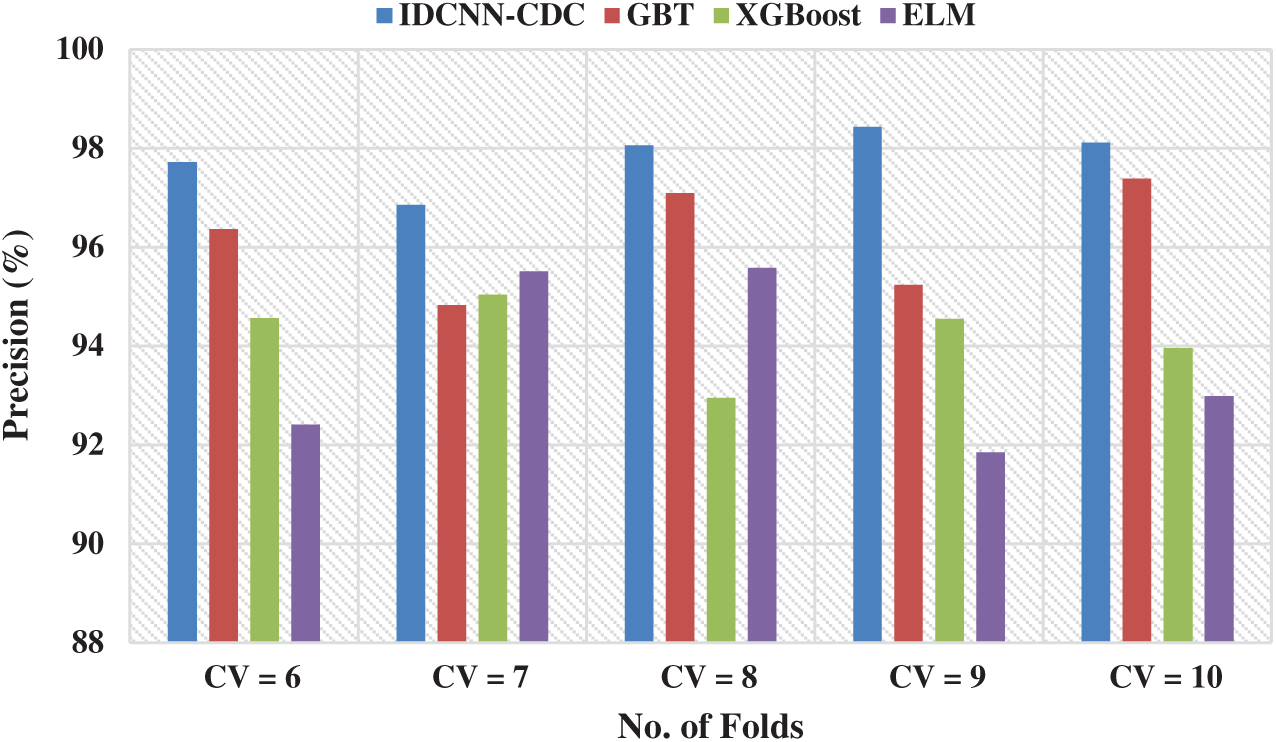
Figure 4: Precision analysis of IDCNN-CDC model in distinct CV
Fig. 5 exhibits the recall analysis of the IDCNN-CDC method in different CVs. The figure showcased that the IDCNN-CDC approach has accomplished maximum performance with superior recall values. For instance, with CV = 6, the IDCNN-CDC method has attained a maximal recall of 98.01% whereas the GBT, XGBoost, and ELM approaches have reached a minimal recall of 98.07%, 94.75%, and 96.13% correspondingly. At the same time, with CV = 8, the IDCNN-CDC methodology has attained a maximal recall of 99.02% whereas the GBT, XGBoost, and ELM techniques have obtained a lower recall of 95.79%, 97.22%, and 97.47% respectively. Finally, with CV = 10, the IDCNN-CDC model has achieved a higher recall of 97.84% whereas the GBT, XGBoost, and ELM approaches have reached a minimum recall of 96.68%, 97.82%, and 95.16% correspondingly.
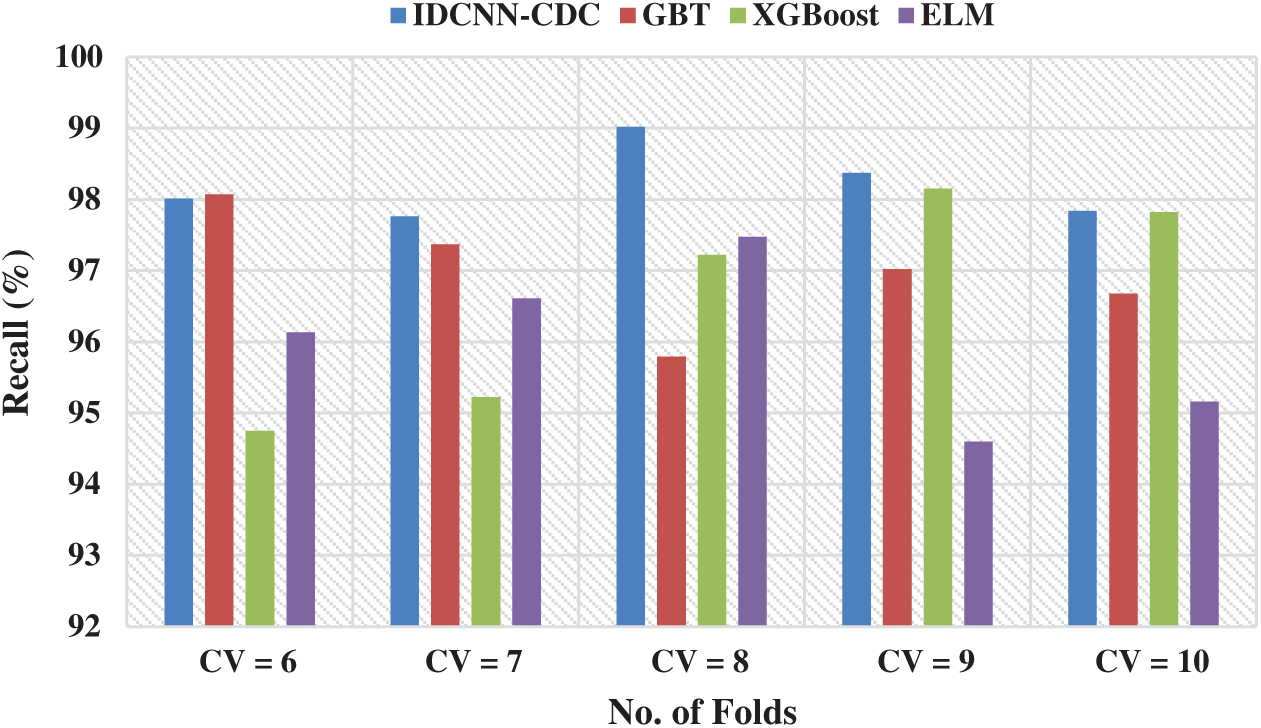
Figure 5: Recall analysis of IDCNN-CDC model in distinct CV
Fig. 6 showcases the accuracy analysis of the IDCNN-CDC technique under distinct CV. The figure demonstrated that the IDCNN-CDC method has accomplished higher performance with the maximum accuracy values. For instance, with CV = 6, the IDCNN-CDC manner has obtained a superior accuracy of 97.77% whereas the GBT, XGBoost, and ELM methodologies have achieved a minimal accuracy of 97.26%, 97.84%, and 91.89% correspondingly. Followed by, with CV = 8, the IDCNN-CDC manner has achieved a maximal accuracy of 98.12% whereas the GBT, XGBoost, and ELM techniques have reached a minimal accuracy of 94.26%, 94.6%, and 92.32% correspondingly. Eventually, with CV = 10, the IDCNN-CDC method has achieved a maximum accuracy of 97.67% whereas the GBT, XGBoost, and ELM algorithms have obtained a lesser accuracy of 95.95%, 92.39%, and 96.39% respectively.
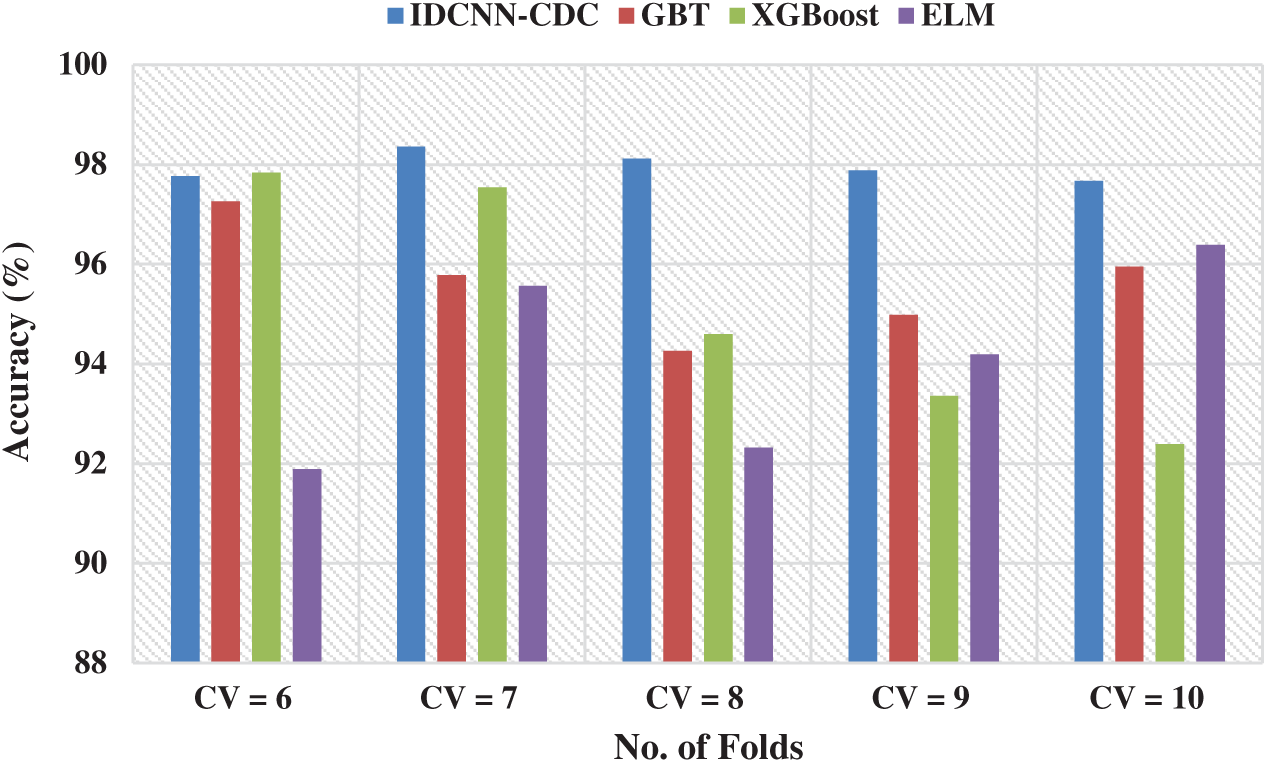
Figure 6: Accuracy analysis of IDCNN-CDC model in distinct CV
Fig. 7 portrays the F-score analysis of the IDCNN-CDC method in different CVs. The figure outperformed that the IDCNN-CDC manner has accomplished higher performance with the maximal F-score values. For instance, with CV = 6, the IDCNN-CDC method has reached a superior F-score of 96.53% whereas the GBT, XGBoost, and ELM models have obtained a lower F-score of 96.79%, 96.6%, and 94.67% correspondingly. On continuing with, with {CV = 8}, the IDCNN-CDC approach has achieved an increased F-score of 98.09% whereas the GBT, XGBoost, and ELM algorithms have reached a lesser F-score of 96.64%, 96.14%, and 95.02% correspondingly. Concurrently, with CV = 10, the IDCNN-CDC manner has achieved a maximal F-score of 97.4% whereas the GBT, XGBoost, and ELM methodologies have obtained a minimal F-score of 97.01%, 93.81%, and 94.10% correspondingly.
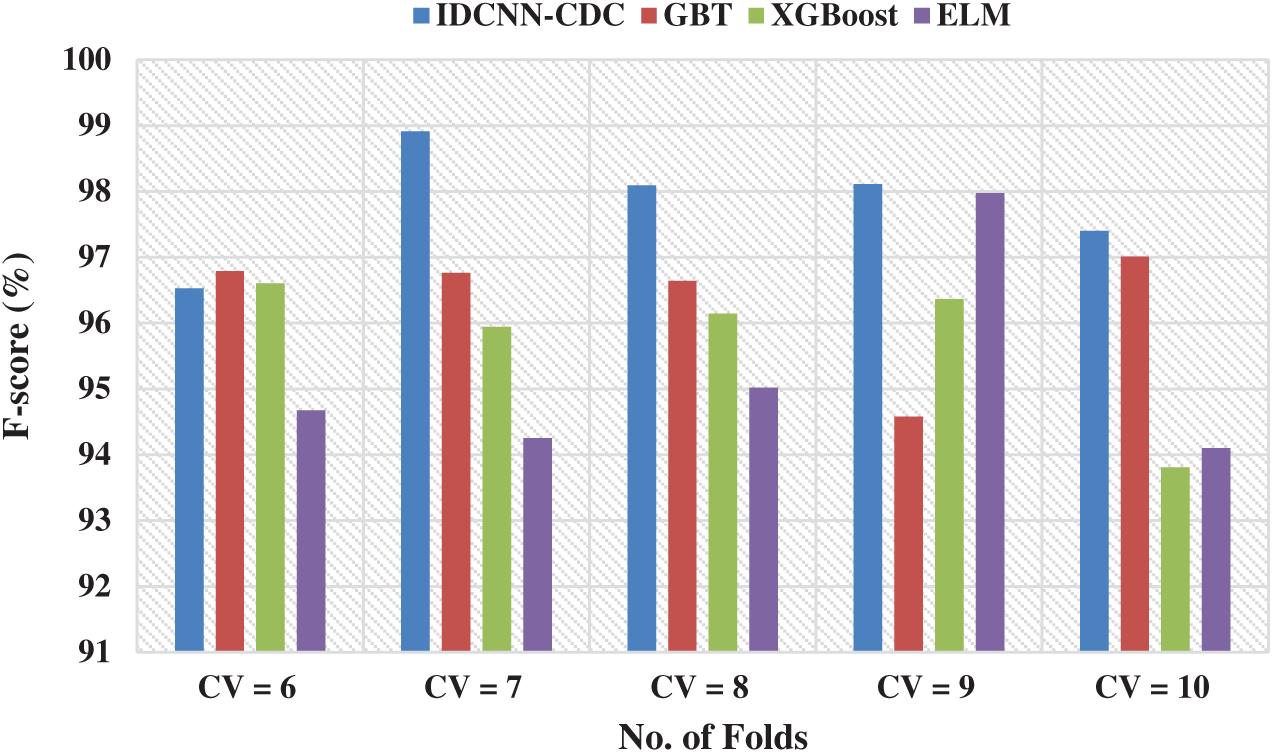
Figure 7: F-score analysis of IDCNN-CDC model in distinct CV
For highlighting the betterment of the IDCNN-CDC method, a brief comparison study is made with different techniques in Tab. 3 and Fig. 8 [22]. From the results, it is evident that the DLP-CC and DT models have demonstrated ineffective outcomes with accuracy values of 77.10% and 78% respectively. Likewise, the LR method has gained slightly improved performance with an accuracy of 82.80%. Followed by, the GBT, XGBoost, and ELM models have accomplished considerable performance with the accuracy of 95.65%, 95.15%, and 94.07% respectively. At last, the proposed IDCNN-CDC model has demonstrated better performance with the maximal precision of 97.94%, recall of 98.20%, accuracy of 97.96%, and F1-score of 97.81%. By looking into the above tables and figures, it can be verified that the IDCNN-CDC methodology is found to be a proper tool for cervical cancer diagnosis and classification.
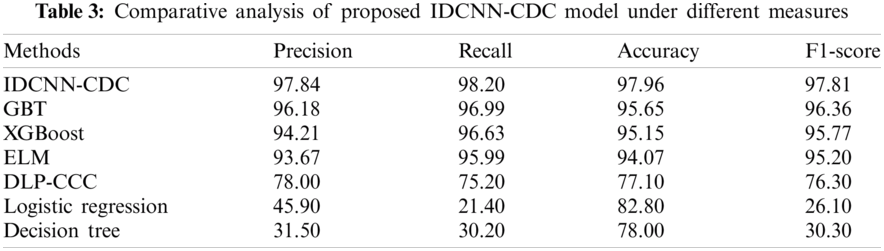
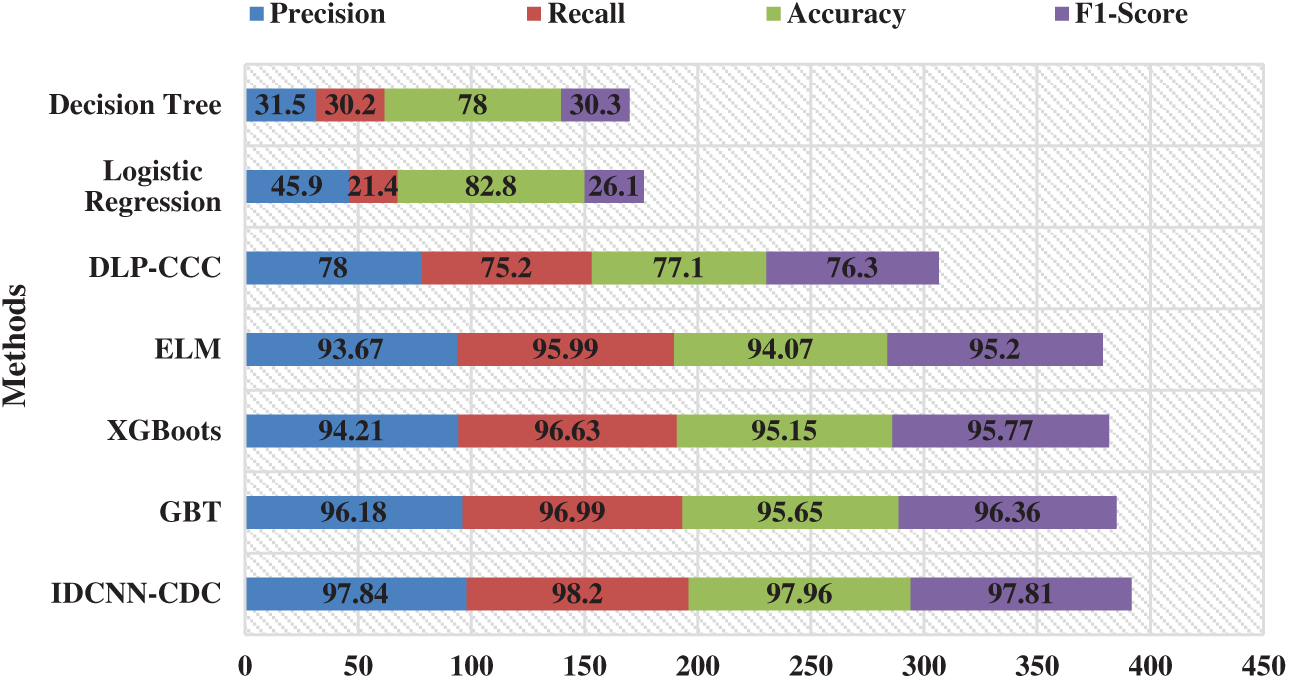
Figure 8: Comparative analysis of IDCNN-CDC model with existing techniques
This paper has developed a new IDCNN-CDC technique to identify the cervix cells from pap smear images. Primarily, GF technique is employed for enhancing the pap smear image quality by the reduction of noise with no blurring of edges. Next to image pre-processing, the TE-DFO based segmentation technique is employed to determine the infected regions in the pap smear image. Afterward, the SqueezeNet model is utilized on the segmented pap smear image to generate feature vectors. At the final stage, the WELM approach is applied to allocate proper class labels to the input pap smear image. For experimental validation, the Herlev database is employed. The experimental outcomes highlighted that the presented model has accomplished improved diagnostic outcomes over the other compared methods. In future, the presented method can be extended to the utilization of DL based instant segmentation techniques to boost the diagnostic outcome.
Acknowledgement: The authors extend their appreciation to the Deanship of Scientific Research at Majmaah University for funding this study under Project number R-2021-164.
Funding Statement: The authors received no specific funding for this study.
Conflicts of Interest: The authors declare that they have no conflicts of interest to report regarding the present study.
1. D. Garcia-Gonzalez, M. Garcia-Silvente and E. Aguirre, “A multiscale algorithm for nuclei extraction in pap smear images,” Expert Systems with Applications, vol. 64, no. 4, pp. 512–522, 2016. [Google Scholar]
2. K. Shankar and E. Perumal, “A novel hand-crafted with deep learning features based fusion model for COVID-19 diagnosis and classification using chest X-ray images,” Complex & Intelligent Systems, vol. 7, pp. 1277–1293, 2020. [Google Scholar]
3. D. Riana, A. N. Hidayanto, D. H. Widyantoro, T. L. R. Mengko and O. Kalsoem, “Segmentation of overlapping cytoplasm and overlapped areas in pap smear images,” in 2017 8th Int. Conf. on Information, Intelligence, Systems & Applications, Larnaca, pp. 1–5, 2017. [Google Scholar]
4. M. Y. Sikkandar, B. A. Alrasheadi, N. B. Prakash, G. R. Hemalakshmi, A. Mohanarathinam et al., “Deep learning based an automated skin lesion segmentation and intelligent classification model,” Journal of Ambient Intelligence and Humanized Computing, vol. 12, no. 3, pp. 3245–3255, 2021. [Google Scholar]
5. G. A. Lakshmi and S. Ravi, “Automated segmentation algorithm for cervical cell images by employing cuckoo search based ICM,” Journal of Ambient Intelligence and Humanized Computing, vol. 113, pp. 539, 2017. [Google Scholar]
6. K. Shankar, Y. Zhang, Y. Liu, L. Wu and C.-H. Chen, “Hyperparameter tuning deep learning for diabetic retinopathy fundus image classification,” IEEE Access, vol. 8, pp. 118164–118173, 2020. [Google Scholar]
7. S. K. Lakshmanaprabu, S. N. Mohanty, K. Shankar, N. Arunkumar and G. Ramirez, “Optimal deep learning model for classification of lung cancer on CT images,” Future Generation Computer Systems, vol. 92, no. 1, pp. 374–382, 2019. [Google Scholar]
8. R. O. Topaloglu, “ICCAD-2016 CAD contest in pattern classification for integrated circuit design space analysis and benchmark suite,” in Proc. of the 35th Int. Conf. on Computer-Aided Design, Austin Texas, pp. 1–4, 2016. [Google Scholar]
9. R. J. S. Raj, S. J. Shobana, I. V. Pustokhina, D. A. Pustokhin, D. Gupta et al., “Optimal feature selection-based medical image classification using deep learning model in internet of medical things,” IEEE Access, vol. 8, pp. 58006–58017, 2020. [Google Scholar]
10. A. Ghoneim, G. Muhammad and M. S. Hossain, “Cervical cancer classification using convolutional neural networks and extreme learning machines,” Future Generation Computer Systems, vol. 102, no. 2019, pp. 643–649, 2020. [Google Scholar]
11. K. Adem, S. Kiliçarslan and O. Cömert, “Classification and diagnosis of cervical cancer with stacked autoencoder and softmax classification,” Expert Systems with Applications, vol. 115, no. 15, pp. 557–564, 2019. [Google Scholar]
12. N. Dong, L. Zhao, C. H. Wu and J. F. Chang, “Inception v3 based cervical cell classification combined with artificially extracted features,” Applied Soft Computing, vol. 93, no. 6, pp. 106311, 2020. [Google Scholar]
13. H. A. Perlin and H. S. Lopes, “Extracting human attributes using a convolutional neural network approach,” Pattern Recognition Letters, vol. 68, no. 3, pp. 250–259, 2015. [Google Scholar]
14. W. William, A. Ware, A. H. Basaza-Ejiri and J. Obungoloch, “Cervical cancer classification from pap-smears using an enhanced fuzzy C-means algorithm,” Informatics in Medicine Unlocked, vol. 14, pp. 23–33, 2019. [Google Scholar]
15. Z. Alyafeai and L. Ghouti, “A fully-automated deep learning pipeline for cervical cancer classification,” Expert Systems with Applications, vol. 141, no. 6, pp. 112951, 2020. [Google Scholar]
16. M. A. Devi, J. I. Sheeba and K. S. Joseph, “Neutrosophic graph cut-based segmentation scheme for efficient cervical cancer detection,” Journal of King Saud University-Computer and Information Sciences, pp. 1–9, 2018. https://doi.org/10.1016/j.jksuci.2018.09.014. [Google Scholar]
17. W. William, A. Ware, A. H. Basaza-Ejiri and J. Obungoloch, “A pap-smear analysis tool (PAT) for detection of cervical cancer from pap-smear images,” BioMedical Engineering OnLine, vol. 18, no. 1, pp. 16, 2019. [Google Scholar]
18. V. Rajinikanth, S. C. Satapathy, S. L. Fernandes and S. Nachiappan, “Entropy based segmentation of tumor from brain MR images–A study with teaching learning based optimization,” Pattern Recognition Letters, vol. 94, no. 1, pp. 87–95, 2017. [Google Scholar]
19. S. Mirjalili, “Dragonfly algorithm: a new meta-heuristic optimization technique for solving single-objective, discrete, and multi-objective problems,” Neural Computing and Applications, vol. 27, no. 4, pp. 1053–1073, 2016. [Google Scholar]
20. Ç.İ. Acı and H. Gülcan, “A modified dragonfly optimization algorithm for single-and multiobjective problems using brownian motion,” Computational Intelligence and Neuroscience, vol. 2019, no. 2, pp. 1–17, 2019. [Google Scholar]
21. V. Pustokhina, D. A. Pustokhin, P. T. Nguyen, M. Elhoseny and K. Shankar, “Multi-objective rain optimization algorithm with WELM model for customer churn prediction in telecommunication sector,” Complex & Intelligent Systems, vol. 38, no. 12, pp. 15273, 2021. [Google Scholar]
22. J. Lu, E. Song, A. Ghoneim and M. Alrashoud, “Machine learning for assisting cervical cancer diagnosis: An ensemble approach,” Future Generation Computer Systems, vol. 106, no. 6, pp. 199–205, 2020. [Google Scholar]
 | This work is licensed under a Creative Commons Attribution 4.0 International License, which permits unrestricted use, distribution, and reproduction in any medium, provided the original work is properly cited. |