DOI:10.32604/cmc.2022.020510
| Computers, Materials & Continua DOI:10.32604/cmc.2022.020510 | |
| Article |
Fault Management Cyber-Physical Systems in Virtual Storage Model
College of Computing and Informatics, Saudi Electronic University, Riyadh, 11673, Kingdom of Saudi Arabia
*Corresponding Author: Kailash Kumar. Email: k.kumar@seu.edu.sa
Received: 26 May 2021; Accepted: 27 June 2021
Abstract: On average, every two years, the amount of data existing globally doubles. Software development will be affected and improved by Cyber-Physical Systems (CPS). The number of problems remained even though developments helped Information Technology experts extract better value from their storage investments. Because of poor interoperability between different vendors and devices, countless numbers of Storage Area Networks were created. Network setup used for data storage includes a complex and rigid arrangement of routers, switch, hosts/servers, storage arrays. We have evaluated the performance of routing protocol Transmission Control Protocol (TCP) and Fibre Channel Protocol (FCP) under different network scenario by Network Simulator (NS)-3 Simulation. We simulated the Node Failure and Network Congestion issue with DoS attacks and a counter effect on the Packet Distribution Ratio and End-to-End Delay efficiency metrics with different nodes and speed of node mobility. The study is performed for the Simple Network Management Protocol (SNMP) on FCP routing. The results proved that the proposed method isolates the malicious and congested nodes and improves the Network’s performance.
Keywords: CPS; data storage; virtualization; TCP; FCP
Virtualization of networking resources offers the service providers an innovative and automated means to provision networks for uninhibited growth and beyond physical boundaries. Simultaneously, the networking industry’s discovery and evolution became feasible by the tremendous potential offered by decoupling data and control planes within the fold of traditional networks. The commencement of vendor locked networks’ end indicates this shift, and it subsequently creates a platform for robust, manipulative and economic software-based tools that can perform related operations. As a result, vendor shipped boxes that carry out networking operations will no more be used in any networking invention and get outdated in every short time, enforcing the service provider for an expensive updation [1]. The world economy went through a quick transformation from production to services during the last 20 years. The service industry contributed 80% to the US economy and the remaining 15% by manufacturing, and 5% by agriculture. Cloud computing is the major contributor to the service industry and takes business computing to a new paradigm shift. By 2013, the global revenue in cloud computing is predicted to touch $150 billion from the $59 billion recorded in 2009. The applications can be accessed and configured at a minimal cost from any place based on the users’ Quality of Service (QoS) parameters. Capital investments in hardware to execute the services of developers or incurring the operating charges of humans is redundant for developers with captivating brains for new internet services. The benefits offered by the cloud removes the low-level burdens of Information Technology (IT) companies in setting up hardware and software infrastructures. Thus, the users will be freed and drift their attention on invention and enhance the business value for their most preferred computing services [2].
Traditional storage management models were unsuccessful in influencing data management effectively, which was expected despite the increasing capabilities of storage systems. So, the overall result was over-provisioning and underutilization of storage resources [3]. The reality has always been different, but the promise made was fast and led to a shared storage model that would simplify storage requirements and data management. Based on the following findings, a modern data management strategy should be established to solve the real problems of data management and the complexities of conventional storage management as (a) The data administrator-the owner of the data, is the best Data management performer, (b) The physical storage administrator must manage the data administrator and (c) It offers software to summarize storage infrastructure information.
With the spread of the Network and the invention of technologies like Storage Area Network (SAN), Network Attached Storage (NAS), Directly Attached Storage (DAS), etc., data got scattered on the Network, and it became impossible to handle such an enormous sprawl of data. Daily emerging servers with Terabytes of storage provide high-capacity storage, but the task is to manage the data floods. Data of a node can be residing on various other nodes on the Network, but the question is how to recognize, access the data as a single unit, and make it feel that it still owns it [4]. Fig. 1 shows three locations where Storage Virtualization resides, namely Host/Server based, Network-based, and storage-based Virtualization. All the above-stated parameters work together for the storage virtualization environment and are interdependent as well. If any of the four stops working, no virtualization is present. If any parameter performance degrades, it will degrade the performance of the overall model [5].
There is a practical case: If storage is taking too long to respond because of any reason or any parameter discussed above, it is a violation of Virtualization. In today’s rapidly growing world network, increasing complexity is unmanageable. It is becoming more and more prone to attacks like DoS and physical faults. So, in this paper, we propose a model for Virtualization in which the network layer will be equipped with a fault tolerance mechanism. Any fault or any problem on the Network will lead to the degradation of the virtualized model’s performance. The cases at a particular situation may be responsible for the degraded performance by the Network:
• Network Link Failure
• Packet Transmission Ratio
• Packet Load
• Packet Delivery Ratio
Storage virtualization describes the performance evaluation of the routing protocol in the model and checks the vulnerability of wired and wireless routing protocol. Fault tolerance is a crucial consideration for the Network’s functionality. The SNMP [6] based fault tolerance system essentially switches the path to the localhost network to monitor the Network Interface Card (NIC) for transferring the packet. Both hosts are told on a network that NIC will receive the packet for a given host. Implement this fault tolerance scenario on protocols associated with Virtualization, i.e., TCP, FCP, etc. We can overcome the drawbacks and improve the performance of the virtualized environment.
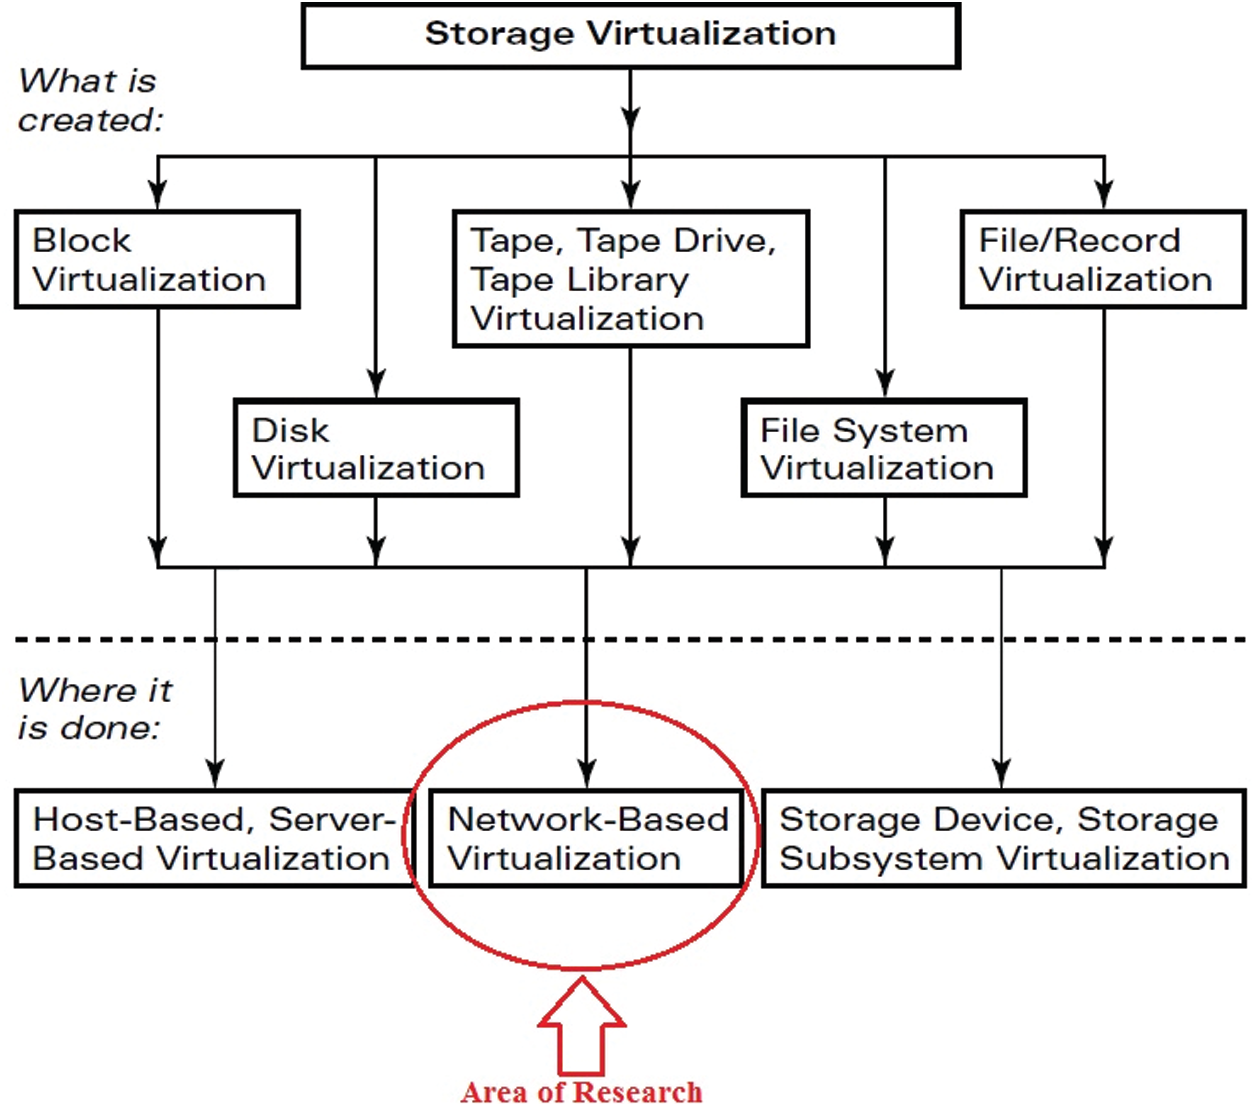
Figure 1: Locations of storage virtualization
The method of equal load distribution regarding a threshold load is beneficial for getting optimal throughput. As a result, a method will be highly considered for this objective, i.e., to accept the Network’s additional load. Storage Area Networks are used along with many algorithms and application, which are already available. As the data is spread out on many systems on the Network, optimization will be implemented on the network Layer and on the way, data is stored Network itself. A Fibre Channel (FC) transfer between the host and the storage virtually redirects all requests to the recipient. This approach does not depend on the operating system; indeed, it is unknown to the host operating system. This is true Virtualization through interoperability exists between our switch and storage array [7]. We evaluated the performance of routing protocol TCP and FCP under different network scenario by NS-3 simulation. There are various factors of data losses and performance degradation in the Fiber Channel network. Here, we have simulated the Node Failure, Network Congestion and Packet Loss issue and how many packets are missing inside the network. This paper simulated SNMP on FCP routing and proposed its Logical Unit Number (LUN) and node assignment method in case of failure or overloaded node and determining network performance under different network scenarios.
Overview of storage virtualization, fault tolerance deployment model and different services are presented in Section 1. Section 2 contains a background study of exited work done by a different researcher. Section 3 contains the preliminary study of current work—Section 4 compares the performance analysis of TCP and FCP routing protocol for various constraints. Section 5 discusses the implementation of SNMP with FCP only, LUN and node assignment method in case of failure or overloaded node and determining network performance under different network scenario, including simulation details and results. Section 6 outlines the conclusion remark and future direction.
As a decentralized distributed environment, Virtual Storage Network (VSN) provides a framework in which IT firms and government agencies worldwide use the storage Network. In a rapid deployment of software for many reasons, including managing `sensitive software is essential to the critical operating data. A stable VSN must be built to support this mission-critical software and data [8]. A series of preliminary ideas presented are the basis for defining the event-oriented architecture proposed in this work. This work makes a particular focus on firewalls and routers [9]. Similarly, a fault tolerance solution for Voice over Internet Protocol (VoIP) is implemented using event-oriented middleware retrieving and saving states when a failure occurs [10].
The Author’s [11] proposed network is linked by several factors: phase behaviour in local or transient explosions reveals differences in traffic inoculation behaviour, locality of reference data, missed application behaviour, and competency of the application phase. Scheduling problem—if several core programmes are operating concurrently on-chip until planned. Hence, there arose a multi-dimensional optimization issue, which exploits scheduled stability, decreases efficiency and resources. The Author suggested a multi-core network chip extract facility from the Multi-Core Chip Framework. The Chip network addresses the problem of linking several nuclei with a single-chip device.
The Author [12] proposed an on-chip network, a modern concept that is more advanced than in-circuit architecture. This paper includes features and procedures for Network-on-Chip (NoC) and its systems’ tolerance for faults. The fault model and topology in this research were taken into account and clarified. During the transmission process, particular problems occurred with faults, and some of the faults stayed a lifetime, and such faults can be diagnosed using fault-tolerance models. The invented algorithm [13] of the C4.5 decision constructs a series of rules for classifying test cases into multiple separations so that missed test cases most likely fell short due to the same fault in the same partition. Depending on the inputs and outputs of the test case, distinct conditions for failures in test cases can be identified directly in the tree of judgment that reflects a rule modelling of distinct failure conditions. It is likely triggered by multiple failures, which lead to a specific probability of failure. To distinguish the reports using a heuristic similar to Tarantula, each partition is placed based on the declaration scope of both the failed and positive test cases. Such individual rankings are then compiled for a single ranking to be analyzed to evaluate the shortcomings.
Author [14] proposed a fault position approach based on the Back-Propagation (BP) network, one of the most commonly implemented variations in the neural network. A neural BP network has a basic structure, making computer programmes easy to execute. They are used to create a BP neural network to teach the network how to connect. Simultaneously, BP neural networks approximate complex non-linear functions. Analytical details are provided for each test case, along with the relevant success or failure. The coverage of many simulated events, each covering only one record within the programme, are then entered into the qualified BP network, and the output can be called the probability of each bug statement.
There are many probabilistic techniques applied to various debugging problems. In this work, they explained the Traceable Fault Location Model (TFLM) [15], which can be learned from the data, and probabilistically infer the location of the error. TFLM is trained against a corpus of error programs that will learn to recognize recurring error patterns. There will be a distribution of links with rich dependency structures, which are often computationally challenging to handle. They evaluated the fault location performance of TFLM, which used the Tarantula score as a feature in the probability model. Their research explains that learning TFLM isolates errors more effectively than previous statistical methods or directly uses Tarantula.
Author [16] proposed an infrastructure based on the interception of routine calls, and the fundamental idea is to introduce transparent middleware rent applications so that no modifications to the operating system or recompilation of the application are required. The proposed infrastructure is scalable and offers fault tolerance, proactive dependency, an adaptation of resources based on failures, and rapid fault detection and recovery. In this work, there was difficulty in providing a complete solution for fault-tolerant RT-CORBA real-time applications.
This section presented the pre-elementary work, which is necessary to understand the presented work. Storage Virtualization was the technology of present need when data produced every day is growing exponentially. This technology gives a virtual yet effective way to store, manage, and extensive access data. Storage virtualization can be implemented in four areas, and for this research work, we have opted for the network layer, which comprises of Fiber Channel, a very high-speed network component fulfilling the high-speed data transfers. The Network is subject to scale with the number of nodes added, and risk also increases that some of the nodes in the path may be malicious or crashed, violating the promises made by Storage Virtualization [17].
The network layer in Virtualization is the backbone process that combines both software and hardware network resources and the network functionality itself into a single entity called virtual networks, a software-based administrative model based on a fiber channel that works on FCP. The network layer for Virtualization includes network hardware such as switches and network adaptors, generally known as NIC, some network elements such as firewall or load balancers, Networks itself such as virtual Local Area Network (LANs) and containers like virtual machines, some storage devices on the Network and any network medium such as Ethernet or Fiber Channel (FC). There are other constraints for Virtualization to happen. In a virtualized environment, the host and the client are unaware of the Network they are using, the topology, the protocol, and other issues like storage devices. Here, the transport layer must transmit the data from host to client, and so, a protocol supporting the transport layer is also required. TCP is the most reliable protocol as it is a connection-oriented protocol, so it is usable in our paradigm [18].
3.2 Virtualization Architecture
There are three implementation approaches where Virtualization can be implemented. Choosing any one of the architectures out of available ones entirely depends on the need of the storage administrator and the storage resources themselves. However, the approach and implementation in this paper are based on network-based storage virtualization [19].
3.2.1 Host-based Virtualization
Host-based virtualization is a host-based programme; for example, Sun ZFS 7000 should be the host or process’ fundamental or primary mission. Some operating systems have built-in volume control and are sold as a standalone feature in some others. LUN are supplied to the host machine with the normal physical device driver. Over the Disk Creation Driver sits an application layer that manages the I/O requests, mapping and provides metadata analysis.
3.2.2 Storage Device-Based Virtualization
A combination of multiple disks forms a virtualization layer called Redundant Array of Independent Disks (RAID). Indeed, they are just a collection of simple data storage devices and do not provide any virtualization on their own. Instead, they are presented as a single unit. The most straightforward disk arrays offer physical abstraction logic. RAID schemes bind several storage disks in one array and split the array into smaller volumes or fragments. In general, these tools do not offer advantages such as data transfer, refractive or heterogeneous storage replication since every vendor has its proprietary protocols.
3.2.3 Network-Based Virtualization
SANs are connected to a network-based system via Internet Small Computer Systems Interface (iSCSI) or FC networks to implement network-based storage virtualization. The most widely used network-based systems are available on the market.
Fig. 2 shows that the hosts run Input and Output (I/O), and the storage controllers provide a layer of abstraction, utilizing these network virtualization tools located in the SAN. The critical functions provided by network-based storage virtualization are: (a) Combine several LUNs to form one or more arrays into a single LUN before presenting it to a host, (b) Slicing a single LUN of an array and presenting it to the hosts as smaller virtual LUNs, and (c) Perform replication within the SAN and over Wireless Area Network (WAN) links [20].
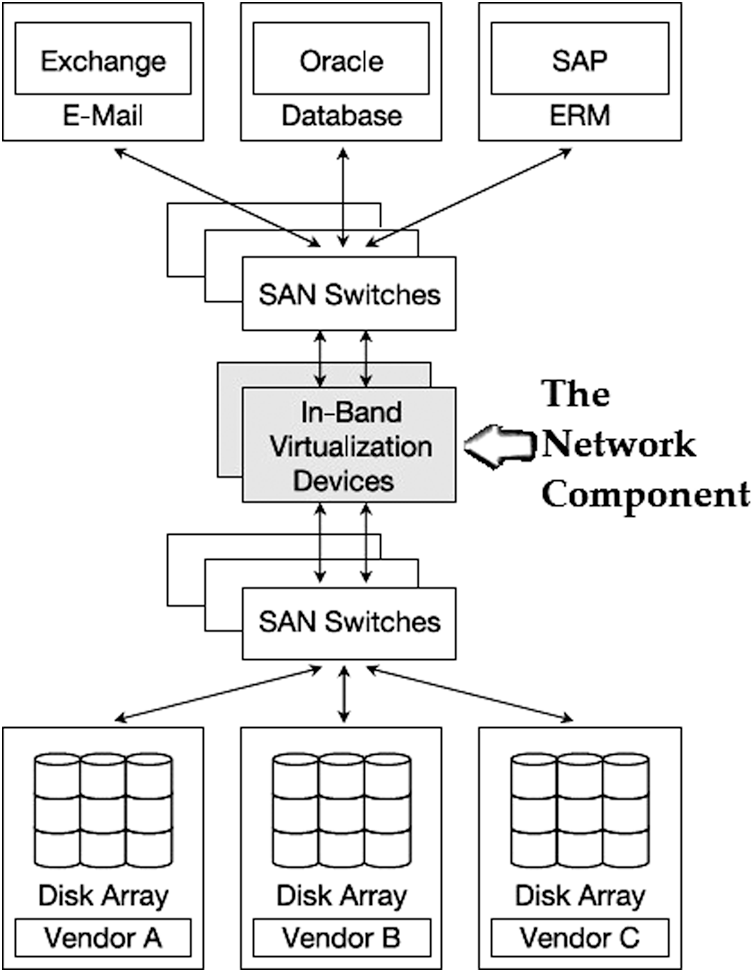
Figure 2: Network-based storage virtualization
3.3 Constraints of Virtualization
Four parameters are responsible for storage virtualization, and each has its place in the hierarchy and its work. Although the approach used here focuses only on the network first level, let’s have a glimpse of all components together and their contribution to virtualization shown in Fig. 3.
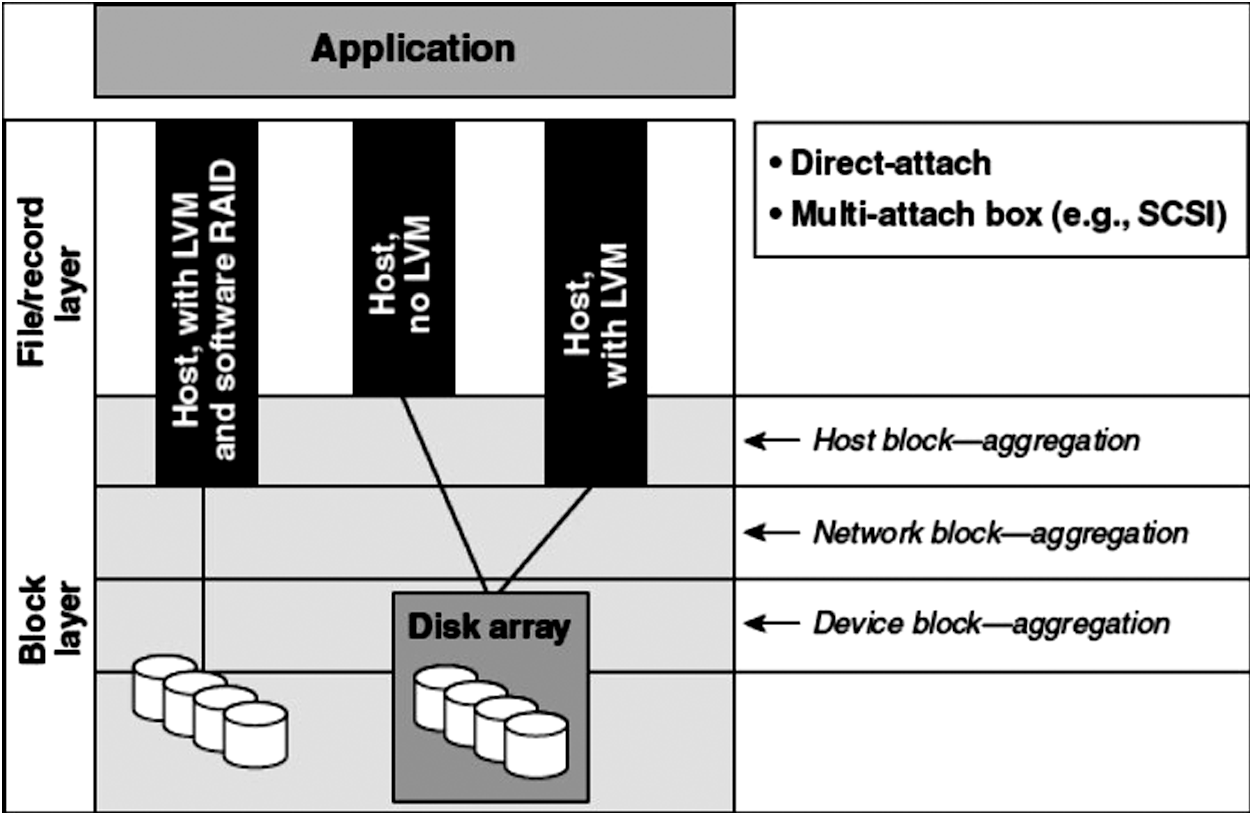
Figure 3: Components of virtualization
In a virtualized environment, the two issues are congestion and node/route failure. Congestion is the overloaded receiver and is a type of Denial of Service (DoS) attack. In an FC, two nodes communicate with each other via their FC port. There are certain conditions when the client FC port is busy or crashed, and hence there will be a delay in the network setup as the sender will wait for the client’s FC port to become free. The proposal is to avoid network setup requests of FCP, i.e., F_CTL Frames, to broadcast to the Network to avoid crashed nodes. This can be done by using a network management strategy provided by the Simple Network Management Protocol, given that all nodes on the Network under consideration are SNMP enabled. The theory is that SNMP collects all of the information of the nodes within the network using its GET command and sets up a list of nodes on the network. If any crashed node is found in the path, GET_NEXT will find the next nearest node creating a path to the previous destination.
4.1 Method Used for Connection Establishment
A control protocol originated from Transmission Control Protocol/Internet Protocol networks is an SNMP. SNMP is described by a series of Comment Requests, where information exchanged between systems is specified and structured. Agent SNMPs live on management systems. The agent receives requests for information to be retrieved or changed by referring to Management Information Base (MIB) objects. The MIB objects are information units that provide the management system with information about the system and the Network. A subagent allows other MIB objects to be added dynamically without changing the agent. Simultaneously, these dynamic additions do not affect SNMP managers because they continue to work directly with the SNMP agent. A requested protocol is the type of protocol that SNMP uses to transfer data between the SNMP manager and user. The manager demands details of the MIB object, and the agent uses TRAPS to satisfy this order.
Fig. 4 demonstrates an FC network that is SNMP enabled, which means all nodes on the Network have a mechanism to generate and receive SNMP commands and respond accordingly. All nodes communicate via FC port. FCP works on the mechanism of TCP, and so does all methods of TCP are used for connection establishment. The node discovery process in FCP is connection-oriented and communicates on a one-to-one mechanism. In the above diagram, SNMP is used for network discovery. Let us consider that Node_A want to communicate with Node_E, so the path traverses from node CXE. There is no other possible path, and Node_A generates a GET command to gather the route information. In reply, each participating node generates a TRAP command except those which are malicious. So here, Node_X doesn’t generate a TRAP reply, and that is well recognized by Node_A and updated in its MIB base to avoid this corrupted node for the subsequent connection establishment. It will generate the GET_NEXT command at Node_X to get the address of the next nearest node, i.e., Node_E.
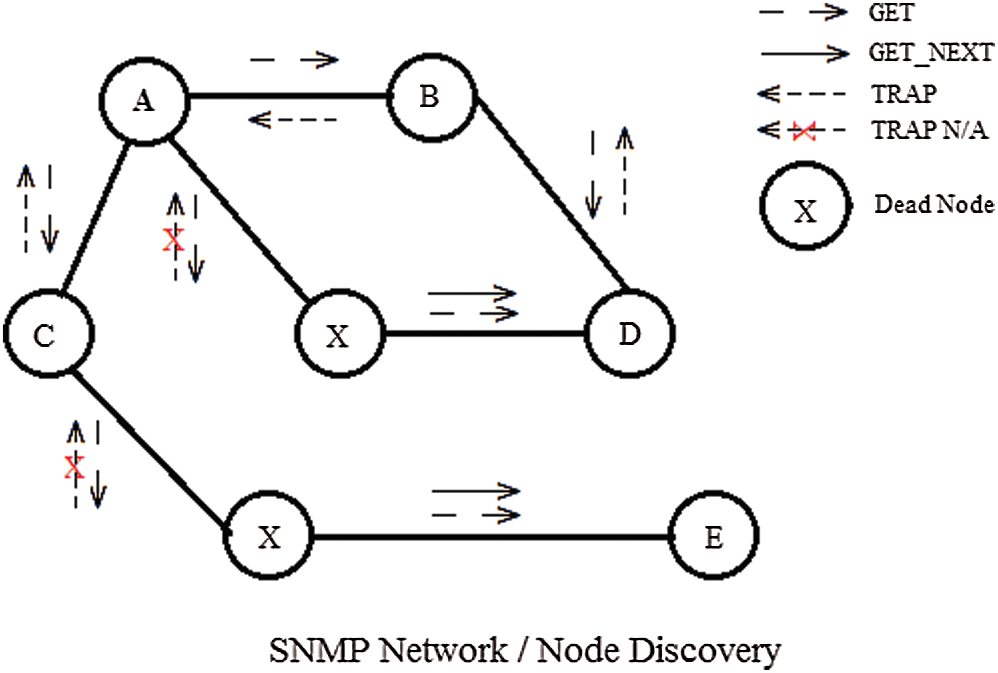
Figure 4: Network discovery against malicious nodes
4.2 Detection of Malicious Nodes
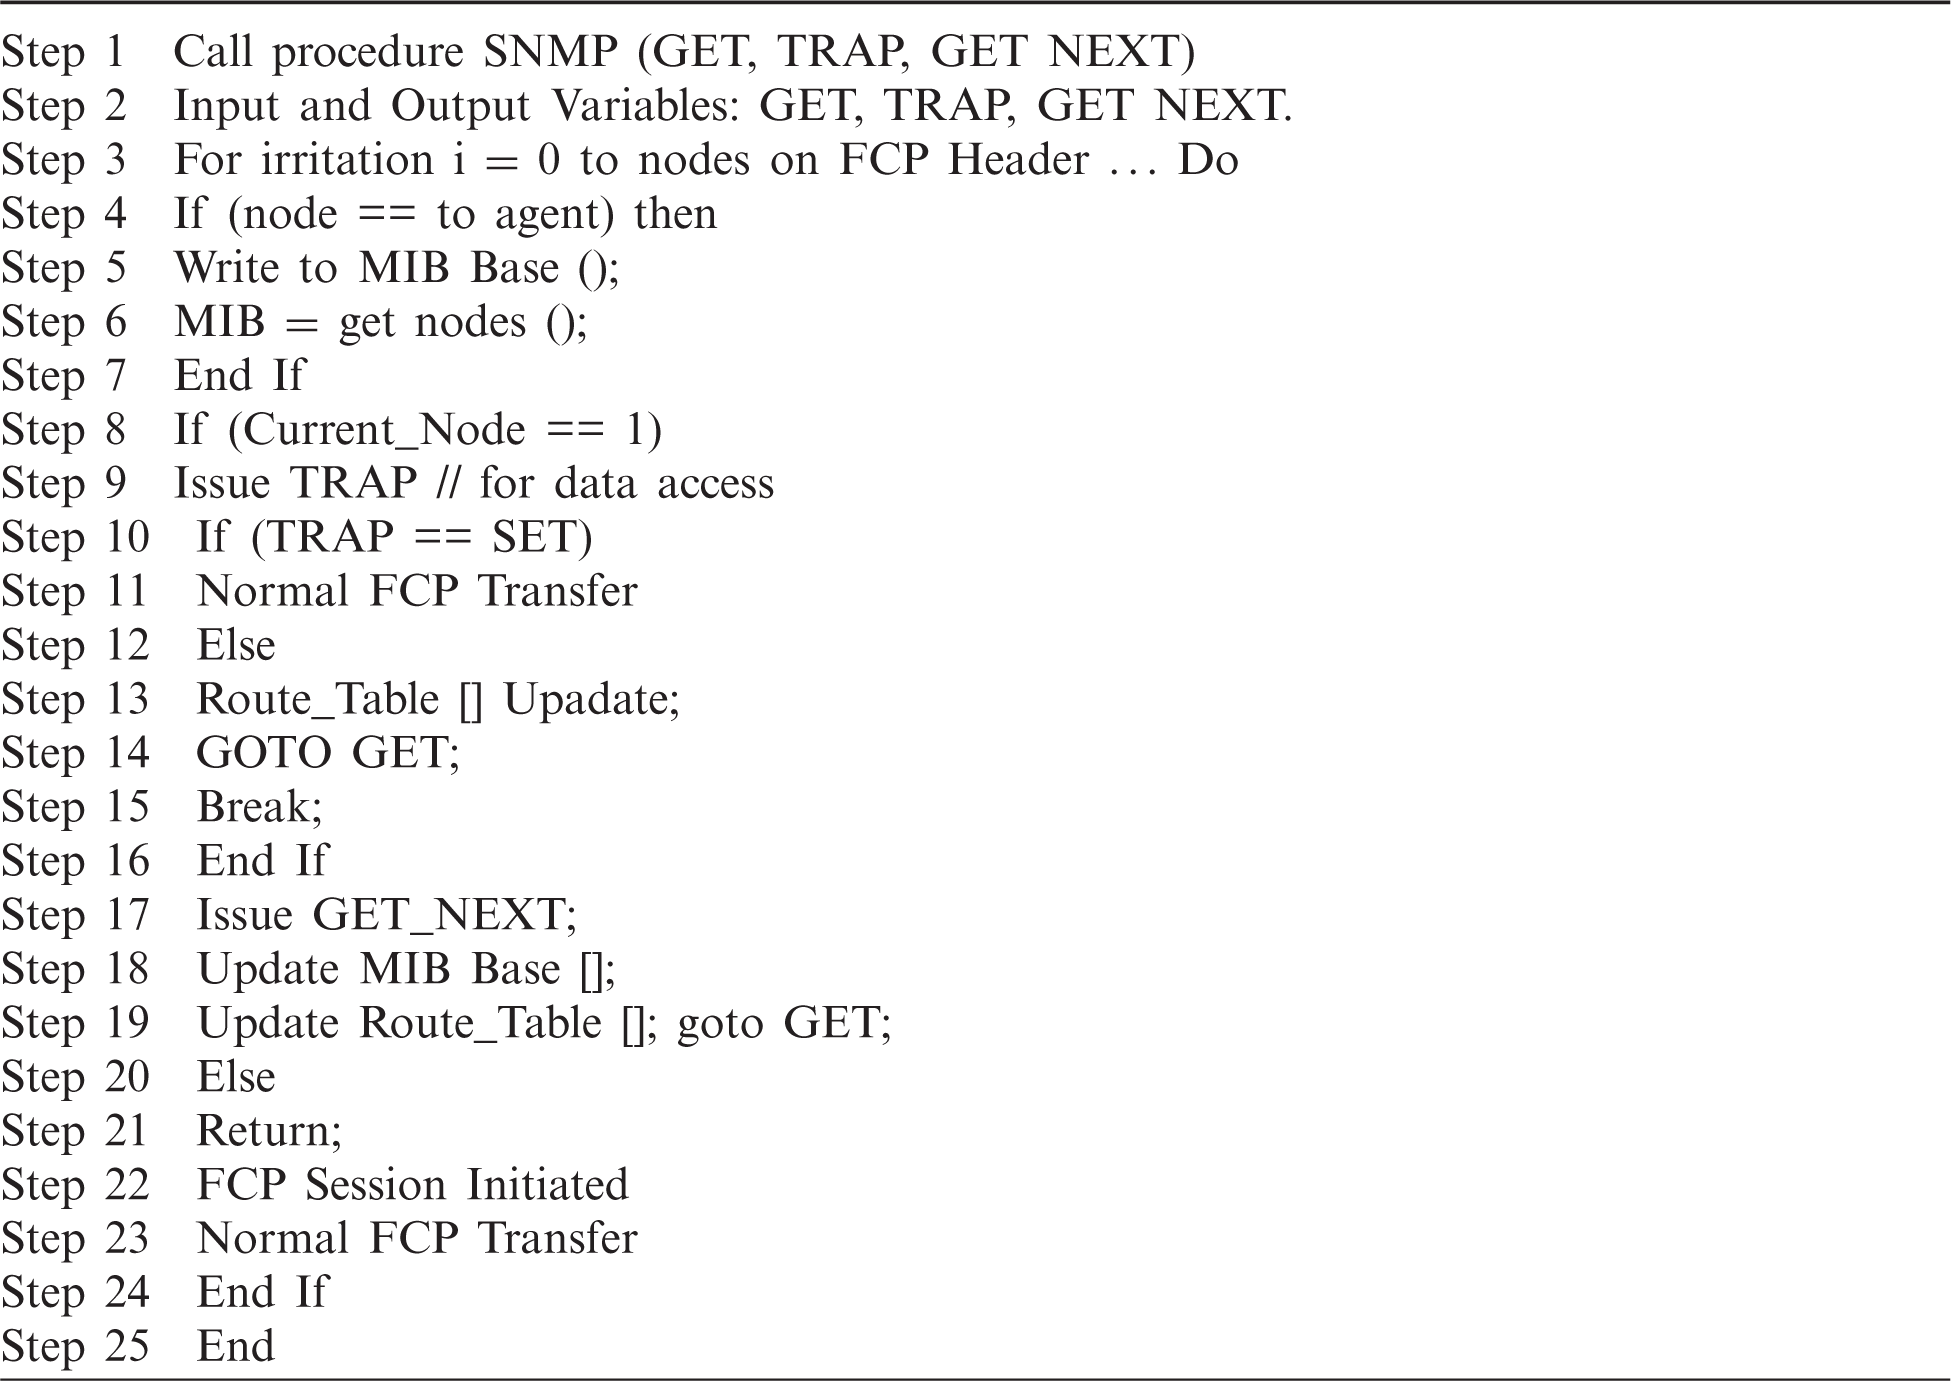
An SNMP admin demands configuration information on a particular device. This request is compiled into a GET protocol data unit by the manager and transmitted to the agent through a communication service. The agent then pulls the requested MIB object information into a RESPONSE PDU after receiving the manager’s request and returning it to the manager. The detection module first issues an SNMP command to check whether all nodes are SNMP enabled or not. If YES, then we will enter the SNMP module with a source and destination, leaving path constraints to the SNMP itself and if NO, then normal FCP will work for the rest of the session.
SNMP module proposed here is only partial, and the capabilities of updating route tables alone are used. If all nodes are compatible, then, GET command is issued, which will create a routing table for that particular session. MIBs containing route details are stored in an array with a list of all nodes, their addresses, their status, 1 for available, and 0 for malicious nodes. Each time the GET and GET_NEXT command is issued; the routing table is updated with new MIB objects. If CURRENT_NODE is alive, i.e., equal to 1, then an FCP session will be initiated and led to normal FCP transfer; otherwise, the next nearest node is called GET_NEXT be new CURRENT_NODE. GET_NEXT will retrieve the following address from MIB Base, which is dynamically updated. There is verification; if TRAP doesn’t respond means the route has a malicious node, then the route will be tested and updated; and will be forwarded to issue a new GET command. This verification is done by TRAP; if TRAP responds in PDU, then again, standard FCP transfer will start.
5.1 Performance Analysis of TCP/FCP in a Virtualized Environment
The Basic principle for data access in a storage virtualization environment is based on TCP. Storage virtualization technology uses FC as its backbone and FCP as its working protocol over a fiber channel, and data are transmitted in the form of packets from one source to another destination. Still, these packets are split into a stream of bytes when they are to be transmitted over the Network. FCP works on the mechanism of TCP, or we can say FCP is TCP, supporting much higher data rates.
5.1.1 Simulation of Peer-to-Peer-Setup
Here, we set up a simple simulation of how the data packets between two nodes are transmitted and determine the Network’s performance. A network is created with the following simulation parameter in the NS3 platform, as shown in Tab. 1.

The above implementation is run on the simulator for 15 s. Analysis of the ratio and performance of TCP in an ideal environment is done. As shown in Fig. 4, ideally, TCP gives 100% packet delivery, which will be not feasible in coming implementations. EED is ignored in Fig. 5.
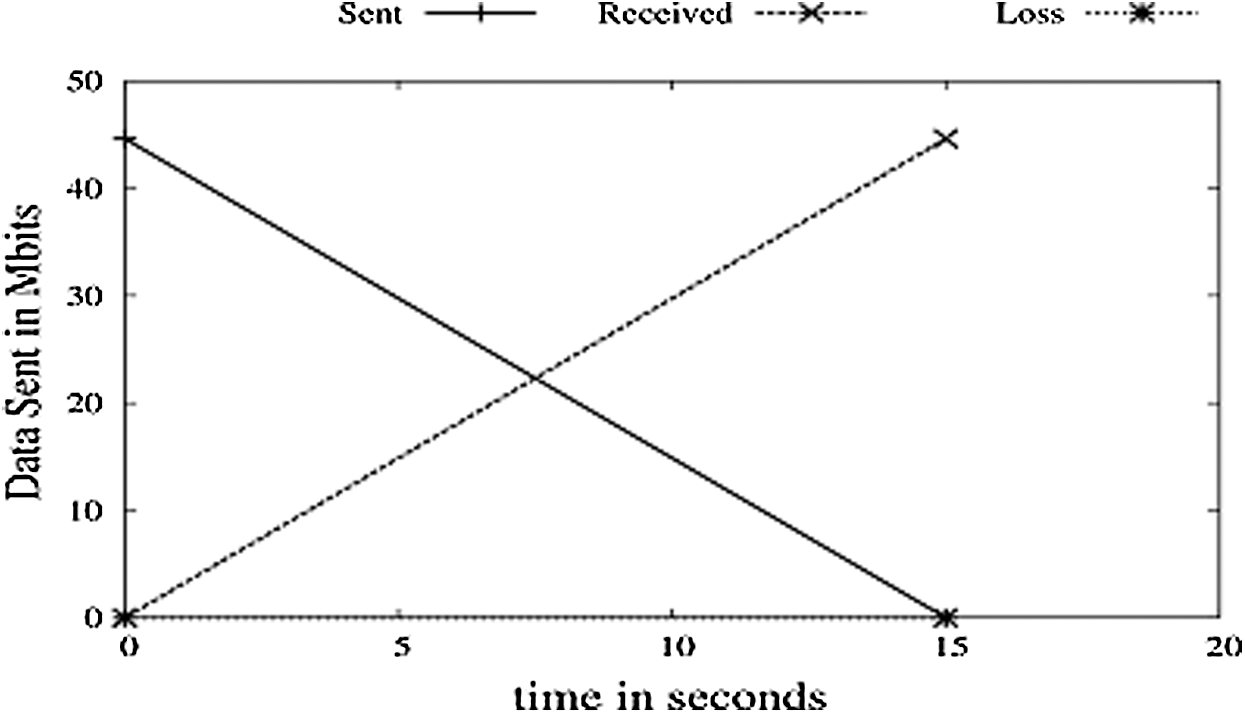
Figure 5: Sent vs. received vs. loss
5.1.2 Node Failure at a Particular Time
In a network, nodes are prone to crash anytime and hence can interrupt the data transmission. If any intermediate node crashes, then TCP will find an alternate path but, in this setup where only two nodes are available, data transmission will be interrupted. It can be noticed that data rates are maintained ideal in all three cases. Here, the receiver crashes at a given time interval, and the sender doesn’t get Acknowledgement (ACK) and retransmit in proper time; the final session gets closed. The result made the receiver crash at 3, 5, and 8 s, keeping the rest of the parameters the same as that of simulation 1 and found that the Packet Delivery Ratio (PDR) is still 1. And because the number of packets sent by the sender is received, and then no packets are transmitted as the session expires, shown in Fig. 6.
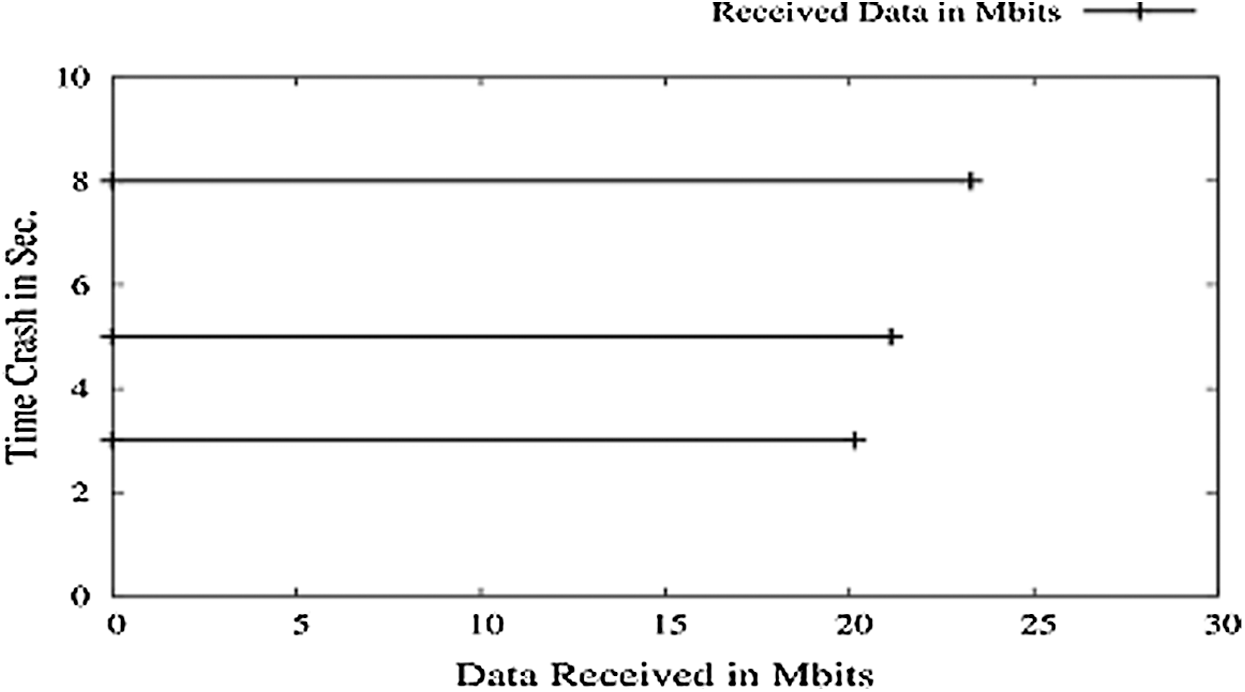
Figure 6: Nodes crashing vs. PDR
5.1.3 Network Congestion by Artificial Load Generator
In this scenario, a TCP grid is set up, and a synthetic load generator is used. Packet size is reduced by 50% on each session established. A synthetic load generator is used, which will produce an unknown number of fake packets and will increase the load on the Network, and a condition will come when original packets are lost. A random load is generated along with 15 nodes present on the Network, as shown in Fig. 7, and a gradual packet loss is seen. As the simulation keep running, the amount of load generated increases. PDR is decreasing because of two reasons: first, the amount of data sent decreases by 50 bps, and second, artificial load keeps increasing, and both end up being 0.
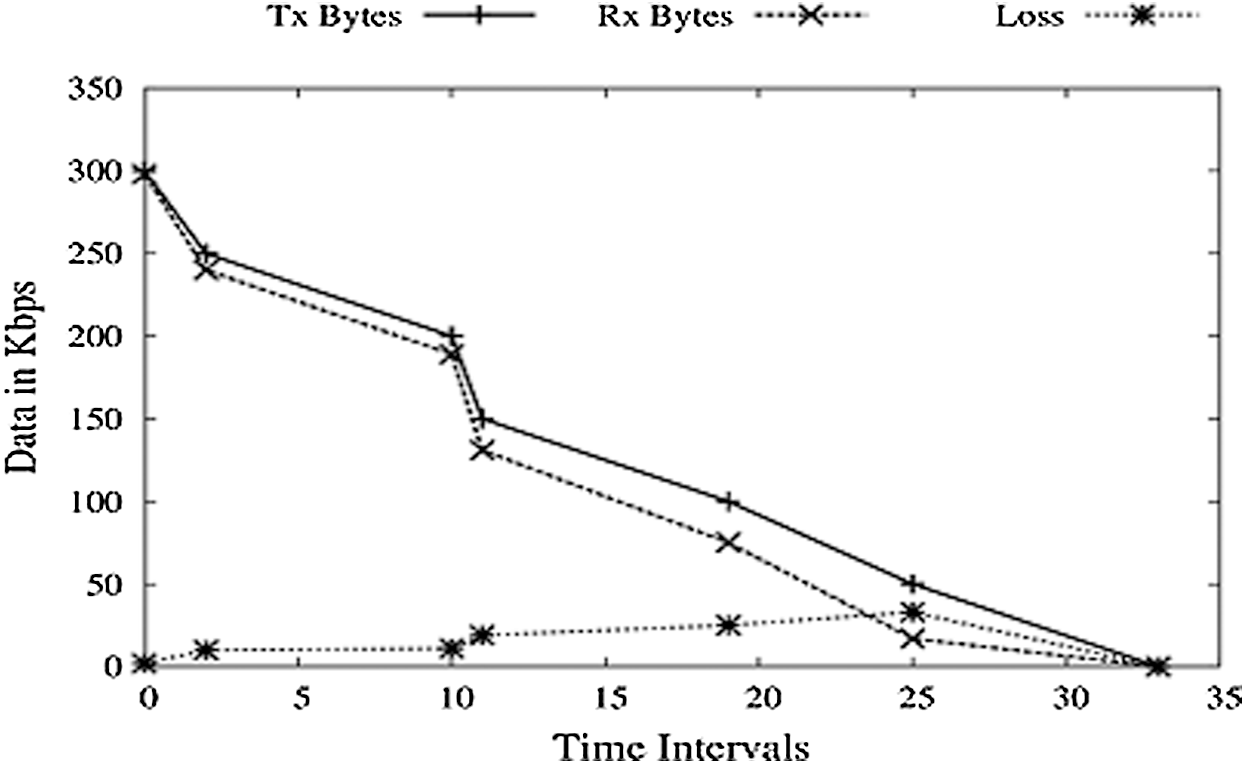
Figure 7: PDR vs. time intervals
DoS attacks are when a receiver cannot get the data packet sent by the sender or unable to generate ACK for the received packet. In this work, 15 nodes are included in the network, and the simulation is executed for 15 s while maintaining the previous simulation’s metrics. The receiver node is made to crash at certain time intervals, causing it to receive data and produce data loss at that particular time. It should be noticed here that the TCP receiver crash will not generate ACK, but the sender is provided with a false ACK. TCP Receiver crashes at time intervals, as shown in Fig. 8. A TCP connection is permanently closed at these intervals, but an untrusted node acknowledges these data packet to be received and continues to maintain the TCP connection with the help of ACK. These packets were lost at the receiver’s end, and new packets are received, which are acknowledged. Data packets sent at each time slot are Constant Bit Rate (CBR). Only one less packet is sent at the last time interval and the total packets sent are 999. At time intervals 2, 3, 7, and 8 each, one packet is lost. At time 4 s, 3 and 2 packets are lost, making 9 packets lost in the whole simulation. It can be noticed that PDR is relatively low as compared to that of the previous simulation because of the ignorable load at the receiver.

Figure 8: Loss vs. PDR vs. Data Rates
e. Summary of TCP Simulations
Tab. 2 summarizes the PDR of each simulation scenario we have performed until now for TCP.

5.2 Performance Evaluation FCP
FC networks have very high speed where two nodes communicate via their FC port. As data transmission rates are very high, the amount of data sent every Sec. is also high. Considering the case with TCP in the previous section, if FCP stops for just a second, the amount of data loss will be much higher than TCP. So, in this section, we have simulated various scenarios for FCP and created a network with the following Simulation parameter (Tab. 3) for performance evaluation of FCP based on PDR and EED. This is because high data rates provide high-speed data transmission, but the risk of network/node failure also increases the data loss.
5.2.1 Fixed Memory Sized Receivers
We created a scenario in which 15 nodes involved in the Network, with each node having a maximum of 10 packets. FCP assigns a new node dynamically if the current node is unavailable because of any reason. We transmitted 100 packets with a constant bit rate, and the results are shown in the graph below. Simulation parameters are stated in Tab. 3.

As the parameters describe, each node participating in the Network has a fixed size memory, thus can receive only a fixed number of data packets (Fig. 9). When a node is full of memory, the FCP session will be closed with that receiver node, and the sender will look up for next node with available memory and maintain a new session with a new node. A delay will be seen hereafter 10 packets, new nodes are searched for, and a session is to be initiated. It can be noticed that the data rate is continuously maintained the same for all nodes.
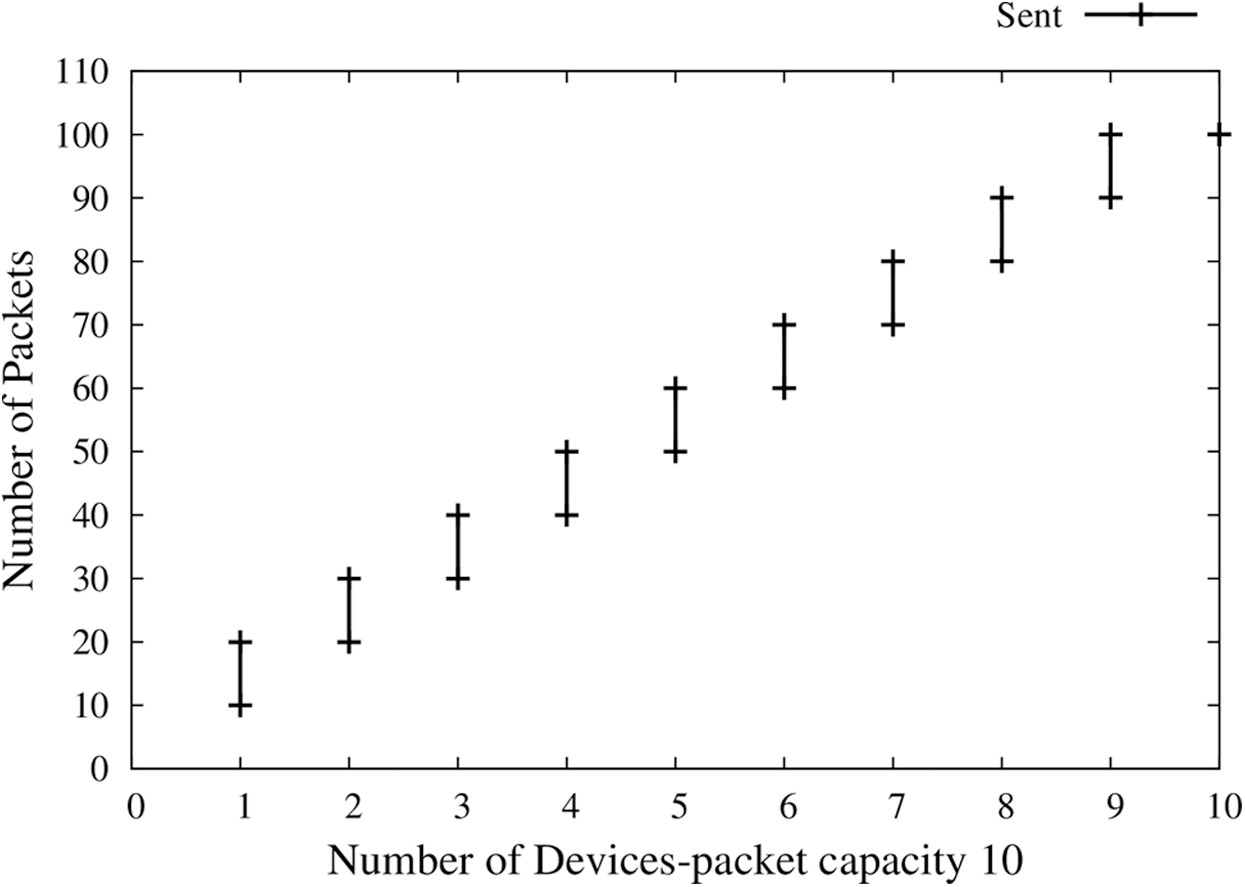
Figure 9: Fixed memory of receiver
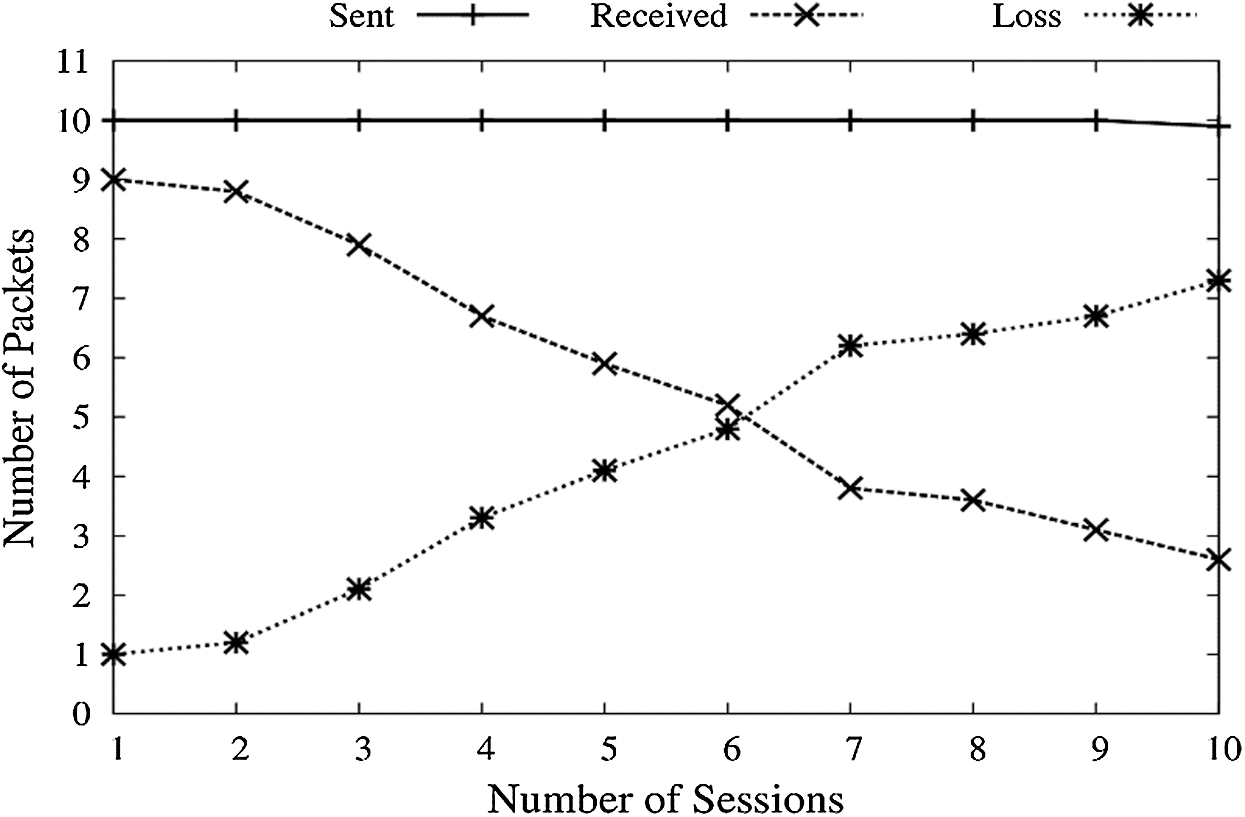
Figure 10: PDR vs. congested network
High data rates of FCP are appropriate for large data transmissions. We set up a scenario where the FC Port of receiving node is already overloaded, and the sender transmits packets at a constant bit rate. There will be a bunch of packets grouped at the receiver’s end, making it congested. This may also be because of a low speed receiving buffer. Congestion will keep increasing for each session maintained. Loss is also taken as a parameter here, depicting several data packets lost in each session. As shown in Fig. 10, when the number of data packets sent increases, the low speed receiving end will collect many packets. The amount of sent data packets is kept constant as shown by graph line–Sent. With an increasing number of sessions, a line indicating the received packet falls because of increasing congestion.
5.2.3 Artificial Load on the Network
In this simulation Fig.11 scenario, a function LOADGEN is created, generating random fake packets on the Network, increasing with each session. Added with the packets sent by the sender, these fake packets will increase the total number of packets at the receiver. With each session, the artificial load keeps on increasing, and so the sent packets. Received packets decrease due to congestion offered by this hiked data rates.
5.2.4 Summary of Results for FCP Based Simulations
Based on the above simulations, all FCP results can be summarized in Tab. 4 based on PDR. The investigations of TCP and FCP by different stimulation parameters and measuring the performance metrics under different network setup. From this comparison, we observed that both protocols have their advantage and disadvantage. TCP is a connection-oriented byte stream providing reliable data transmissions with high PDR but with a limited transmission speed preferred for small data transmissions. On the other hand, FCP is best suited for extensive data as it offers a relatively high speed of up to 100 Gbps, but data loss in case of any fault on the Network is very high than that of TCP. In a virtualized storage environment that works on FC and uses FCP, data losses are unacceptable. In Virtualization, data integrity is significantly similar to data rates.
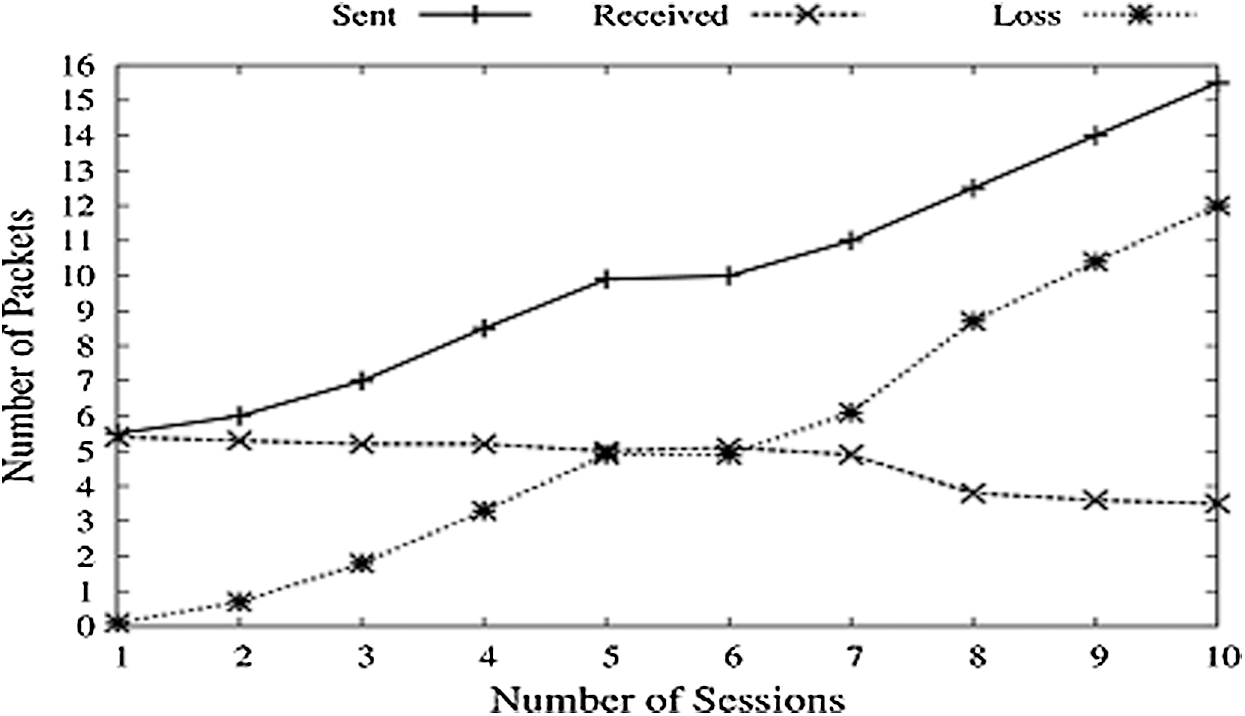
Figure 11: Packet’s vs. sessions (Load Gen)

5.3 Performance Analysis with Deploying Proposed Model
a. Implementing Fault Tolerance on FCP
The analysis from various models of different scenarios for FCP is summarized and explored in depth. We have simulated the DoS attack and determined the impact on PDR and EED by varying the number of nodes, malicious nodes, and nodes’ mobility speed. The attacks were performance metrics. We also simulated the attacks. Tab. 5 shows the simulation parameters used to create the scenarios.
In Fig. 12, it can be observed that when data transmission rates increase, there is a relative fall in the PDR of the Network. This is because the number of packets sent every second rises with the increasing speed, and if a node crashes just for a second, a high amount of data will be lost. When mobility speed ranges from 10–20 Mbps, there is a low loss factor. After this range, loss rises, and hence PDR graph falls rapidly.
The number of malicious nodes in the Network is created randomly between one to five. The distribution ratio of packets decreases as we add malicious nodes in the Network, as shown in Fig. 13. This is a straightforward action plan since the number of nodes in the network raises the risk of an active path being part of the malicious node.


Figure 12: Mobility speed vs. PDR
Fig. 14 depicts the impact of the number of nodes on the FC. Keeping the transmission rate the same, the number of nodes has increased regularly, and the PDR graph is falling. The reason for this fall down is the addition of new nodes, which contains malicious nodes also. As new nodes are stopped adding, the PDR graph observes an increase and will maintain average PDR with time.
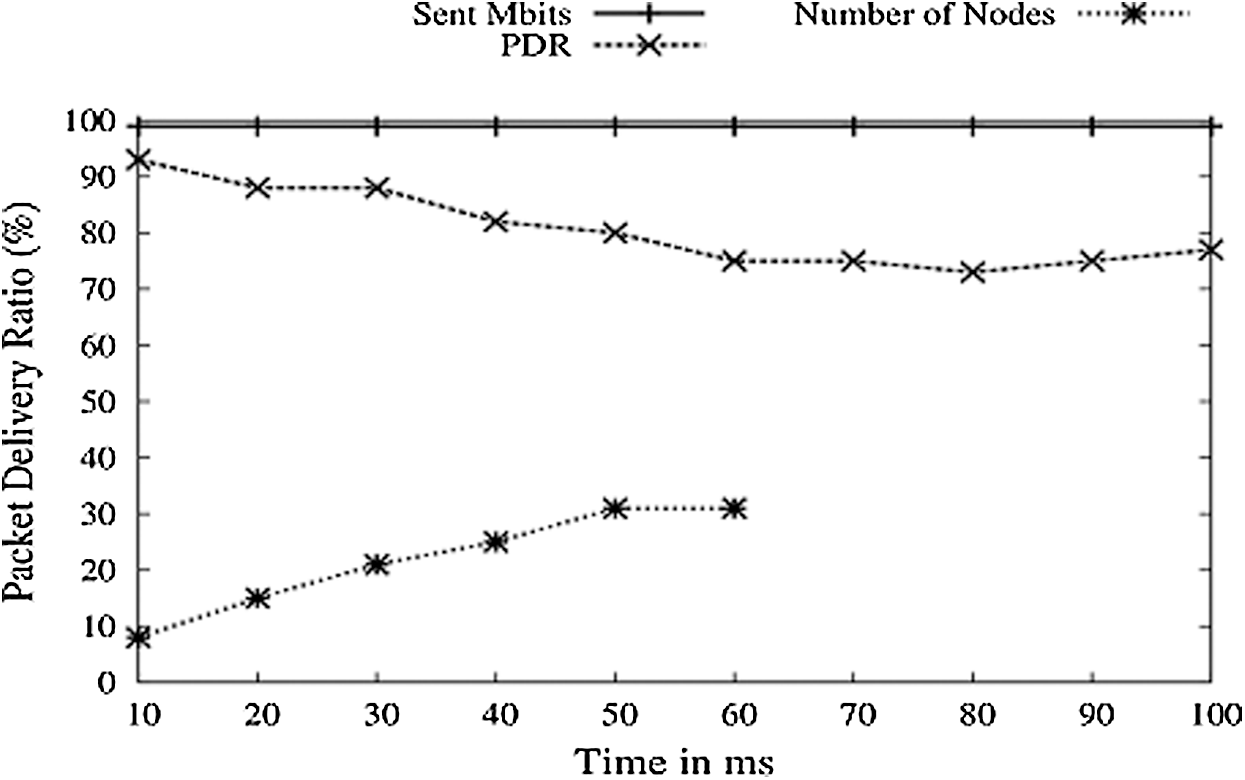
Figure 13: Malicious nodes vs. PDR
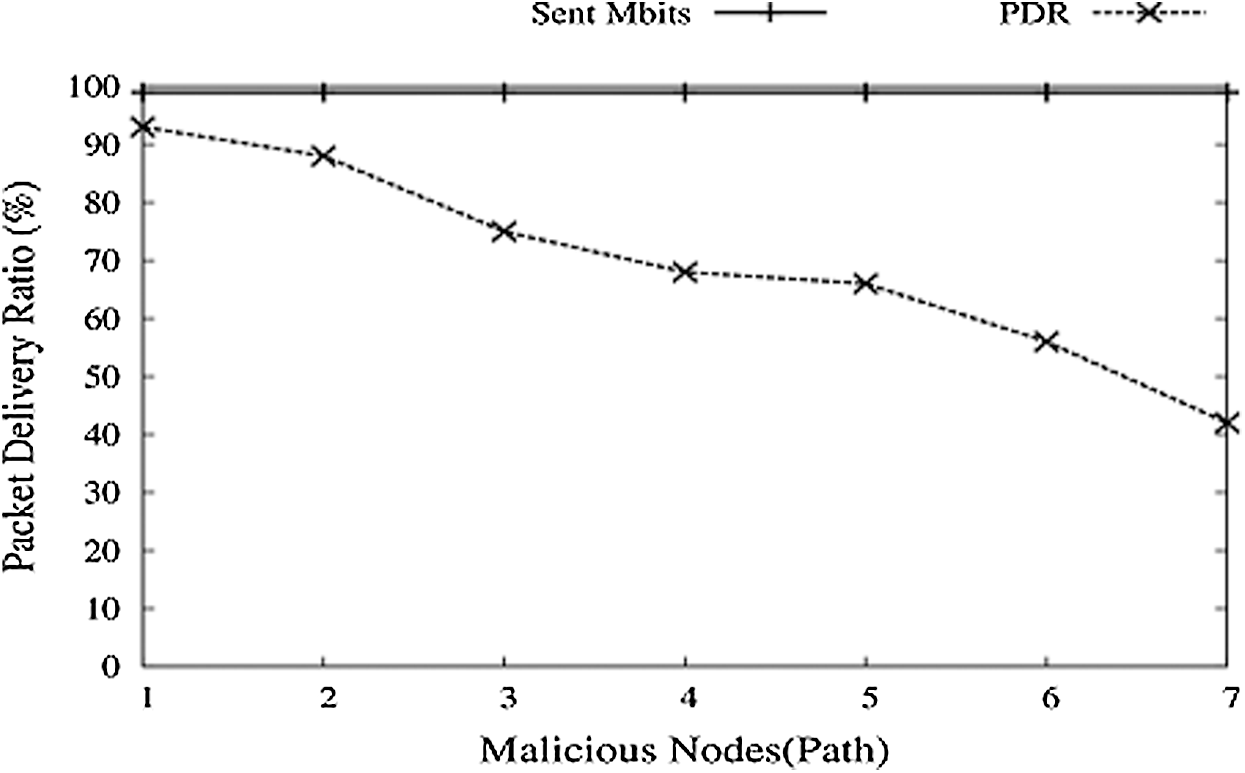
Figure 14: Number of node vs. PDR
With these losses in FC in such a given situation, it will be desirable to avoid such circumstances for better PDR. We implemented and created a function named SNMP and tested it with this entire scenario. SNMP function is run in NS-3. The following are some simulations with the FCP_SNMP module. PDR for normal FCP decreases gradually with the increase in malicious nodes, as shown in Fig. 14. With SNMP, PDR decreases, but with a low amount and for a specific time, it keeps drowning; after that, PDR starts pushing up as the MIB base contains a list of malicious nodes and avoids these nodes.
In Fig. 15, it is seen that PDR increases with SNMP, but another issue is the time needed or a delay in the formation and updating of the MIB base. Fig. 16 shows the average end to end delay. For normal FCP, delay first decreases with the increasing number of nodes and then rises. FCP crash means malicious nodes that show minor delay as the number of nodes is very few, not working. FCP_SNMP shows high delay because it first creates a routing table and then gets the new node’s address from this MIB base or route table.
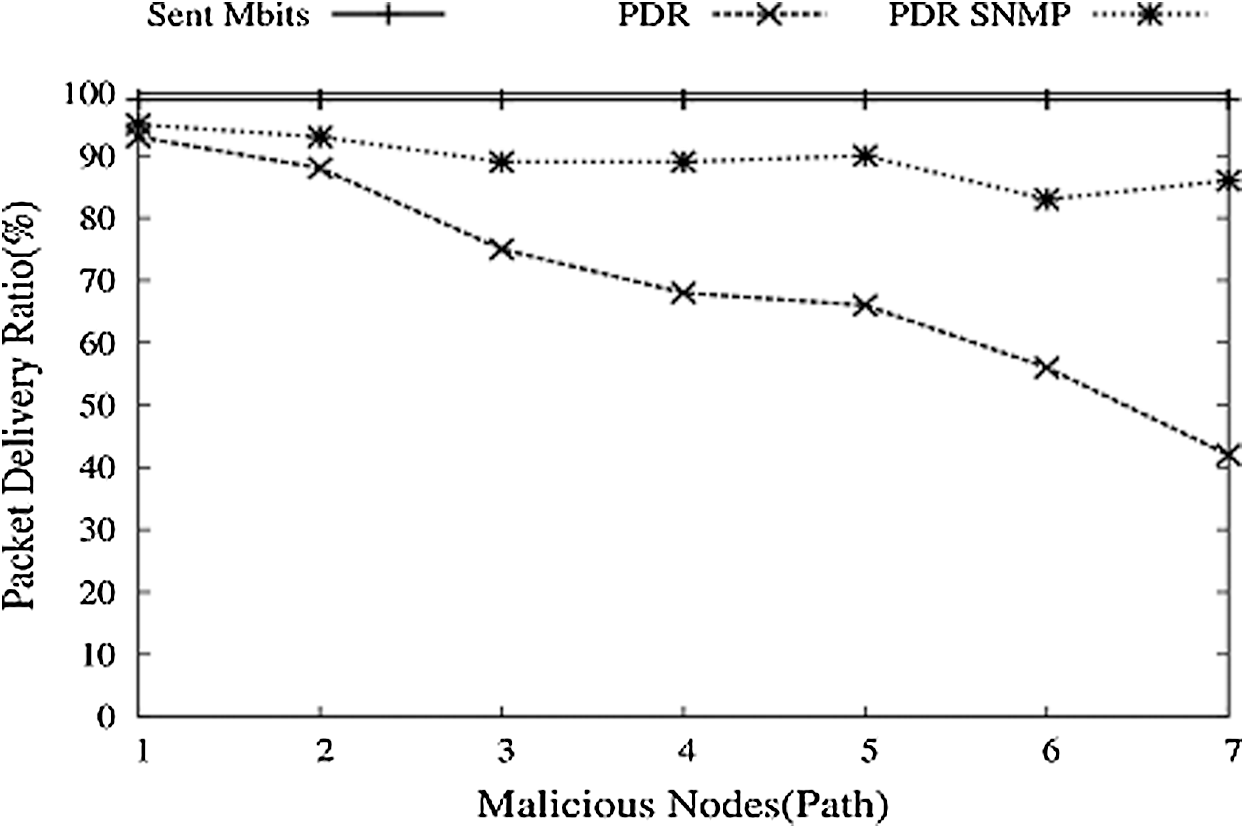
Figure 15: Malicious nodes vs. PDR with SNMP
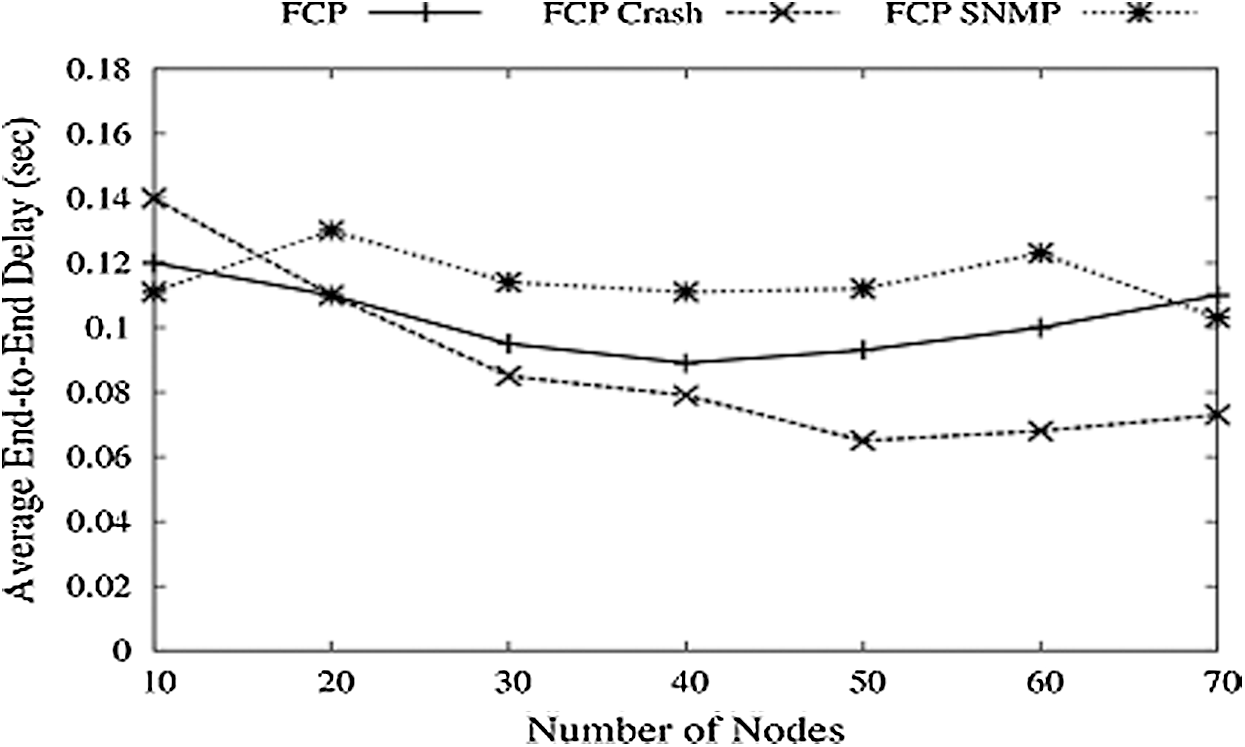
Figure 16: Number of node vs. average delay
As discussed earlier, mobility speed affects the PDR, and the Average End-to-End Delay (EED) for FCP is dropped as the mobility speed increases, and then a prolonged increase is observed. Delay for FCP Crash is low because of fewer nodes and negligible data to transfer. FCP_SNMP shows a very high delay because of fast data delivery and quick search and updating of the routing table.
From Fig. 17 and the table above, we can understand that the malicious node and high transmission rate degrade the Network’s performance. The FCP protocol uses an FC port to communicate very quickly with another network node. SNMP is used to update the GET route table and to decide network status and topology information. Malicious node blocks the route, triggers ineffective data transmission, and reduces PDR since FCP is waiting to re-establish a connection. We considered performance measures such as an EED, packet delivery ratio and overhead routing to implement detection techniques. Therefore, we have introduced the SNMP module on the source and target node. This method does not change the FCP further functioning but introduces future delays due to the pre-processing. This method is helpful to isolate malicious nodes and corrupt the network route from another transmission protocol.

Figure 17: Route discovery against malicious nodes
Storage virtualization is the technology of present need when data produced are growing exponentially, says a study. The study simulated the behaviour of the FCP network under various scenarios. Increased data rates also degrade the performance as the number of packets sent per second increases and so the loss. A malicious node can easily interrupt the route generated by the source node and degrade the Network’s performance. The proposed method isolates the malicious node and the congested node as well. It improves the performance by creating and maintaining a MIB Base, which can hold the details of the active node and based upon this, the route is set. It is observed that while an increasing number of nodes on the Network increased data transmission speed, an increase in sessions resulted in increased packet loss. Due to these factors, the overall Performance of FCP decreased, which is not appropriate for Virtualization.
In the future, we will work on the network’s security constraints and optimize the rest of the three constraints of storage virtualization. It will be a milestone if fault tolerance can be implemented on the Host Bus Adapter (HBA) that connects the devices to the processor.
Funding Statement: The authors received no specific funding for this study.
Conflicts of Interest: The authors declare that they have no conflicts of interest to report regarding the present study.
1. K. Mills, J. Filliben and C. Dabrowski, “Comparing VM-placement algorithms for on-demand clouds,” in IEEE 3rd Int. Conf. on Cloud Computing Technology and Science, Athens, Greece, pp. 91–98, 2011. [Google Scholar]
2. K. N. Qureshi, R. Hussain and G. Jeon, “A distributed software-defined networking model to improve the scalability and quality of services for flexible green energy internet for smart grid systems,” Computers & Electrical Engineering, vol. 84, no. 106634, 2020. https://doi.org/10.1016/j.compeleceng.2020.106634. [Google Scholar]
3. K. Xiao, Z. Gao, W. Shi, X. Qiu, Y. Yang et al., “An architecture for task offloading and resource allocation in the internet of things,” Future Generation and Computer Systerm, vol. 107, pp. 498–508, 2020. [Google Scholar]
4. A. P. Plageras, K. E. Psannis, C. Stergiou, H. Wang and B. B. Gupta, “Efficient IoT-based sensor BIG data collection-processing and analysis in smart buildings,” Future Generation Computer Systems, vol. 82, pp. 349–357, 2018. [Google Scholar]
5. W. Sun, J. Liu, Y. Yue and H. Zhang, “Double auction-based resource allocation for mobile edge computing in industrial internet of things,” IEEE Transactions on Industrial Informatics, vol. 14, no. 10, pp. 4692–4701, 2018. [Google Scholar]
6. T. Zhu, T. Shi, J. Li, Z. Cai and X. Zhou, “Task scheduling in deadline-aware mobile edge computing systems,” IEEE Internet of Things Journal, vol. 6, no. 3, pp. 4854–4866, 2019. [Google Scholar]
7. C. You and K. Huang, “Multiuser resource allocation for mobile-edge computation offloading,” in IEEE Global Communications Conf., Washington, DC, USA, pp. 1–6, 2016. [Google Scholar]
8. P. D. Kaur and K. Priya, “Fault tolerance techniques and architectures in cloud computing-a comparative analysis,” in Int. Conf. on Green Computing and Internet of Things, Greater Noida, India, pp. 1090–1095, 2015. [Google Scholar]
9. P. Zhang, H. Xue and S. Gao, “Multi-agent fault-tolerant control based on distributed adaptive consensus,” IEEE Access, vol. 7, pp. 135882–135895, 2019. [Google Scholar]
10. J. Li, J. Jin, D. Yuan and H. Zhang, “Virtual fog: A virtualization enabled fog computing framework for internet of things,” IEEE Internet of Things Journal, vol. 5, no. 1, pp. 121–131, 2018. [Google Scholar]
11. H. Ko, J. Jin and S. L. Keoh, “Secure service virtualization in IoT by dynamic service dependency verification,” IEEE Internet Things Journal, vol. 3, no. 6, pp. 1006–1014, 2016. [Google Scholar]
12. N. Meti, D. G. Narayan and V. P. Baligar, “Detection of distributed denial of service attacks using machine learning algorithms in software-defined networks,” in Int. Conf. on Advances in Computing, Communications and Informatics, Udupi, India, pp. 1366–1371, 2017. [Google Scholar]
13. C. Huang and J. Zhu, “Modeling service applications for optimal parallel embedding,” IEEE Transactions on Cloud Computing, vol. 6, no. 4, pp. 1067–1079, 2018. [Google Scholar]
14. Z. Tan, F. R. Yu, X. Li, H. Ji and V. C. M. Leung, “Virtual resource allocation for heterogeneous services in full duplex-enabled SCNs with mobile edge computing and caching,” IEEE Transactions on Vehicular Technology, vol. 67, no. 2, pp. 1794–1808, 2018. [Google Scholar]
15. S. Sudhakar and S. Chenthur Pandian, “Hybrid cluster-based geographical routing protocol to mitigate malicious nodes in mobile ad hoc network,” International Journal of Ad Hoc and Ubiquitous Computing, vol. 21, no. 4, pp. pp: 224–236, 2016. [Google Scholar]
16. L. da Cruz Nassif and E. Hruschka, “Document clustering for forensic analysis: An approach for improving computer inspection,” IEEE Transactions on Information Forensics and Security, vol. 8, no. 1, pp. 46–54, 2013. [Google Scholar]
17. K. Zhang, C. Li, Y. Wang, X. Zhu and H. Wang, “Collaborative support vector machine for malware detection,” Procedia Computer Science, vol. 108, no. S1, pp. 1682–1691, 2017. [Google Scholar]
18. J. K. Meena and R. Kumar Banyal, “Efficient virtualization in cloud computing,” in 5th Int. Conf. on Computing Methodologies and Communication, Erode, India, pp. 227–232, 2021. [Google Scholar]
19. N. Feng and Q. Yin, “Research on computer software engineering database programming technology based on virtualization cloud platform,” in IEEE 3rd Int. Conf. of Safe Production and Informatization, Chongqing City, China, pp. 696–699, 2020. [Google Scholar]
20. F. Wan, N. Chang and J. Zhou, “Design ideas of mobile internet desktop system based on virtualization technology in cloud computing,” in Int. Conf. on Advance in Ambient Computing and Intelligence, Ottawa, ON, Canada, pp. 193–196, 2020. [Google Scholar]
 | This work is licensed under a Creative Commons Attribution 4.0 International License, which permits unrestricted use, distribution, and reproduction in any medium, provided the original work is properly cited. |