DOI:10.32604/cmc.2022.020264
| Computers, Materials & Continua DOI:10.32604/cmc.2022.020264 | |
| Article |
Cross Intelligence Evaluation for Effective Emotional Intelligence Estimation
1Department of Computer Science, College of Computer, Qassim University, Buraydah, 51452, Saudi Arabia
2Computer Science and Engineering, Lovely Professional University, 144411, Punjab, India
*Corresponding Author: Aman Singh. Email: amansingh.x@gmail.com
Received: 17 May 2021; Accepted: 18 June 2021
Abstract: A famous psychologist or researcher, Daniel Goleman, gave a theory on the importance of Emotional Intelligence for the success of an individual’s life. Daniel Goleman quoted in the research that “The contribution of an individual’s Intelligence Quotient (IQ) is only 20% for their success, the remaining 80% is due to Emotional Intelligence (EQ)”. However, in the absence of a reliable technique for EQ evaluation, this factor of overall intelligence is ignored in most of the intelligence evaluation mechanisms. This research presented an analysis based on basic statistical tools along with more sophisticated deep learning tools. The proposed cross intelligence evaluation uses two different aspects which are similar, i.e., EQ and SQ to estimate EQ by using a trained model over SQ Dataset. This presented analysis ensures the resemblance between the Emotional and Social Intelligence of an Individual. The research authenticates the results over standard statistical tools and is practically inspected by deep learning tools. Trait Emotional Intelligence Questionnaire-Short Form (TEIQue-SF) and Social IQ dataset are deployed over a Multi-layered Long-Short Term Memory (M-LSTM) based deep learning model for accessing the resemblance between EQ and SQ. The M-LSTM based trained deep learning model registered, the high positive resemblance between Emotional and Social Intelligence and concluded that the resemblance factor between these two is more than 99.84%. This much resemblance allows future researchers to calculate human emotional intelligence with the help of social intelligence. This flexibility also allows the use of Big Data available on social networks, to calculate the emotional intelligence of an individual.
Keywords: Emotional intelligence; social intelligence; deep learning; social IQ dataset; multi-layered long short term memory
As per the latest statistics of social media, there are 2.77 billion social media users around the globe. A total of 2 h and 22 min is the average daily time that everyone spends on social media [1]. Daniel Goleman in his book ‘Emotional Intelligence why it can matter more than IQ’ claimed that Emotional Intelligence can matter even more than the IQ of an individual. As per his research, he said that the success of a person will 80% dependent on the EQ of the person and IQ has only 20% contribution [2]. The theory of social intelligence was given by American psychologist Edward Thorndike in 1920. He defined it as, “The ability to understand and manage men and women and boys and girls, to act wisely in human relations” [3]. The inventory system which is used to calculate the emotional intelligence of an individual is not very efficient to calculate emotional intelligence [4,5]. The overall average reliability of all the factors is only 63% [6,7]. The reason behind the lesser reliability factor is the lesser amount of data collected from the inventory system and poor data analysis techniques [8,9]. As social intelligence and emotional intelligence have many common features [3,10], so to find out the resemblance between social intelligence and emotional intelligence, suitable statistical and data analysis tools were used as they have a greater impact. Based on the previous research on humans’ social and emotional communication some concrete variables which affect the social and emotional intelligence of an individual were enlisted including Affection; Expression; Expectation; Ego; Mood and its effects; Dare; Positive and Negative Sharing; and Insecurity [11].
This research is aimed towards using Trait Emotional Intelligence Questionnaire-Short Form (TEIQue-SF) for Social Intelligence survey to find out the resemblance between emotional and social intelligence of an individual [12,13]. Furthermore, the TEIQue-SF1 is again analyzed on Social-IQ Dataset2 on a deep learning module for more profound analysis [14,15]. The SQ and EQ-based cross intelligence evaluation used the robustness of the Social-IQ Dataset and the accuracy of the TEIQue-SF questionnaire. The main contributions of this research are bulleted as under:
• Deployment of TEIQue-SF questionnaire to check Social Intelligence.
• SQ and EQ survey exploration by various statistical tools including Standard Deviation (
• Trained a Multi-layered Long-Short Term Memory (M-LSTM) based deep learning model [16] over Social-IQ Dataset (Question Answer only).
• Tested TEIQue-SF dataset over M-LSTM based trained model. Compare the stability of the model with Support Vector Machine (SVM), Recurrent Neural Network (RNN) and Single layered Long-Short Term Memory (LSTM) based Neural Networks.
• Evaluated the resemblance between EQ and SQ for cross intelligence evaluation over various parameters included in the TEIQue-SF questionnaire.
The subsequent portion of this section elaborates the essential review of literature for the crisp understanding of EQ, SQ and deep learning.
Review of Literature
Numerous studies have been conducted on various demographical variables that affect the EQ of an individual in the workplace [17]. The researchers applied various statistical tools like multiple regression analysis, ANOVA and t-test on the sample data. The sample data was tested using Revised Self-Monitoring [18], Job Associate-Bisociate Review Index [19], Interpersonal Reactivity Scale [20], and Trait Metamood Scale [21]. Based on the hypothesis, and the resultant outcome of various statistical tools, the study concluded that; female employees are more emotionally intelligent as compared to male employees while experienced employees are most emotionally intelligent. Based on Avolio et al. [22], Multifactor Leadership Questionnaire (MLQ-5X Short) [22–24], and On et al. [24] Self-report Emotional Intelligence Inventory, the sample data was divided into three different classes based on computed emotional intelligence of an individual. These three different groups were processed using multivariate analysis of covariance. The predictive intellectual of managers to judge their subordinates’ attitude and performance is the primary concept in the transformation of leadership in the organization; intellectual stimulation is the more cognitive component than any other components in this study [22,25]. One of the studies [26] was conducted to check whether abilities and personality traits can be the measures of Emotional Intelligence and to check that the combination of both can be used to perceive the quality of one’s interpersonal relationships. The questionnaire-based on Mayer, Salovey, and Caruso Emotional Intelligence Test (MSCEIT) Version 2.0 [27], was used in this survey based on three variables i.e., Positive relationship with others, Private & Public Self-Consciousness and Social Skills. Based on the hypothesis, MSCEIT Version 2.0 gives no relationship between personality traits and verbal intelligence and emotional intelligence and personality traits together predict social relationships concurrently. Statistical tools, means, standard deviation and the correlation between MSCEIT and other measures i.e., MOOD [28], Neuroticism-Extraversion-Openness Five-Factor Inventory NEO-FFI [29], Trait Meta-Mood Scale TMMS [30], etc. were applied. The calculated results on hypothesis were; MSCEIT was found to be the most efficient method to calculate the emotional intelligence of an individual based on ability and personality traits; scales of Self-perceived satisfaction and social relationships were also found to be correlated.
The earlier techniques used to check the EQ of an individual are not very much reliable. The average reliability of EQ Test Inventories is only 63%. The extensive computational power of the computer can be used to make it more reliable. Deep learning claims 91% accuracy in understanding things [31]. So, if a layered Neural Network (deep learning) is used to calculate EQ, it will improve the reliability of EQ Test Inventories. Further, the growth of the social network makes sense to calculate the social intelligence of an individual [32]. As per statista.com, about 70% of the earth’s population has at least one social media account and about 3 billion monthly active social media users are there [33]. On average, every person is spending 2 h and 22 min daily on social media [34]. So, social intelligence became an important factor in everyone’s life. So, if the study can check the resemblance between human EQ or SQ, the overall calculation of EQ and SQ together i.e., ESI (Emotional Social Intelligence) will provide more reliable results and the requirement of greedy data for deep learning will also be easily fulfilled by adding the Social Intelligence factor in this research [35,36].
The rest of the paper is organized into 3 sections, with the introduction being the first section. Section 2, discusses the proposed system, including hypothesis, datasets and methodologies. Section 3, argues various results and their impact on resemblance. Section 4, concludes the paper and elaborating the future prospective of the presented research.
This research proposed a two-phase solution to check the resemblance between EQ and SQ. In Phase-I, statistical analysis is performed for the TEIQue-SF questioner dataset. Subsequently, in Phase-II, M-LSTM based deep learning model is deployed to analyze the TEIQue-SF questioner dataset. Fig. 1, demonstrates the proposed Two-Phase conceptual model to achieve objectives understudy. The research begins with binary hypotheses, as illustrated below, where H0 represents the Null hypotheses and H1 represents the Alternate Hypotheses:
H0: There is no resemblance between the emotional and social intelligence of an individual.
H1: There is a resemblance between the emotional and social intelligence of an individual.
To check the hypotheses, initially, some authentic questioner is required to collect primary data from some relevant resources. Trait Emotional Intelligence Questionnaire-Short Form (TEIQue-SF) is then deployed to collect data after requisite modification w.r.t. Social Intelligence SQ. TEIQue-SF is a reputed questionnaire that includes, 30 psychological questions based on human psychological behavior [13]. TEIQue-SF has been used in numerous psychological and technical researches so far.
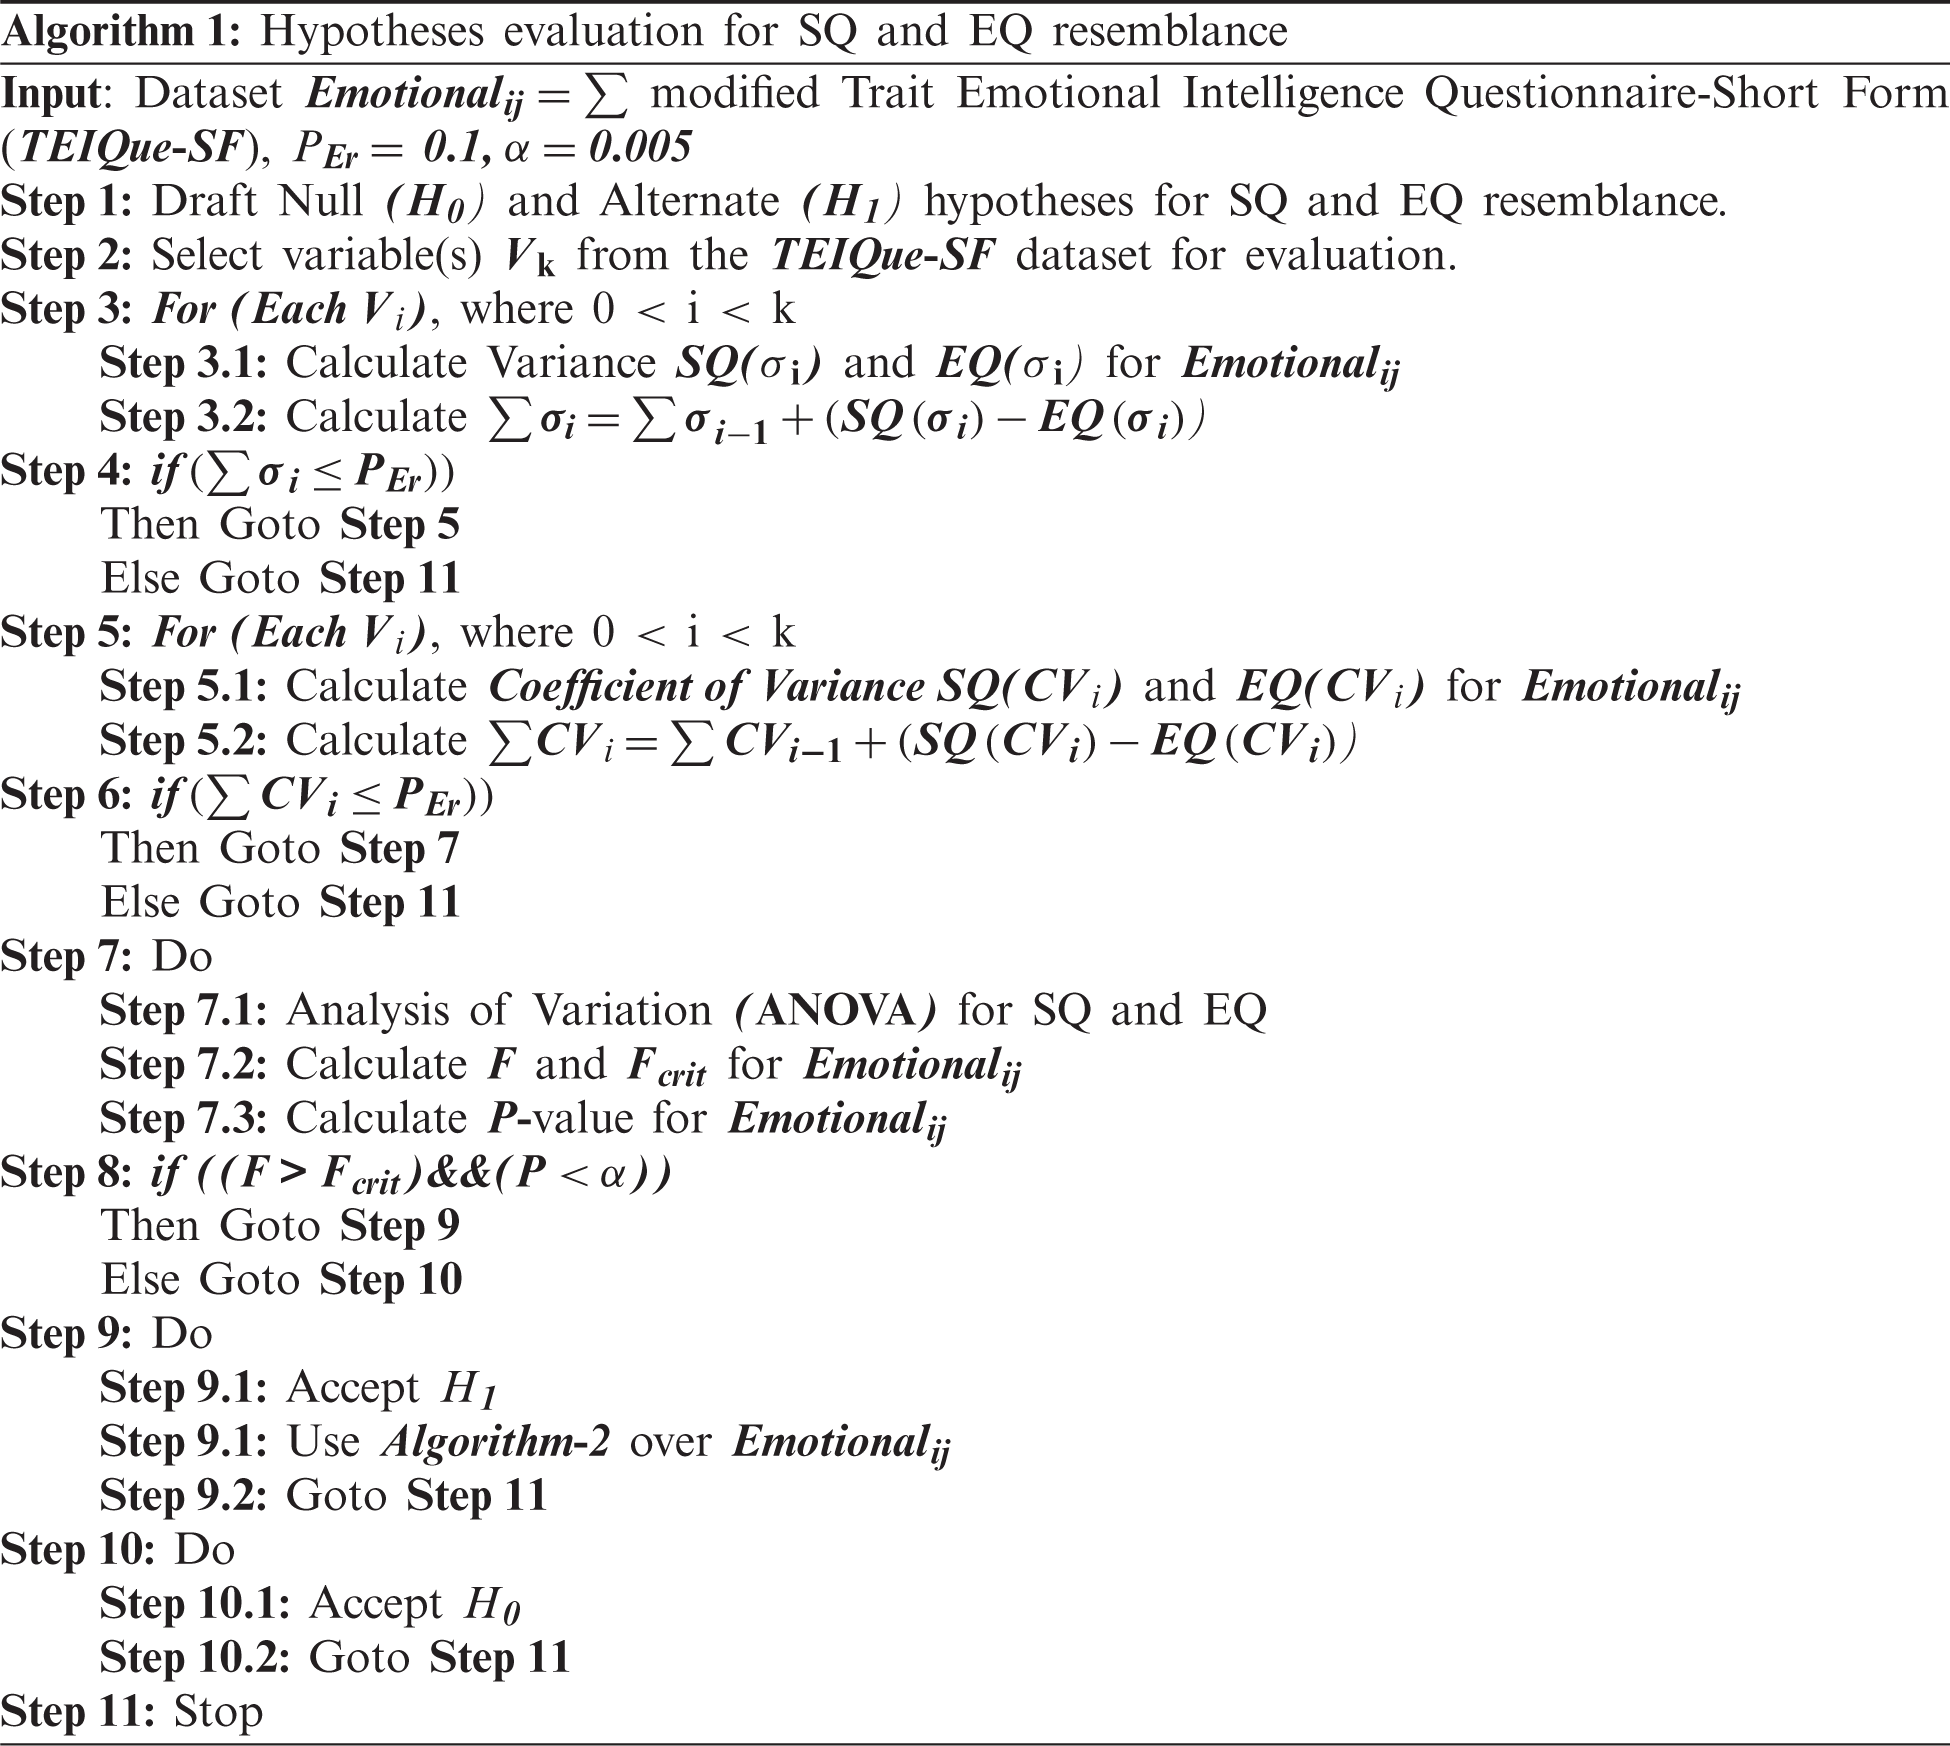
Ten parameters including, affection, well-being, expression, expectation, ego, mood, dare, positive and negative sharing, and insecurity are considered for this study. In a sample of 4500 individuals, 3000 individuals were selected through random sampling to explore the resemblance between emotional and social intelligence of an individual. The response rate of this survey was above 92%. A total of 3000 individuals were selected, who were using social networking for communication for at least 10 years and were visiting various social networking with a frequency of more than 10 times per day. The abstractive summary of the presented solution i.e., Phases-I and II is conceptualized under Algorithms 1 and 2 respectively, see Algorithms 1 and 2.
As per the questionnaire, every question was evaluated on a 1–6 scale for Strongly Disagree to Strongly Agree respectively. Weighted mean has been used to evaluate the standard deviation between X (Social Intelligence) and Y (Emotional Intelligence). Combined Coefficient of Variance of the different variable has been computed differently to draw the resemblance curve for X and Y. Combined Cumulative Coefficient of Variance of all the variable has also been computed to evaluate the overall percentage variation between X and Y. Weighted Mean, Standard Deviation [37], Coefficient of Variance [38] were used to draw the resemblance graph between X and Y, and they were mathematically computed by the equation given below:
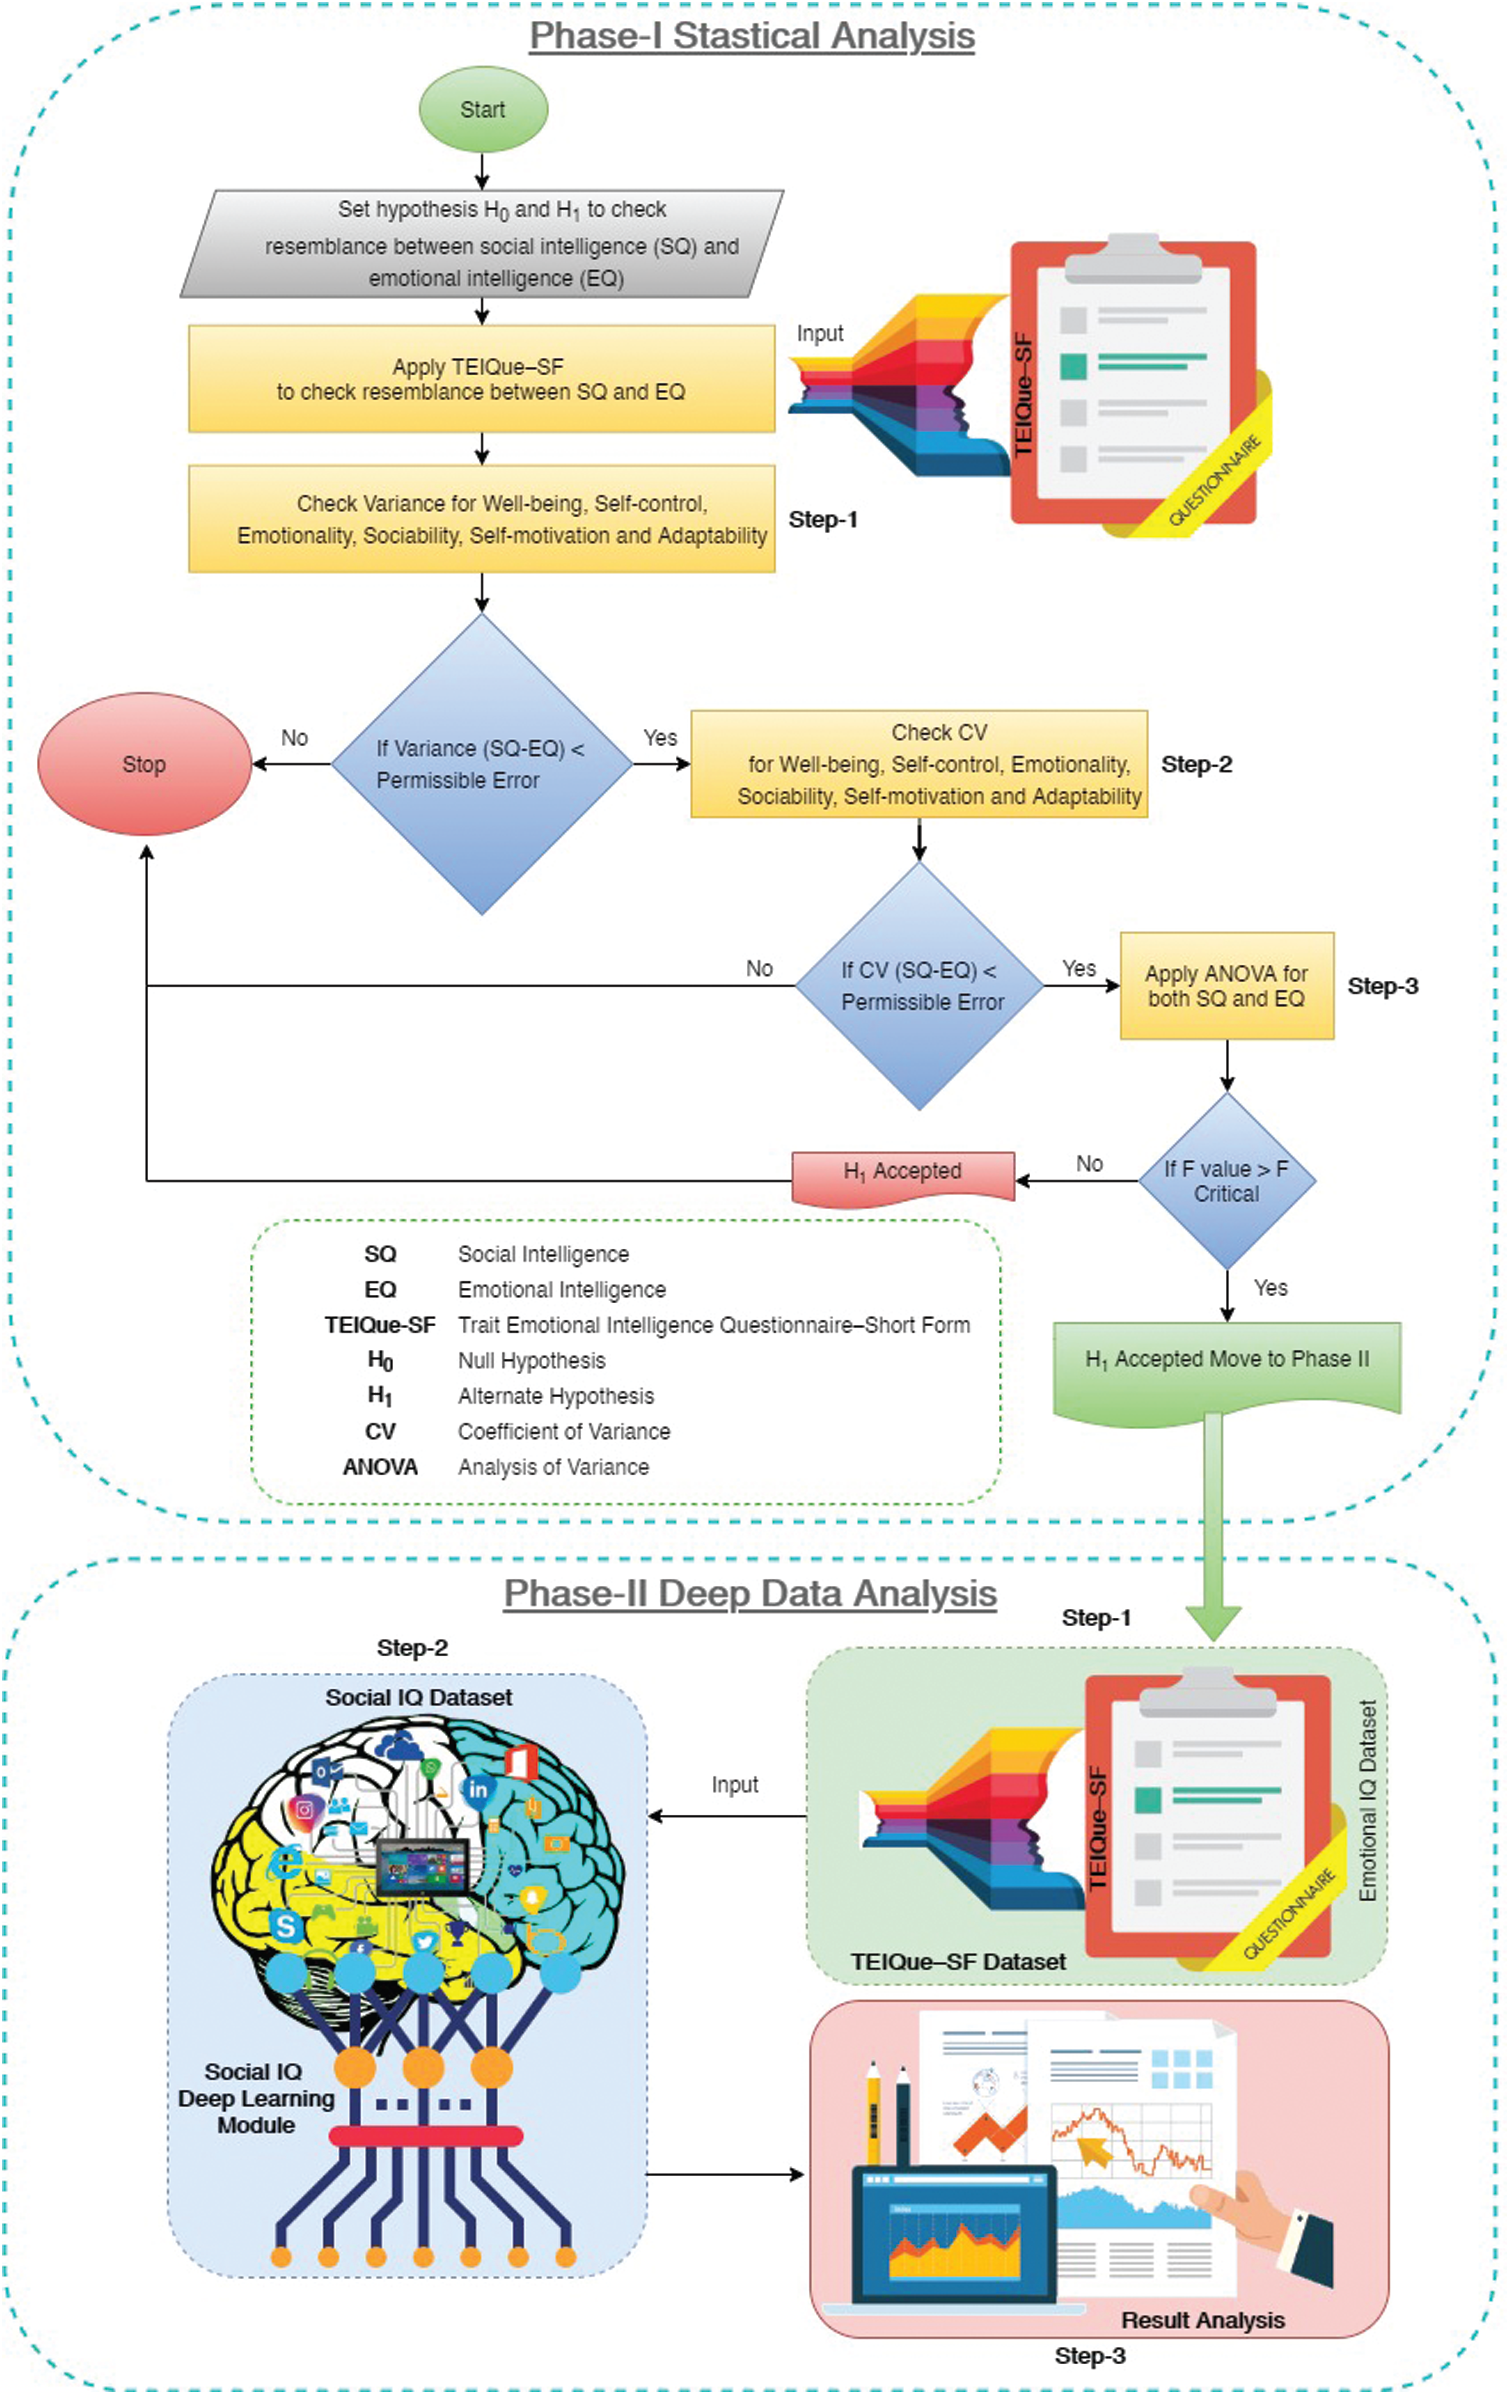
Figure 1: Proposed conceptual model for systemic analysis
where
Standard Deviation
Here,
The coefficient of variance
Eqs. (1)–(4) are used in Steps-1 and 2 as demonstrated under Phase-I of the conceptual model illustrated in Fig. 1. For Step-3 under Phase-I, Statistical Package for the Social Sciences (SPSS) is deployed to draw the ANOVA table (i.e., Analysis Of Variance) for relative analysis of both
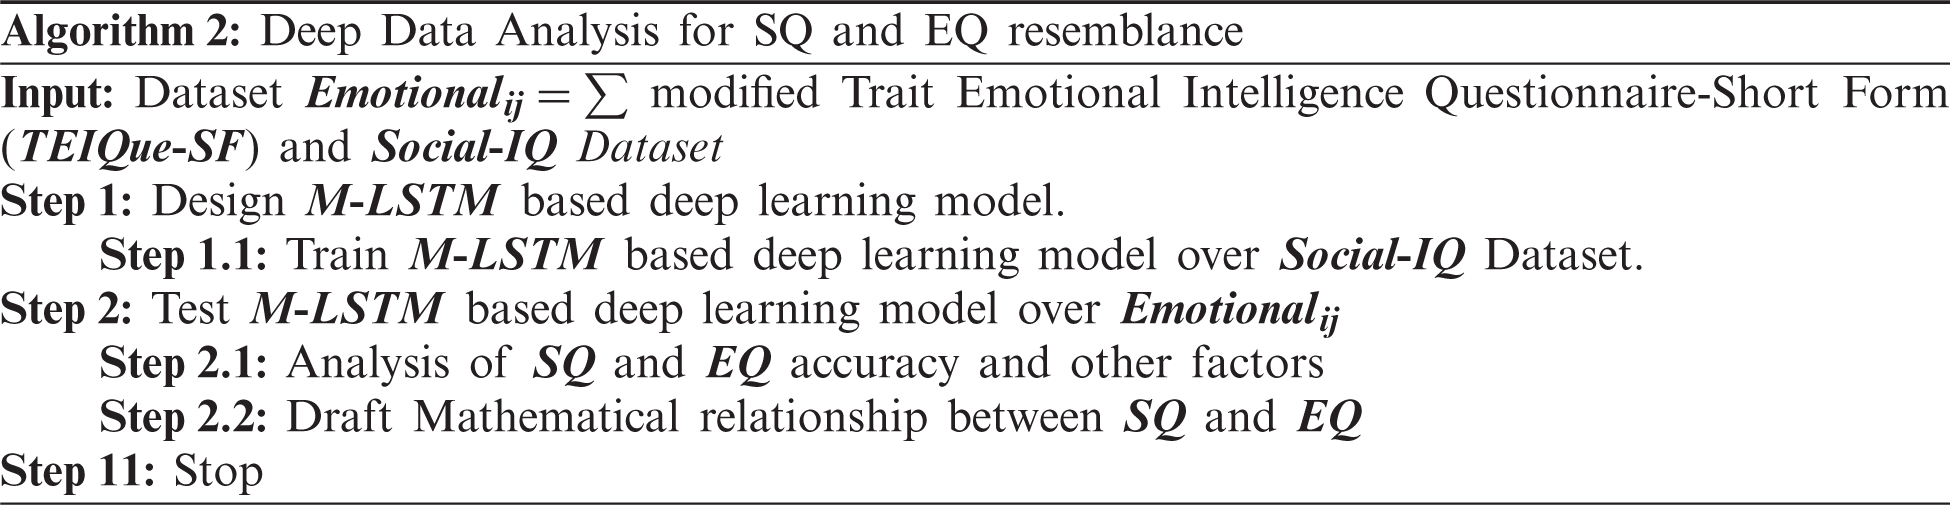
The study recommends moving to Phase-II only if some resemblance between EQ and SQ is observed in Phase-I. The two-phase structure of the proposed model makes it more convenient and economical, as simple statistical methods have been deployed under Phase-I. In comparison with Phase-I, Phase-II is a more complex and accurate analysis. In Phase-II, the Social-IQ dataset is deployed over an M-LSTM [39] based machine for training. Social-IQ Dataset is a widely used dataset for various research domains including sentimental analysis and predications, behavior analysis and predications, psychological and emotional analysis, etc. [32] The Social-IQ dataset is huge integration of over 1250 videos and 75000 questions. For deep analysis application of 52000 answers was used which included 30000 correct and 25000 incorrect answers concerning 75000 questions [32]. A total of 10000 questions from the Social-IQ dataset were then selected along with their answers through random sampling. The questions and answers were selected in a manner such that only 50% correct and 50% incorrect answers were chosen for their corresponding question. This classified dataset was employed to train M-LSTM based recurrence neural network model. The M-LSTM is an accurate and efficient deep learning method used for model training [37], data analysis and prediction. Fig. 2. Demonstrates the working of the proposed M-LSTM model. This M-LSTM model is deployed for deep data analysis under phase II of the proposed solution. Fig. 3. Shows the different learning stages of the M-LSTM model. Two layers of LSTM are deployed to enhance the learning capabilities of the proposed model. Under the temporal learning phase, the Social IQ Dataset is employed. Whereas, for the enhanced learning phase, TEIQue-SF dataset is used. Intended for training, the combined dataset i.e., SQ and EQ are deployed whereas for testing only EQ dataset is used. The ratio of SQ and EQ dataset is 9:1 for training. For experimental setup Intel Xeon E2630V4-10 core processor is used with 2.2 GHz of speed, 32 GB DDR4 RAM and 2 TB Hard Disk Drive. Ubuntu Server 16.04 is used for Python SciPy environment with Keras and TensorFlow.
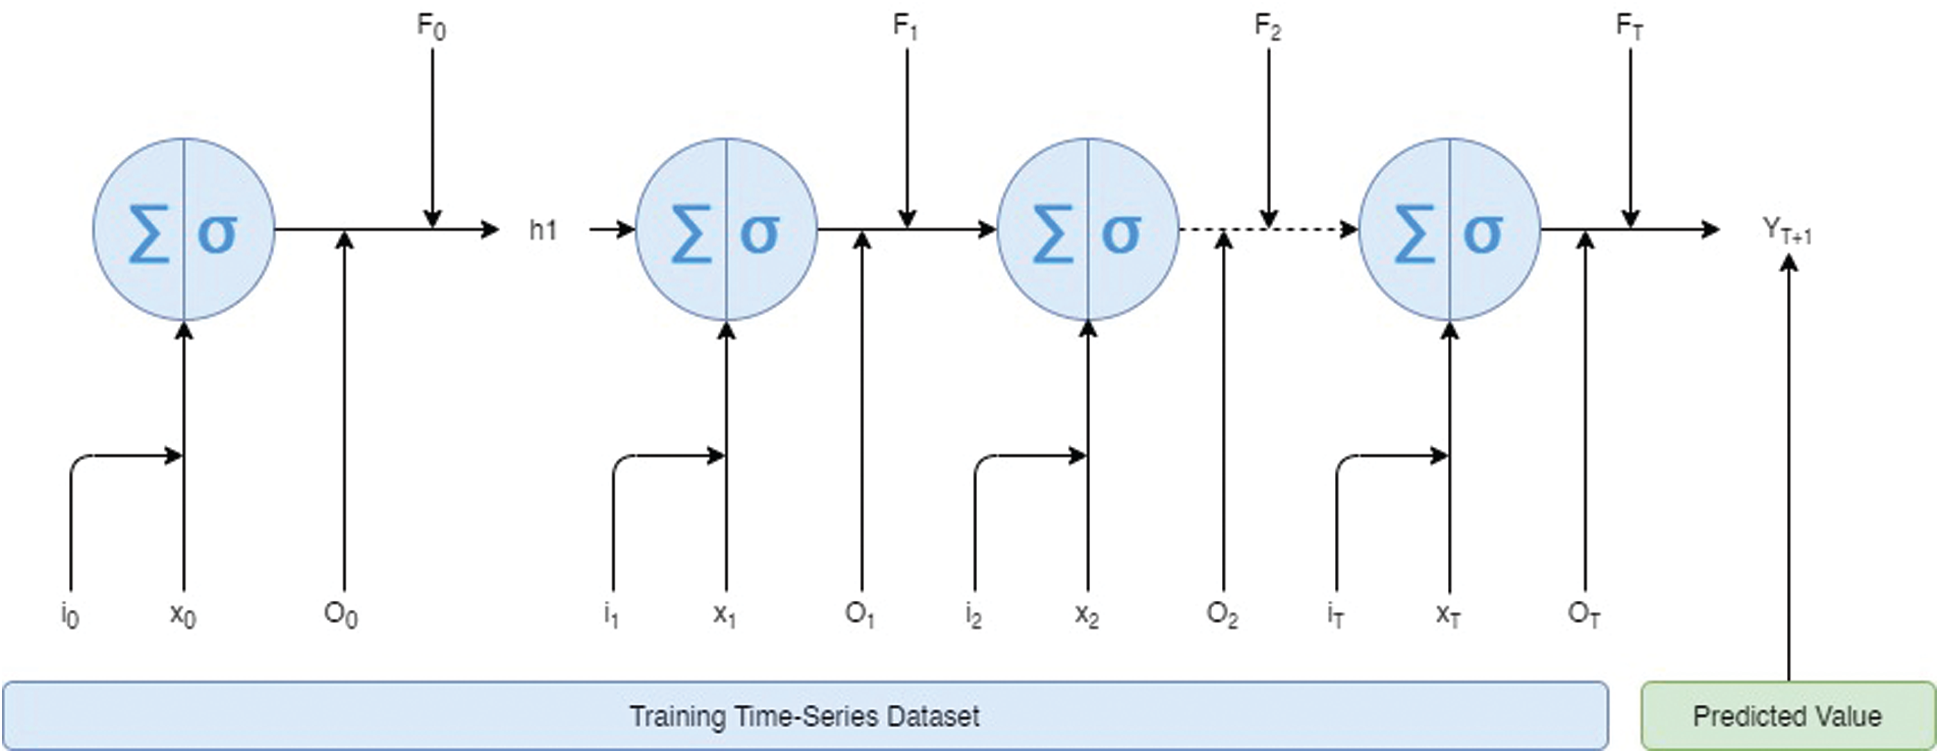
Figure 2: M-LSTM architecture
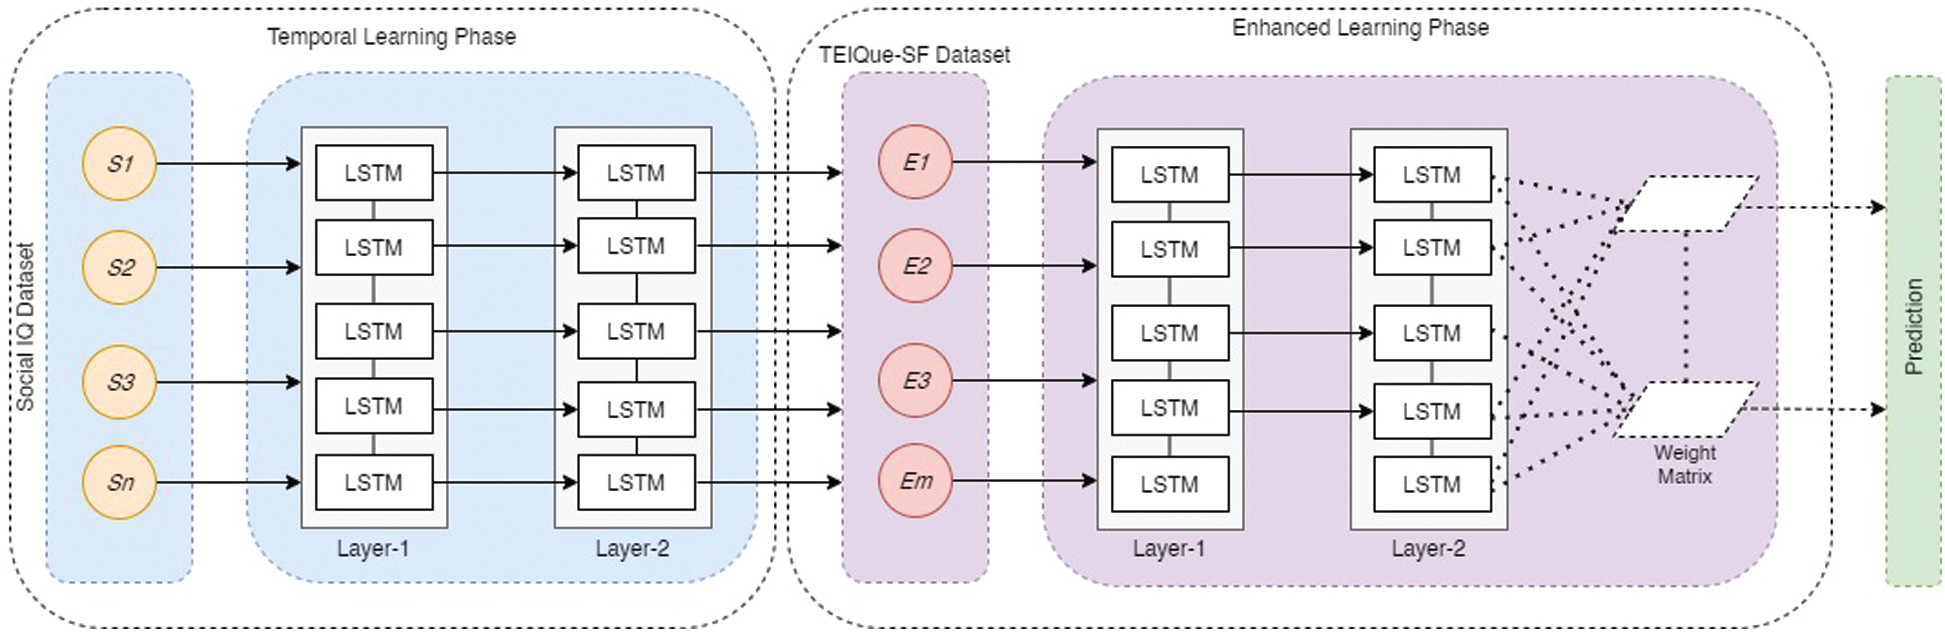
Figure 3: M-LSTM temporal learning and enhanced learning phases
The TEIQue-SF dataset was collected and used in Phase-I, which was analyzed on a trained model. The resemblance between SQ and EQ was analyzed based on 9 parameters i.e., Affection, Well-being, Expression, Expectation, Ego, Mood, Dare, Positive and Negative Sharing, and Insecurity. Further, the accuracy of the model was also analyzed over these parameters. The subsequent section of this paper unveils various results obtained during this research and also discusses the respective consequences of results over SQ and EQ resemblance.
The computed results after applying Eqs. (1)–(4) on the TEIQue-SF dataset for SQ and EQ are formulated in Tab. 1. Well-being, Expression, Expectation, Dare, Positive and Negative Sharing and Insecurity registered minimum percentage variation with the average percentage variation being less than 0.1 in these cases. On the other hand Affection, Ego and Mood depicted slightly higher average percentage variation, the variation in these parameters ranged between 0.1 and 0.2. Further, Checks1 and 2 in Tab. 1 were used in Steps-1 and 2 of phase-I respectively. Check1 i.e., for standard deviation allowed us to pursue Step-2 as for all the parameters the average standard deviation variance was less than the permissible error i.e., <0.1. The combined average standard deviation variance for all the 10 parameters was found to be only 0.012313, which is comparably very less. Although the acquired data did not complete the Check2 condition for Affection, Ego and Mood but the combined average coefficient of variance was found to be only 0.073781 which is again comparably very less. The line chart, demonstrated in Fig. 4, illustrates the resemblance between SQ and EQ. The error lines are drawn based on Standard Deviation also favors the resemblance for most of the parameters.
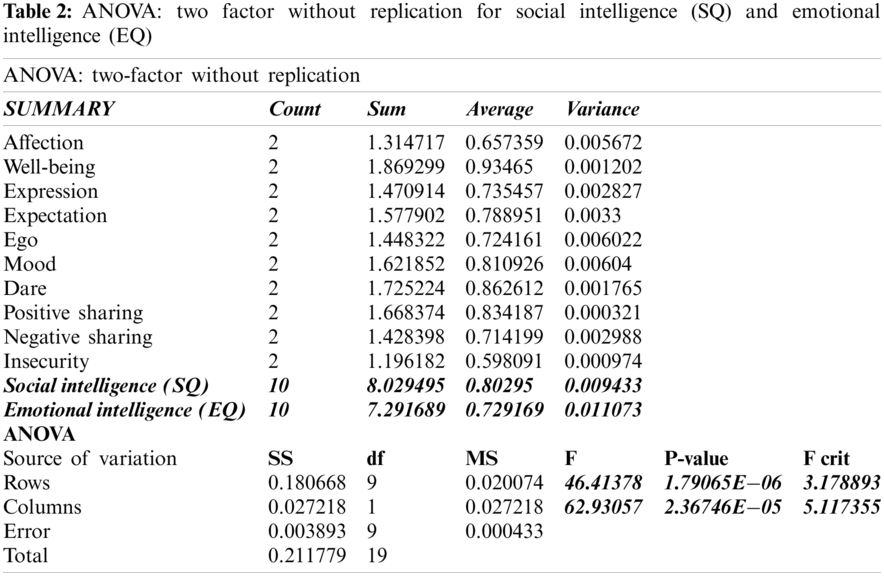
Consequently, for Step-3 under Phase-I, ANOVA: Two Factor without Replication has been performed. The ANOVA: Two Factor without Replication is illustrated in Tab. 2. The calculated result of ANOVA: Two Factor without Replication qualifies the check mentioned in Step-3 under Phase-I i.e., F value > F Critical value and P-value is less than the alpha
As per the results of two-way ANOVA: Two Factor without Replication, the alternate, it is evident that Hypothesis H1 (i.e., There is a resemblance between emotional and social intelligence of an individual), is acceptable and significant [40]. The psychometric results obtained in Phase-I are bulleted as under:
• An individual is feeling unimpeded to express their thoughts and ideas on Social Networks.
• An individual required more attention in their personal life from society as compared to Social Networks.
• The insecurity factor for communication is less on social networks.
• The effect of communication on the social network is less on an individual’s mood or emotions.
• It is equally easier for a person to share positive moods or thoughts on social networks or in their real social scenario, but they are hesitant to share the negative moods or thoughts on the social networks.
• As a whole, there is only a 0.07% variation between the emotional and social intelligence of a person.
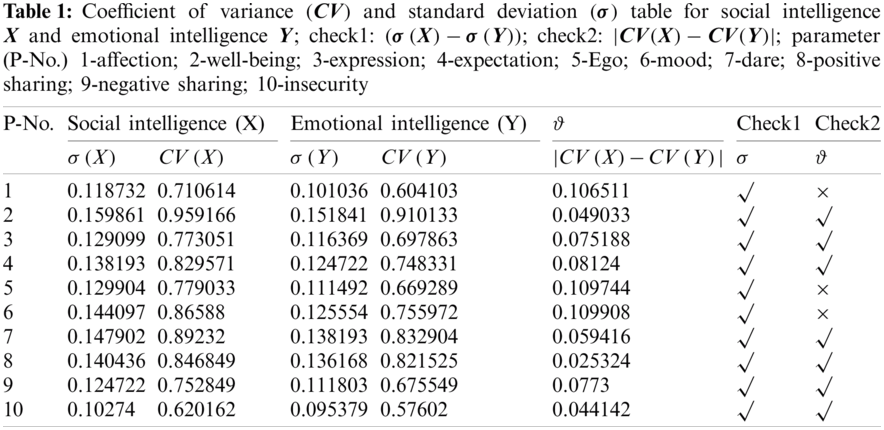
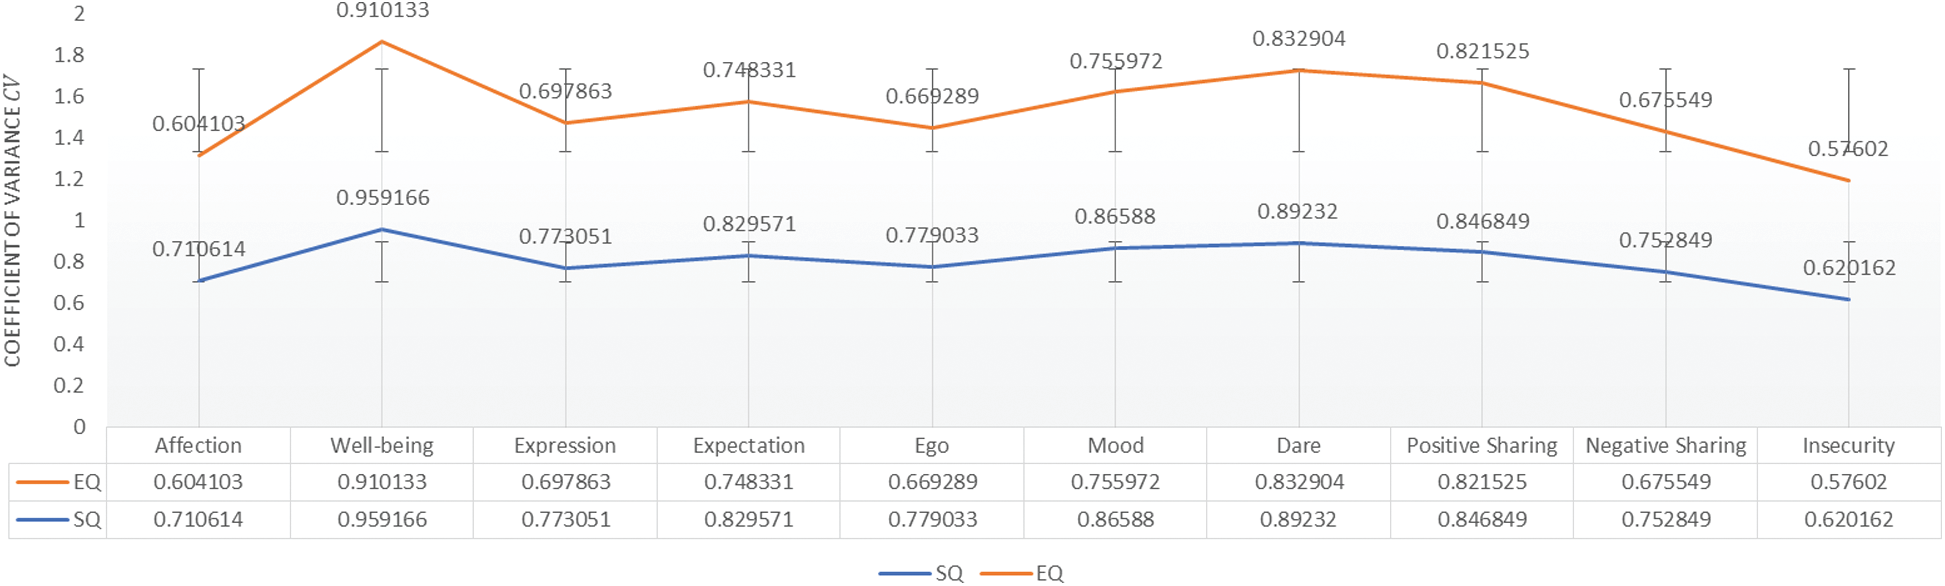
Figure 4: Percentage coefficient of variance CV for social intelligence (SQ) and emotional intelligence (EQ)
Mathematically, the Phase-I results are concluded as:
Further, the ANOVA test also qualifies the check mentioned in Step-3 under Phase-1. Consequently, the proposed conceptual model allows us to move for Phase-II i.e., Deep Data Analysis.
The proposed study recommends an M-LSTM based trained model over the Social IQ Dataset under Phase-II of the proposed conceptual model. The trained model is tested on the TEIQue-SF dataset for SQ and EQ. An incremental improvement policy [41] was deployed to test the model over the acquired dataset. Initially, the first set of 500 answers were applied to the trained model. Subsequently, an additional 500 new answers were deployed to test the model. The entire testing process was completed in 6 steps, where the improvement in result prediction was registered in each successive step. In each step, the complexity of questions was kept constant as per the ratio(s) Easy (19%), Intermediate (40%) and advanced (41%) [32]. The complexity of questions for each incremental step is given in Fig. 5.
All 6 steps datasets were applied on all the 10 parameters previously used in Phase-I. The observed results of all the 60 observations are grouped under six different sets and presented in Fig. 6. The observations registered under Set I-500 illustrate the results for the first 500 observations (selected answers) subsequently, the rest of the figures illustrates the results for their respective Set(s) of observations i.e., Set II-1000, Set III-1500, Set IV-2000, Set V-2500 and Set VI-3000. Set I registered the higher level of accuracy difference between SQ and EQ results. Set I also registered the minimum accuracy level for Well-being i.e., 83.21. The subsequent sets registered the increasing level of accuracy for increasing levels of datasets. Moreover, the subsequent sets also registered the decreasing level of accuracy difference concerning the increasing level of datasets. The last dataset, i.e., Set VI-3000, registered the maximum accuracy level for Insecurity i.e., 90.11. The above-mentioned results conclude that the increasing level of datasets increases the accuracy level of the model. Further, the variation in the level of accuracy between SQ and EQ also decreased with the increased level of the datasets. The Social Intelligence-based trained model was found to produce similar results for Emotional Intelligence with above 90% of accuracy.
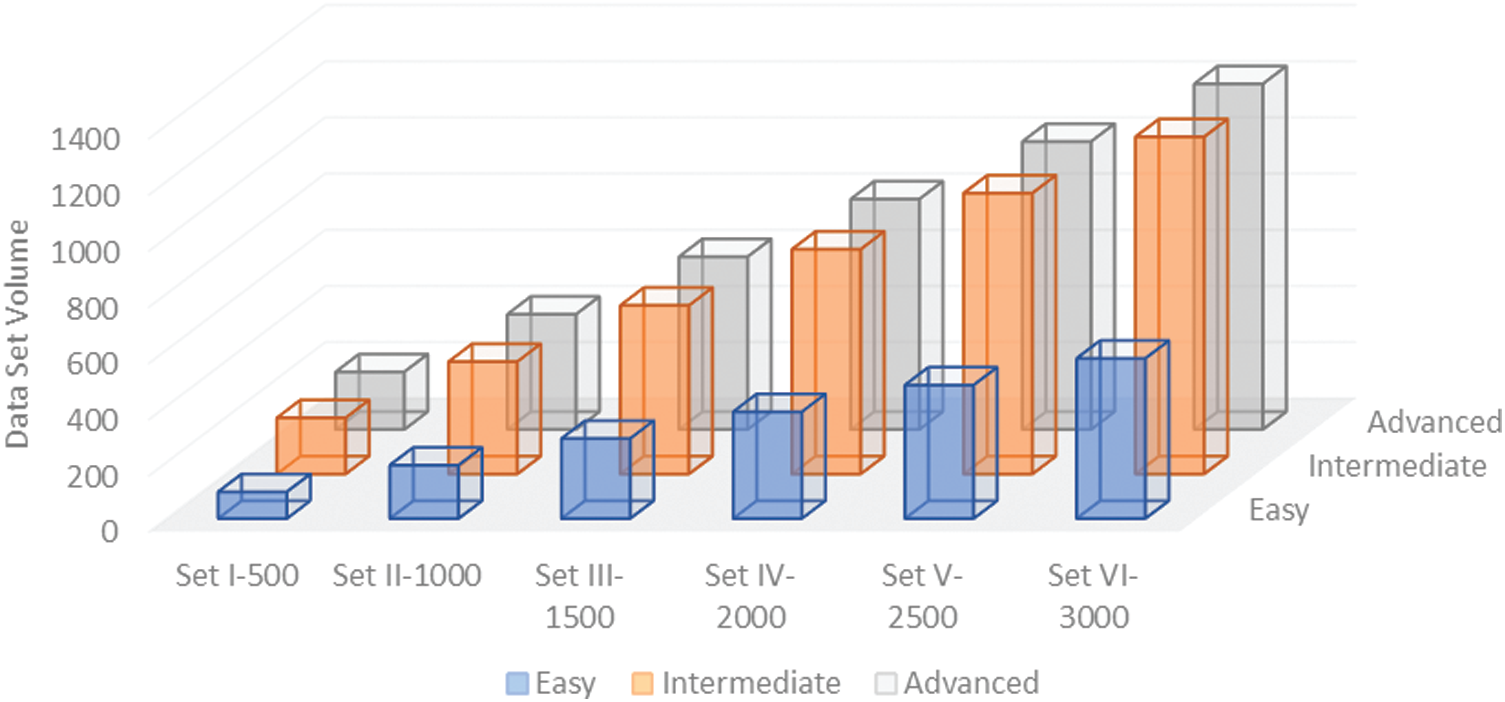
Figure 5: Data set volumes for all six datasets
The results concluded in Phase-II also showed resemblance between SQ and EQ, but the level of resemblance in Phase I and Phase II was found to be different as the results mentioned in Phase I were from statistical analysis only in contrast to the Phase II results which were obtained after actual data interpretation of primary data on a trained machine. Concluding this, the present research recommends the results obtained in Phase II over Phase I. Mathematically, Eq. (5) obtained in Phase I were resurrected as:
In Eq. (6),
M-LSTM accuracy over Social IQ Dataset is illustrated under Tab. 3. The accuracy level achieved by the M-LSTM base trained model is 88.11% with a 0.845 f1-score.
Further, the stability of the presented model in Phase II was evaluated by computing Absolute Average Change (AAC) over a time frame
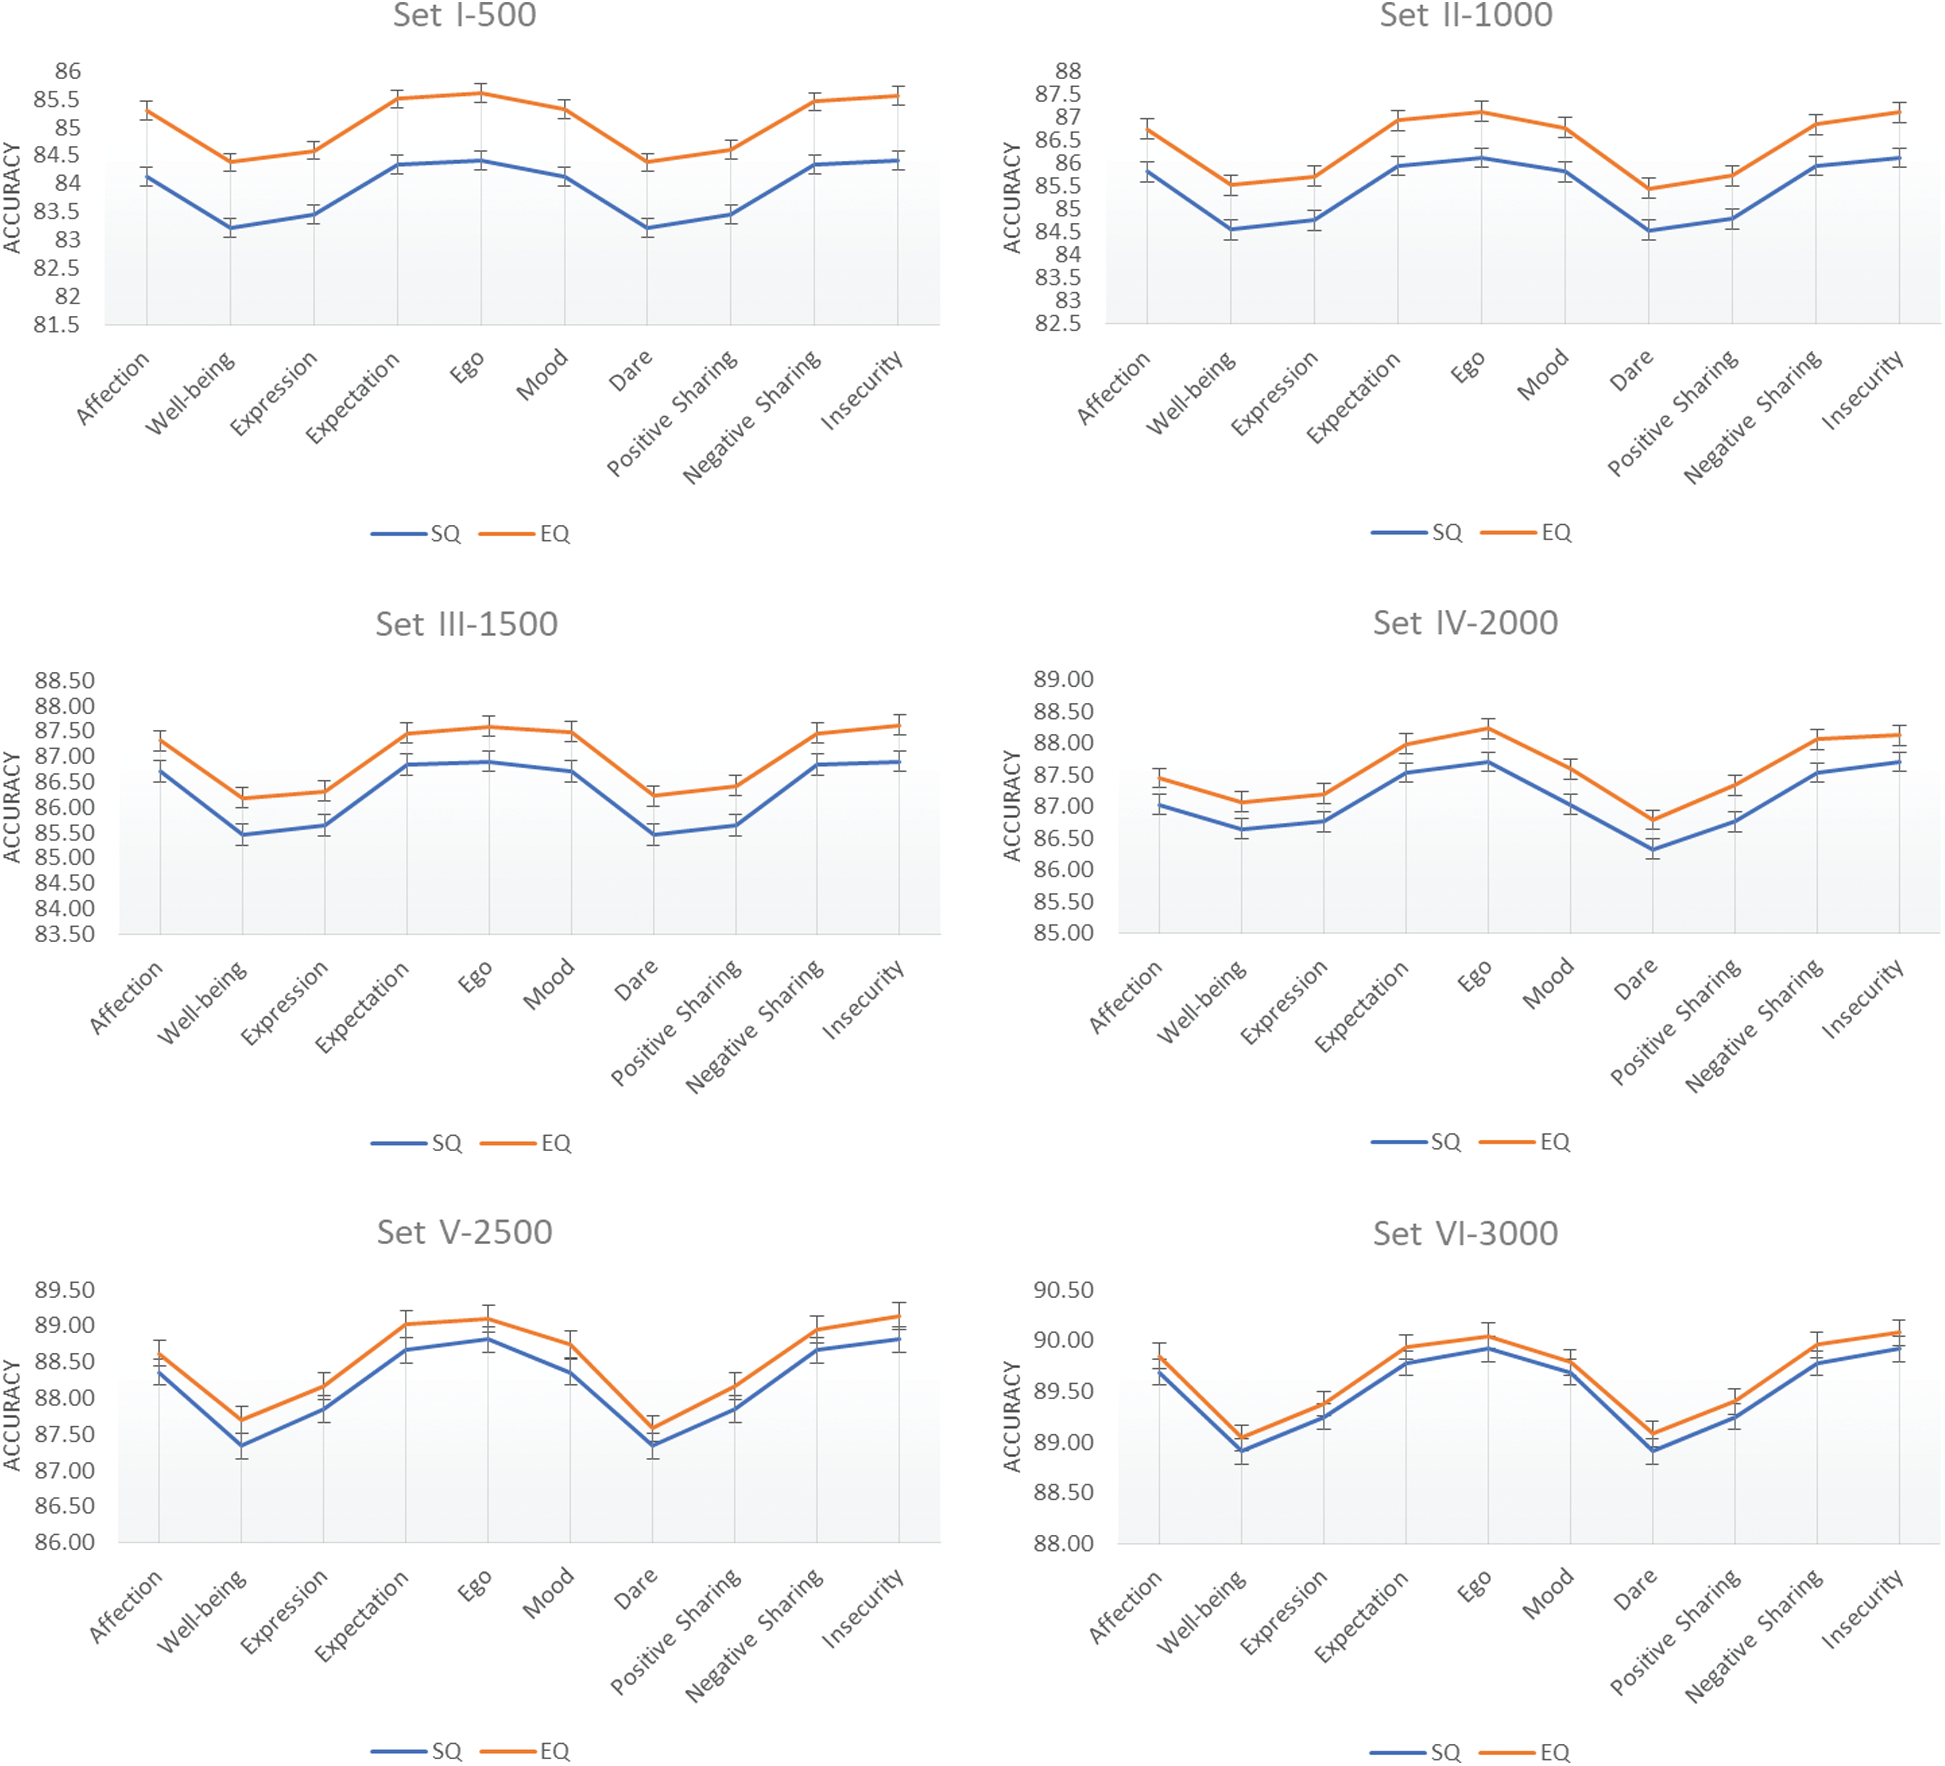
Figure 6: Accuracy level of M-LSTM based trained model w.r.t. each parameter; Social intelligence (SQ); Emotional intelligence (EQ)
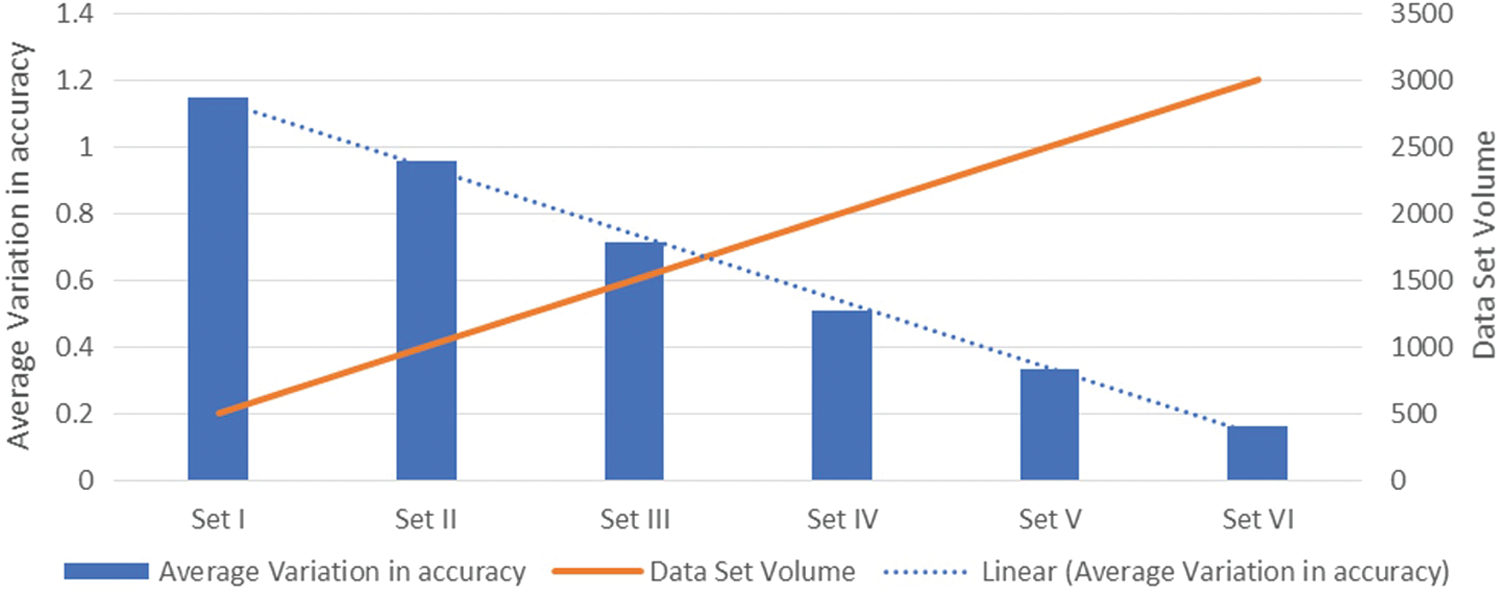
Figure 7: Linear decreases variation in average accuracy
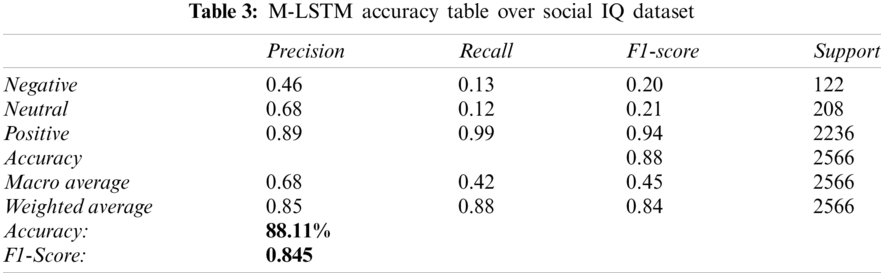
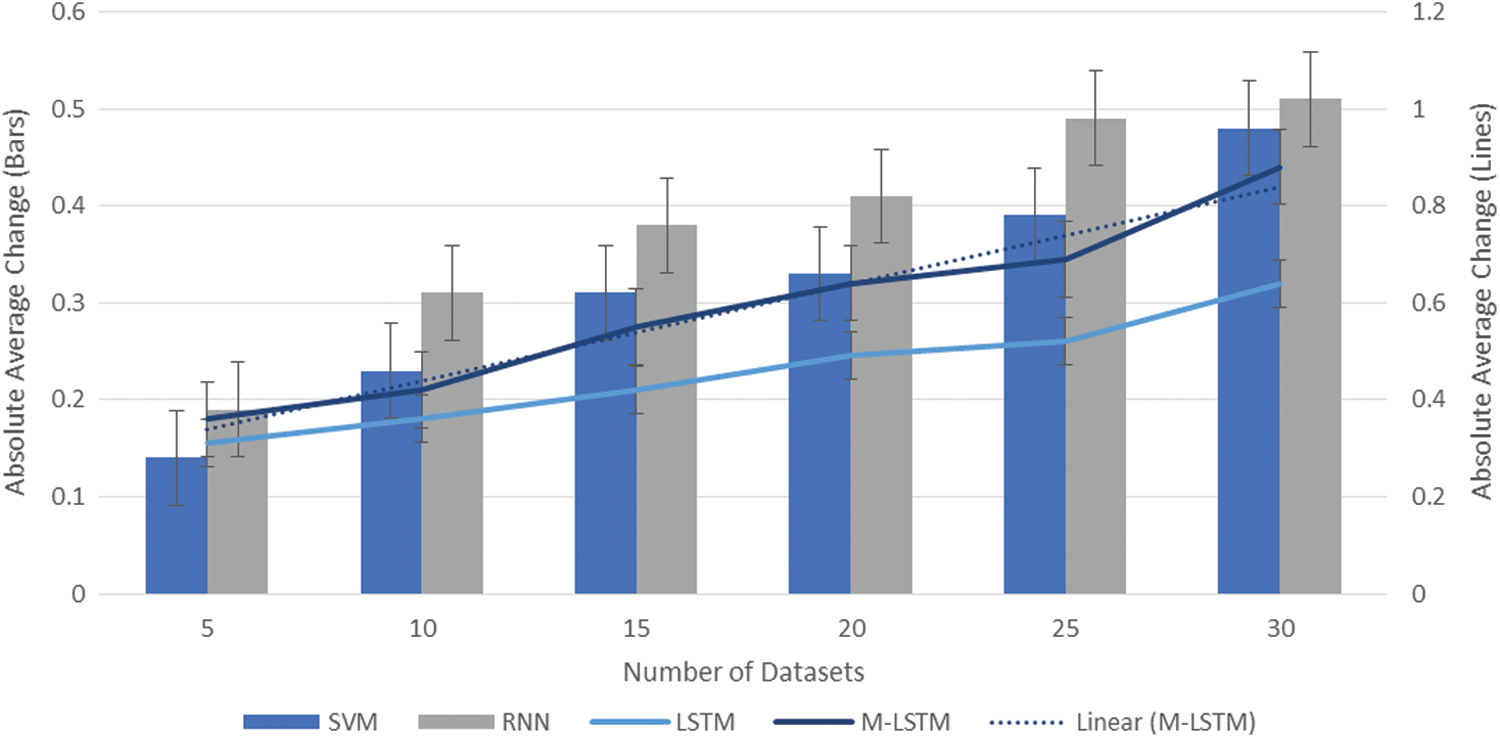
Figure 8: Stability in terms of absolute average change (AAC)
4 Conclusion and Future Perspective
The present research concludes that based on the ten parameters i.e., 1-Affection; 2-Well-being; 3-Expression; 4-Expectation; 5-Ego; 6-Mood; 7-Dare; 8-Positive Sharing; 9-Negative Sharing and 10-Insecurity, there is a positive resemblance between the emotional and the social intelligence of an individual. The present research enumerated two results based on the two different analyses. The analysis performed under Phase-I in this research used basic statistical techniques like Standard Deviation (
In the future, the extensive computational and learning powers of computers will be applied to check the emotional and social intelligence of an individual [29]. This research domain will make the system able to predict human emotions [4]. This research can further be used to evaluate and predict the emotional and social stability between the two persons [44]. The resultant of such predictions will help to make hiring more appropriate and compatible individuals [45,46]. Further new research areas will also be unlocked for the society as the society is still following the traditional methods due to lack of suitable standard in these areas. Many religions around the world are still using their traditional horoscope matching system for finding a suitable match. Although this traditional horoscope matching system is proven and giving very good results but still in many cases if someone’s basic credentials are not proper sometimes the error factor gives just the opposite results [47]. In such a case, if utilizing Emotional and Social Intelligence it is possible to check the emotional as well as social feasibility between them, it will improve the judgment in such cases.
Acknowledgement: Researchers would like to thank the Deanship of Scientific Research, Qassim University for funding the publication of this project.
Funding Statement: Researchers would like to thank the Deanship of Scientific Research, Qassim University for funding the publication of this project.
Conflicts of Interest: The authors declare that they have no conflicts of interest to report regarding the present study.
1. D. V. Dimitrova and J. Matthes, “Social media in political campaigning around the world: Theoretical and methodological challenges,” Journalism & Mass Communication Quarterly, vol. 1, pp. 333–342, 2018. [Google Scholar]
2. D. Goleman, Emotional Intelligence. Why it Can Matter more than IQ. vol. 1. Landon, UK: Penguin Random House, pp. 17–45, 2005. [Google Scholar]
3. D. Wawra, “Social intelligence the key to intercultural communication,” European Journal of English Studies, vol. 13, no. 2, pp. 163–177, 2009. [Google Scholar]
4. R. B.-On, J. M. Brown, B. D. Kirkcaldy and E. P. Thomé, “Emotional expression and implications for occupational stress; An application of the emotional quotient inventory (EQ-i),” Personality and Individual Differences, vol. 28, no. 6, pp. 1107–1118, 2000. [Google Scholar]
5. D. Dawda and D. H. Stephen, “Assessing emotional intelligence: Reliability and validity of the bar-on emotional quotient inventory (EQ-i) in university students,” Personal and Individual Differences, vol. 28, no. 4, pp. 797–812, 2000. [Google Scholar]
6. E. Jauk and J. C. Ehrenthal, “Self-reported levels of personality functioning from the operationalized psychodynamic diagnosis (OPD) system and emotional intelligence likely assess the same latent construct,” Journal of Personality Assessment, vol. 103, no. 3, pp. 1–14, 2021. [Google Scholar]
7. R. B. On, “The bar-on emotional quotient inventory (EQ-iRationale, description and summary of psychometric properties,” Measuring Emotional Intelligence: Common Ground and Controversy, pp. 115–145, 2004. [Online]. Available: https://psycnet.apa.org/record/2004-19636-006. [Google Scholar]
8. D. L. V. Rooy, C. Viswesvaran and P. Pluta, “An evaluation of construct validity: What is this thing called emotional intelligence?,” Human Performance, vol. 18, no. 4, pp. 445–462, 2009. [Google Scholar]
9. K. V. Petrides, J. C. P. González and A. Furnham, “On the criterion and incremental validity of trait emotional intelligence,” Cogition and Emotion, vol. 21, no. 1, pp. 26–55, 2007. [Google Scholar]
10. J. K. Stoller, “Leadership essentials for the chest physician: Emotional intelligence,” Chest, vol. 159, no. 5, pp. 1942–1948, 2021. [Google Scholar]
11. A. Cooper and K. V. Petrides, “A psychometric analysis of the trait emotional intelligence questionnaire-short form (TEIQue-SF) using item response theory,” Journal of Personality Assessment, vol. 92, no. 5, pp. 449–457, 2010. [Google Scholar]
12. M. F. Perazzo, L. G. Abreu, P. A. P. Díaz, K. V. Petrides, A. F. G. Garcia et al., “Trait emotional intelligence questionnaire-short form: Brazilian validation and measurement invariance between the united kingdom and latin-american datasets,” Journal of Personality Assessment, vol. 103, no. 3, pp. 342–351, 2021. [Google Scholar]
13. F. Chiesi, C. Lau, G. Marunic, M. J. S. Ruiz, R. A. Plouffe et al., “Emotional intelligence in young women from five cultures: A TEIQue-SF invariance study using the omnicultural composite approach inside the IRT framework,” Personal and Individual Differences, vol. 164, no. 110128, pp. 1–6, 2020. [Google Scholar]
14. X. Wang, L. Jiang and K. Chakrabarty, “LSTM-based analysis of temporally and spatially correlated signatures for intermittent fault detection,” IEEE VLSI Test Symposium, vol. 38, pp. 1–6, 2020. [Google Scholar]
15. M. Farhan, S. Jabbar, M. Aslam, A. Ahmad, M. M. Iqbal et al., “A real-time data mining approach for interaction analytics assessment: IoT based student interaction framework,” International Journal of Parallel Programming, vol. 46, no. 5, pp. 886–903, 2018. [Google Scholar]
16. M. Rao, Q. Li, D. Wei and M. J. Zuo, “A deep bi-directional long short-term memory model for automatic rotating speed extraction from raw vibration signals,” Measurement, vol. 158, no. 107719, pp. 1–12, 2020. [Google Scholar]
17. D. A. Adeyemo, “Moderating influence of emotional intelligence on the link between academic self-efficacy and achievement of university students,” Psychology and Developing Societies, vol. 19, no. 2, pp. 199–213, 2007. [Google Scholar]
18. D. R. Pillow, W. J. Hale, M. A. Crabtree and T. L. Hinojosa, “Exploring the relations between self-monitoring, authenticity, and well-being,” Personality and Individual Differences, vol. 116, no. 5, pp. 393–398, 2017. [Google Scholar]
19. P. J. Jordan, N. M. Ashkanasy, C. E. J. Härtel and G. S. Hooper, “Workgroup emotional intelligence: Scale development and relationship to team process effectiveness and goal focus,” Human Resource Management Review, vol. 12, no. 2, pp. 195–214, 2002. [Google Scholar]
20. B. Gawronski, G. V. Bodenhausen and A. P. Becker, “I like it, because I like myself: Associative self-anchoring and post-decisional change of implicit evaluations,” Journal of Experimental Social Psychology, vol. 16, no. 3, pp. 449–456, 2009. [Google Scholar]
21. J. D. Mayer and P. Salovey, “Emotional intelligence and the construction and regulation of feelings,” Applied and Preventive Psychology, vol. 4, no. 3, pp. 197–208, 1995. [Google Scholar]
22. B. J. Avolio, B. M. Bass and D. I. Jung, “Re-examining the components of transformational and transactional leadership using the multifactor leadership questionnaire,” Journal of Occupational and Organizational Psychology, vol. 72, no. 4, pp. 441–462, 1999. [Google Scholar]
23. B. Palmer, M. Walls, Z. Burgess and C. Stough, “Emotional intelligence and effective leadership,” Leadership & Organization Development Journal, vol. 22, no. 1, pp. 5–10, 2001. [Google Scholar]
24. B. R. B.-On, D. Ph, R. Cherry and R. B.-On, “Bar on emotional quotient inventory resource report,” Victoria, vol. 2011, no. 2, pp. 2–14, 2011. [Google Scholar]
25. J. Rowold, “Psychometric properties of the German translation by Jens Rowold,” Mind Garden, pp. 1–24, 2005. https://doi.org/10.1037/t03624-000. [Google Scholar]
26. D. R. Caruso, J. D. Mayer and P. Salovey, “Relation of an ability measure of emotional intelligence to personality,” Journal of Personality Assessment, vol. 79, no. 2, pp. 306–320, 2002. [Google Scholar]
27. N. Extremera, P. F.-Berrocal and P. Salovey, “Spanish version of the mayer-salovey-caruso emotional intelligence test (MSCEIT) version 2.0: Reliability, age, and gender differences,” Psicothema, vol. 18, no. 18, pp. 42–48, 2006. [Google Scholar]
28. S. Y. Kuo, Y. H. Chang, T. Y. Wang, H. H. Tseng, C. C. Huang et al., “Impairment in emotional intelligence may be mood-dependent in bipolar I and bipolar II disorders,” Frontiers in Psychiatry, vol. 12, pp. 134–142, 2021. [Google Scholar]
29. C. Prentice, S. D. Lopes and X. Wang, “Emotional intelligence or artificial intelligence-an employee perspective,” Journal of Hospitality Marketing & Management, vol. 29, no. 4, pp. 377–403, 2020. [Google Scholar]
30. J. Warwick and T. Nettelbeck, “Emotional intelligence is..?,” Personality and Individual Differences, vol. 37, no. 5, pp. 1091–1100, 2004. [Google Scholar]
31. M. Suresha, S. Kuppa and D. S. Raghukumar, “A study on deep learning spatiotemporal models and feature extraction techniques for video understanding,” International Journal of Multimedia Information Retrieval, vol. 9, no. 2, pp. 81–101, 2020. [Google Scholar]
32. A. Zadeh, M. Chan, P. P. Liang, E. Tong and L. P. Morency, “Social-IQ: A question answering benchmark for artificial social intelligence,” in Proc. of IEEE/CVF Conf. on Computer Vision and Pattern Recognition, Long Beach, CA, USA, vol. 2019, pp. 8799–8809, 2019. [Google Scholar]
33. A. Gullen and J. Plungis, “Statista,” The Charleston Advisor, vol. 15, no. 2, pp. 43–47, 2013. [Google Scholar]
34. M. E. David and J. A. Roberts, “Phubbed and alone: Phone snubbing, social exclusion, and attachment to social media,” Journal of the Association for Consumer Research, vol. 2, no. 2, pp. 155–163, 2017. [Google Scholar]
35. W. A. Suliman, “The relationship between learning styles, emotional social intelligence, and academic success of undergraduate nursing students,” Journal of Nursing Research, vol. 18, no. 2, pp. 136–143, 2010. [Google Scholar]
36. R. E. Boyatzis, D. Good and R. Massa, “Emotional, social, and cognitive intelligence and personality as predictors of sales leadership performance,” Journal of Leadership & Organizational Studies, vol. 19, no. 2, pp. 191–201, 2012. [Google Scholar]
37. W. Byeon, T. M. Breuel, F. Raue and M. Liwicki, “Scene labeling with LSTM recurrent neural networks,” in Proc. of IEEE/CVF Conf. on Computer Vision and Pattern Recognition, vol. 7, pp. 3547–3555, 2015. [Google Scholar]
38. S. Lim, S. H. Kim, Y. Kim, Y. S. Cho, T. Y. Kim et al., “Coefficient of variance as quality criterion for evaluation of advanced hepatic fibrosis using 2D shear-wave elastography,” Journal of Ultrasound in Medicine, vol. 37, no. 2, pp. 355–362, 2018. [Google Scholar]
39. Y. Yu and Y. J. Kim, “Attention-LSTM-attention model for speech emotion recognition and analysis of IEMOCAP database,” Electronics, vol. 9, no. 5, pp. 713, 2020. [Google Scholar]
40. M. Kozak and H. P. Piepho, “What’s normal anyway? Residual plots are more telling than significance tests when checking ANOVA assumptions,” Journal of Agronomy and Crop Science, vol. 204, no. 1, pp. 86–98, 2018. [Google Scholar]
41. M. Hazara, X. Li and V. Kyrki, “Active incremental learning of a contextual skill model,” in IEEE/RSJ Int. Conf. on Intelligent Robots and Systems, Macau, China, pp. 1834–1839, 2019. [Google Scholar]
42. P. M. Addo, D. Guegan and B. Hassani, “Credit risk analysis using machine and deep learning models,” Risks, vol. 6, no. 2, pp. 1–20, 2018. [Google Scholar]
43. R. B.-On, J. M. Brown, B. D. Kirkcaldy and E. P. Thomé, “Emotional expression and implications for occupational stress; An application of the emotional quotient inventory (EQ-i),” Personality and Individual Differences, vol. 28, no. 6, pp. 1107–1118, 2000. [Google Scholar]
44. C. Cherniss, M. Extein, D. Goleman and R. P. Weissberg, “Emotional intelligence: What does the research really indicate?,” Educational Psychologist, vol. 41, no. 4, pp. 239–245, 2006. [Google Scholar]
45. S. Côté, “Emotional intelligence in organizations,” Annual Review of Organizational Psychology and Organizational Behavior, vol. 1, no. 1, pp. 459–488, 2014. [Google Scholar]
46. H. K. Virk, “Impact of Emotional intelligence on job satisfaction, organizational commitment and perceived success,” International Journal of Arts & Sciences, vol. 4, no. 22, pp. 297–312, 2011. [Google Scholar]
47. V. Sharma, B. Nardi, J. Norton and A. M. Tsaasan, “Towards safe spaces online: A study of Indian matrimonial websites,” in 17th IFIP TC 13 International Conference, Paphos, Cyprus, vol. 11748, pp. 43–66, 2019. [Google Scholar]
Data Source1: https://www.eiconsortium.org
Data Source2: https://www.kaggle.com
 | This work is licensed under a Creative Commons Attribution 4.0 International License, which permits unrestricted use, distribution, and reproduction in any medium, provided the original work is properly cited. |