DOI:10.32604/cmc.2022.020074
| Computers, Materials & Continua DOI:10.32604/cmc.2022.020074 | |
| Article |
A Feature Selection Strategy to Optimize Retinal Vasculature Segmentation
1Electronic and Telecommunications Engineering Program, Universidad Autónoma del Caribe, Barranquilla, 080001, Colombia
2Department of Computational Science and Electronic, Universidad de la Costa, CUC, Barranquilla, 080001, Colombia
3Ophthalmology Service, Universitari Hospital Sant Joan, Institut de Investigacio Sanitaria Pere Virgili, Reus, 43201, Spain
4Departament d’Enginyeria Informàtica i Matemàtiques, Escola Tècnica Superior d’Enginyeria, Universitat Rovira i Virgili, Tarragona, 43007, Spain
*Corresponding Author: José Escorcia-Gutierrez. Email: jose.escorcia23@gmail.com
Received: 08 May 2021; Accepted: 24 June 2021
Abstract: Diabetic retinopathy (DR) is a complication of diabetes mellitus that appears in the retina. Clinitians use retina images to detect DR pathological signs related to the occlusion of tiny blood vessels. Such occlusion brings a degenerative cycle between the breaking off and the new generation of thinner and weaker blood vessels. This research aims to develop a suitable retinal vasculature segmentation method for improving retinal screening procedures by means of computer-aided diagnosis systems. The blood vessel segmentation methodology relies on an effective feature selection based on Sequential Forward Selection, using the error rate of a decision tree classifier in the evaluation function. Subsequently, the classification process is performed by three alternative approaches: artificial neural networks, decision trees and support vector machines. The proposed methodology is validated on three publicly accessible datasets and a private one provided by Hospital Sant Joan of Reus. In all cases we obtain an average accuracy above 96% with a sensitivity of 72% in the blood vessel segmentation process. Compared with the state-of-the-art, our approach achieves the same performance as other methods that need more computational power. Our method significantly reduces the number of features used in the segmentation process from 20 to 5 dimensions. The implementation of the three classifiers confirmed that the five selected features have a good effectiveness, independently of the classification algorithm.
Keywords: Diabetic retinopathy; artificial neural networks; decision trees; support vector machines; feature selection; retinal vasculature segmentation
Diabetes Mellitus is a chronic disease. People who suffer diabetes have high blood sugar levels, either due to insufficient insulin in the body or cells’ resistance to this hormone [1]. Diabetes can bring several complications because of the difficulty of maintaining blood pressure at normal levels. Some of the consequences are the increase of cholesterol levels, kidney failure, affectations in the nervous system, or even absolute blindness due to damage to the retinal vessels [2,3].
Diabetic Retinopathy (DR) occurs because a high blood sugar levels damages the retinal vessels [4]. DR causes lesions on the surface of the retina (i.e., microaneurysms, hemorrhages, and exudates). The microaneurysms are pathological signs that appear in the early phase of the disease. They are capillary dilatations produced by the local weakening of the vessels walls [5]. The injuries that appear after microaneurysms are caused by their explosion, known as hemorrhages. Moreover, vessels may start filtering lipids and proteins in addition to blood leakage, causing the appearance of bright spots, which are yellowish and white patches of different sizes, shapes, and locations (i.e., white exudates). In later stages, the yellow-white plasma begins to leak from the blood capillaries, generating hard exudates [6,7].
Blood vessels are responsible for transmitting signals between the retina and the brain [8,9]. Blood vessel features (i.e., length and width variations, tortuosity, and branching pattern) help to identify and diagnose many disorders (e.g., DR, hypertensive retinopathy, retinal artery occlusion) [7]. It is a widely user practice to examine eye fundus images to make diagnosis from the inspection of blood vessels. However, manual segmentation of retinal vessels is time-consuming and can rapidly cause visual fatigue. For assisting ophthalmologists with this complicated and tedious work, there is a demand of rapid and automated methods to analyze this kind of color eye fundus images [10].
There are several computer vision methods to segment blood vessels automatically. These techniques are divided into different categories such as: pattern recognition, supervised and unsupervised machine learning, mathematical morphology, model tracking, adaptive filtering, and multiscalar approaches [11]. However, there is still a place for improving the accuracy of the current methods. A crucial point to achieve the best image processing tool is the extraction of the best susbset of features from the input image, because many features increase the computational time but not the quality of the results. This paper presents an automatic and efficient segmentation method for blood vessels from eye fundus images. The main contribution of this paper is a method for finding the smallest subset of features to obtain the best results in the segmentation task.
This paper is organized as follows. In Section 2 we expose the contributions of this research. The related work is reviewed in Section 3. Section 4 describes the proposed approach widely. Section 5 presents the used datasets and performance measures. Section 6 reports the main results, comparisons, statistical validations, and discussion. Finally, conclusions and future research lines are listed in Section 7.
In this work, we propose an automatic vasculature segmentation based on five components: pre-processing, feature extraction, discriminative feature selection, supervised classification, and post-processing. The main contributions are:
1. The pre-processing stage enhances the blood vessels through a combination of filters, morphological operations, and Contrast Limited Adaptive Histogram Equalization (CLAHE).
2. The feature extraction computes a wide variety of characteristics to cover the entire feature space and explore diverse segmentation approaches.
3. The effective feature selection stage guarantees discriminative features in the classification stage. The computational power and resources are drastically reduced using only the optimal characteristics, which consequently increase the overall performance.
4. Three different supervised classifiers are employed to prove the quality of the selected features: Artificial Neural Networks (ANN), Decision Trees (DT) and Support Vector Machines (SVM).
5. Four datasets are used to assess our methodology. An ANOVA test is also performed to know statistically the improvement of the method presented in relation to the state-of-the-art.
Comprehensive reviews of blood vessel segmentation techniques in retinal images were presented by Imran et al. [12] and Fraz et al. [13]. From these reviews and some recent publications, we can observe that some researchers propose supervised methodologies based on a feature extraction, followed by a classifier. For example, Marín et al. [14] implemented a feature vector with gray-level and Hu moment invariant characteristics and an ANN classifier. This method achieved an accuracy of 94.5% using the DRIVE dataset. Similarly, Adapa et al. [15] used ANNs fed with an input vector based on Zernike moments. They obtained an overall accuracy of 94.5%. Although this approach was simpler than Marín et al. [14], the number of parameters and their combination to reach the best performance was extremely challenging. The feature vector extracted by Sathananthavathi et al. [16] was 40D and used the BAT algorithm and random forest to select and classify the optimal 18 features. The final accuracy was 95.3% for the DRIVE dataset. Despite the acceptable accuracy of these methods, the computational resources needed were high as the feature vector was large. Moreover, Kumar et al. [17] applied 2D matched filters to detect vessels enhanced by the CLAHE method. The accuracy reached was 96.2% for the DRIVE dataset. However, the inherent pathologies leaded to miss-classified blood vessels.
Another approach is based on Deep learning architectures, which have been successfully employed for vasculature segmentation with impressive performances by Mansour [18]. Soomro et al. [19] proposed a strided fully CNN for retinal vessel delineation. The synthetic training data was generated through a Principal Component Analysis. This algorithm was assessed on DRIVE, STARE, and HRF datasets, obtaining an overall accuracy of 95.6%, 95.4%, and 96.2%, respectively. In this line, Luo et al. [20] presented a modified U-Net to train a semantic blood vessel segmentation model. Then, a conditional random field integrated the global information. This model produced an average accuracy of 86.5% for the DRIVE dataset. These methods allowed the diagnosis of early pathologies using only the vessels’ state.
The introduction of these automatic methods into daily clinical practice is still challenging due to the required accuracy, the limited computational resources, the processing speed, the image resolution, and the usability [21]. These shortcomings motivated this work to make a new design based on simple and effective processing algorithms and selecting a reduced number of optimal features. We decrease the computational cost and memory resources, while trying to keep the good performance results of the related works.
The main challenge associated with retinal vessel segmentation is the false positives detection due to DR lesions (i.e., hemorrhages, microaneurysms, and exudates). The supervised methods used so far require highly discriminative features to reach an accurate delineation of vessels. It is required to find the optimal features in order to speed up the computation and reduce the resources. In this line, the methodology we propose includes a feature selection phase that relies on the Sequential Forward Selection (SFS) algorithm that is widely applied for its simplicity and speed [22,23], with a fitness function based on a Decision Tree (DT) classifier. After the feature selection process, three different classifiers (i.e., ANN, DT, and SVM) are implemented to demonstrate the discriminative power of the selected features. In the end, the best classifier will be selected according to the results obtained in different datasets.
Fig. 1 shows in more detail the first stage of our methodology: feature selection. It has the following steps: 1. image pre-processing to enhance the ocular vasculature, 2. feature extraction for numerical representation, and 3. effective feature selection based on the SFS algorithm. The second stage can be seen in Fig. 2. It is devoted to BV segmentation, with steps: 1) image pre-processing, 2) extraction of the selected features, 3) classification using three different algorithms to label the pixels as vessel or non-vessel, and 4) post-processing to fill holes in detected vessels and remove false positive (isolated) pixels.

Figure 1: Flowchart for selecting discriminative features for blood vessel classification

Figure 2: Flowchart for segmenting the blood vessels from color fundus images (application stage)
We start adjusting the image intensity to increase the contrast between both blood vessel and background pixels. Next, images may be resized. In our case, we work with 4 different datasets (3 of them are public and 1 is private from a local hospital). Images from the DRIVE and STARE datasets are resized to 540 pixels, and images from the Messidor and Sant Joan de Reus datasets are resized to 960 pixels. Afterward, the intensity channel from the HSI color space is selected to highlight the blood vessels.
The retinal blood vessels have a lower reflectance, and they appear to be darker than the background. Some vessels include a light line in the center, which precludes the segmentation. Thus, the images are filtered by applying an opening operation of three pixels in diameter to eliminate the brightest lines, using the disc as a structuring element. Additionally, uneven illumination on retinal images affects the background intensity, making vessels not distinguishable. To solve that issue, we propose to employ a
Regarding the process of acquiring fundus images, various lighting conditions trigger differences in the intensity of the background that are minimized by homogenizing the color information represented in

Figure 3: Pre-processing of an image from Messidor, STARE, DRIVE and Sant Joan datasets
This stage finds the best set of numerical features representing a pixel’s characteristics, focusing on those that enable the distinction between blood vessels and background. Several studies [16,22] have demonstrated that an appropriate selection of features can improve the classification process performance.
In this work, we take a set of 20 features that are used in the literature. In particular, we consider five features that represent the gray level of the pixel, seven features about moment invariants, and eight features about Gabor transform responses over different angles [25].
These features are based on the gray-level intensity and its distribution regarding neighborhood pixels. These features statistically describe the intensity variations, so they could be appropriate to distinguish the blood vessels as they have different intensity of color concerning the background of the eye fundus. A set of gray-level-based descriptors were derived from the homogenized images
4.2.2 Moment Invariants Features
These features are determined by moment invariants, which define small regions in a window centralized in the pixel of interest. They are relevant because the blood vessels in retinal images exhibit variations in shape, size, and geometrical structure. We used some shape descriptors invariant to translation, rotation, and scale to detect these shapes, which are different in shape and angle. The descriptors are known as Hu moments [14,26] and Zernike moments [15], and have effectively been used for representing shape features in other works. In this paper, we have taken the Hu moments, which are described below. From the vessel-enhanced image
where summations are over the values of the spatial coordinates
The corresponding central moment is defined in Eq. (8), where
where
The normalized central moment of order
where
A set of seven-moment invariants in Eqs. (10)–(16) represent undersize, translation, and rotation, can be derived from combinations of regular moments. They are known as Hu moment invariants.
In this study, the logarithm transformation (Eq. (17)) is applied to the absolute value of the Hu moments in order to equalize the moments’ orders magnitudes. The transformed values are included in the feature vector of a pixel located at
4.2.3 Gabor Filter Response Features
The 2D linear Gabor filter is the modulation of the Gaussian kernel function by a sinusoidal plane wave and can be used for edge detection [25]. In the spatial domain, this filter is calculated as the product of Gaussian and an exponential function as given by Eq. (18), where
The parameter
4.3 Effective Feature Selection
After collecting all the 20 different features
The discriminative features for vessel segmentation may be found using the SFS algorithm. It is a search algorithm that starts from an empty set and gradually adds features selected by an evaluation function. The method pursues to minimize a goal evaluation function over all possible feature subsets. In our case, this function is the error rate in the blood vessel classification task. Therefore, the classifier needs the ground truth to compare the results and obtain this indicator.
We selected the Decision Trees method to classify the pixels in the SFS algorithm. This classifier has a small memory usage and makes a fast and accurate prediction. A DT is a greedy non-parametric supervised learning method that build a decision tree, where each branch establishes conditions for belonging to one of the classes [27,28]. Decision trees require training data, test data, a heuristic evaluation function, and a stopping criterion function. The partition of the training and test data was made with the hold-out validation, using 70% for training and 30% for testing. The optimization criterion for classification was the Gini’s diversity index. The stopping rules are: 1) the node contains only samples of one class, 2) there are less samples than the threshold defined, 3) any split produces fewer than the number of leaf node samples defined, and 4) there are no more attributes available.
Using SFS, we found that only 5 of the 20 features are needed to make an appropriate segmentation of blood vessels in retinal images. These discriminant features are
Implementing the SFS algorithm in the features selection process minimizes the misclassification rate using a reduced feature vector, which guarantees high performance in the blood vessel segmentation. The obvious computational cost savings can be significant as we reduce the number of features from 20 to 5.
The classification stage assigns a label to each pixel, indicating if it corresponds to a vessel or a non-vessel. Thus, it corresponds to a binary classification problem. To validate the performance of the subset of 5 discriminant features identified in the previous stage, we have used three different supervised classifiers: ANN (artificial neural networks), DT (decision trees), and SVM (support vector machines). In that way, we want to prove the effectiveness of the five selected features independently of the classification algorithm.
The DT classifier assigns a class following a set of rules that are constructed from a tree structure, as explained before. Each node contains a feature, and the branches departing from a node correspond to the different possible values of that feature [29]. In our experiments, the DT has been trained using the pixels of two complete images randomly selected from the DRIVE dataset. The DT construction was made with a minimum number of leaf node observations of 300 and using a cross-validation process.
In ANN-based classifiers, the performance is highly influenced by the amount of training data. If data is scarce, the network will not generalize well. However, a large number of samples requires more computational time and resources. On our experiments, we randomly selected 10% of the total number of the DRIVE images pixels, fairly divided into the vessel and non-vessel pixels to train the ANN architecture, which is used in all datasets. This amount was enough to obtain the required performance. The 70% of pixels are employed in the training process, and the rest (30%) for validation, maintaining a constant ratio between the two classes. The ANN input layer has the same number of neurons as the feature vector. Several topologies were tested empirically for the hidden layers. Finally, we set three hidden layers with 15 neurons in each layer, similar to the multi-layer feed-forward network in [14]. The output layer comprises only one neuron associated with a non-linear logistic sigmoid activation function.
SVM classifier is another supervised approach used in the blood vessel segmentation task. An SVM classifier finds the best hyperplane to separate the data points from two different classes. The best hyperplane for an SVM has the most significant margin between the two classes. The data points that are closest to this hyperplane are the support vectors. A drawback of SVM is that it is memory-intensive in the training process, as it works in the dual space. The algorithm needs to store a
We consider the premise that pixels belonging to a vessel must have neighbor pixels belonging to vessels, as well. Then, in the first step of our post-processing, we want to fill pixel gaps (holes) in the detected blood vessels (i.e., false negatives). The second stage subsequently removes pixels classified as vessels, but which are isolated (i.e., false positives). Pixels of the vessel class may have neighbor pixels marked as non-vessel. This problem is corrected with an iterative fill operation, considering that pixels with at least six neighbors classified as vessel points must also be vessel pixels. The small-isolated regions, misclassified as blood vessels, are removed.
To evaluate the proposed method, we used three publicly available datasets and one in-house dataset. The DRIVE dataset [30] has 40 color fundus images at 768 × 584 pixels. The STARE dataset [31] has 20 retinal images at 700 × 605 pixels. The Messidor [32] dataset contains 1200 color fundus images at 1440 × 960, 2240 × 1488, and 2304 × 1536 pixels. The local database of the Hospital Sant Joan de Reus consists of 800 RGB color images, 500 of which at 2040 × 1488 pixels, and the remaining 300 at 3008 × 2000.
This section presents some examples of segmented images and quantitative results obtained with various performance measures. Then, a comparison with other state-of-the-art works is made using statistical tests.
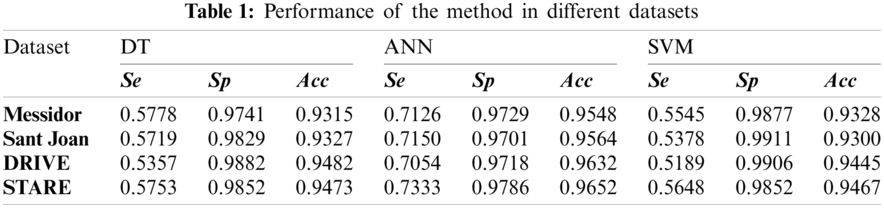
An example of segmented images is given in Fig. 4 that shows the phases of our segmentation pipeline. A random sample was picked for each dataset (e.g., Messidor, Sant Joan, DRIVE and STARE). The numerical quality indicators for DRIVE and STARE datasets are presented in Tab. 1.

Figure 4: Results from Messidor, STARE, DRIVE and our in-house (i.e., Sant Joan) datasets
To statistically compare the performance obtained from three different classifiers for all datasets, we computed an ANOVA test. The pattern of differences of means between them was analyzed with a post-hoc test). Specifically, the Games–Howell Post-Hoc test is a non-parametric method to contrast combinations of groups. It does not presume equal variances and sample sizes. In Tab. 2, from the Games-Howell test output we selected the optimal classifier for each indicator and dataset, considering the
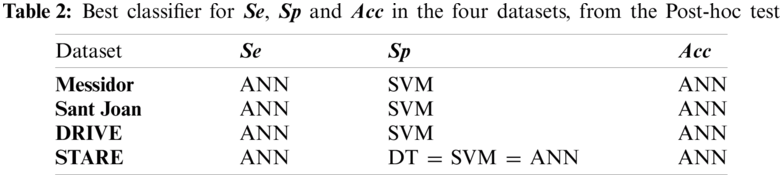
Tabs. 1 and 2 indicate good segmentation performances for all classifiers using our effective 5-dim feature vector selected by the SFS algorithm. Nevertheless, the ANN architecture achieved the highest
5.2 State-of-the-Art Comparison
A robust comparison with past/current works has been done through extensive ANOVA testing for both DRIVE and STARE datasets, considering the performances published in the papers. No results have been published yet with Messidor and Sant Joan de Reus datasets to the best of our knowledge. This statistical analysis uses variances to determine if the mean between two segmentation approaches is different or not [33]. Tab. 3 shows the
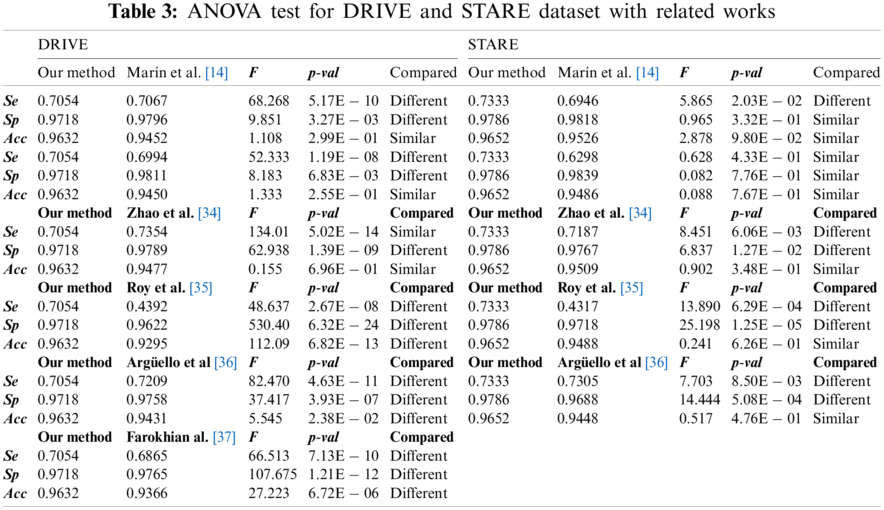
For the DRIVE and STARE dataset, we obtained a higher

Our method performed slightly worse than other complex classifiers such as convolutional neural networks. However, these methodologies require extensive training datasets, and the available datasets contain a small number of annotated images, having a high risk of overfitting [37]. Additionally, they spend large computational resources in the training process. Furthermore, our work was validated with four datasets, including images with different resolutions and constraints, unlike other proposals validated only with DRIVE and STARE datasets.
Similar methodologies such as Marín et al. [14], Adapa et al. [15], and Thangaraj et al. [25] also used ANNs and feature extraction techniques. They obtained very similar

In summary, in this work, we developed a vasculature segmentation methodology for retinal color fundus images. Firstly, morphological operations, bank filters, and the CLAHE algorithm were used to enhance blood vessels and remove artifacts and lighting effects. The feature extraction procedure computed an initial 20-dim vector build upon gray-level, moment invariant and Gabor features. A feature selection based on the SFS algorithm and DT classifier was added to uncover the most discriminative features. The input vector to the classifiers was efficiently reduced from 20 to 5 dimensions. Post-processing was finally designed with morphological operations to fill holes in detected vessels and eliminate isolated pixels. Our methodology was evaluated on three publicly accessible datasets (i.e., Messidor, DRIVE, and STARE) and one private dataset provided by Hospital Universitari Sant Joan de Reus (in Catalonia, Spain).
The overall performance was evaluated using sensitivity (
Acknowledgement: The first author has been endorsed by Fundación Carolina with a predoctoral grant. The Ministry of Science, Technology, and Innovation of Colombia supported the fourth author’s research training process as a young researcher and innovator.
Funding Statement: This work has been funded by the research project PI18/00169 from Instituto de Salud Carlos III & FEDER funds. University Rovira i. Virgili also provided funds with Project 2019PFR-B2-61.
Conflicts of Interest: The authors declare no conflicts of interest to report regarding the present study.
1. J. M. Baena-Díez, J. Peñafiel, I. Subirana, R. Ramos, R. Elosua et al., “Risk of cause-specific death in individuals with diabetes: A competing risks analysis,” Diabetes Care, vol. 39, no. 11, pp. 1987–1995, 2016. [Google Scholar]
2. R. F. Mansour, “Evolutionary computing enriched computer-aided diagnosis system for diabetic retinopathy: A survey,” IEEE Reviews in Biomedical Engineering, vol. 10, pp. 334–349, 2017. [Google Scholar]
3. D. Mauricio, N. Alonso and M. Gratacòs, “Chronic diabetes complications: The need to move beyond classical concepts,” Trends in Endocrinology and Metabolism, vol. 31, no. 4, pp. 287–295, 2020. [Google Scholar]
4. M. M. Nentwich and M. W. Ulbig, “Diabetic retinopathy-ocular complications of diabetes mellitus,” World Journal of Diabetes, vol. 6, no. 3, pp. 489–499, 2015. [Google Scholar]
5. S. R. Flaxman, R. Bourne, S. Resnikoff, P. Ackland, T. Braithwaite et al., “Global causes of blindness and distance vision impairment 1990–2020: A systematic review and meta-analysis,” The Lancet Global Health, vol. 5, no. 12, pp. e1221–e1234, 2017. [Google Scholar]
6. S. S. Rahim, V. Palade, J. Shuttleworth and C. Jayne, “Automatic screening and classification of diabetic retinopathy fundus images,” in 15th Int. Conf. on Engineering Applications of Neural Networks, Sofia, Bulgaria, pp. 113–122, 2014. [Google Scholar]
7. P. Romero-Aroca, S. de la Riva-Fernandez, A. Valls-Mateu, R. Sagarra-Alamo, A. Moreno-Ribas et al., “Cost of diabetic retinopathy and macular oedema in a population, an eight year follow up,” BMC Ophthalmology, vol. 16, no. 1, pp. 1–7, 2016. [Google Scholar]
8. A. Osareh, B. Shadgar and R. Markham, “A computational-intelligence-based approach for detection of exudates in diabetic retinopathy images,” IEEE Transactions on Information Technology in Biomedicine, vol. 13, no. 4, pp. 535–545, 2009. [Google Scholar]
9. R. Geetha Ramani and L. Balasubramanian, “Retinal blood vessel segmentation employing image processing and data mining techniques for computerized retinal image analysis,” Biocybernetics and Biomedical Engineering, vol. 36, no. 1, pp. 102–118, 2016. [Google Scholar]
10. S. W. Franklin and S. E. Rajan, “Computerized screening of diabetic retinopathy employing blood vessel segmentation in retinal images,” Biocybernetics and Biomedical Engineering, vol. 34, no. 2, pp. 117–124, 2014. [Google Scholar]
11. S. Moccia, E. De Momi, S. El Hadji and L. S. Mattos, “Blood vessel segmentation algorithms—review of methods, datasets and evaluation metrics,” Computer Methods and Programs in Biomedicine, vol. 158, no. 6801, pp. 71–91, 2018. [Google Scholar]
12. A. Imran, J. Li, Y. Pei, J. J. Yang and Q. Wang, “Comparative analysis of vessel segmentation techniques in retinal images,” IEEE Access, vol. 7, pp. 114862–114887, 2019. [Google Scholar]
13. M. M. Fraz, P. Remagnino, A. Hoppe, B. Uyyanonvara, A. R. Rudnicka et al., “Blood vessel segmentation methodologies in retinal images–a survey,” Computer Methods and Programs in Biomedicine, vol. 108, no. 1, pp. 407–433, 2012. [Google Scholar]
14. D. Marín, A. Aquino, M. E. Gegundez-Arias and J. M. Bravo, “A new supervised method for blood vessel segmentation in retinal images by using gray-level and moment invariants-based features,” IEEE Transactions on Medical Imaging, vol. 30, no. 1, pp. 146–158, 2011. [Google Scholar]
15. D. Adapa, A. N. Joseph Raj, S. N. Alisetti, Z. Zhuang, G. Kaliyaperumal et al., “A supervised blood vessel segmentation technique for digital Fundus images using Zernike moment based features,” PLOS ONE, vol. 15, no. 3, pp. 1–23, 2020. [Google Scholar]
16. V. Sathananthavathi and G. Indumathi, “BAT algorithm inspired retinal blood vessel segmentation,” IET Image Processing, vol. 12, no. 11, pp. 2075–2083, 2018. [Google Scholar]
17. D. Kumar, A. Pramanik, S. S. Kar and S. P. Maity, “Retinal blood vessel segmentation using matched filter and Laplacian of Gaussian,” in 2016 Int. Conf. on Signal Processing and Communications, Bangalore, India, pp. 1–5, 2016. [Google Scholar]
18. R. F. Mansour, “Deep-learning-based automatic computer-aided diagnosis system for diabetic retinopathy,” Biomedical Engineering Letters, vol. 8, no. 1, pp. 41–57, 2018. [Google Scholar]
19. T. A. Soomro, A. J. Afifi, J. Gao, O. Hellwich, L. Zheng et al., “Strided fully convolutional neural network for boosting the sensitivity of retinal blood vessels segmentation,” Expert Systems with Applications, vol. 134, no. 9, pp. 36–52, 2019. [Google Scholar]
20. L. Luo, D. Chen and D. Xue, “Retinal blood vessels semantic segmentation method based on modified U-Net,” in 2018 Chinese Control And Decision Conf., Shenyang, China, pp. 1892–1895, 2018. [Google Scholar]
21. R. F. Mansour, A. El Amraoui, I. Nouaouri, V. G. Diaz, D. Gupta et al., “Artificial intelligence and internet of things enabled disease diagnosis model for smart healthcare systems,” IEEE Access, vol. 9, pp. 45137–45146, 2021. [Google Scholar]
22. A. H. Asad and A. E. Hassaanien, “Retinal blood vessels segmentation based on bio-inspired algorithm,” in Applications of Intelligent Optimization in Biology and Medicine, 1st ed., vol. 96. Canberra, Australia: Springer International Publishing, pp. 181–215, 2016. [Google Scholar]
23. N. Theera-Umpon, I. Poonkasem, S. Auephanwiriyakul and D. Patikulsila, “Hard exudate detection in retinal fundus images using supervised learning,” Neural Computing and Applications, vol. 32, pp. 1–18, 2019. [Google Scholar]
24. S. M. Pizer, E. Philip Amburn, J. D. Austin, C. R., A. Geselowitz et al., “Adaptive histogram equalization and its variations,” Computer Vision Graphics and Image Processesing, vol. 39, no. 3, pp. 355–368, 1987. [Google Scholar]
25. S. Thangaraj, V. Periyasamy and R. Balaji, “Retinal vessel segmentation using neural network,” IET Image Processing, vol. 12, no. 5, pp. 669–678, 2018. [Google Scholar]
26. M. K. Hu, “Visual pattern recognition by moment invariants,” IEEE Transactions on Information Theory, vol. 8, no. 2, pp. 179–187, 1962. [Google Scholar]
27. W. A. Mustafa, H. Yazid and W. Kamaruddin, “Combination of gray-level and moment invariant for automatic blood vessel detection on retinal image,” Journal of Biomimetics, Biomaterials and Biomedical Engineering, vol. 34, pp. 10–19, 2017. [Google Scholar]
28. S. Pathan, P. Kumar, R. Pai and S. V. Bhandary, “Automated detection of optic disc contours in fundus images using decision tree classifier,” Biocybernetics and Biomedical Engineering, vol. 40, no. 1, pp. 52–64, 2020. [Google Scholar]
29. E. De-La-Hoz-Correa, F. Mendoza-Palechor, A. De-La-Hoz-Manotas, R. Morales-Ortega and B. Sanchez, “Obesity level estimation software based on decision trees,” Journal of Computer Science, vol. 15, no. 1, pp. 67–77, 2019. [Google Scholar]
30. J. Staal, M. D. Abràmoff, M. Niemeijer, M. A. Viergever and B. Van Ginneken, “Ridge-based vessel segmentation in color images of the retina,” IEEE Transaction on Medical Imaging, vol. 23, no. 4, pp. 501–509, 2004. [Google Scholar]
31. A. D. Hoover, V. Kouznetsova and M. Goldbaum, “Locating blood vessels in retinal images by piecewise threshold probing of a matched filter response,” IEEE Transaction on Medical Imaging, vol. 19, no. 3, pp. 203–210, 2000. [Google Scholar]
32. E. Decencière, X. Zhang, G. Cazuguel, B. Lay, B. Cochener et al., “Feedback on a publicly distributed image database: The Messidor database,” Image Analysis & Stereology, vol. 33, no. 3, pp. 231–234, 2014. [Google Scholar]
33. S. Deladreue, F. Brouaye, P. Bastard, L. Pcligry and A. U. Modeling, “Application of ANOVA methodology to the uncertainties management in power system planning in an open market environment,” in 2001 IEEE Porto Power Tech Proc. (Cat No.01EX502Porto, Portugal, pp. 7–10, 2001. [Google Scholar]
34. Y. Q. Zhao, X. H. Wang, X. F. Wang and F. Y. Shih, “Retinal vessels segmentation based on level set and region growing,” Pattern Recognition, vol. 47, no. 7, pp. 2437–2446, 2014. [Google Scholar]
35. S. Roy, A. Mitra, S. Roy and S. K. Setua, “Blood vessel segmentation of retinal image using Clifford matched filter and Clifford convolution,” Multimedia Tools Applications, vol. 78, no. 24, pp. 34839–34865, 2019. [Google Scholar]
36. F. Argüello, D. L. Vilariño, D. B. Heras and A. Nieto, “GPU-based segmentation of retinal blood vessels,” Journal of Real-Time Image Processing, vol. 14, no. 4, pp. 773–782, 2018. [Google Scholar]
37. F. Farokhian, C. Yang, H. Demirel, S. Wu and I. Beheshti, “Automatic parameters selection of gabor filters with the imperialism competitive algorithm with application to retinal vessel segmentation,” Biocybernetics and Biomedical Engineering, vol. 37, no. 1, pp. 246–254, 2017. [Google Scholar]
38. E. Deepika and S. Maheswari, “Earlier glaucoma detection using blood vessel segmentation and classification,” in 2018 2nd Int. Conf. on Inventive Systems and Control, Coimbatore, India, pp. 484–490, 2018. [Google Scholar]
39. X. Ren, Y. Zheng, Y. Zhao, C. Luo, H. Wang et al., “Drusen segmentation from retinal images via supervised feature learning,” IEEE Access, vol. 6, pp. 2952–2961, 2018. [Google Scholar]
40. P. T. Karule and S. Joshi, “Blood vessels segmentation using thresholding approach for fundus image analysis,” in 2017 Int. Conf. on Intelligent Computing and Control, Coimbatore, India, pp. 1–5, 2017. [Google Scholar]
41. J. Dash and N. Bhoi, “An unsupervised approach for extraction of blood vessels from fundus images,” Journal of Digital Imaging, vol. 31, no. 6, pp. 857–868, 2018. [Google Scholar]
42. Z. Jiang, J. Yepez, S. An and S. Ko, “Fast, accurate and robust retinal vessel segmentation system,” Biocybernetics and Biomedical Engineering, vol. 37, no. 3, pp. 412–421, 2017. [Google Scholar]
43. S. Roychowdhury, D. D. Koozekanani and K. K. Parhi, “Iterative vessel segmentation of fundus images,” IEEE Transaction on Biomedical Engineering, vol. 62, no. 7, pp. 1738–1749, 2015. [Google Scholar]
44. V. R. P. Borges, D. J. dos Santos, B. Popovic and D. F. Cordeiro, “Segmentation of blood vessels in retinal images based on nonlinear filtering,” in 2015 IEEE 28th Int. Symp. on Computer-Based Medical Systems, Sao Carlos, Brazil, pp. 95–96, 2015. [Google Scholar]
45. E. Imani, M. Javidi and H.-R. Pourreza, “Improvement of retinal blood vessel detection using morphological component analysis,” Computer Methods and Programs in Biomedicine, vol. 118, no. 3, pp. 263–279, 2015. [Google Scholar]
46. S. Pachade, P. Porwal, M. Kokare, L. Giancardo and F. Meriaudeau, “Retinal vasculature segmentation and measurement framework for color fundus and SLO images,” Biocybernetics and Biomedical Engineering, vol. 40, no. 3, pp. 865–900, 2020. [Google Scholar]
47. R. Hemelings, B. Elen, I. Stalmans, K. Van Keer, P. De Boever et al., “Artery-vein segmentation in fundus images using a fully convolutional network,” Computerized Medical Imaging and Graphics, vol. 76, pp. 101636, 2019. [Google Scholar]
48. C. Tian, T. Fang, Y. Fan and W. Wu, “Multi-path convolutional neural network in fundus segmentation of blood vessels,” Biocybernetics and Biomedical Engineering, vol. 40, no. 2, pp. 583–595, 2020. [Google Scholar]
49. P. Liskowski and K. Krawiec, “Segmenting retinal blood vessels with deep neural networks,” IEEE Transaction on Medical Imaging, vol. 35, no. 11, pp. 2369–2380, 2016. [Google Scholar]
 | This work is licensed under a Creative Commons Attribution 4.0 International License, which permits unrestricted use, distribution, and reproduction in any medium, provided the original work is properly cited. |