DOI:10.32604/cmc.2022.020065
| Computers, Materials & Continua DOI:10.32604/cmc.2022.020065 | |
| Article |
Age-Based Automatic Voice Conversion Using Blood Relation for Voice Impaired
1Department of Electronics & Communication Engineering, Amrita School of Engineering, Bengaluru, Amrita Vishwa Vidyapeetham, India
2Center for Computational Engineering and Networking (CEN), Amrita School of Engineering, Coimbatore, Amrita Vishwa Vidyapeetham, India
3Department of Software Engineering, College of Computer and Information Sciences, King Saud University, Riyadh, Saudi Arabia
4Department of Electronics and Communication Engineering, PES University, Bengaluru, India
*Corresponding Author: Sadeen Alharbi. Email: sadalharbi@ksu.edu.sa
Received: 07 May 2021; Accepted: 16 July 2021
Abstract: The present work presents a statistical method to translate human voices across age groups, based on commonalities in voices of blood relations. The age-translated voices have been naturalized extracting the blood relation features e.g., pitch, duration, energy, using Mel Frequency Cepstrum Coefficients (MFCC), for social compatibility of the voice-impaired. The system has been demonstrated using standard English and an Indian language. The voice samples for resynthesis were derived from 12 families, with member ages ranging from 8–80 years. The voice-age translation, performed using the Pitch synchronous overlap and add (PSOLA) approach, by modulation of extracted voice features, was validated by perception test. The translated and resynthesized voices were correlated using Linde, Buzo, Gray (LBG), and Kekre’s Fast Codebook generation (KFCG) algorithms. For translated voice targets, a strong (θ >~93% and θ >~96%) correlation was found with blood relatives, whereas, a weak (θ <~78% and θ <~80%) correlation range was found between different families and different gender from same families. The study further subcategorized the sampling and synthesis of the voices into similar or dissimilar gender groups, using a support vector machine (SVM) choosing between available voice samples. Finally, ~96%, ~93%, and ~94% accuracies were obtained in the identification of the gender of the voice sample, the age group samples, and the correlation between the original and converted voice samples, respectively. The results obtained were close to the natural voice sample features and are envisaged to facilitate a near-natural voice for speech-impaired easily.
Keywords: Blood relations; KFCG; LBG; MFCC; vector quantization; correlation; speech samples; same-gender; dissimilar gender; voice conversion; PSOLA; SVM
Speech is important for communicating information easily for social participation, education, and employment, etc. However, an estimated ~5%–11% of people have speech disorders and cannot rely on natural speech for communication [1–4]. Speech disorders are a type of communication disorder where “normal” speech is interrupted. The usual causes of speech disorders are vocal cord paralysis, vocal cord damage, articulation disorders, phonological disorders, disfluency, accidents, being without speech from birth, brain damage, neural disorder, salinity, muscle weakness, and respiratory weakness [5]. Off late, algorithms have been developed to facilitate straightforward communication through synthesized speech for those with total or partial loss of speech. They include electrolarynx [6], sign to speech converter [7], text to speech synthesis [8], silent sound technology [9], vocal cord vibration switches [10], articulatory speech synthesizers [11], brain implants [12], breath to speech [13], and, tongue articulatory systems [14]. They are based on inputs captured through hand gestures, text data, lip movements, vocalizations, visual features, brain signals, exhales, and tongue movements respectively. Such models can be useful to interpret speech for tracheostomized patients who have undergone larynx surgery, those who are speech-disabled due to accidents or voice disorders, medical rehabilitation, and robotics [6–14]. However, such techniques are used to synthesize the speech, whose voice is chosen either of google voice or robotic voice or a universal or generated voice database, where the speaker does not sound natural.
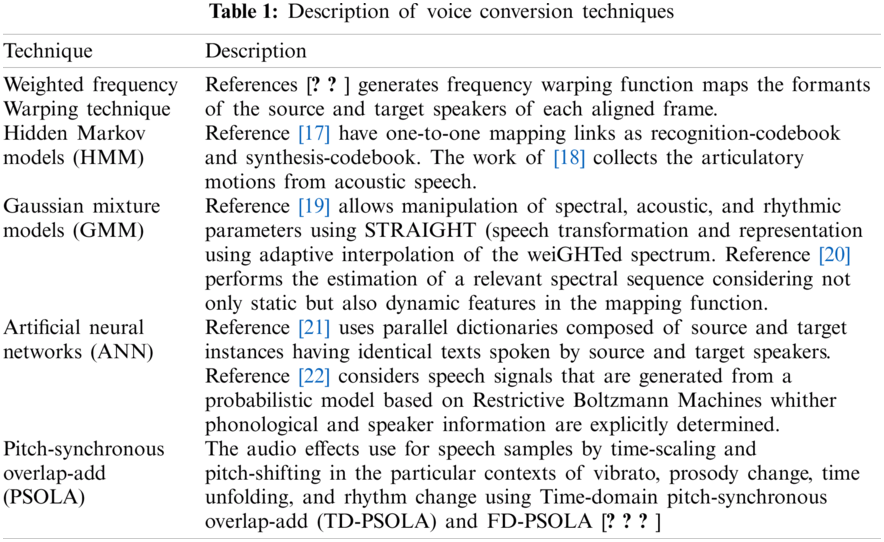
The motivation for the current work is to generate a near-natural voice for a voice-impaired target, from a voice sample drawn from within family relation preferably, irrespective of age, with an age conversion feature in place. The importance of the present work is that (a) age-conversion of voice samples to suit a target’s voice and, (b) whether the choice of voice sample should be from within family blood relations, or anywhere else, have been established. Prior studies in literature fall into two categories towards our present work motivation i.e., voice conversion techniques, mainly for gender conversion, which is frequency translation in effect [15–25] and about finding similarities between same accent voices [26–34] to achieve natural of speech or voice using various techniques, while the present work investigates family relation as a big factor to include natural features in voices.
A voice conversion system should be able to identify the characteristics of an individual’s speech (source speaker) and substitute them for those of another speaker (the target speaker) with reasonable loss of information or modification in the transferred message. A comprehensive state-of-the-art about these different techniques to generate voice conversion is listed in Tab. 1. These approaches have helped to raise the human-machine interface to a high degree of authentication [15–25]. To date, most of the tools and techniques described in Tab. 1, have been used for voice identification by comparison [26–33], and not age translation of voice, as presented in the current work.
Other studies finding similarities between voices have examined and tested voice samples of the candidates and ensured the accent, inflection, pitch, tone, and speed of the speech used for comparison [26]. Some work has been reported [27–29] to address issues like the confusion of voices on the telephone. Studies of voice pairs like father and son or twins [30] revealed that the first harmonic of the voice signals, “f0,” [31], showed some correlation in the pairs, with conformational [32,33]. The present author and the group have previously reported a preliminary work on the correlation of voices based on features availability use to blood relations [34], which shows the closeness of formants in voices of relatives, towards the natural voice.
To summarize, voice conversion technologies have been used only for voice-gender conversion and age classification, and not age conversion of voice. However, the computation time is high and the quality of the synthetic speech has generally been less satisfactory in GMM and ANN when compared with those systems based on PSOLA [22,25]. Thus, we have considered PSOLA for our objective to perform voice conversion. After the review of the literature and to the best of our knowledge, there are no existing systems to establish voice conversion that adopts features of speech to make the synthesized voices sound more realistic and natural.
Thus, the major aims were to (a) choose and identify the best-suited voice for a target who is voice-impaired; and, (b) translate the age of source voice to target age, by manipulating the speech features, using Vector Quantization (VQ) algorithms of LBG and KFCG [35–38] for feature extraction and correlation, and PSOLA for voice feature manipulation. In all, each target patient would be able to get an individual voice database, preferably derived from a relative for naturalness, with voice quality matched to the target’s age.
Finally, the major contributions of the work presented in subsequent sections are as follows.
• The study concentrates on creating a corpus of English and one Indian language collected from members of 12 families that range in age from 8 to 80 years old.
• Abilities of PSOLA have been used to manipulate voice sample features (obtained from male/female sources) and used for age-translation for target patients (child, young, adult, senior as appropriate) with loss of voice.
• The experimental study defines the formats of the original voice samples (from the blood relatives) and the resynthesized voice samples and finds the correlation (θ) between the resynthesized voice samples and the original voice samples using the LBG and KFCG algorithms. The results are verified by an SVM classifier for fast results.
• The differences between the voice samples are identified using root mean square error (RMSE), and the similarity is optimized by fine-tuning speech features like pitch, duration, and spectral-temporal parameters of the samples to make them similar to the voice samples of blood relatives. The results then undergo a validation test.
The rest of the paper is organized as follows. Section 2 describes the flow of the proposed system and the formulation of the individual voice database for the speech-disabled. Section 3 presents the results and discusses them in terms of voice conversion, acoustic analysis to find the correlation, SVM classification to determine whether the correlation is strong or weak, and an analysis of errors. This is followed by a conclusion in Section 4.
The flow of the proposed technique for voice conversion is based on age by changing acoustic parameters like pitch, energy, and time. The synthesized sample undergoes feature extraction and matching to determine the strength of the correlation between the converted samples from different speakers from the same and different families (see Fig. 1). The steps are as follows:
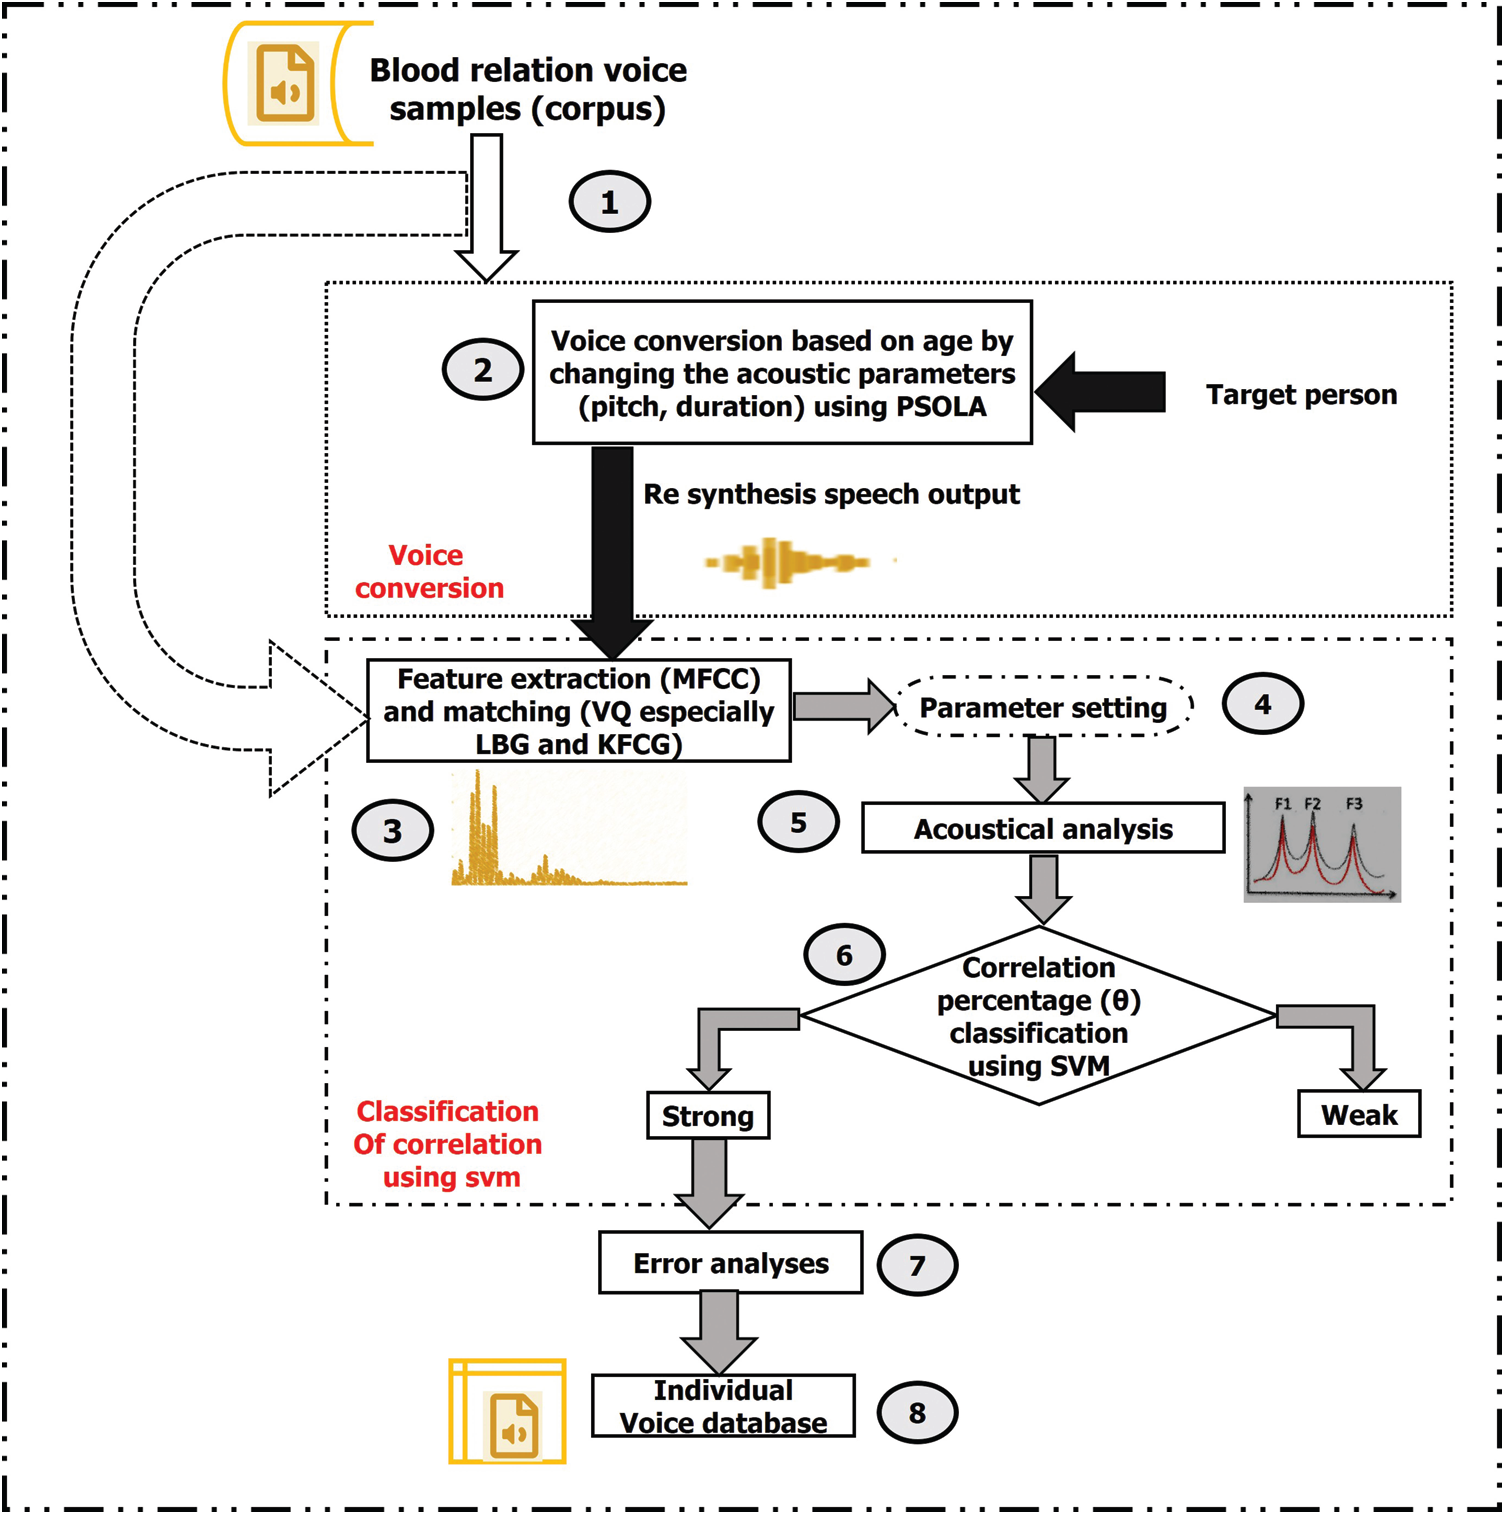
Figure 1: General framework of a voice conversion system
1. First, a corpus is created by recording the voice samples of speakers of the same and different ages and gender of each family.
2. Voice-age conversion is performed based on the target personage by changing the acoustic parameters.
3. Feature extraction and feature matching of the core samples are done with MFCC and VQ, especially the LBG and KFCG algorithms.
4. The default values are set for the splitting parameter (ζ) and distance threshold (D1). These are used in the feature matching algorithm to find the similarities between the voice samples.
5. Acoustic analyses are performed to calculate the correlation (θ) between the resynthesized voice samples and the voice samples of the blood relatives.
6. The correlation is classified as strong or weak using SVM.
7. Error analyses are performed using RMSE, and the speech features are fine-tuned using prosodic, spectral-temporal analysis, pitch, and duration. The results of the resynthesis are optimized to approximate the original voice samples.
8. Individual voice database is constructed for use by the speech-disabled. It includes the features of the samples from their blood relatives to make the speech of the target person more natural and realistic. This technique helps to create an individual database for the speech-disabled with blood relations voices depending upon their age.
The results and discussion for the resynthesized voice samples of the same or different gender of families in two different languages are explained briefly in the following sections.
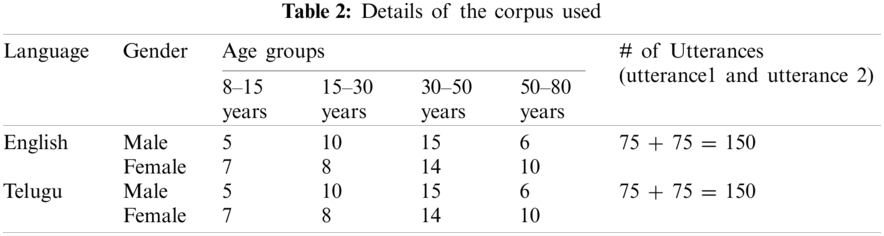
The dataset comprises 75 speakers from 12 families representing about three generations, aged 8–80 years. For each speaker, two short sentences (labeled “utterance 1 (U1)”) and “utterance 2 (U2)”) of each of English and Telugu, (Indian language) were recorded. The utterances are recorded from the families who can speak both languages. The uttered English and Telugu sentences are “I am Fine, thank you” “author of the danger trials” and “ ” (meaning of those Telugu sentences are respect parents; fine, thank you) respectively. The dataset was created by recording at a sampling rate of 16 kHz, and it was used for the experimental study along with their age groups. The utterances were recorded in a noise-free environment. Each speaker undertook a practice test to become familiar with the setup of the experiment. The details of the corpus used for the experimental study are shown in Tab. 2.
2.2 Voice Conversion Based on Age by Changing the Acoustic Parameters Using PSOLA
A person’s age from childhood to old age has been assumed to range from 8–80 years, within which prosodic features and voice changes stay within a comprehensive range. The voice-age conversion was performed by changing the acoustic parameters like fundamental frequency, duration, and energy of the voice sample using PSOLA [22–25]. For the said effect of voice-age conversion, the time stretching and pitch scale modification features of the PSOLA algorithm has been utilized.
This technique helped in creating an individual database for the speech disabled with blood relations voices depending upon their age. The system used for voice-age conversion involves the following steps (see Fig. 2):
1. For speech analysis, the speech waveform is decomposed into two components: (a) a flattened source signal containing much of the prosodic information. And, (b) a global envelope component that accounts for the resonant characteristics of the vocal tract transfer function (source-filter model) together with the spectral characteristics of the glottal excitation.
2. The components of the signal are modified: prosodic parameters and spectral-temporal features are altered by applying time-domain-PSOLA [25] algorithms on the source signal.
3. The speech signal is obtained from the modified excitation source and the modified envelope. Finally, the resynthesized speech signal, falling into one of the four age categories (child, young, adult, senior).
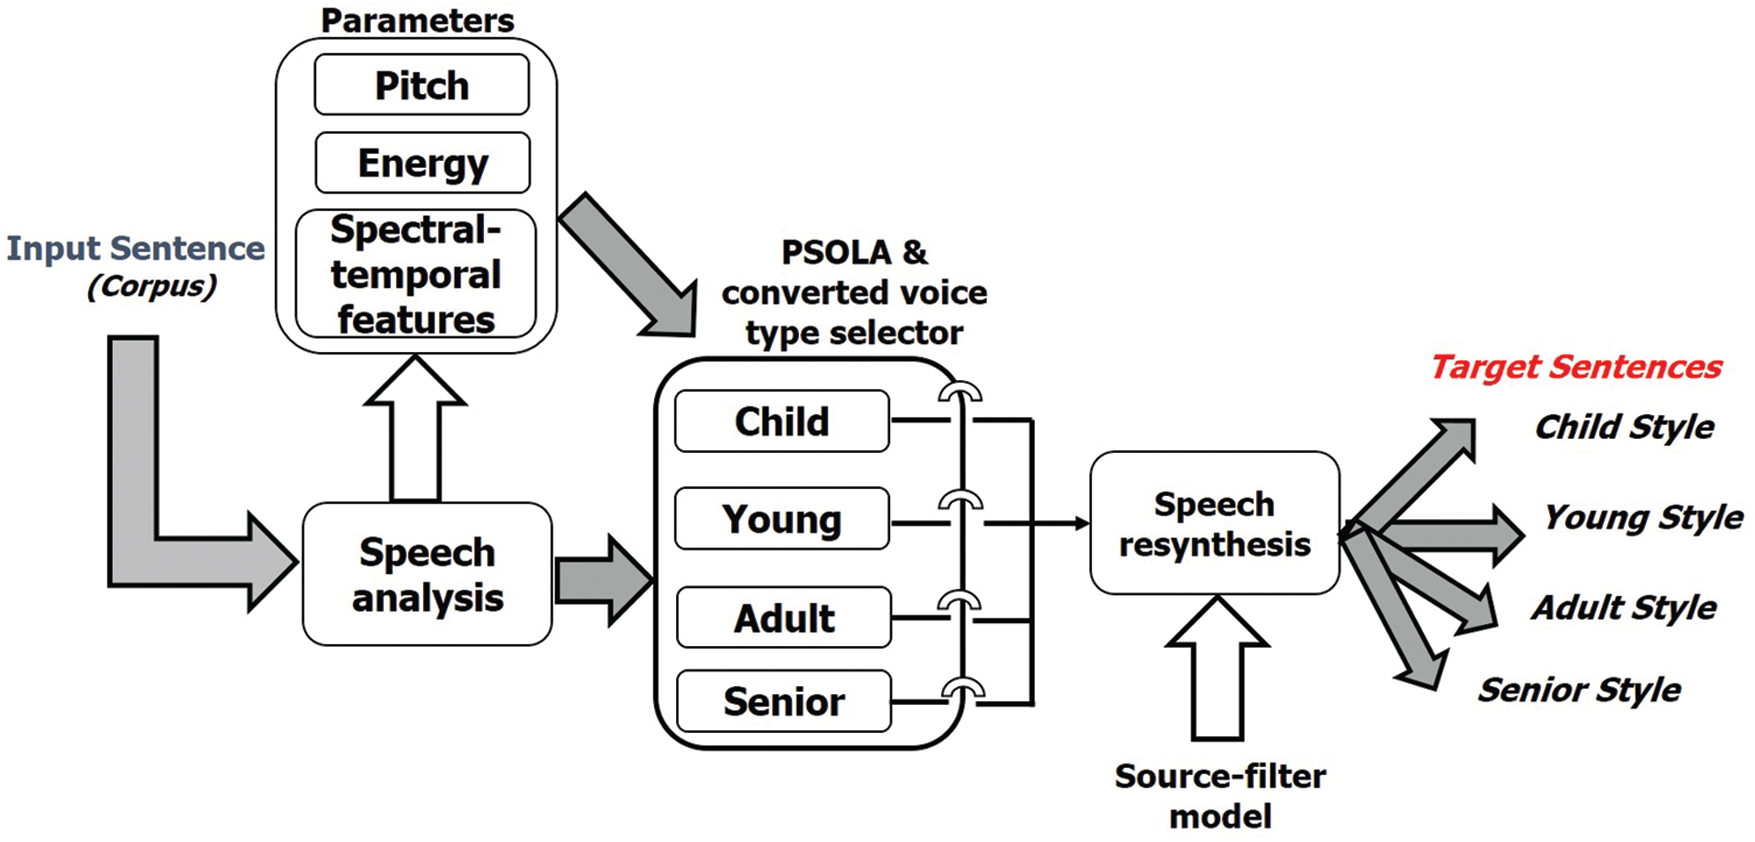
Figure 2: Block diagram of applied voice conversion method based on spectral and prosodic modification, and cepstral source-filter model for reconstruction
A detailed description of the aforesaid steps is given as follows. The input sentences from the corpus undergo speech analysis and perform prosodic parameters. The prosodic and spectral-temporal features are used to analyze each of the features of the voice samples from the corpus in detail. Then the same is compared with other speech sample features. Thus, an estimate of the feature(s) important for the given conversation is performed. The features are inherent in individual speech sounds (voicing, place & manner of articulation). The spectral features (frequency-based features), that are obtained by changing the time-based signal into the frequency domain via Fourier Transform like spectral roll-off (R), spectral centroid (C), spectral flux (F) & fundamental frequency (Pitch). The temporal features (time-domain features) are straightforward to extract and have a simple physical interpretation. The same features provide moderately worthy performance for speech recognition like short-time energy (E) and energy entropy (EE), zero crossing rates (ZCR) collectively give information about the timbre (tonality), pitch, rhythm, loudness [39]. Thereafter, the PSOLA algorithm is used to manipulate the pitch by transposing the pitch without changing the characteristics of sound. Then the resynthesis speech can be selected based on selector will falling in any of four age categories: child (8–15 years old), young (15–30 years), adult (30–50 years), or senior (50–80 years).
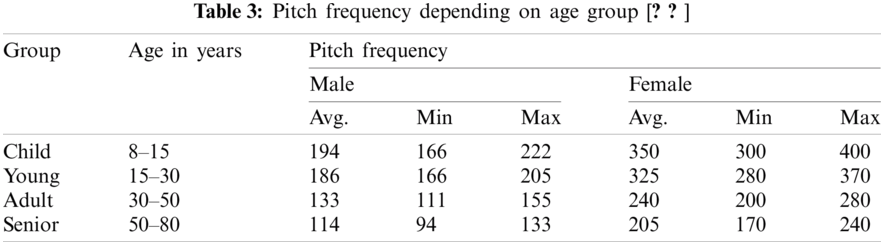
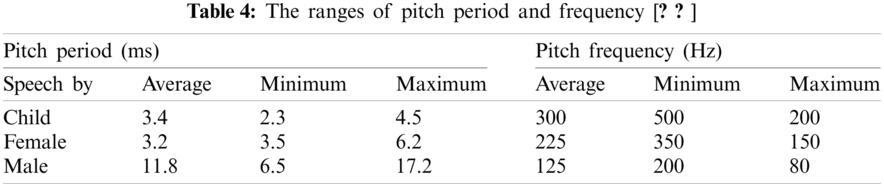
According to [21,25], depending on the gender i.e., male and female with respective four age categories (child, young, adult, senior) i.e., 8–15 years, 15–30 years, 30–50 years, 50–80 years. The pitch frequencies for the different age groups and genders are provided in Tab. 3. The pitch periods and pitch frequencies for the age groups and genders are given in Tab. 4.
One of the prosodic features of speech is pitch. It can be varied by pitch-scale modification using the PSOLA algorithm. The other prosodic features of speech—tempo or speed and or duration—can be varied by time-scale modification [21,22].
• Pitch-scale modification (p-scale) [22]: modifies the pitch of a signal, possibly in a time-varying manner without altering the signal’s time evolution (and in particular, its duration).
• Time-scale modification (t-scale) [22]: speeds up or slows down a signal, possibly in a time-varying manner, without altering the signal’s spectral content (particularly its pitch when the signal is periodic).
By using time-and pitch-scale modification [22,23] of PSOLA, we can choose acoustic and prosodic features of the sound of the source to match the age and gender of the target person.
2.3 Classification of Correlation Percentage Between Original and Resynthesized Blood Relation Voice Samples
The correlation [34] between the resynthesized speech and the voice samples from the corpus is classified using SVM. It provides results based on feature extraction and matching of voice samples, parameter setting, acoustic analysis to find the correlation, and classification of the correlation as either strong or weak, which are discussed briefly in the following sections.
2.3.1 Feature Extraction and Matching
Mel frequency cepstrum coefficients (MFCC) consider human perception sensitivity about frequencies and which ones are best for speech and speaker recognition. Those are given as input to the VQ module to create the codeword for each training sequence. These are then assembled into a codebook.
The most common methods in VQ to generate codebooks are the Linde, Buzo, Gray (LBG), and Kekre’s fast codebook generation (KFCG) algorithms because they reduce the number of iterations in the codebook algorithm [35–38]. However, while LBG guarantees the progression of distortion, initial conditions must be carefully chosen. KFCG, on the other hand, requires less computational speed and memory space. VQ with modified k-means LBG and KFCG algorithms [35–38] was implemented to determine the correlations of performance and recognition between the voice samples of blood relatives of similar and dissimilar genders and different language databases is discussed in the following subsections. We consider a number of centroids k = 8 (~number of groups in the data) for effective results. In the previous preliminary work by the author, the steps for feature extraction and matching are explained in detail along with results for the Sanskrit language sentence [34].
In the aforesaid feature matching algorithms, the splitting parameter (ζ) is used to divide/split the size of the codebook. For that, we consider different values of the splitting parameter by considering a few voice samples of the same and different gender from the same and/or different families. For this study after experimenting several times, different splitting parameters and their results are shown in Tab. 5. We fixed the splitting parameter at 0.01 based on empirical studies to define the match between blood relation samples.
The minimum distance threshold i.e., distortion (D1) is the sum of the distances of all training vectors in the nearest neighbor search [35]. Initially, the experiment with different values of D1 for LBG and KFCG algorithms between the training and testing codewords is shown in Fig. 3. The minimum distance threshold is required to classify the correlation either as strong or weak, after experimenting with various voice samples from the same and different families. On comparing the performance of different values of D1 for various voice samples in the respective corpus. Finally, we set D1 values as 8.5 and 5.79 for the LBG and KFCG algorithms, respectively, to get better performance results. The correlations (θ) = 100 − D1 for LBG and KFCG are 91.5% and 94.2%, respectively.
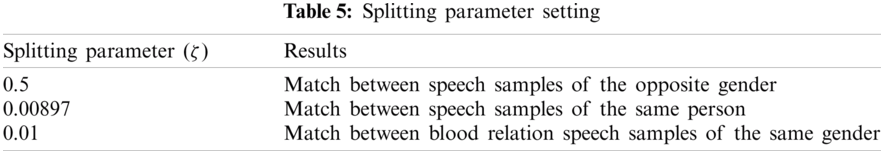
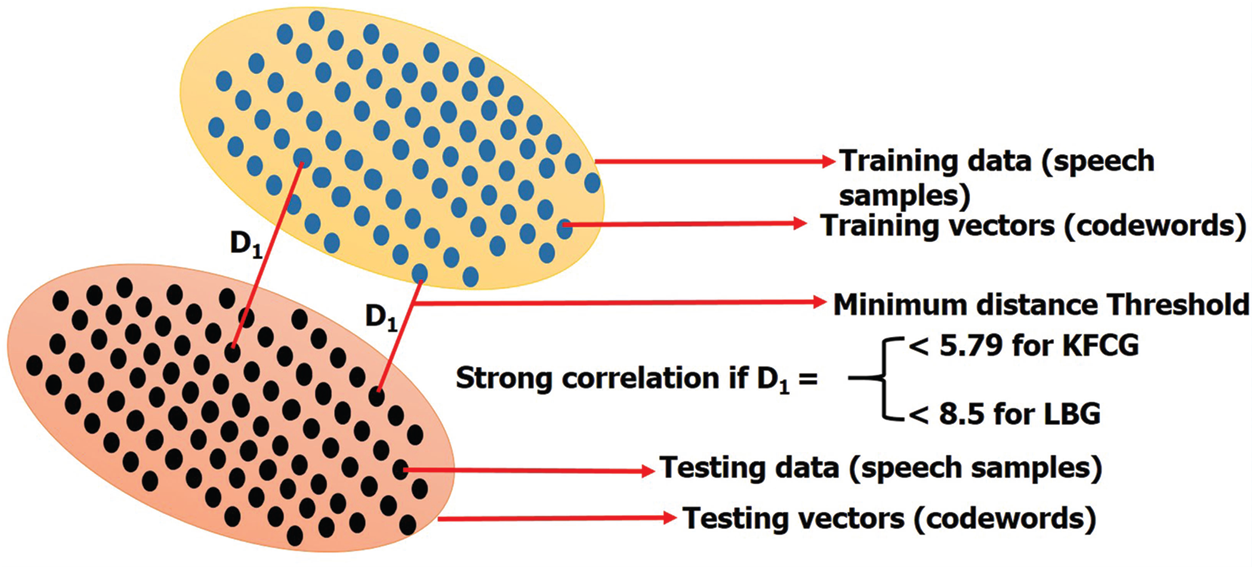
Figure 3: Minimum distance threshold for LBG and KFCG
2.3.3 Acoustic Analysis to Find the Correlation
For each of the test speakers from the corpus, the first five formant frequencies of English and Telugu sentences in the reading speech were measured from the dataset. The experimental study was conducted to find the correlations between the speakers from the same/different set of families by using the LBG and KFCG algorithms, respectively, for the voice samples in the corpus. Then, based on parameter setting as discussed in Section 2.3.2, the threshold for the value of the correlation between the resynthesized samples and the voice samples of the blood relatives was considered strong if θ > 91.5% for LBG and > 94.2% for KFCG.
2.3.4 Classification of Correlations (θ) Using a Support Vector Machine (SVM)
Instead of finding the correlation is either strong or weak using threshold reference (91.5% and 94.2% for LBG and KFCG, respectively) manually, it is easier to feed those results to a classifier for easy and accurate correlation classification. Thus, instead of a time-consuming process, we used an SVM machine-learning algorithm [40] for fast and accurate analysis with the acceptable result to find the correlation is strong or weak between the voice samples. This is effectively used for large corpus and considers only strong correlation voice samples. All the responses for the proposed methodology were validated. This is treated in Section 3.
The corpus was created by collecting the voice samples from all the speakers from about three generations of a given family as discussed in Section 2.1. Voice conversion based on age by changing the acoustic parameters using PSOLA, each sample from the voice database underwent feature extraction and matching [35–38] to find the correlation and the correlations were classified as weak or strong using SVM. This process is discussed and the results are shown in the following subsections.
3.1 Voice Conversion Based on Age by Changing the Acoustic Parameters Using PSOLA
We recorded the voice samples while blood relatives recited designated sentences. PSOLA was used to convert the source voice samples to target voice samples for the age of the target person by varying the p-scales and t-scales [22,23]. The source and target voice signal waveforms are shown in Fig. 4.
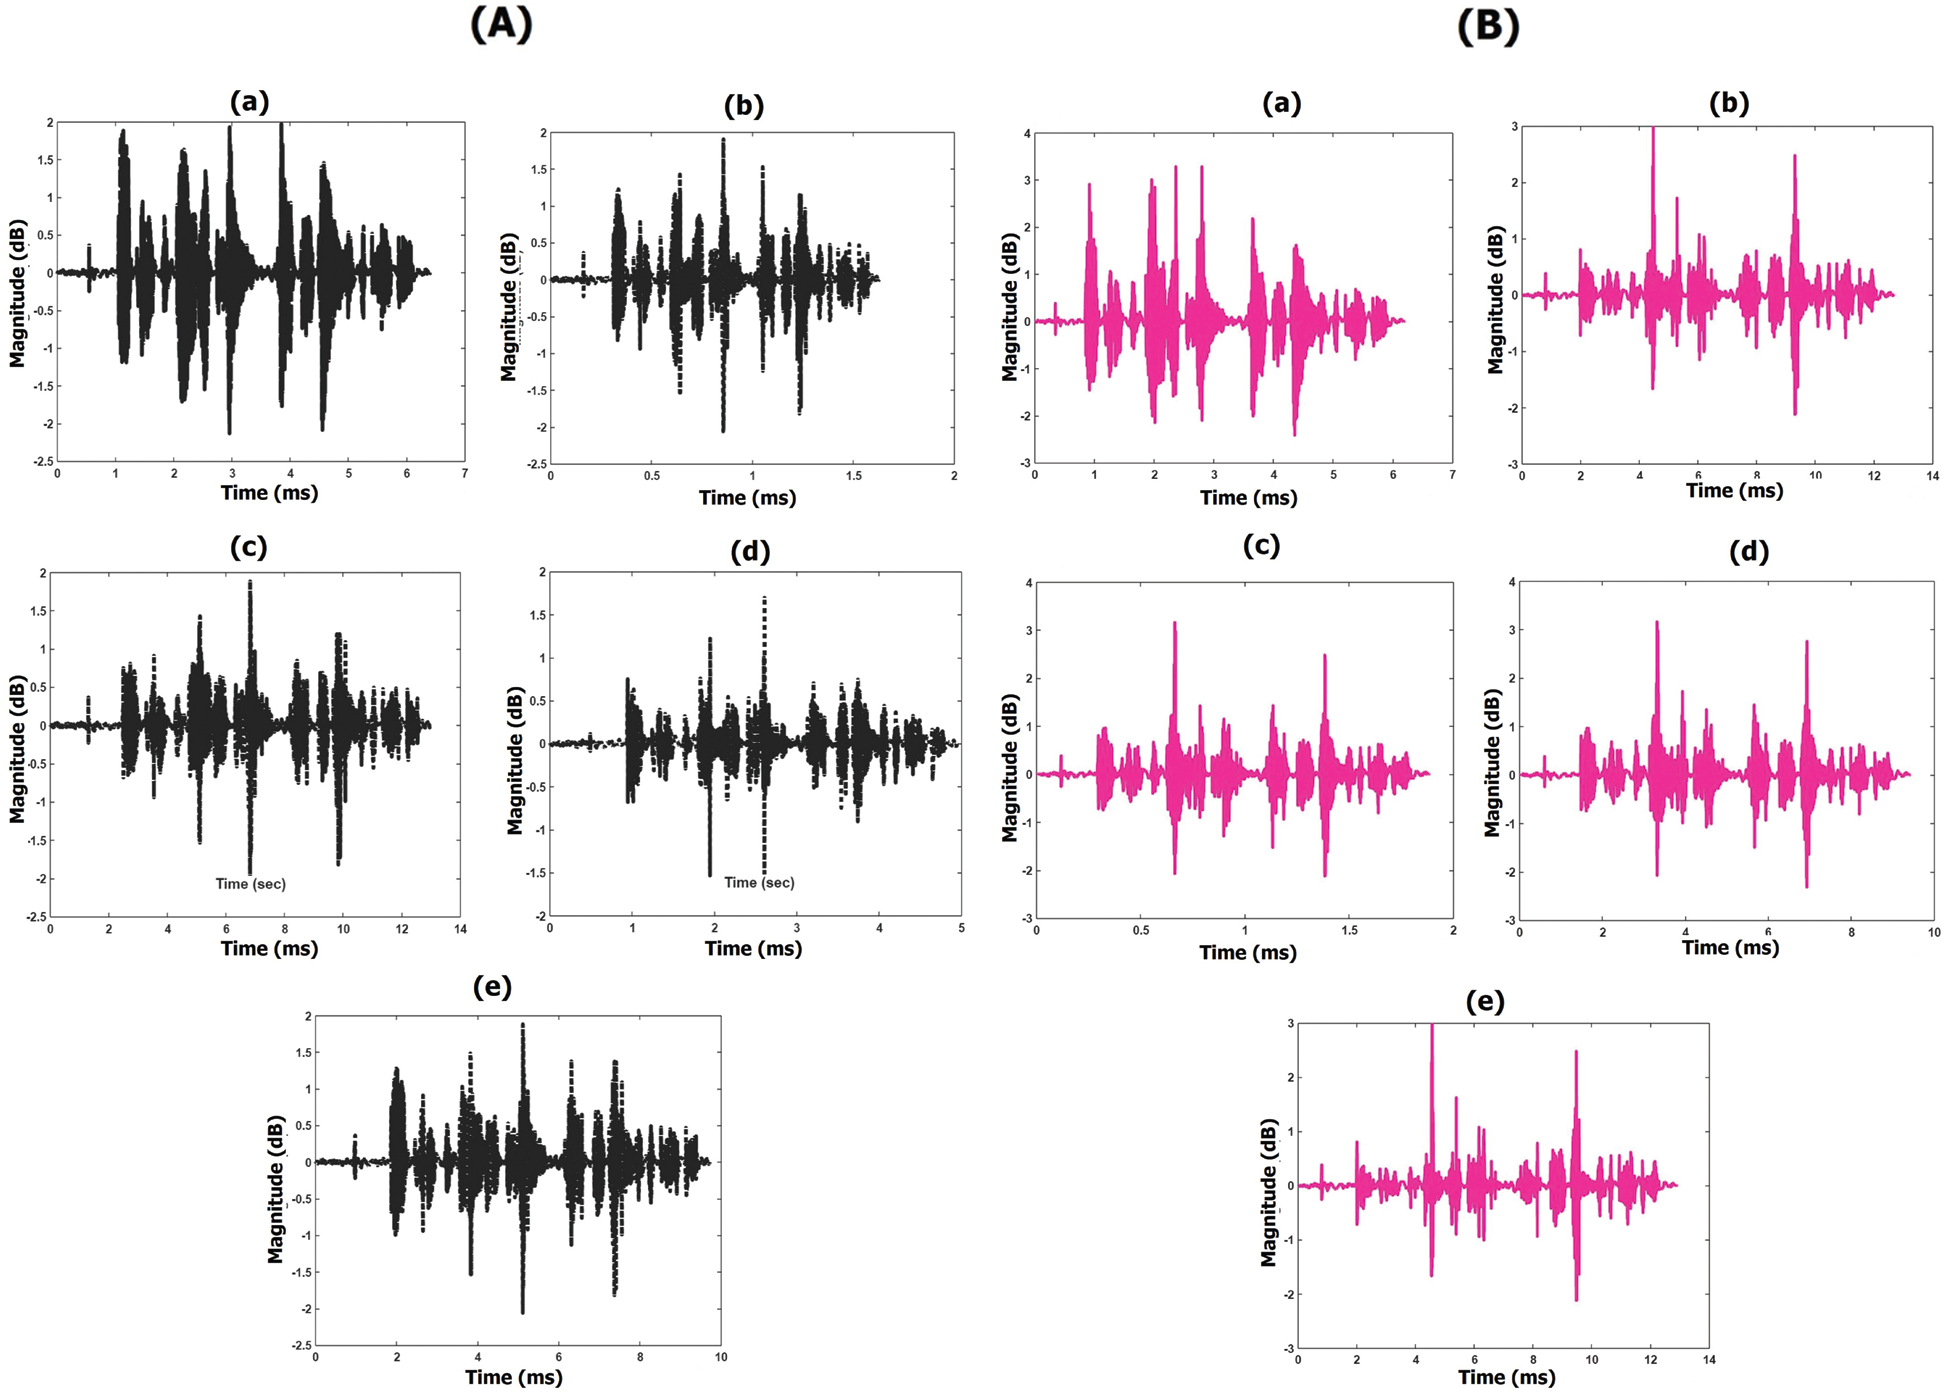
Figure 4: Input and output voice signal waveforms i.e., source (male) voice signal and a targeted voice signal (A) while reciting English sentence (a) Male voice signal of age 45 years (b) 10 years’ child (c) 20 years (d) 35 years (e) 55 years (B) while reciting Telugu sentence (a) Female voice signal of age 25 years (b) 10 years’ child (c) 20 years (d) 35 years (e) 55 years
We consider a voice sample from a male aged 45 years reciting an English sentence. Then we conduct voice conversion using PSOLA by changing the acoustic parameters of different age groups as mentioned in Tabs. 3 and 4. Fig. 4A shows the source sample of a 45-year-old male reciting an English sentence and that sample converted to ages of 10, 20, 35, and 50 years, respectively. Fig. 4B shows the source sample of a 33-year-old female reciting a Telugu sentence and that sample converted to ages 15, 20, 35, and 55 years, respectively. The acoustic characteristics like gender, age, pitch frequency, and energy for both the source samples and the converted samples while reciting English and Telugu sentences are given in Tab. 6.
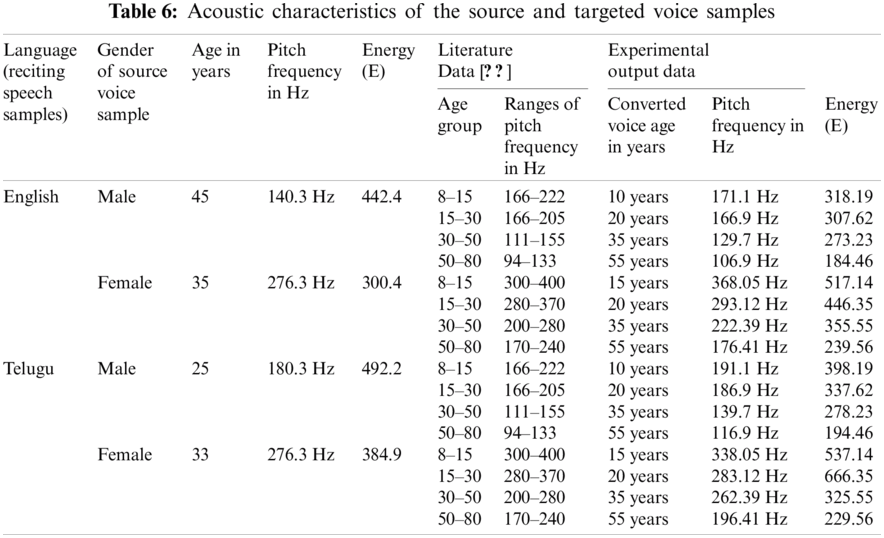
Tab. 6 shows the acoustic characteristics of the source and converted or resynthesized voice samples in the age ranges identified in Tab. 3. The average energy (E) values for the female voice were higher than those of the male voice. The language, gender, age, pitch, and energy of the source samples are followed by the gender, age, pitch, and energy converted or resynthesized sample. The pitch frequency, energy, and duration of the resynthesized samples were verified through comparison with the literature, it follows the same as mentioned in Tab. 3. The pitch and energy of the converted voice samples of the female are higher than those of males in the respective age groups. The pitch and energy of the resynthesized samples fall in the same ranges irrespective of the language being recited for the source samples.
We find the correlation to determine whether the speech characteristics of the source samples and the resynthesized samples are static. Then, classification aids in identifying whether the correlation is strong or weak using SVM. Those classifications are discussed in the following subsections. Thus, the resynthesized speech helps to create an individual voice database that is more realistic to benefit patients with speech disorders.
3.2 Acoustic Analysis to Find Correlations
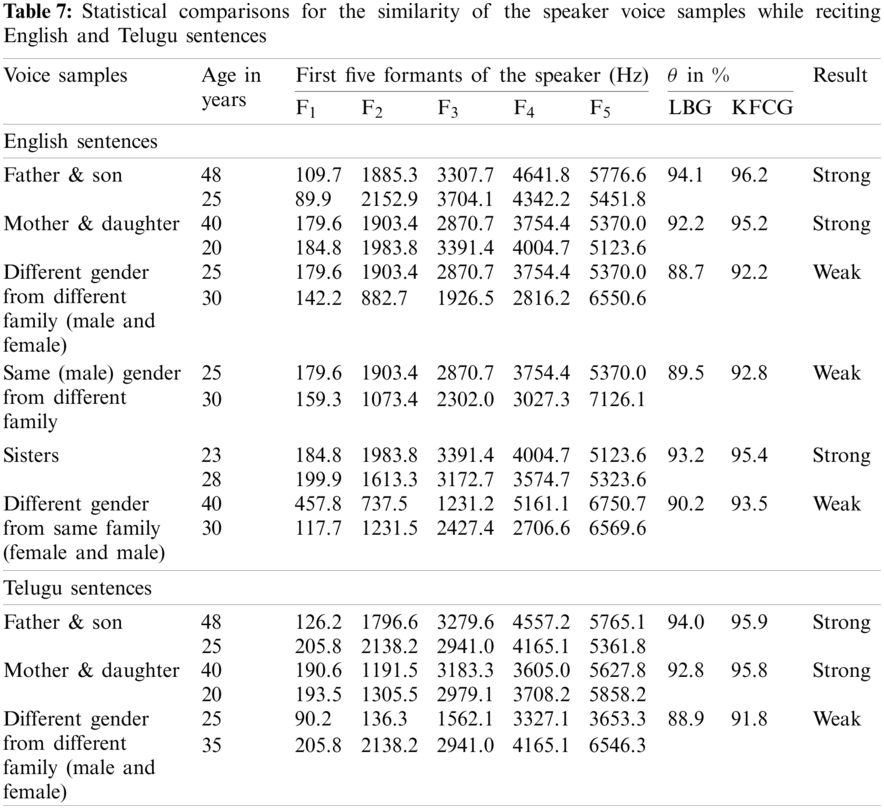
The correlations can be calculated by analyzing the voice samples from the same and different families and gender. The frequency responses of both the samples of speakers from the same and different families reciting English and Telugu sentences are shown in Fig. 5. Then their respective vocal tract formants and experimental correlation results using the LBG and KFCG algorithms are shown in Tab. 7. Based on parameter setting and threshold defined in Section 2.3.2, the correlation will be either strong or weak.
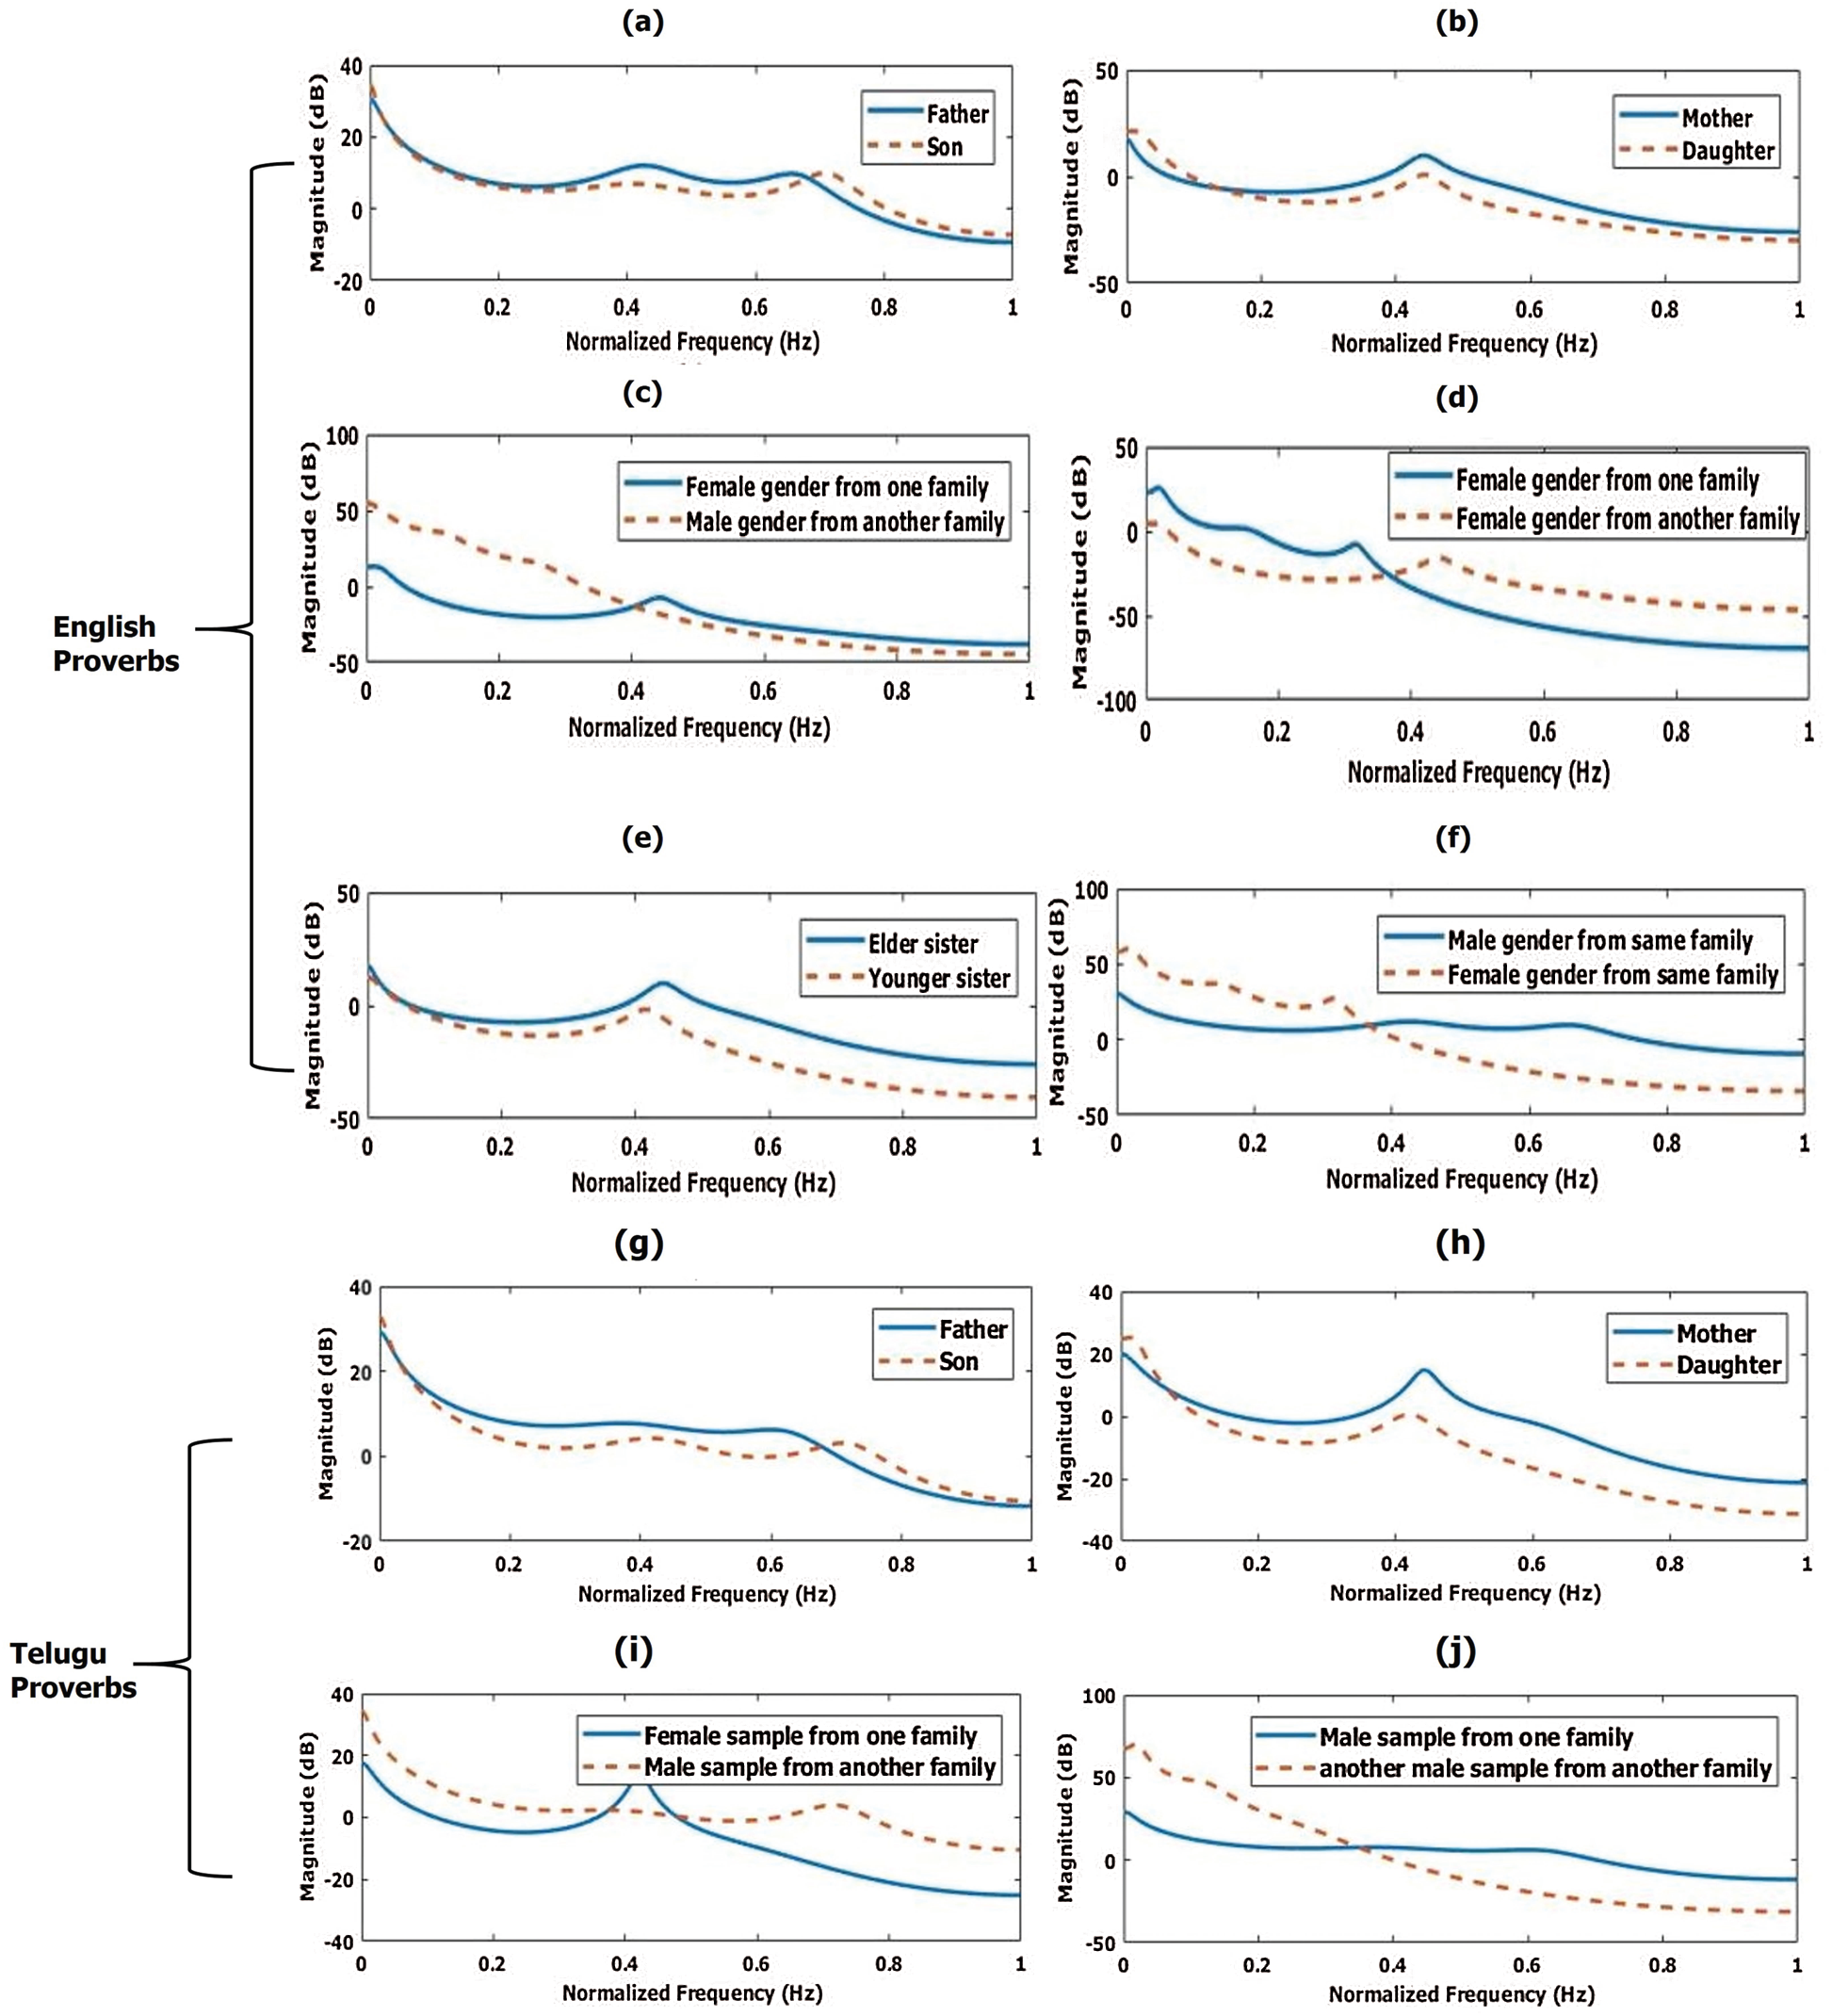
Figure 5: Frequency response (linear predictive coding (LPC)) of original and converted voice samples while reciting ‘English Sentences.’ (a) Father & son (b) mother & daughter (c) different gender from a different family (d) same gender from different family (e) sisters (f) different gender from the same family frequency response (LPC magnitude response) of voice samples while reciting ‘Telugu sentences’ (g) father & son (h) mother & daughter (i) different gender from different families
The frequency responses of the voice samples of father and son (aged 48 and 25 years); mother and daughter (40 and 20 years), and sisters (23 and 28 years) from the same family while rendering English and Telugu sentences have almost the same vocal tract resonances. The pitch or tone may vary depending on the age of the speakers as shown in Figs. 5a, 5b, 5e, 5g, and 5h, respectively.
Similarly, the voice samples from different genders of the same or different families have different vocal tract resonances because of dissimilar gender or spectral–temporal features as shown in Figs. 5c, 5d, 5f, and 5i, and 5j respectively.
The upper rows of Tab. 7 list the first five formants of various combinations of speakers reciting English and the correlation between the voice samples computed with the LBG and KFCG algorithms. Data for reciting Telugu sentences are in the lower rows. The correlations are strong when the speakers are of the same gender from the same family. Conversely, the correlations are weak when the speakers were from different families or different genders from the same family.
The same procedure was conducted to find the correlations between 75 sets of source and converted samples of the same and opposite gender for 12 families while reciting English and Telugu sentences. The results of the correlations, computed with the LBG and KFCG algorithms, are shown in Fig. 6.
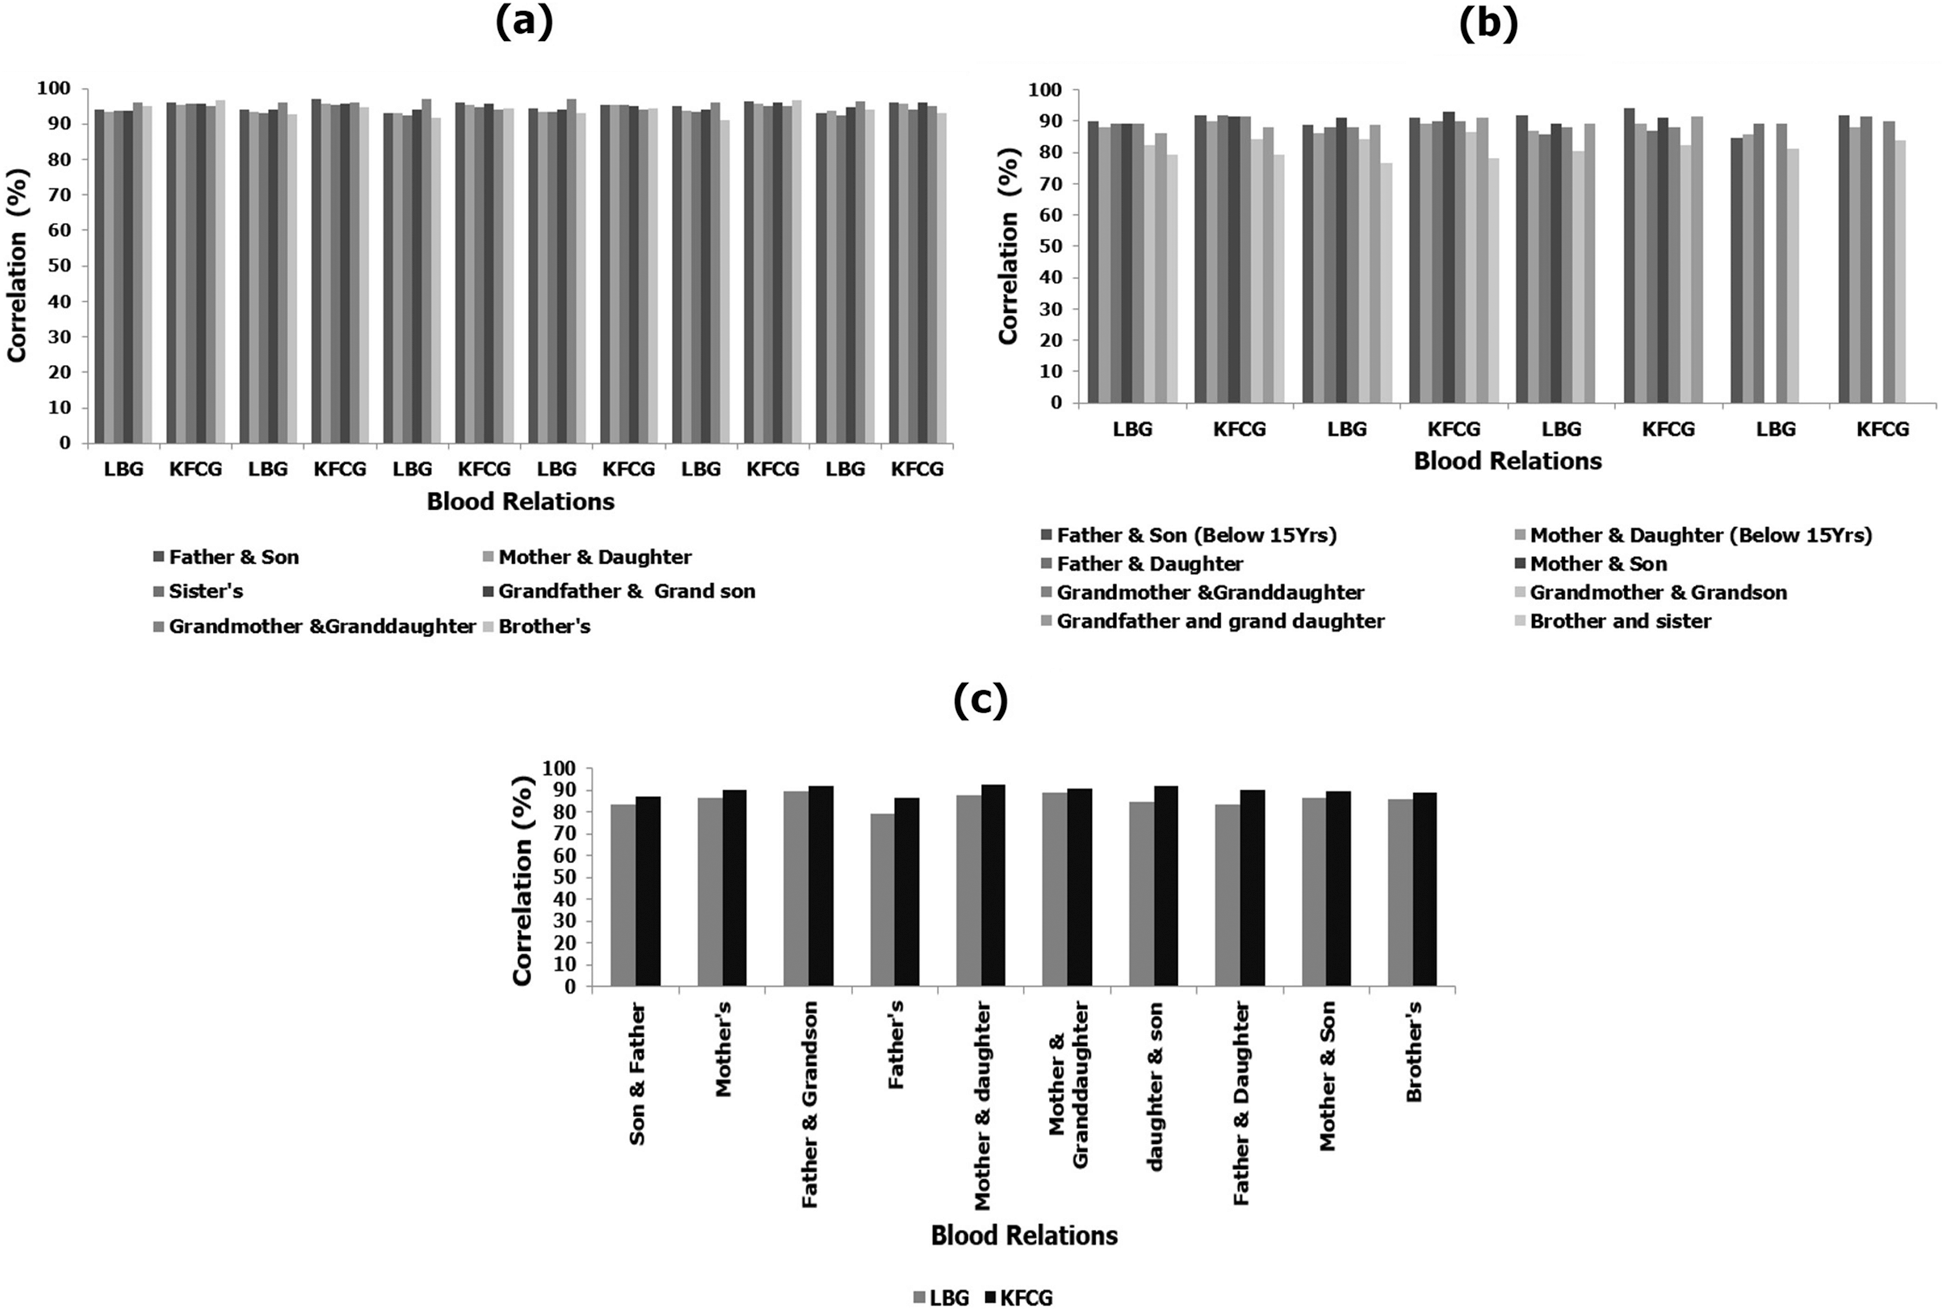
Figure 6: Correlation between original and converted voice samples while reciting ‘English sentences’ using LBG & KFCG algorithms (a) same families with the same gender (b) same families with different gender (c) different families of same/different gender’s
There were strong correlations (θ) between voice samples of the same gender. They were ~93.9% and ~95.3% using LBG and KFCG, respectively. The correlations were strong because the speakers had similar vocal tract characteristics (formant frequencies and spectral envelopes as shown in Figs. 5a and 5b and Tab. 7). The correlations (θ) were weak for speakers of different genders from the same family: ~83.61% and ~85.70% using LBG and KFCG, respectively. When the speakers were of different genders or if they were the same gender but their age was < 15 years or > 75 years, it was difficult to find strong correlations between their voice samples because of the difference in vocal tract resonances (formant frequencies and spectral envelopes like as shown in Figs. 5c and 5d and Tab. 7). The statistical comparisons showed weak correlations even though there was high similarity (correlation (θ) ~> 85%) between the voice samples of speakers from different families. This is because they came from the same age group or had similar pitches or accents.
By consolidating all the results of all the speakers in both languages, we evaluated the correlations between blood relatives of the same gender using frequency response, i.e., Linear Predictive Coding (LPC) response and formants (vocal tract characteristics). From the statistical comparisons of voice samples from the same and different families, we concluded that there would be a strong correlation with voice samples from blood relatives by considering the vocal tract characteristics i.e., formants (see Tab. 7) and frequency response by LPC coefficients (see Fig. 5) irrespective of the generations and variations of the language.
We used an SVM algorithm to find a line or curve (in two dimensions) that divided the classes. The results showed whether the correlations were strong or weak between source and resynthesized samples. They were well separated, as shown by the red and yellow dots in Fig. 7a. A linear discriminative classifier draws a straight line separating the two sets of data, thereby creating a classification model. Three very different separators perfectly discriminated between these samples, as shown in Fig. 7b. Depending on which line you choose, a new data point (the one marked by the “x” in Fig. 7b) will be assigned a different label. In SVM, the line that maximizes this margin is the one we will choose as the optimal model as shown in Fig. 7c. SVMs are one type of maximum margin estimator [40].
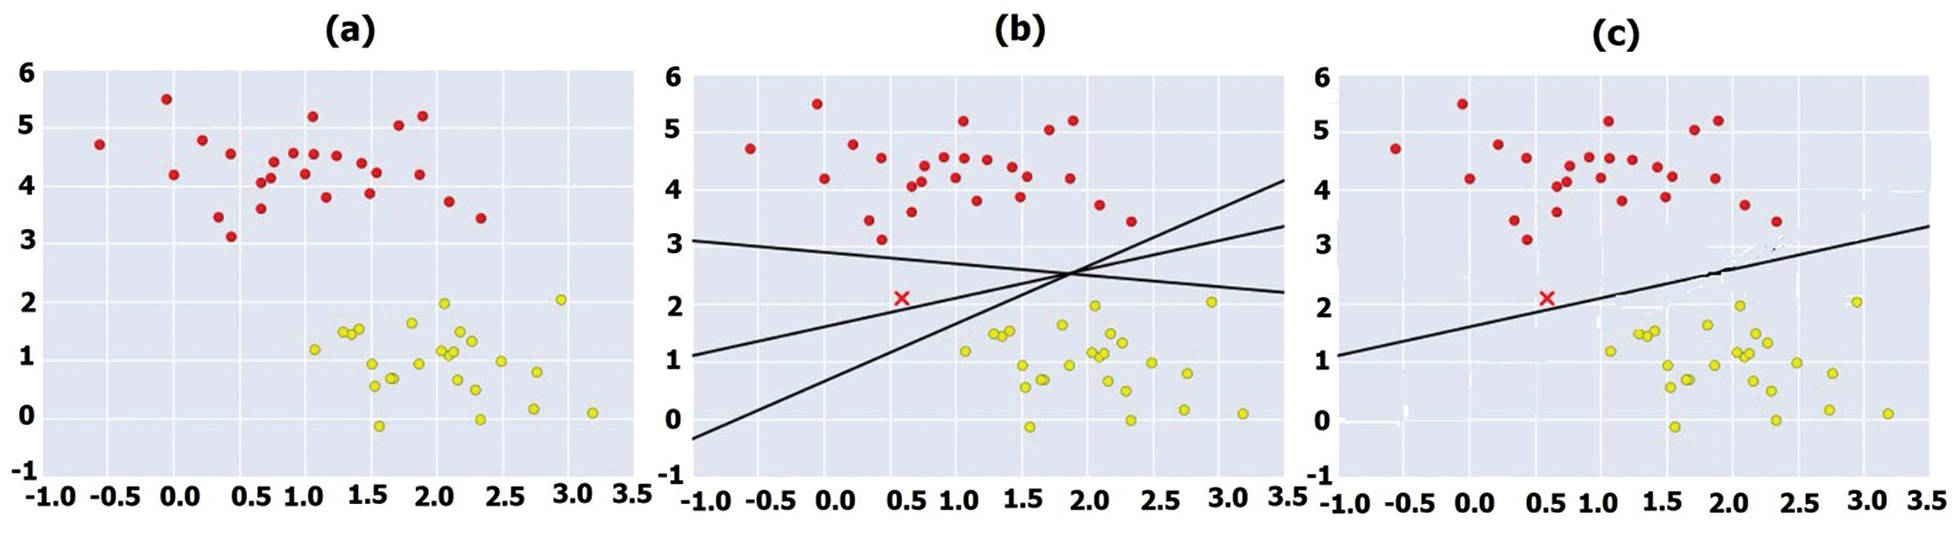
Figure 7: Classification of correlation percentage using SVM (a) two sets of data (b) three separators with new data point “X” (c) optimal model for classification
Thus, the classification of correlation between source and resynthesized samples was done with SVM. This classifier helps to track whether the correlation is either strong or weak and we can consider only strong correlation voice samples. Thus, we could ignore samples with weak correlations, because the originality of the source voice samples affects. We use the voice samples for voice conversion based on the age of the target person. We consider only if the correlation between the source and resynthesized samples is strong as calculated acoustic analysis. Thus, these samples can be used to create an independent database of natural-sounding voice samples for use by parlayed and speech-disabled persons.
The resynthesized voice samples were validated by error correction and the acoustic parameters were optimized to reduce the errors to make the voice more realistic and appropriate. Perceptual tests are discussed in the following subsections. With this technique, we can build a database for the target voice-disabled person without changing the speech characteristics of the voice samples from blood relatives. That is, if we build a database by using the father’s (blood relation) voice samples, we can construct an individual database for his son by altering some acoustic characteristics and the PSOLA algorithm. Similarly, we can create a database for his daughter by using voice samples from her mother samples and using voice conversion along with the PSOLA algorithm and acoustic characteristics based on the daughter’s age.
By using the voice conversion mechanism, we can change the voice by changing its acoustic characteristics depending on the age of the target person. By acoustic analysis, we find the correlation and classification and determine if the correlation between the source and resynthesized samples is either strong or weak. The error study on the original samples and the converted sample of the target person’s age as shown in Fig. 8, while reciting English and Telugu sentences.
The waveforms of the original voice sample and voice conversion system (converted/resynthesized) sample of the target person’s age are 78 years, 25 years and 55 years, 35 years while reciting English sentences by male speakers are shown in Fig. 8.
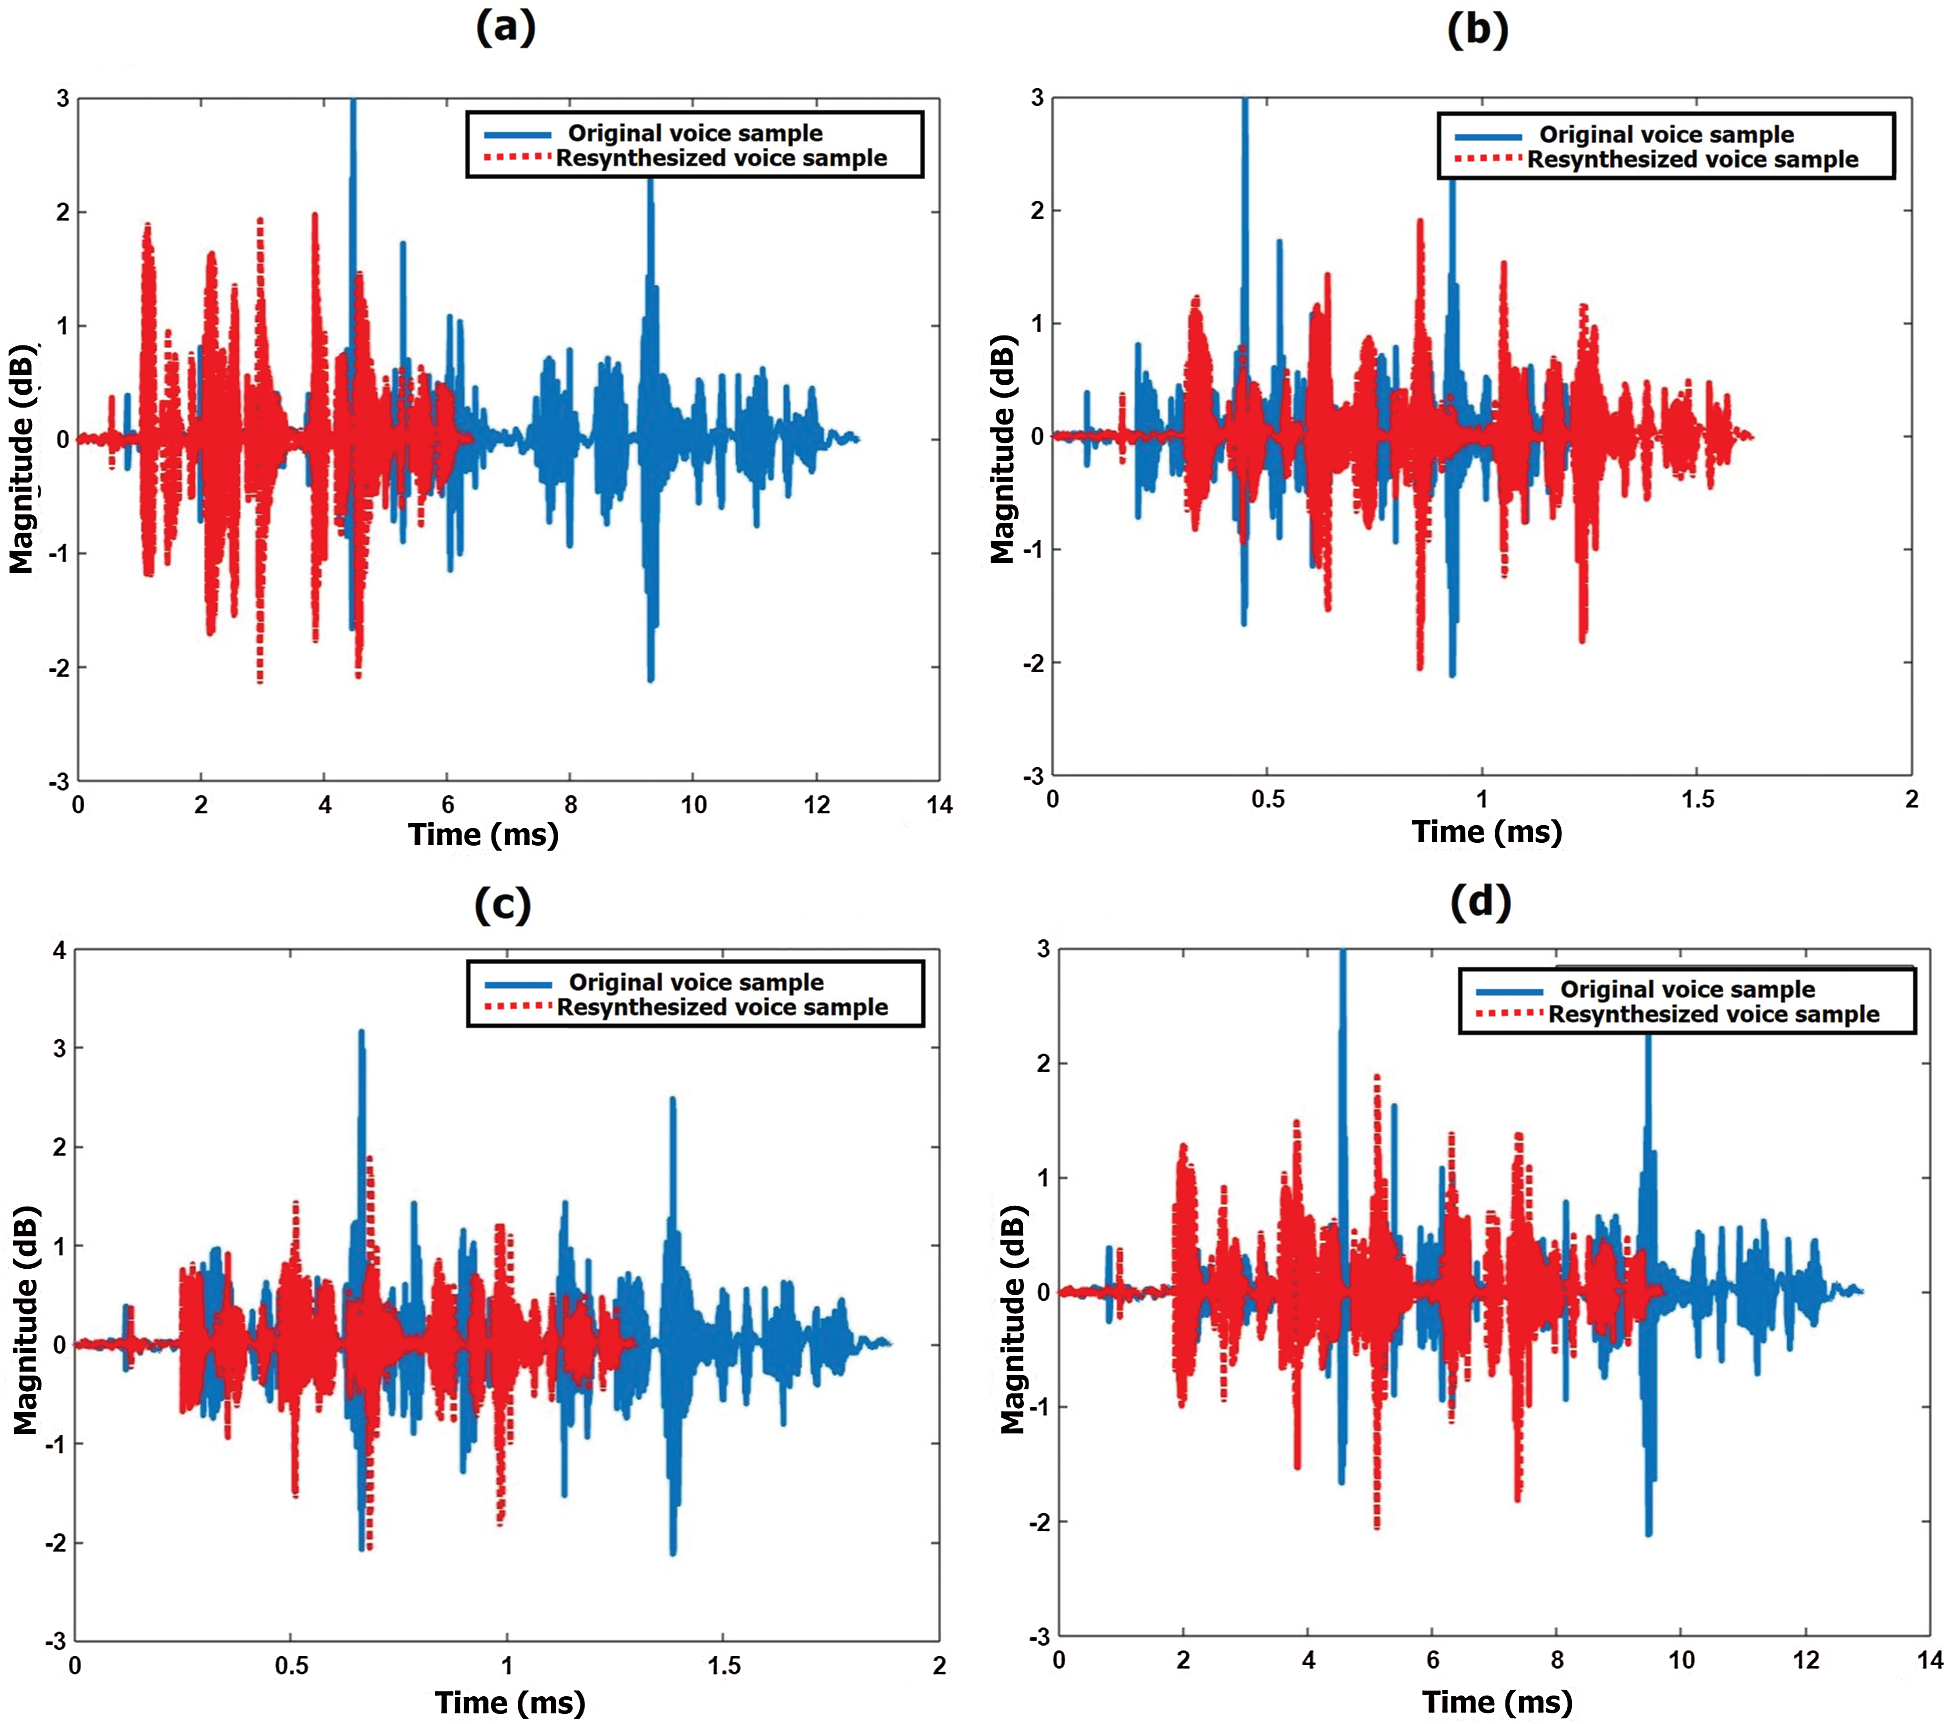
Figure 8: Voice signal waveforms of the original sample and voice conversion system (resynthesized) sample while reciting English sentences by the male speaker (a) 78 year (b) 25 years (c) 55 years (d) 35 years
The waveforms of the original voice sample and voice conversion system (converted/resynthesized) sample of the target person’s age are 35 years, 75 years and 55 years, 25 years, while reciting Telugu sentences by female speakers, are shown in Fig. 9. Blue indicates a source sample and red indicates a resynthesized sample using a voice conversion system.
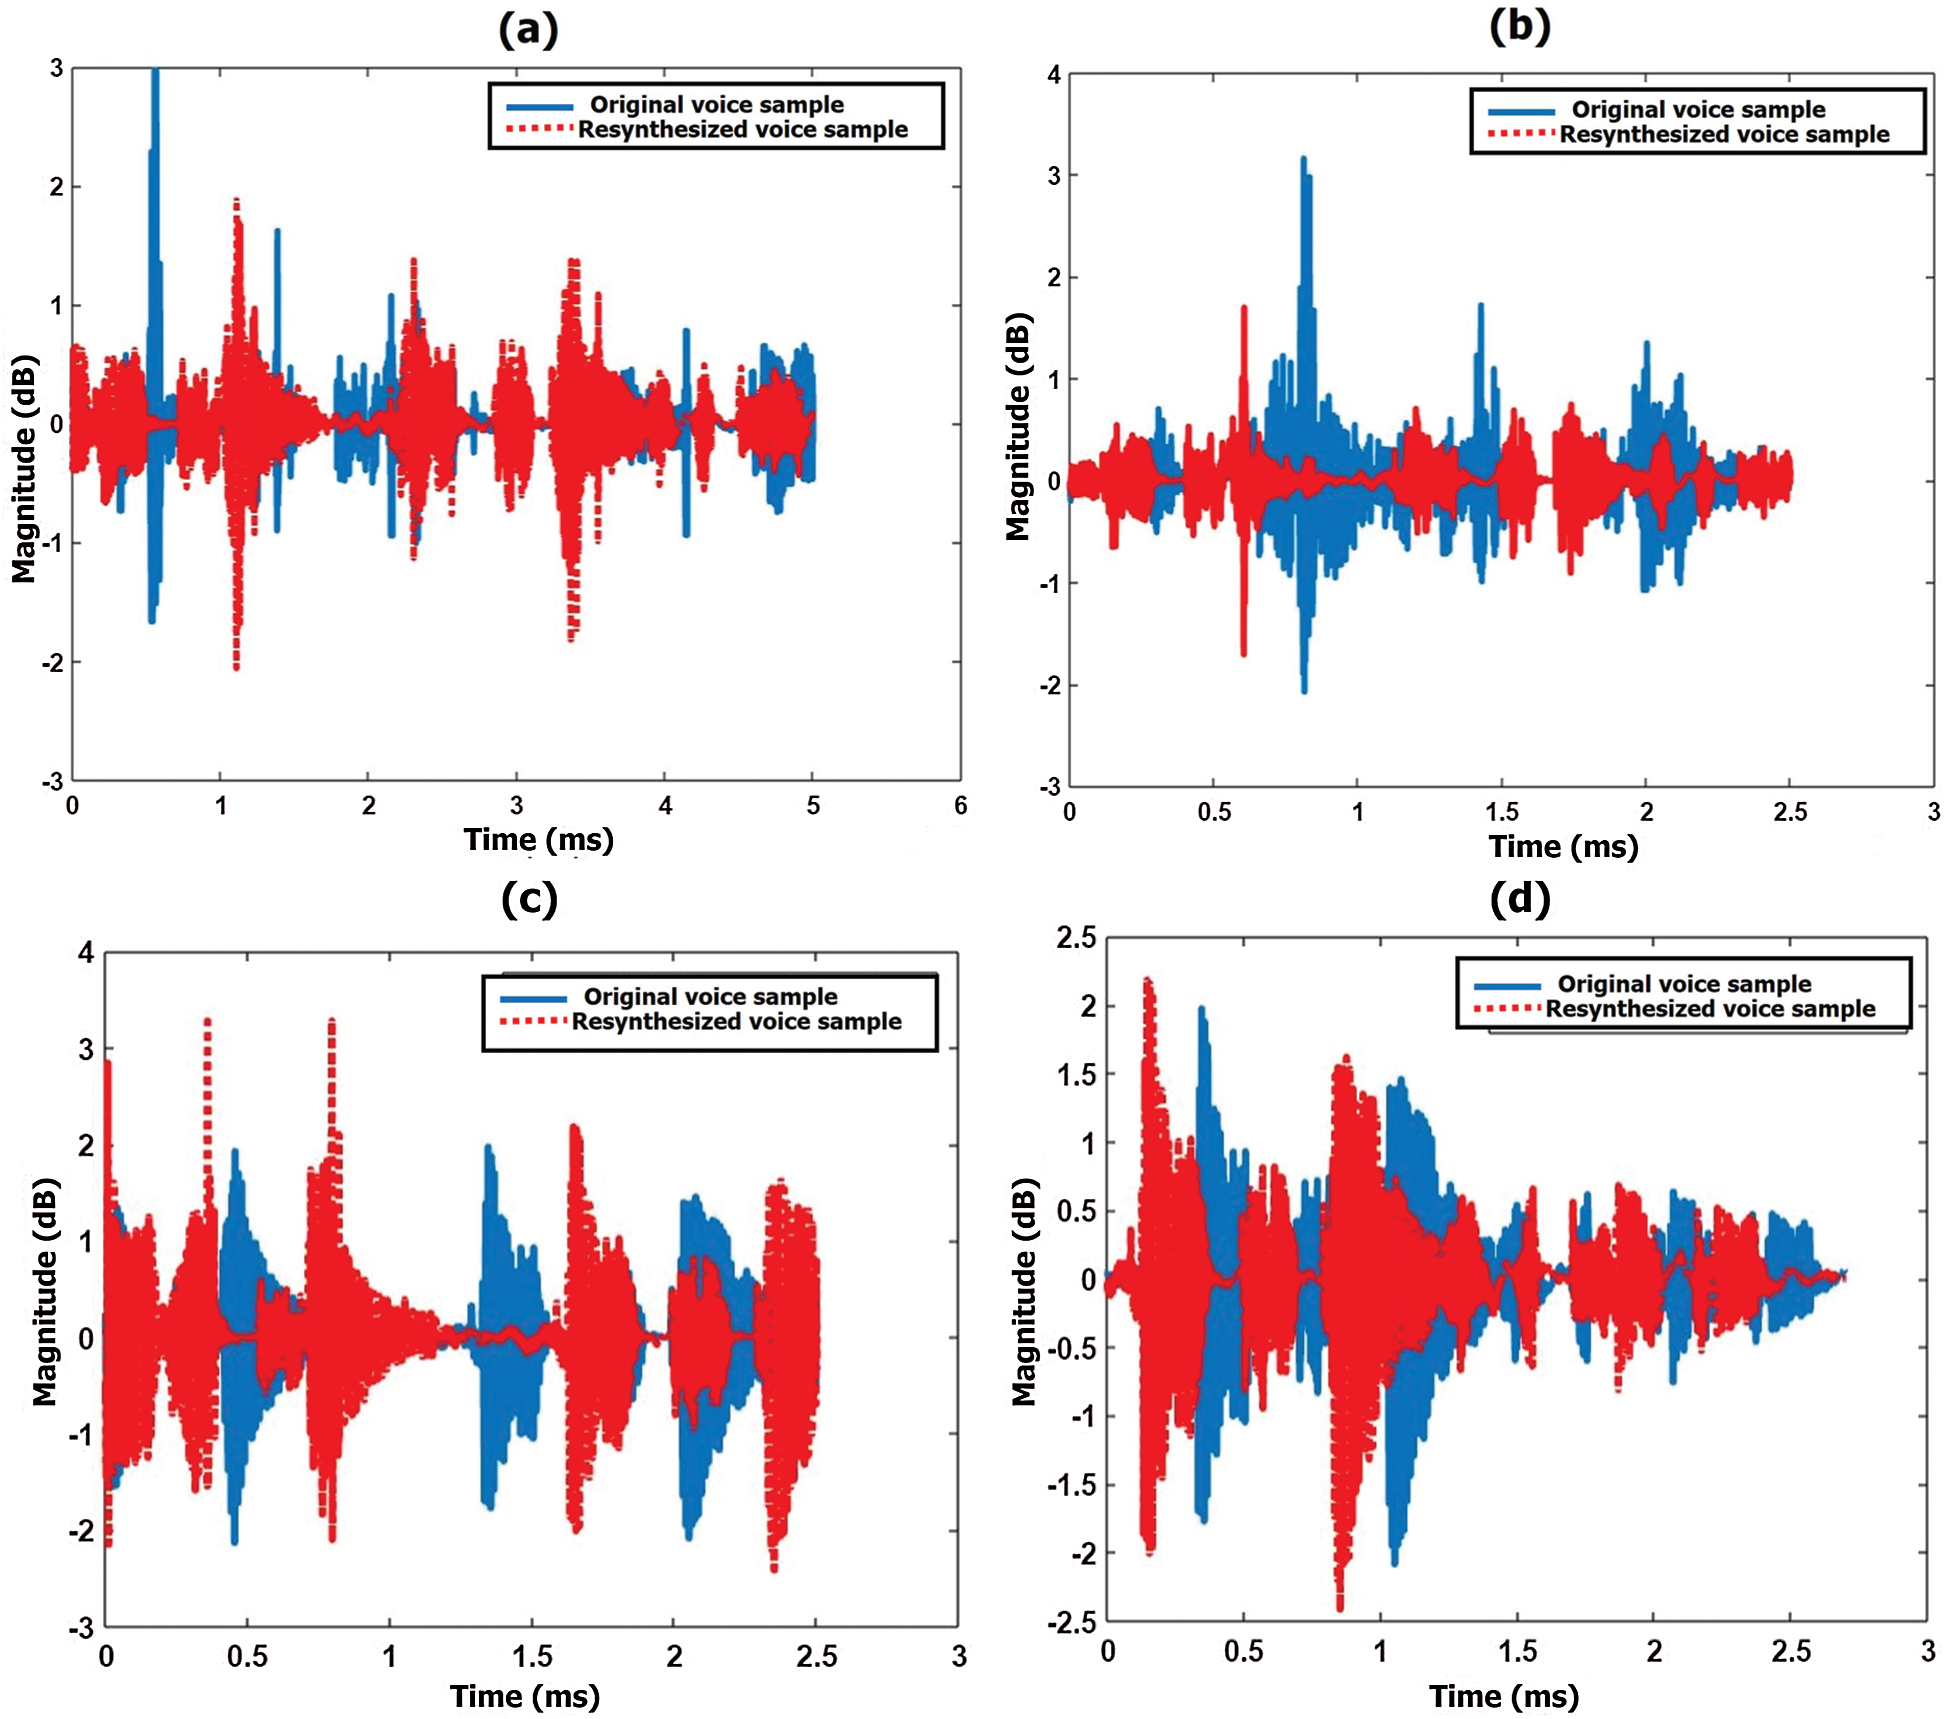
Figure 9: Voice signal waveforms of the original sample and voice conversion system (resynthesized) sample while reciting Telugu sentences by the female speaker (a) 35 year (b) 75 years (c) 55 years (d) 25 years
The error between the original and synthesized samples is calculated using root mean square error (RMSE) [41], to prove that the synthesized voice is the same as the original voice with minimum error. The RMSE error between the original and synthesized samples shown in Figs. 8 and 9, is calculated. The RMSE are ~5.5, ~2.0, ~3.5, ~2.5; ~2.35, ~6.0, ~3.5, ~2.79 respectively for all waveforms shown in Figs. 8 and 9.
The error between the original samples and the resynthesized voice in the voice conversion system was slightly lower for a few samples after they were resynthesized. The methods, for optimizing the results by reducing the error, (which gives good quality of perception and the accurately resynthesized voice are as close as possible to the original voice are discussed in the following subsection.
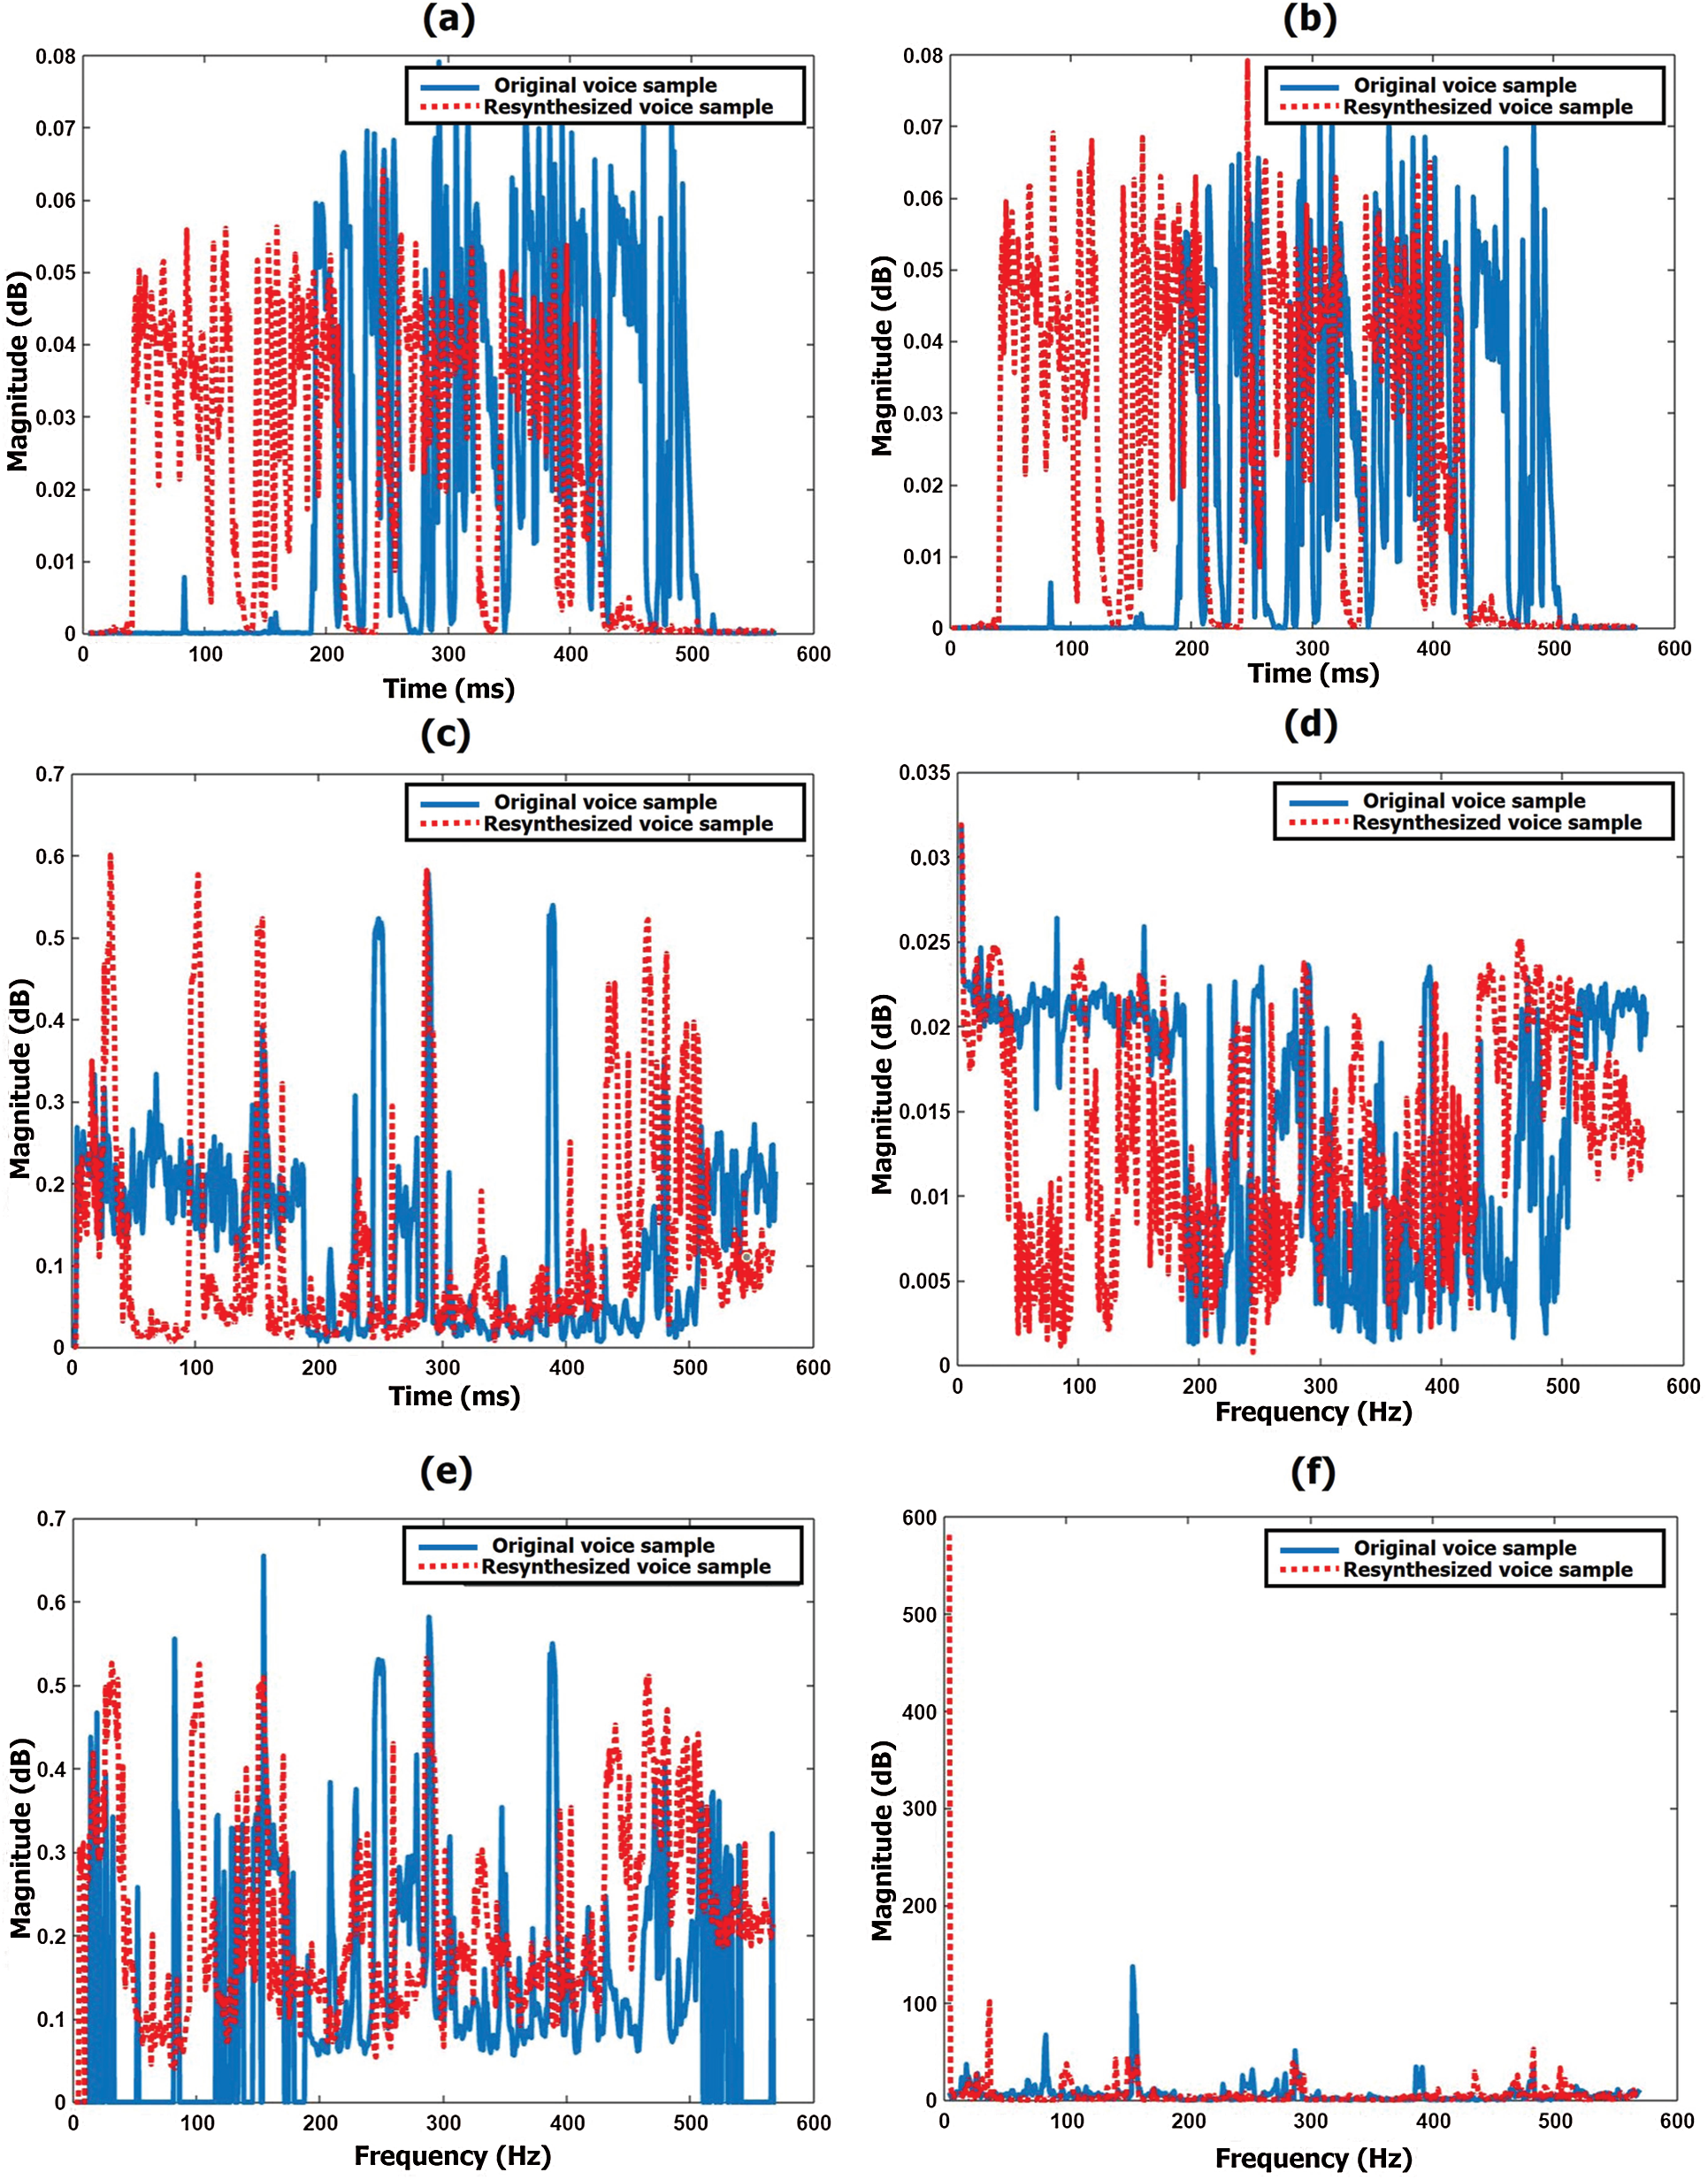
Figure 10: Spectral-temporal features of original and resynthesized voice samples after fine-tuning of speech features. (a) energy entropy (EE) (b) short time energy (E) (c) zero crossing rates (ZCR) (d) spectral roll-off (R) (e) spectral centroid (C) (f) spectral flux (F)
Spectral-temporal features of the voice sample are used to analyze and estimate which features increase the similarity between the voice samples so those speech features are prominent.
The histograms of each spectral-temporal feature of the original and resynthesized samples are shown in Fig. 10. The differences in peaks are due to the resynthesized samples, where the spectral-temporal features slightly vary when compare to the original sample. Thus, fine-tuning of spectral-temporal features makes the resynthesized voice sample as close as possible to the original sample, as shown in Fig. 10. This is then used to create a voice database for the speech disabled to make their voices more natural and realistic for easier interactions with others.
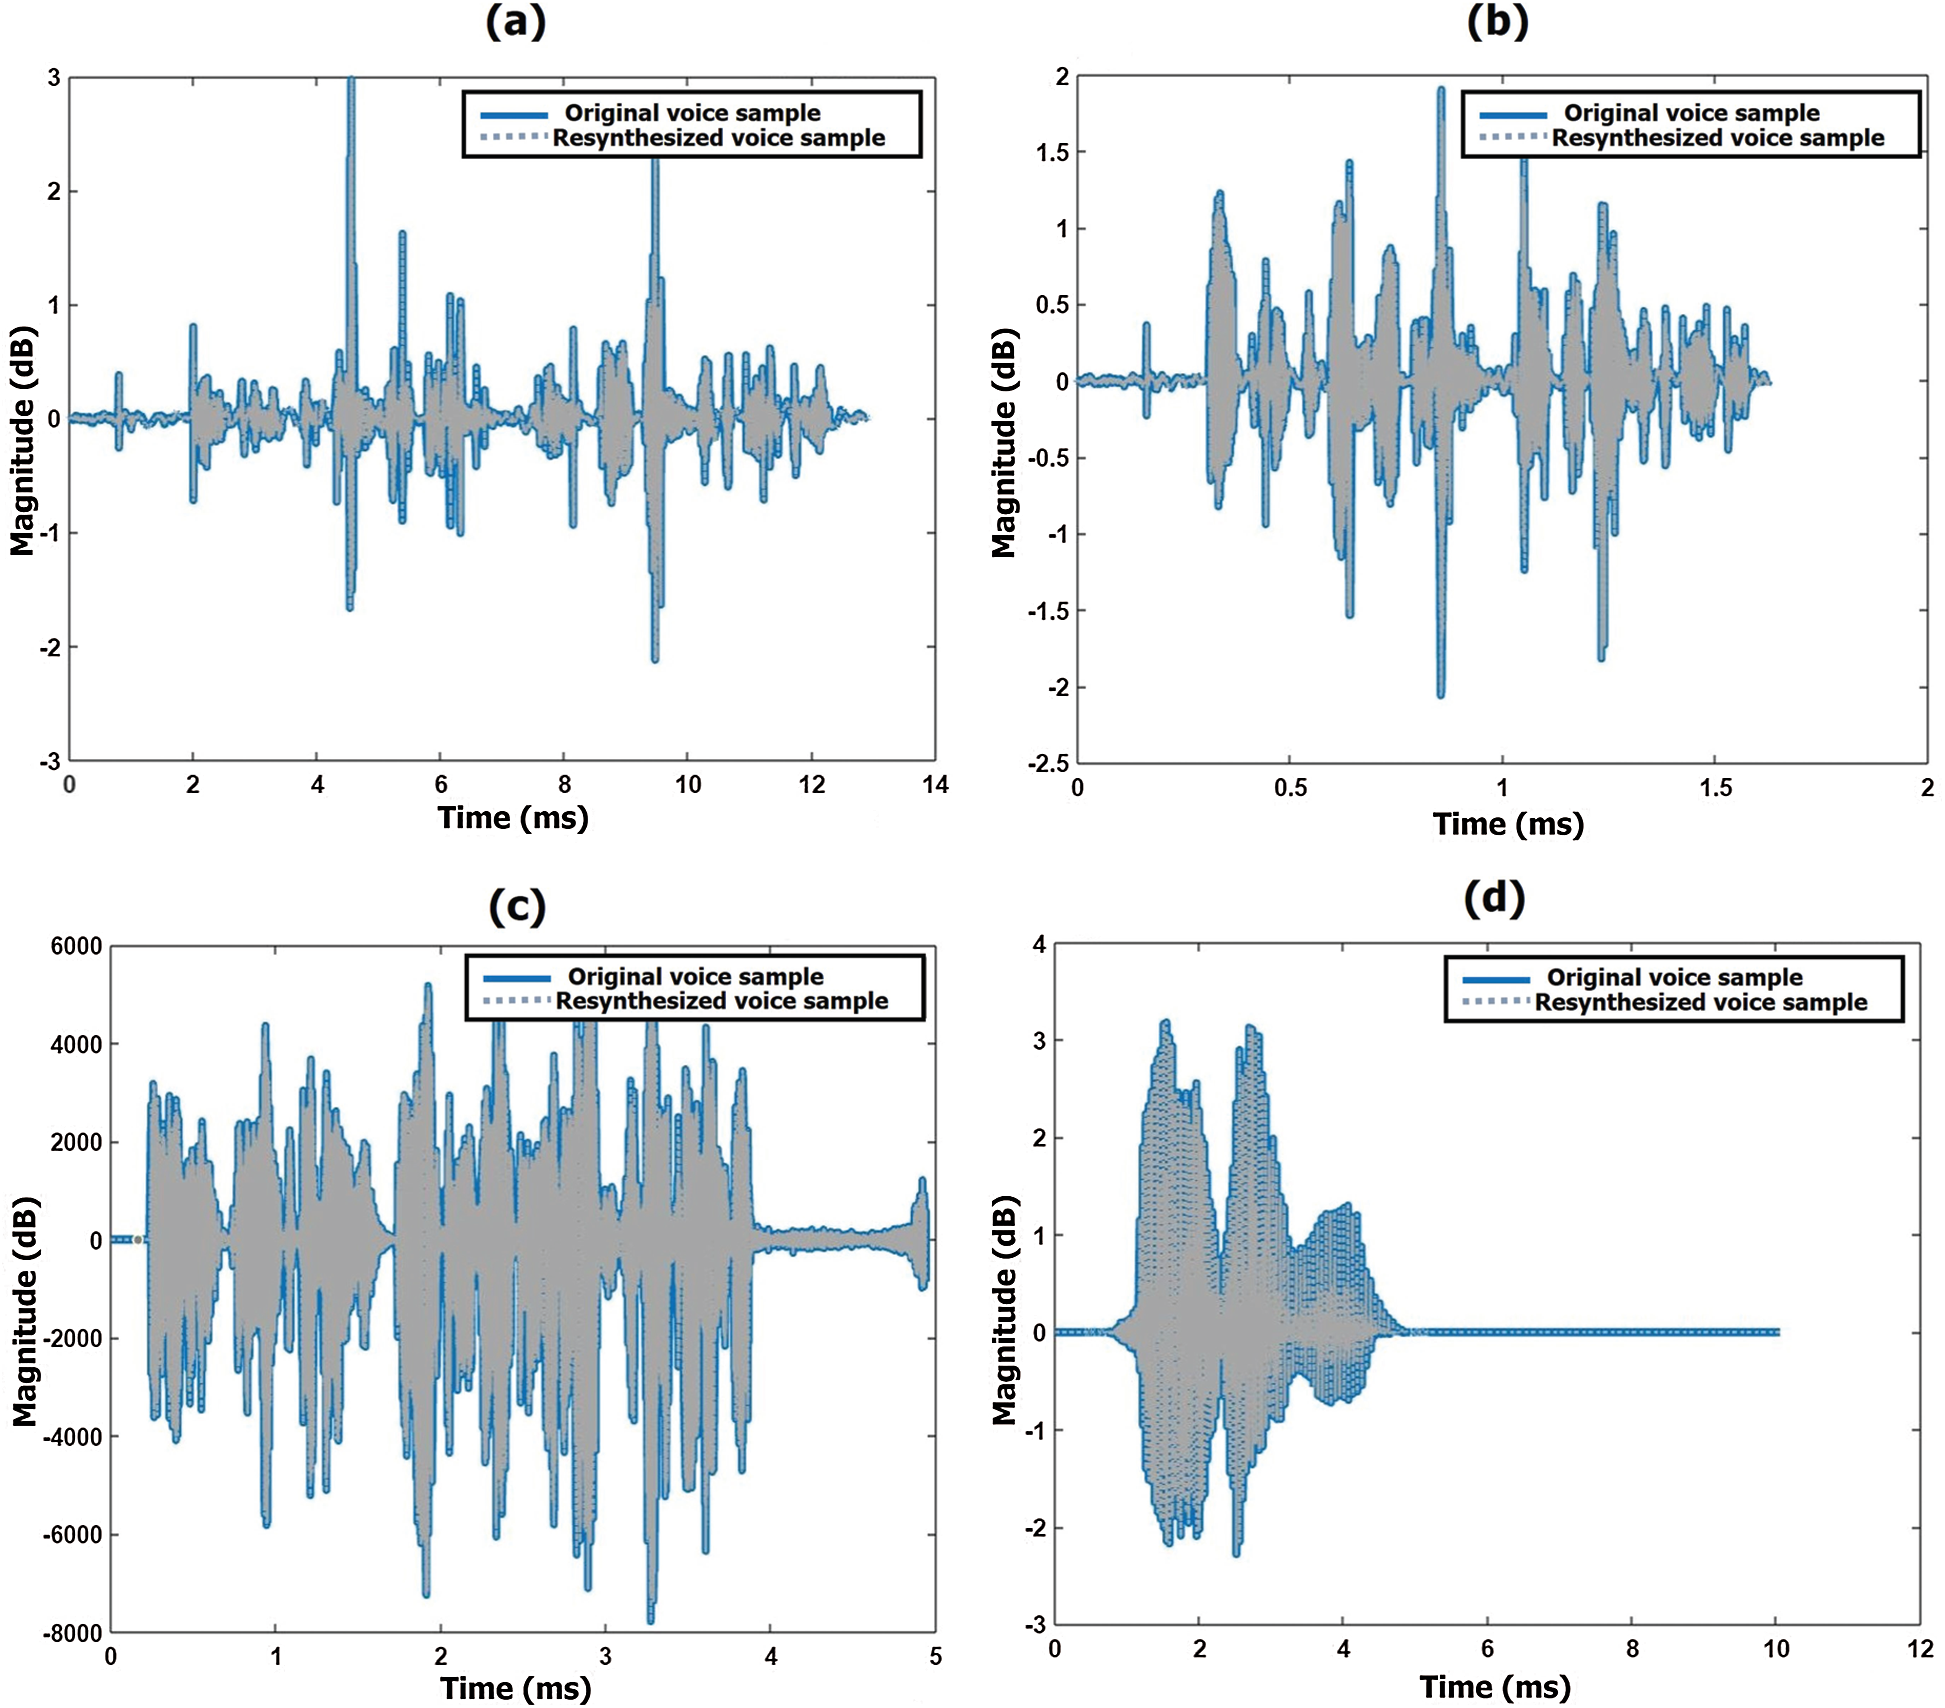
Figure 11: Optimized voice signal waveforms of original sample and voice conversion system sample while reciting English sentence of (a) 58 years of the male speaker (b) 22 years of the female speaker and while reciting ‘Telugu sentence’ (c) 35 years of the female speaker (d) 25 years of the male speaker
PSOLA is used to modify the pitch and timescale of the source signals to get a target voice signal. We must adjust the pitch and time according to the age of the target person using the respective values shown in Tabs. 3 and 4. When we hear the output voice samples after the voice conversion, a few samples may lag or be stressed more heavily, as shown in Figs. 8a, 8c, 9b, and 9c. Fine-tuning and adjusting pitch and time scale reduces or eliminates the lag or the overstress in the voice. Moreover, we can fine-tune the spectral-temporal speech features and minimize the error between the original and synthesized samples, so the result is more accurate to hear. Those waveforms are shown in Fig. 11.
Likewise, we can tune and adjust the pitch and timescale in the PSOLA algorithm and include speech features to match those of the target person. We can create a database and validate it, based on perceptions as discussed in Section 3.4. Thus, the resynthesized speech will help to create an individual voice database and make it more realistic to benefit patients with speech disorders.
A perception test [42] was conducted to validate the results of the voice conversion. A total of 20 listeners (10 males, 10 females), all native speakers of British English aged 17–42 years, were recruited to participate in this test. Listeners had no known speaking or hearing impairments. A perception score was used to evaluate the quality of the synthesized voice produced by voice conversion. The perception scores measured the extent to which listeners misjudged sounds. Scores were ranked on a scale from one to five, with five being the best score. The scores of the perception test are provided in Fig. 12. It shows the mean perception scores, the gender of the voice sample, and the correlation between the original and resynthesized samples.
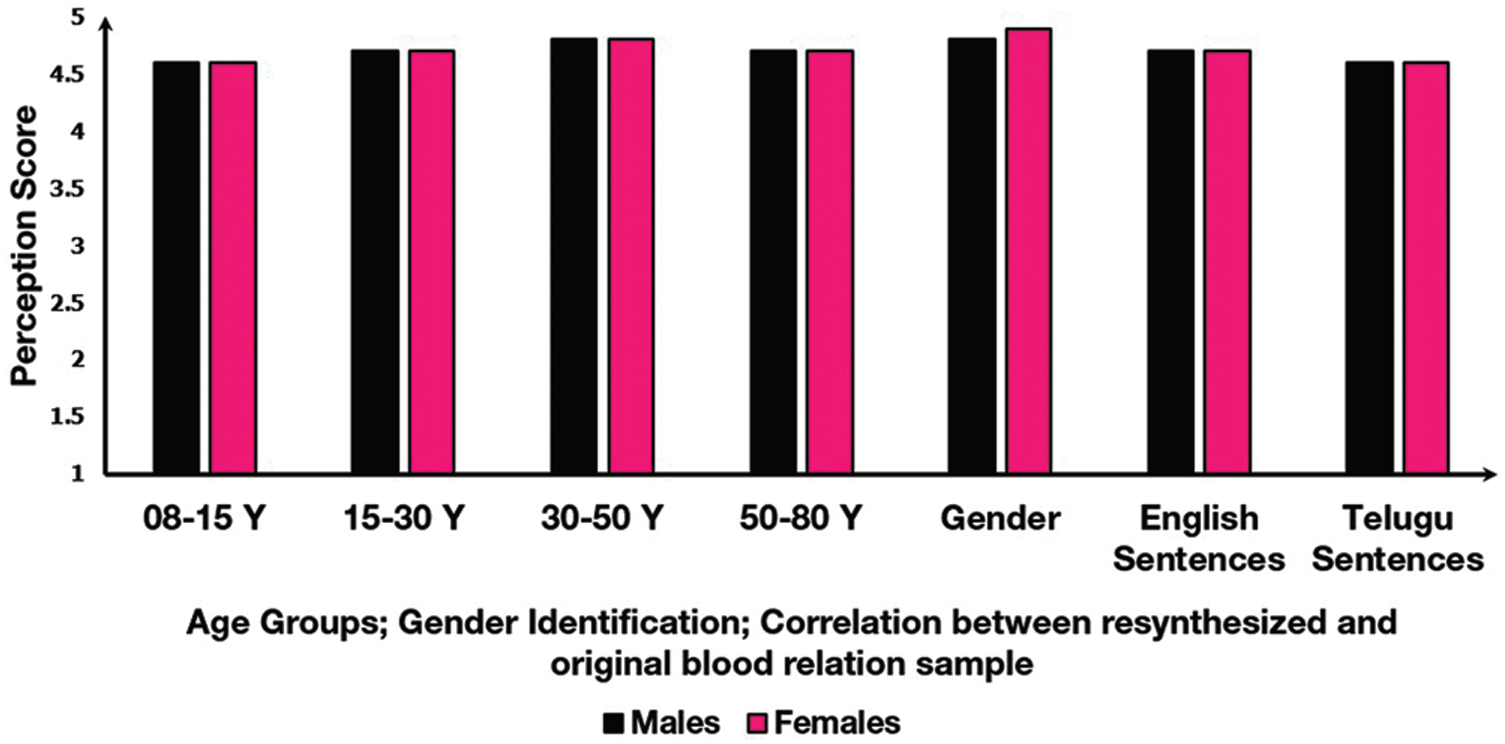
Figure 12: Mean perception scores of age group, gender, and the correlation between original and resynthesized voice sample
The overall performance in speech or voice perception ability for all age groups of listeners was quite good. Approximately 96% accurately identified the gender of the voice sample, and there was 93% accuracy for identifying the age group samples. Accuracy was 94% for identifying the correlation between the original and converted voice samples. The pairs of samples for the age ranges left some listeners confused, so the accuracy was only 93% for identifying the voice samples of the age groups.
This paper presents an approach for automatic voice conversion based on the target person’s age by changing acoustic parameters using voice samples from their blood relatives. This technique makes the target person’s voice more natural, who is disabled. A corpus was created by collecting voice samples from blood relatives from 12 families who recited English and Telugu sentences. There were around 75 speakers aged from 8 to 80 years of age. These voice samples were used for voice conversion using PSOLA and based on the target person’s age. This allowed researchers to change acoustic parameters like pitch, duration, and energy. Then, LBG and KFCG algorithms were used to detect the similarity between the original and converted voice samples. From this experimental study, the vocal tract resonances of members of the same family look very similar. Correlations of ~93% and ~95% were determined using the LBG and KFCG algorithms, respectively. The correlation was strong (~>93%) between voice samples from the same gender (in a given family). It was harder to establish similarity between the voice samples when the speaker was less than 15 years old or more than 75 years old, if they were of different genders, or if they were of the same or different genders from different families. In those cases, the correlations were weak (~<85%). The correlations were classified as either strong or weak using SVM. We concluded that we had implemented a voice conversion system that transforms and synthesizes a source voice (voice samples from blood relatives) to a target voice, based on the characteristics of the target person by changing acoustic parameters. We validated the results by conducting a perception test. Approximately 96%, 93%, and 94% accurately identified the gender of the voice sample, the age group samples, and the correlation between the original and converted voice samples. Thus, the statistical comparisons between the original and the system of resynthesized voice samples showed that it was possible to create an appropriate voice database for the speech-disabled using blood relative samples. Such an approach is superior to using a universal voice database based on languages. In the future, automatic age conversion using blood relations includes emotions that may effectively use by the voice impaired. The work may be extended to the development of a wearable device for real-time speech resynthesis with the age-conversion feature.
Acknowledgement: The authors thank all the participants who enabled us to create and validate this database.
Funding Statement: The authors would like to acknowledge the Ministry of Electronics and Information Technology (MeitY), Government of India for financial support through the scholarship for Palli Padmini, during research work through Visvesvaraya Ph.D. Scheme for Electronics and IT.
Conflicts of Interest: The authors declare that they have no conflicts of interest to report regarding the present study.
1. S. Hartley, “Survey of rehabilitation support for children 0–15 years in a rural part of Kenya,” Disability and Rehabilitation, vol. 36, no. 12, pp. 1033–1041, 2014. [Google Scholar]
2. L. I. Black, A. Vahratian and H. J. Hoffman, “Communication disorders and use of intervention services among children aged 3–17 years: United States,” 2012 NCHS Data Brief, vol. 205, no. 1–8, pp. 1–8, 2015. [Google Scholar]
3. J. Law, J. Boyle, F. Harris, A. Harkness and C. Nye, “Prevalence and natural history of primary speech and language delay: Findings from a systematic review of the literature,” International Journal of Language and Communication Disorders, vol. 35, no. 2, pp. 165–188, 2000. [Google Scholar]
4. L. D. Shriberg, JB. Tomblin and J. L. Mc Sweeny, “Prevalence of speech delay in 6-year-old children and comorbidity with language impairment,” Journal of Speech, Language, and Hearing Research, vol. 42, no. 6, pp. 1461–1481, 1999. [Google Scholar]
5. L. R. Rabiner and B. H. Juang, Fundamentals of Speech Recognition. Englewood Cliffs, NJ: Prentice-Hall, 1993. [Online]. Available at: https://go-pdf.online/fundamentals-of-speech-recognition-l-rabiner.pdf. [Google Scholar]
6. E. A. Goldstein, J. T. Heaton, J. B. Kobler, G. B. Stanley and R. E. Hillman, “Design and implementation of a hands-free electrolarynx device controlled by neck strap muscle electromyographic activity,” IEEE Transactions on Biomedical Engineering, vol. 51, no. 2, pp. 325–332, 2004. [Google Scholar]
7. K. M. Sreehitha and P. Venugopal, “Sign language recognition and translation,” International Journal of Applied Engineering Research, vol. 10, no. 13, pp. 33486–33489, 2015. [Google Scholar]
8. R. Ani, E. Maria, J. J. Joyce, V. Sakkaravarthy and M. A. Raja, “Smart specs: Voice assisted text reading system for visually impaired persons using TTS method,” in Proc. Int. Conf. on Innovations in Green Energy and Healthcare Technologies, Coimbatore, India, pp. 1–6, 2017. [Google Scholar]
9. J. Wang, A. Samal and J. R. Green, “Preliminary test of a real-time, interactive silent speech interface based on electromagnetic articulograph,” in Proc. SLPAT, Batimore, Maryland USA, pp. 38–45, 2014. [Google Scholar]
10. E. C. Lu, T. H. Falk, G. Teachman and T. Chau, “Assessing the viability of a vocal cord vibration switch for four children with multiple disabilities,” The Open Rehabilitation Journal, vol. 3, no. 1, pp. 55–61, 2010. [Google Scholar]
11. H. Rasilo, “Articulatory model for synthesizing sequences of arbitrary speech sounds or pre-programmed Finnish phonemes,” work report, 2012. [Online]. Available: http://users.spa.aalto.fi/hrasilo/. [Google Scholar]
12. J. S. Brumberg, A. Nieto-Castanon, P. R. Kennedy and F. H. Guenther, “Brain-computer interfaces for speech communication,” Speech Communication, vol. 52, no. 4, pp. 367–379, 2010. [Google Scholar]
13. Y. Elsahar, K. Bouazza-Marouf, D. Kerr, A. Gaur, V. Kaushik et al., “Breathing pattern interpretation as an alternative and effective voice communication solution,” Biosensors, vol. 8, no. 2, pp. 48–59, 2018. [Google Scholar]
14. P. Padmini, D. Gupta, M. Zakariah, Y. A. Alotaibi and K. Bhowmick, “A simple speech production system based on formant estimation of a tongue articulatory system using human tongue orientation,” IEEE Access, vol. 9, pp. 4688–4710, 2020. [Google Scholar]
15. Z. W. Shuang, R. Bakis, S. Shechtman, D. Chazan and Y. Qin, “Frequency warping based on mapping formant parameters,” in Proc. INTERSPPECH, Pittsburgh, Pennsylvania, pp. 2290–2293, 2006. [Google Scholar]
16. D. Erro, A. Moreno and A. Bonafonte, “Voice conversion based on weighted frequency warping,” IEEE Transactions on Audio, Speech, and Language Processing, vol. 18, no. 5, pp. 922–931, 2010. [Google Scholar]
17. E. Kim, S. Lee and Y. Oh, “Hidden Markov Model based voice conversion using dynamic characteristics of speaker,” in Proc EUROSPEECH, Rhodes, Greece, pp. 2519–2522, 1997. [Google Scholar]
18. L. Zhang and S. Renals, “Acoustic-articulatory modelling with the trajectory HMM,” IEEE Signal Processing Letters, vol. 15, pp. 245–248, 2008. [Google Scholar]
19. T. Toda, H. Saruwatari and K. Shikano, “Voice conversion algorithm based on gaussian mixture model with dynamic frequency warping of straight spectrum,” in Proc. IEEE Int. Conf. on Acoustics, Speech, and Signal Processing, Salt Lake City, UT, USA, pp. 841–844, 2001. [Google Scholar]
20. T. Toda, A. W. Black and K. Tokuda, “Voice conversion based on maximum-likelihood estimation of spectral parameter trajectory,” IEEE Transactions on Audio, Speech, and Language Processing, vol. 15, no. 8, pp. 2222–2235, 2007. [Google Scholar]
21. R. Takashima, T. Takiguchi and Y. Ariki, “Exemplar-based voice conversion in noisy environment,” in Proc. IEEE Spoken Language Technology Workshop, Miami, FL, USA, pp. 313–317, 2012. [Google Scholar]
22. T. Nakashika, T. Takiguchi and Y. Minami, “Non-parallel training in voice conversion using an adaptive restricted boltzmann machine,” IEEE/ACM Transactions on Audio, Speech, and Language Processing, vol. 24, no. 11, pp. 2032–2045, 2016. [Google Scholar]
23. D. Arfib and V. Verfaille, “Driving pitch-shifting and time-scaling algorithms with adaptive and gestural techniques,” in Proc. DAFX-03, London, UK, pp. 1–6, 2003. [Google Scholar]
24. J. H. Chen and Y. A. Kao, “Pitch marking based on an adaptable filter and a peak-valley estimation method,” Computational Linguistics and Chinese Language Processing, vol. 6, no. 2, pp. 1–12, 2001. [Google Scholar]
25. E. Moulines and F. Charpentier, “Pitch-synchronous waveform processing techniques for text-to-speech synthesis using diphones,” Speech Communication, vol. 9, no. 5–6, pp. 453–467, 1990. [Google Scholar]
26. F. Nolan, K. McDougall and T. Hudson, “Some acoustic correlates of perceived (dis) similarity between same-accent voices,” in Proc. ICPhS, Hong Kong, China, pp. 1506–1509, 2011. [Google Scholar]
27. D. Loakes, “A forensic phonetic investigation into the speech patterns of identical and non-identical twins,” International Journal of Speech Language and the Law, vol. 15, no. 1, pp. 97–100, 2008. [Google Scholar]
28. P. Rose, “Differences and distinguishability in the acoustic characteristics of hello in voices of similar sounding speakers: A forensic phonetic investigation,” Australian Review of Applied Linguistics, vol. 22, no. 1, pp. 1–42, 1999. [Google Scholar]
29. P. Rose and S. Duncan, “Naive auditory identification and discrimination of similar voices by familiar listeners,” Forensic Linguistics, vol. 2, no. 1, pp. 1–17, 1995. [Google Scholar]
30. H. B. Rothman, “A perceptual (aural) and spectrographic identification of talkers with similar sounding voices,” in Proc. Crime Countermeasures-Science and Engineering, Oxford, USA, pp. 37–42, 1977. [Google Scholar]
31. B. E. Walden, A. A. Montgomery, G. J. Gibeily, R. A. Prosek and D. M. Schwartz, “Correlates of psychological dimensions in talker similarity,” Journal of Speech and Hearing Research, vol. 21, no. 2, pp. 265–275, 1978. [Google Scholar]
32. A. Eriksson and P. Wretling, “How flexible is the human voice? A case study of mimicry,” in Proc. EUROSPEECH, Rhodes, Greece, pp. 1043–1046, 1997. [Google Scholar]
33. R. E. Remez, J. M. Fellowes and P. E. Rubin, “Talker identification based on phonetic information,” Journal of Experimental Psychology: Human Perception and Performance, vol. 23, no. 3, pp. 651–666, 1997. [Google Scholar]
34. P. Padmini, S. Tripathi and K. Bhowmick, “Identification of correlation between blood relations using speech signal,” in Proc. SPICES, Kollam, Kerala, India, pp. 1–6, 2017. [Google Scholar]
35. J. S. Pan, Z. M. Lu and S. H. Sun, “An efficient encoding algorithm for vector quantization based on sub vector technique,” IEEE Transactions on Image Processing, vol. 12, no. 3, pp. 265–270, 2003. [Google Scholar]
36. Y. Linde, A. Buzo and R. Gray, “An algorithm for vector quantizer design,” IEEE Transactions on Communications, vol. 28, no. 1, pp. 84–95, 1980. [Google Scholar]
37. R. M. Gray, “Vector quantization,” IEEE ASSP Magazine, vol. 1, no. 2, pp. 4–29, 1984. [Google Scholar]
38. H. B. Kekre, T. K. Sarode and S. D. Thepade, “Image retrieval by Kekre’s transform applied on each row of Walsh transformed VQ codebook,” in Proc. ICWET, Mumbai, Maharashtra, India, pp. 127–133, 2010. [Google Scholar]
39. A. I. Al-Shoshan, “Speech and music classification and separation: A review,” Journal of King Saud University-Engineering Sciences, vol. 19, no. 1, pp. 95–132, 2006. [Google Scholar]
40. M. A. Mohammed, K. H. Abdulkareem, B. Garcia-Zapirain, S. A. Mostafa, M. S. Maashi et al., “A comprehensive investigation of machine learning feature extraction and classification methods for automated diagnosis of covid-19 based on x-ray images,” Computers, Materials & Continua, vol. 66, no. 3, pp. 3289–3310, 2021. [Google Scholar]
41. A. Botchkarev, “A new typology design of performance metrics to measure errors in machine learning regression algorithms,” Interdisciplinary Journal of Information, Knowledge Management, vol. 14, pp. 45–79, 2019. [Google Scholar]
42. V. B. Queiroz, N. E. Zamberlan-Amorim, K. J. Pinotti, E. A. da Silva Lizzi and A. C. M. B. Reis, “Speech perception test with pictures: Applicability in children with hearing impairment,” Revista CEFAC, vol. 19, no. 2, pp. 180–188, 2017. [Google Scholar]
 | This work is licensed under a Creative Commons Attribution 4.0 International License, which permits unrestricted use, distribution, and reproduction in any medium, provided the original work is properly cited. |