DOI:10.32604/cmc.2022.020059
| Computers, Materials & Continua DOI:10.32604/cmc.2022.020059 | |
| Article |
Enhanced Detection of Glaucoma on Ensemble Convolutional Neural Network for Clinical Informatics
1Department of Computer Science and Engineering, IFET College of Engineering, Villupuram, 605108, Tamil Nadu, India
2Department of Computer Science Engineering, DMI St. John the Baptist University, Mangochi, Lilongwe, Malawi
3Department of Information Technology, CMR Engineering College (Autonomous), Hyderabad, 501401, Telangana, India
4Department of Computer Science and Engineering, Kongu Engineering College, Perundurai, 638060, Tamil Nadu, India
5Department of Mathematics, Jaypee University of Engineering and Technology, Guna, 473226, Madhya Pradesh, India
6Department of Computer Science and Engineering, Swami Keshvanand Institute of Technology, Management & Gramothan (SKIT), Jaipur, 302017, Rajasthan, India
7Department of Computer Science and Engineering, PSN College of Engineering and Technology, Tirunelveli, 627152, Tamil Nadu, India
*Corresponding Author: D. Stalin David. Email: stalindavidcse@gmail.com
Received: 07 May 2021; Accepted: 17 June 2021
Abstract: Irretrievable loss of vision is the predominant result of Glaucoma in the retina. Recently, multiple approaches have paid attention to the automatic detection of glaucoma on fundus images. Due to the interlace of blood vessels and the herculean task involved in glaucoma detection, the exactly affected site of the optic disc of whether small or big size cup, is deemed challenging. Spatially Based Ellipse Fitting Curve Model (SBEFCM) classification is suggested based on the Ensemble for a reliable diagnosis of Glaucoma in the Optic Cup (OC) and Optic Disc (OD) boundary correspondingly. This research deploys the Ensemble Convolutional Neural Network (CNN) classification for classifying Glaucoma or Diabetes Retinopathy (DR). The detection of the boundary between the OC and the OD is performed by the SBEFCM, which is the latest weighted ellipse fitting model. The SBEFCM that enhances and widens the multi-ellipse fitting technique is proposed here. There is a pre-processing of input fundus image besides segmentation of blood vessels to avoid interlacing surrounding tissues and blood vessels. The ascertaining of OC and OD boundary, which characterized many output factors for glaucoma detection, has been developed by Ensemble CNN classification, which includes detecting sensitivity, specificity, precision, and Area Under the receiver operating characteristic Curve (AUC) values accurately by an innovative SBEFCM. In terms of contrast, the proposed Ensemble CNN significantly outperformed the current methods.
Keywords: Glaucoma and diabetic retinopathy detection; ensemble convolutional neural network; spatially based ellipse fitting curve; optic disk; optic cup
The diagnostic speed is optimized, and computer-aided diagnostics assist the location of a specific area. The damage of blood vessels by prolonged Diabetes mellitus causes Diabetic Retinopathy (DR), affecting the eye’s (retina) rear side. The retina produces new and abnormal blood vessels. If there is a growth of blood vessels on the iris, then eyes are blocked by fluid flows and high pressure in the eyes, indicating Neo-vascular Glaucoma. Glaucoma Detection (CD) is very challenging since there will not be any pains or symptoms, and the vision is also normal at the initial stage. Only in the advanced stage will patients lose 70.19% of their vision. Therefore, it is inevitable to do periodical screening of the eye to detect glaucoma early. Ophthalmologists extensively use Fundus photography for DR detection [1].
For medical diagnosis, it is very common to follow the following three components pre-processing, selection of feature, and classification of disease. The exact localization of the damaged OD and either the too large or small-sized cup are the challenging aspects in GD. As shown in Fig. 1, various clinical features like Micro Aneurysms (MA), Hard and Soft exudates, and haemorrhages are found in DR. Thus, feature extraction is believed to be in GD a significant part [2]. About the ischemic change and vessel degeneration, the DR classification is named Proliferative Diabetic Retinopathy (PDR) and Non-Proliferative Diabetic Retinopathy (NPDR). While mild (MA’s existence), moderate and acute stages are the sub-categories of NPDR, DR is Proliferative Diabetic Retinopathy (PDR) advanced stage. Since the blood vessels are interconnected, optic cup boundary extraction is believed to be a complex task [3,4].

Figure 1: (a) Retina’s anatomical, (b) mild, (c) moderate, and (d) severe glaucoma
Previous research implements ground-breaking techniques such as Particle Swarm Optimization and enhanced ensemble Deep CNN to segment OD incorporating retinal images. The ensemble segmentation technique overcomes directly connected bias [5]. The spatial-aware joint image segmentation solves the dual issues of the optic nerve head, such as vessel variant spatial layout and small-sized spatially sparse OC boundaries [6]. The optic nerve head multi-indices are measured by Multitasking Collaborative Learning Network (MCL-Net) because of the noticeable difference between extremely poor contrast amidst optic head regions and substantial overlap. However, identifying OC/OD boundary with indistinct Glaucoma fundus is difficult [7]. Creating a one-stage multi-label model resolves OC and OD segmentation problems using a multi-label Deep Learning (DL) framework viz., M-Net. When comparing to horizontal, vertical OD and OC achieved greater accuracy [8]. However, due to the small data size of DL techniques, they are usually not used for glaucoma assessment for medical image analysis. Therefore, the Retinal Fundus Glaucoma (REFUGE) challenge that contains 1200 fundus images in vast data resolved this problem.
There has been the performance of two initial tasks viz., OD/OC segmentation and Glaucoma classification [9]. For incorporating optic disc boundary and integration of global fundus pertained to the profound hierarchical context, a DL model based on the Disc-aware Ensemble Network (DENet)-disc aware ensemble network was further developed. Moreover, even in the absence of segmentation, the DENet enables accurate GD [10]. There is a possibility of non-direct segmentation of the OD and OC. Therefore, similar to adorned ellipses within the boxes, there is a detection and evaluation of OD and OC of minimum bounding boxes. The OD and OC boundary box detection process uses joint Region-Based Convolutional Neural networks (RCNN) viz., Faster RCNN [11]. Thus, with an innovative CNN-based Weakly Supervised Multitask Learning, Weekly Supervised Multitask Learning (WSMTL) multi-scale fundus image representation was implemented.
The classification is performed on binary diagnosis core features such as pixel-level proof map, diagnosis prediction, segmentation mask, and normal or Glaucoma [12]. Glaucoma is the second foremost reason for blindness. A user-friendly app called Yanbao was developed for premium-quality Glaucoma screening [13–16]. The critical problems inside the retinal imageries are supposed to be complicated blood vessel structure and acute intensified similarity. The Locally Statistical Active Contour Model (LSACM) overcomes it. LSACM integrates the multi-dimensional features-based probability information. The retinal disease such as Glaucoma, macular degeneration, and DR in fundus images are detected early using the crucial step of optic disc segmentation and localization. For OD segmentation, a new CNN is used for this process [17]. The two classical Mask Region-Based Convolutional Neural Networks (R-CNN) were generated to enhance optic nerve head and OD/OC segmentation in retinal fundus images. This study invented an advanced technique by cropping output in association with actual training imageries through different scales–vertical OC to OD proportion computed for diagnosis of glaucoma, to enhance the detection [18–20].
The issue of OD segmentation in retinal fundus imageries is the source of the issue of regional classification with the aid of a systematic classification pipeline. The area surrounding the image is characterized in a classification framework using textural and statistical properties, and thus contrary to the OD localization analogous to multi-layered challenges, this technique is potential [21]. The semantic segmentation is done using the Densely Connected Convolutional Network (Dense-Net) incorporated with a completely convolutional network named Fully Convolutional Dense Network (FC-Dense-Net) designed for it. Hence, in this study, the performance of OD and OC automatic segmentation was done with effectiveness. The automated classification results are enhanced into disc ratio and horizontal OC to OD ratio by the vertical OD/OC.
The complete profile of OD is, however, used to enhance the diagnosed results [22]. Because of the vessel's presence, OD segmentation challenges occur, and it is likely to be overcome using pre-processing techniques. Morphological operations like closing and opening or histogram equalization are used in this technique. Nevertheless, OC segmentation challenges are comparatively complicated than OD due to the optic cup interlacing with neighboring tissues and blood vessels. Therefore, for an exact diagnosis of glaucoma, improved segmentation techniques are inevitable [23]. The precision of glaucoma diagnosis is enhanced using various images. However, only some filters have been trained as the whole potential is not achieved. It results in an unassured state of not capturing every variable of retinal imageries from the give images [24]. The intensity and texture-based feature extraction method mines specific features, which are then classified using Magnetic Resonance Imaging (MRI) and Support-Vector Machine (SVM) performance [25]. In order to bring the possible outcome that ascertains the association among the attributes, an appropriate classifier algorithm is required [26–30]. The SVM based on the Radial Basis Function (RVF) Kernel is used to develop the other multiclass lesion classification system, and the lesions are classified into normal and abnormal classes using a hybrid color image structure descriptor retinal images [31–35].
The complexity of OC boundary extraction caused due to the interweaving of blood vessels is the challenging thing found in the existing studies. Usually, pre-processing, selection of features, and classification of disease are adopted in medical diagnosis. In this research work, the exact localization of the damaged OD depending on the too small or large cup is the greatest challenge in detecting glaucoma. The proposed Ensemble classification includes an SBEFCM that overcomes these challenges. The following are the key findings of the research: To accomplish OD and OC using the SBEFCM algorithm accurately.
• The SBEFCM algorithm is used to detect DR or Glaucoma in retinal images.
• To integrate the current methodological approach with new methods and tools.
The recommended Ensemble CNN classification with SBEFCM is described in Section 2, succeeded by assessing and relating it with other techniques exhibited in Section 3. Lastly, in Section 4, the paper Concluded.
The Glaucoma method is implemented by Ensemble CNN classification in this research work. In addition, a new spatially weighted ellipse fitting model detects the OD and OC boundaries. Formerly, pre-processing was done on the input fundus image, and interweavement with neighbouring tissues and blood vessels is prevented by performing blood vessel segmentation. Fig. 2 shows the overall flow of the proposed system:

Figure 2: Flow chart for detection of glaucoma and study
Low-intensity false regions are the form of the actual input fundus image. Transformation of the image into a domain is included in the denoising technique, where the threshold enhances easy noise recognition. The inverted change is employed to rebuild the denoise. Therefore, denoising the image that preserves the vessel edges is inevitable to eliminate the false regions [36–39].
The fixed threshold scheme is used to mine the vascular structure. The decision variable is described as a specific constant in this scheme for segmentation. The acquirement of the binary image
Every given dataset image has a fixed threshold parameter value, and variation is shown from dataset to dataset. Many threshold value selections make the selection of threshold on the individual datasets about accuracy evaluation. The last threshold produces greater accuracy on the given dataset.
Removing spur pixels, gap filling, and area filtering are the three post-processing operations applied to enhance system performance. Removal of minor remote and inevitable areas inappropriate to the vessel's structure is done by the area filtering operation. The first labeling of pixels into components is obtained using Connected Component Analysis based on 8-way pixel connectivity. Then, its classification as vessel/non-vessel is done by measuring each labeled component area. Next, the spur pixels are removed at vessel structure edges. Finally, morphological closing operation based on disk type structuring is applied to fill small gaps.
2.2 Spatially Based Ellipse Fitting Curve Model
The multi-ellipse fitting technique is optimized and prolonged by the proposed SBEFCM. The Two-Dimensional (2D) shape is characterized by the binary image
Moreover, single Area
Ellipses E is the basis of 2D points shape of a percentage
Equality holding is defined as pairwise disjoint in the case of
The Akaike Information Criterion (AIC) trades-off among the shape coverage
Subconsciously, more balance is obtained among the shape coverage, and with improved model complexity, many ellipses are used for a few shape approximations. The invariant for translation measures the model selection process and shape complexity, and because the resolution/quantization problems make modifications in scale, it affects the shape rotation mildly.
Spatially Based Ellipse Fitting Curve Model Algorithm
The multi-ellipse fitting method and SBEFCM functions are very similar, and it is summarized in the following:
(a) Skeleton Extraction: Primarily, the 2D calculation of medial/skeleton shape
(b) Normalization of Ellipse Hypotheses: The circles set Cluster Circle (CC) used as ellipse hypotheses are defined by SBEFCM. The CC is placed on S, and CC radii are explained from the shape contour by centers of minimum distance. The circles are focused on CC inclusion in a descending order based on the radius. Firstly,
(c) Ellipse Hypotheses Evolution: To calculate the predetermined ellipse parameters in E with a 2D shape , the Gaussian Mixture Model Expectation-Maximization technique is deployed. This is achieved in two steps: (1) Allocating ellipses with shape points and (2) Assessing the parameter of the ellipse.
• Allocating Shape Point to Ellipses: When ‘t’ is within that ellipse, then allocate point t to an ellipse
where,
From Eq. (8), it is understood that
• Estimating the Ellipse Parameters: As shown in the assignment step, the moments of second-order points related to the earlier ellipse, the ellipse parameters
(d) An Optimal Number of Ellipses Solving: Numerous models are assessed based on the AIC criterion explained above that equates the trade-off among approximation error and model complexity. SBEFCM that minimizes the number of ellipses reduces the AIC criterion from a huge description of the automatic settings. Because there is no lesser bound on AIC, the number of ellipses is minimized. This process continues until the ellipses get a single ellipse. In every iteration, an ellipse pair is chosen and represented for merging them. The multi-ellipse fitting method is considered to merge parallel ellipses. To merge, nonetheless, SBEFCM is considered any ellipses pair. The last merged pair leads to the lowest AIC. From all the likely models, SBEFCM reported a final solution with reduced AIC.
(e) Spurious Solutions are Forbidden: The points percentage united the remaining overlapped ellipses is the definition of overlap ratio for
A predefined threshold

Figure 3: (a) 2D shape (b) Ellipses E1, E2, and E3
The computational complexity of the multi-ellipse fitting method is analogous to SBEFCM, as same as (r2f). F and r = |RR| are the number of foreground pixels that determine the number of circles, which develops the hypotheses of ellipses primarily demonstrating the 2-D shape. The Bradley segmentation technique and hole filling method are the first steps in the proposed approach. Better results are achieved through the image smoothing technique, for example, before the Gaussian filter
• (Shape) Area constraint–The anticipated area of each disc scale above the minimum threshold
• (Shape) The disc-shaped circular or elliptically shaped objects eliminate the complex shape objects that digress substantially for roundness constraint. The Roundness measure R shows the shape resemblance, and Eq. (10) expresses this.
where the area and perimeter of an object are defined as
(f) Constraints of Intensity: For the prohibition of many false positives, the previously mentioned shape constraints are adequate. The various constraints based on intensity do not accustom with restrictions based on the prohibition of false positives. This perception on constraints is that the intensity distribution inside the left-over cells is the same as intensity distribution inside the cell. Standard distribution assumption based on two-intensity distribution’s distance is measured using the Bhattacharyya distance.
The proposed constraints prohibit the four false positives.
2.3.1 The framework of SBEFCM Ensemble
Ensemble's proposed framework is CNN, referred to as pipelines when simulated multiple times. Each one has been trained on a subset of class labels with a change of evaluation metrics. The subset of the dataset is otherwise the subset of classes/labels. These characteristically trained subsets are mutually exclusive. The main benefit for huge datasets with CNN training is perceived as multifold, whereas less time is taken for training on a subset of classes that do not include high-version Graphics Processing Unit (GPU) requirements. Initially, in Fig. 4, the transfer learning process shows all the properties while the new model received the primary weights from the trained Deep Convolutional Neural Networks (AlexNet). All classes contribute to selecting reference images, and Hierarchical agglomerative clustering is contained in identical image grouping. Based on this grouping offered to the network post-training stage, mutually exclusive subsets are produced.
(a) Transfer of Learning: By moving to the latest network training, the AlexNet model on ImageNet effectively learned mid-level representation of the feature. The extended attributes or mid-level attributes are captured in the first 7 layers. The primary Conv layer to the following associated layer is described. These layers’ learned weights are used in the out model, and during the training, it is left un-updated and kept constant. To the ImageNet, the source task’s classifier and final associated layer FC8 are more specific; it is prohibited. If the novel Fully-Connected 8 is included, followed by the Softmax classifier, it should be retrained.

Figure 4: SBEFCM for classification of retinal images
(b) Ensemble Training: In an ensemble model, the classes next to the clustering are given as input variables to each pipeline. CNN frequently tested on GPUs. Nonetheless, in the absence of a GPU, the experiment was performed with input values such as 10 testing data and 50 training data trained for 15 epochs with 10 batch sizes and a learning rate of 0.03. An activation function is nothing but the Rectified Linear Unit (ReLU), as shown in Eq. (12)
The primary convolution function is given in Eq. (13) if the input image is I(x,y) and the filter is wf [p,q]
With variations in parameters, the same number of pipelines structured in the ensemble is trained on the entire dataset for the comparative study. The errors of Top-1 and Top-5 are measured. In the training phase, both metrics are reduced.


The test image and the pipelines provided by the assumption have learned the characteristics accurately and tracked them with higher feasibility of inappropriate classification channels.
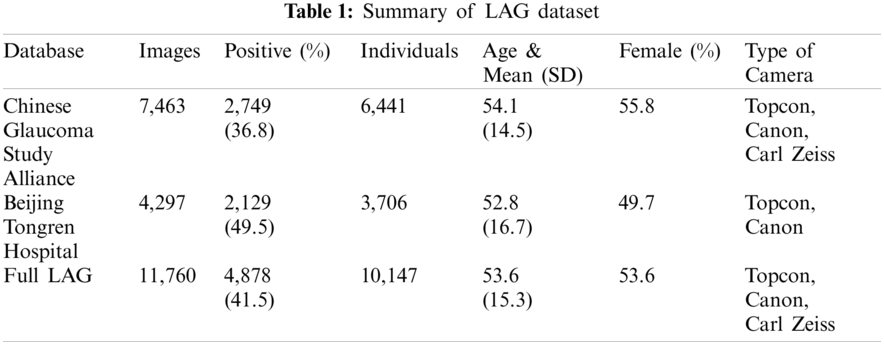
This proposed study used the Large-scale Attention-based Glaucoma (LAG) database and Retinal IMage database for the Optic Nerve Evaluation (RIM-ONE) database to detect glaucoma. As shown in Tab. 1, the LAG database contains 11,760 fundus images, 4,878 positive, and 6,882 negative glaucoma images. Thus, 10,861 samples exist in the LAG database. From 10,147 individuals, only one fundus image is collected (one image per eye and subject), and the remaining individuals are identical to multiple images per subject. The Beijing Tongren Hospital and the Chinese Glaucoma Study Alliance (CGSA) are the sources of fundus images. In utilizing the proposed techniques, the capacity of treatment and finding of intimidating eye diseases with Glaucoma has been enhanced.
The analysis f the proposed method on the rest of the open database, such as RIM-ONE, focuses on the Open Nerve Evaluation (ONH), producing 169 high-resolution imageries. The apt abnormalities were detected with the help of highly proper segmentation algorithms. At last, a lot of public and private resources across the hospitals supplied the local glaucoma dataset images. A total of 1338 retinal images constitute the dataset. One of four classes is appropriated with every image: Normal, Early, Moderate, and Advanced Glaucoma. 79% of images have consisted in this kind of data, and 21% of images are presented in the remaining three classes. Thus, 79.08% images, 8.86% early glaucoma images, 5.98% of moderate glaucoma, and 5.98% of advanced glaucoma are presented with no glaucoma/standard images.
Several performance measures’ values such as Accuracy, Sensitivity, Specificity, and Area Under the Curve (AUC) are calculated by performing Performance analysis.
(a) Accuracy: For the shared values, the metrics are Accuracy, and it is given the name of weighted arithmetic mean, and it is deemed the reverse value of the correct value. Using the formula given in Eq. (14), the accuracy can be calculated.
(b) Sensitivity : The TP Ratio to the total of True Positive (TP) and False Negative (FN) is Sensitivity. The following formula in Eq. (15) is used to calculate the value of Sensitivity:
(c) Specificity: Specificity defines the proportion of negatives that are identified accurately. It is the TN ratio to the total of True Negative (TN) and False Positive (FP), and it’s signified as an FP/TN ratio. The following formula in Eq. (16) is used to do the calculation.
(d) Area Under Curve (AUC): Trapezoidal approximation is used to measure the AUC
Eq. (17) can be used to express AUC.
4 Results of Glaucoma Detection Methods
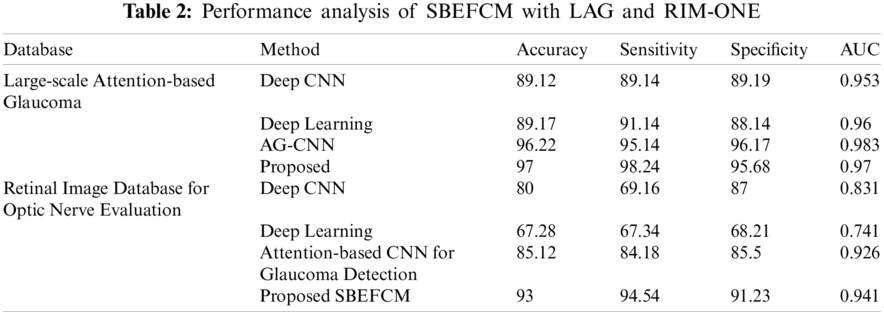
Innumerable methods are used to evaluate the severity of Glaucoma detection comparatively. Using the LAG, RIM-ONE, the analogy was carried out. The following Tab. 2 illustrated the proposed glaucoma detection’s Sensitivity, Specificity, Accuracy, and AUC result associated with the existing methods. The proposed SBEFCM’s performance with the LAG dataset revealed an accuracy of 97%, a sensitivity of 94.44%, a specificity of 91.30%, and an AUC of 0.941 AUC glaucoma detection retinal images. In the glaucoma detection of retinal images, contrarily, the RIM-ONE shows the Accuracy of 93%, the Sensitivity of 94.44%, Specificity of 91.30% Specificity, and AUC of 0.941. As the table shows, rather than deep CNN, another prevailing method, the proposed Ensemble classification with SBEFCM achieved better. The Sensitivity ratio is greater than the Specificity ratio. There is a result of larger AUC when compared with existing methods. In all metrics, the LAG database displays greater values compared to the RIM-ONE dataset. As other indicators like the field of vision and intraocular pressure authorized glaucoma diagnosis, the sensitivity metric is crucial. It demonstrated the results of high generalization ability. As the performance of the existing method demonstrates the overfitting issue, it is highly degradable [26].
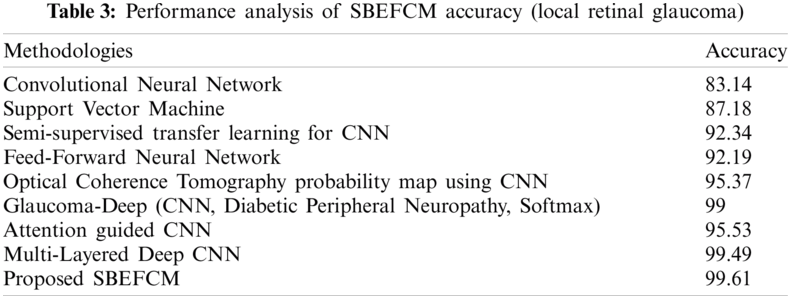
Using local retinal glaucoma datasets, the accuracy of the proposed method’s classification results and their analogy with other prevailing methods are shown in Tab. 3. Better statistical values are shown in the proposed Ensemble-based classification with the SBEFCM algorithm than the existing methodologies for GD. Hence, the proposed SBEFCM produced an accuracy of 99.57% in the detection of glaucoma.
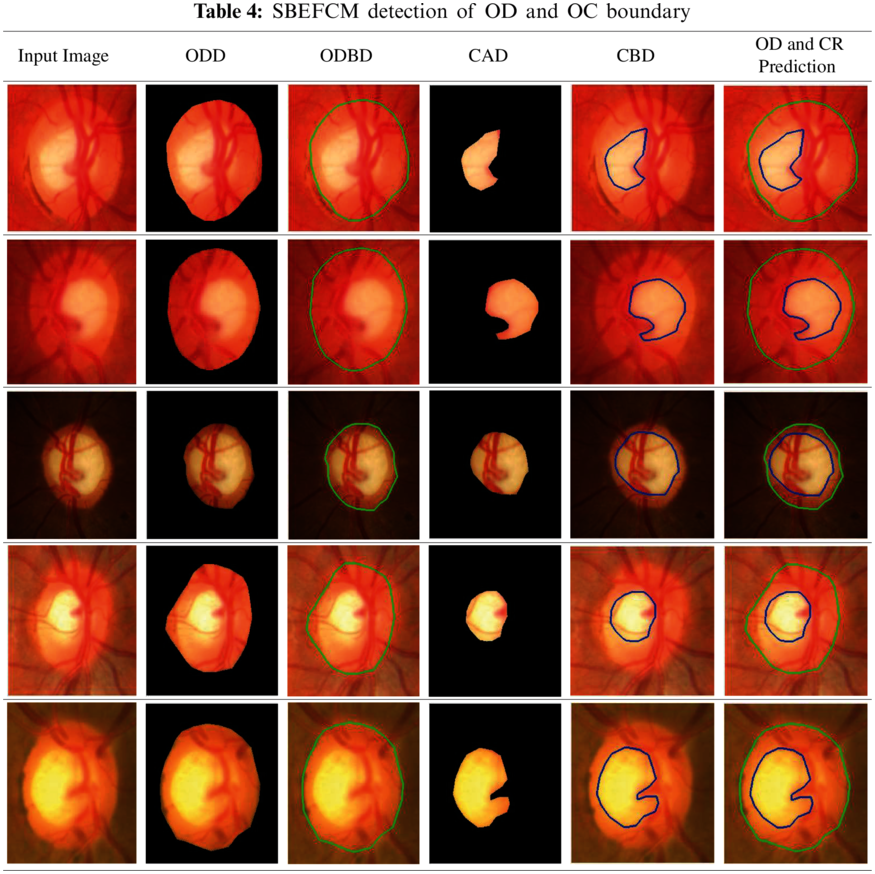
Tab. 4 shows the precise detection of the input sample images, the optic disc OC, and the Optic Boundary OD. The proposed SBEFCM accurately predicts the OC and OD boundary prediction ratios.
An innovative segmentation method named the Spatially Based Ellipse Fitting Curve Model used in this proposed study detects the OC and OD boundary more precisely. Moreover, the Ensemble-based CNN classification detects the intensity of Glaucoma for apt prediction. In the multi-ellipse fitting method, which is as same as the SBEFCM, spurious solutions are forbidden. The ensemble framework with the same number of pipelines is trained for the comparative study on the complete dataset with parametric variations. Better statistical values like Accuracy, Specificity, Sensitivity and AUC are achieved in the proposed method. The Large-scale Attention-based Glaucoma dataset exhibits greater values than the Retinal Image database for the Optic Nerve Evaluation dataset. Based on this proposed algorithm, DR is classified for future development in the aspects of its mild, moderate, and severe PDR and NPDR.
Funding Statement: The authors received no specific funding for this study
Conflicts of Interest: The authors declare that they have no conflicts of interest to report regarding the present study
1. R. Harini and N. Sheela, “Feature extraction and classification of retinal images for automated detection of Diabetic,” in Retinopathy,2nd IEEE Int. Conf. on Cognitive Computing and Information Processing (CCIP) 12–13 Aug. 2016, Mysuru, India, pp. 1–4, 2016. [Google Scholar]
2. N. Salamat, M. M. S. Missen and A. Rashid, “Diabetic retinopathy techniques in retinal images: A review,” Artificial Intelligence in Medicine, vol. 97, no. Suppl. C, pp. 168–188, 2019. [Google Scholar]
3. I. Qureshi, J. Ma and Q. Abbas, “Recent development on detection methods for the diagnosis of diabetic retinopathy,” Symmetry, vol. 11, no. 6, pp. 749, 2019. [Google Scholar]
4. I. Qureshi, “Glaucoma detection in retinal images using image processing techniques: A survey,” International Journal of Advanced Networking and Applications, vol. 7, pp. 2705, 2015. [Google Scholar]
5. L. Zhang and C. P. Lim, “Intelligent optic disc segmentation using improved particle swarm optimization and evolving ensemble models,” Applied Soft Computing, vol. 93, pp. 106328, 2020. [Google Scholar]
6. Q. Liu, X. Hong, S. Li, Z. Chen, G. Zhao et al., “A spatial-aware joint optic disc and cup segmentation method,” Neurocomputing, vol. 359, no. 4, pp. 285–297, 2019. [Google Scholar]
7. R. Zhao and S. Li, “Multi-indices quantification of optic nerve head in fundus image via multitask collaborative learning,” Medical Image Analysis, vol. 60, no. 6, pp. 101593, 2020. [Google Scholar]
8. H. Fu, J. Cheng, Y. Xu, D. W. K. Wong, J. Liu et al., “Joint optic disc and cup segmentation based on multi-label deep network and polar transformation,” IEEE Transactions on Medical Imaging, vol. 37, no. 7, pp. 1597–1605, 2018. [Google Scholar]
9. J. I. Orlando, H. Fu, J. B. Breda, K. Van Keer, D. R. Bathula et al., “Refuge challenge: A unified framework for evaluating automated methods for glaucoma assessment from fundus photographs,” Medical Image Analysis, vol. 59, no. 1, pp. 101570, 2020. [Google Scholar]
10. H. Fu, J. Cheng, Y. Xu and J. Liu, “Glaucoma detection based on deep learning network in fundus image,” in Deep Learning and Convolutional Neural Networks for Medical Imaging and Clinical Informatics, Cham: Springer, pp. 119–137, 2019. https://doi.org/10.1007/978-3-030-13969-8_6. [Google Scholar]
11. Y. Jiang, L. Duan, J. Cheng, Z. Gu, H. Xia et al., “Jointrcnn: A region-based convolutional neural network for optic disc and cup segmentation,” IEEE Transactions on Biomedical Engineering, vol. 67, no. 2, pp. 335–343, 2019. [Google Scholar]
12. R. Zhao, W. Liao, B. Zou, Z. Chen and S. Li, “Weakly supervised simultaneous evidence identification and segmentation for automated glaucoma diagnosis,” Proceedings of the AAAI Conference on Artificial Intelligence, vol. 33, no. 1, pp. 809–816, 2019. [Google Scholar]
13. F. Guo, Y. Mai, X. Zhao, X. Duan, Z. Fan et al., “Yanbao: A mobile app using the measurement of clinical parameters for glaucoma screening,” IEEE Access, vol. 6, pp. 77414–77428, 2018. [Google Scholar]
14. Y. Gao, X. Yu, C. Wu, W. Zhou, X. Wang et al., “Accurate and efficient segmentation of optic disc and optic cup in retinal images integrating multi-view information,” IEEE Access, vol. 7, pp. 148183–148197, 2019. [Google Scholar]
15. B. J. Bhatkalkar, D. R. Reddy, S. Prabhu and S. V. Bhandary, “Improving the performance of convolutional neural network for the segmentation of optic disc in fundus images using attention gates and conditional random fields,” IEEE Access, vol. 8, pp. 29299–29310, 2020. [Google Scholar]
16. H. Almubarak, Y. Bazi and N. Alajlan, “Two-Stage mask-RCNN approach for detecting and segmenting the optic nerve head, optic disc, and optic cup in fundus images,” Applied Sciences, vol. 10, p. 3833, 2020. [Google Scholar]
17. Z. U. Rehman, S. S. Naqvi, T. M. Khan, M. Arsalan, M. A. Khan et al., “Multi-parametric optic disc segmentation using super-pixel-based feature classification,” Expert Systems with Applications, vol. 120, no. 11, pp. 461–473, 2019. [Google Scholar]
18. B. Al-Bander, B. M. Williams, W. Al-Nuaimy, M. A. Al-Taee, H. Pratt et al., “Dense fully convolutional segmentation of the optic disc and cup in colour fundus for glaucoma diagnosis,” Symmetry, vol. 10, no. 4, pp. 87, 2018. [Google Scholar]
19. N. Thakur and M. Juneja, “Survey on segmentation and classification approaches of optic cup and optic disc for diagnosis of glaucoma,” Biomedical Signal Processing and Control, vol. 42, no. 1, pp. 162–189, 2018. [Google Scholar]
20. J. Zilly, J. M. Buhmann and D. Mahapatra, “Glaucoma detection using entropy sampling and ensemble learning for automatic optic cup and disc segmentation,” Computerized Medical Imaging and Graphics, vol. 55, no. 11, pp. 28–41, 2017. [Google Scholar]
21. M. D. S. David and A. Jayachandran, “Robust classification of brain tumor in MRI images using salient structure descriptor and RBF kernel-SVM,” Journal of Graphic Technology, vol. 14, pp. 718–737, 2018. [Google Scholar]
22. D. S. David, “Parasagittal meningioma brain tumor classification system based on MRI images and multi-Phase level set formulation,” Biomedical and Pharmacology Journal, vol. 12, no. 2, pp. 939–946, 2019. [Google Scholar]
23. D. S. David and A. Jeyachandran, “A comprehensive survey of security mechanisms in healthcare applications,” in Int. Conf. on Communication and Electronics Systems, Coimbatore, India, pp. 1–6, 2016. [Google Scholar]
24. A. Jayachandran and D. S. David, “Textures and intensity histogram-based retinal image classification system using hybrid colour structure descriptor,” Biomedical and Pharmacology Journal, vol. 11, no. 1, pp. 577–582, 2018. [Google Scholar]
25. D. S. David and A. Jayachandran, “A new expert system based on hybrid colour and structure descriptor and machine learning algorithms for early glaucoma diagnosis,” Multimedia Tools and Applications, vol. 79, no. 7–8, pp. 5213–5224, 2020. [Google Scholar]
26. L. Li, M. Xu, H. Liu, Y. Li, X. Wang et al., “A large-scale database and a CNN model for attention-based glaucoma detection,” IEEE Transactions on Medical Imaging, vol. 39, no. 2, pp. 413–424, 2019. [Google Scholar]
27. M. Aamir, M. Irfan, T. Ali, G. Ali, A. Shaf et al., “An adoptive threshold-based multi-level deep convolutional neural network for glaucoma eye disease detection and classification,” Diagnostics, vol. 10, no. 8, pp. 602, 2020. [Google Scholar]
28. A. Onan, S. Korukoglu and H. Bulut, “Ensemble of keyword extraction methods and classifiers in text classification,” Expert Systems with Applications, vol. 57, no. 8, pp. 232–247, 2016. [Google Scholar]
29. A. Onan and S. Korukoglu, “A feature selection model based on genetic rank aggregation for text sentiment classification,” Journal of Information Science, vol. 43, no. 1, pp. 25–38, 2017. [Google Scholar]
30. A. Onan, “Classifier and feature set ensembles for web page classification,” Journal of Information Science, vol. 42, no. 2, pp. 150–165, 2016. [Google Scholar]
31. A. Onan, “Two-stage topic extraction model for bibliometric data analysis based on word embeddings and clustering,” IEEE Access, vol. 7, pp. 145614–145633, 2019. [Google Scholar]
32. A. Onan, “An ensemble scheme based on language function analysis and feature engineering for text genre classification,” Journal of Information Science, vol. 44, no. 1, pp. 28–47, 2018. [Google Scholar]
33. A. Onan, “Mining opinions from instructor evaluation reviews: A deep learning approach,” Computer Applications in Engineering Education, vol. 28, no. 1, pp. 117–138, 2020. [Google Scholar]
34. A. Onan, S. Korukoglu and H. Bulut, “LDA-based topic modelling in text sentiment classification: An empirical analysis,” International Journal of Computational Linguistics and Applications, vol. 7, no. 1, pp. 101–119, 2016. [Google Scholar]
35. A. Onan, “Sentiment analysis on product reviews based on weighted word embeddings and deep neural networks,” Concurrency and Computation: Practice and Experience, vol. 12, no. 5, pp. e5909, 2020. [Google Scholar]
36. A. Onan, “Sentiment analysis on massive open online course evaluations: A text mining and deep learning approach,” Computer Applications in Engineering Education, vol. 29, pp. 1–18, 2020. [Google Scholar]
37. A. Onan, “Hybrid supervised clustering-based ensemble scheme for text classification,” Kybernetes, vol. 46, no. 2, pp. 330–348, 2017. [Google Scholar]
38. A. Onan, “A k-medoids based clustering scheme with an application to document clustering,” in IEEE-Int. Conf. on Computer Science and Engineering (UBMKAntalya, Turkey, pp. 354–359, 2017. [Google Scholar]
39. A. Onan, S. Korukoglu and H. Bulut, “A multi-objective weighted voting ensemble classifier based on differential evolution algorithm for text sentiment classification,” Expert Systems with Applications, vol. 62, no. 21, pp. 1–16, 2016. [Google Scholar]
 | This work is licensed under a Creative Commons Attribution 4.0 International License, which permits unrestricted use, distribution, and reproduction in any medium, provided the original work is properly cited. |