DOI:10.32604/cmc.2022.019869
| Computers, Materials & Continua DOI:10.32604/cmc.2022.019869 | |
| Article |
Methods for the Efficient Energy Management in a Smart Mini Greenhouse
1Department of Automated Control Systems, Lviv Polytechnic National University, Lviv, 79013, Ukraine
2Faculty of Management, Comenius University in Bratislava, Bratislava, 25 82005, Slovakia
3Department of Information Systems and Networks, Lviv Polytechnic National University, Lviv, 79013, Ukraine
*Corresponding Author: Vasyl Teslyuk. Email: vasyl.m.teslyuk@lpnu.ua
Received: 29 April 2021; Accepted: 15 June 2021
Abstract: To solve the problem of energy efficiency of modern enterprise it is necessary to reduce energy consumption. One of the possible ways is proposed in this research. A multi-level hierarchical system for energy efficiency management of the enterprise is designed, it is based on the modular principle providing rapid modernization. The novelty of the work is the development of new and improvement of the existing methods and models, in particular: 1) models for dynamic analysis of IT tools for data acquisition and processing (DAAP) in multilevel energy management systems, which are based on Petri nets; 2) method of synthesis of DAAP tools in energy efficiency management information systems (EEMIS) of the enterprise which provides a reduction in hardware and time costs from 10% to 40%; 3) method of conflict-free data exchange determining the minimum memory speed for the synthesis of real-time exchanges, it reduces the cost and energy consumption; 4) method of calculating the signal of postsynaptic excitation of neural elements decreases the processing time of technological data two or more times. The proposed methods, models and tools have been tested while implementing the EEMIS of the intelligent mini-greenhouse, as a result, energy efficiency has increased by 12%–25% (depending on season and peculiarities of growing plants).
Keywords: Energy efficiency management information system (EEMIS); data acquisition and processing (DAAP); industry 4.0; Petri nets; smart mini greenhouse
Nowadays we are witnessing a large-scale introduction of new technologies to industrial production [1–7] in the developed countries of the world (Industry 4.0) [8]. Several standards have been developed for the construction, deployment and analysis of management systems in modern enterprises. These include the popular ANSI/ISA-95 standards [9,10] and IEC 62264 [11] standard which is based on the ISA-95.
A brief analysis of modern approaches to the production organization and the experience of their implementation at the enterprises in different countries allows us to suggest that further development of the energy sector of Ukraine is impossible without the introduction of Industry 4.0 technology and implementation of the existing standards ANSI/ISA-95, IEC 62264, etc. [12,13]. Accordingly, the urgent task today is to develop the IT for a multi-level energy efficiency management of the enterprise, which will take into account the peculiarities and specifics of the energy sector of Ukraine.
The purpose of the research is to increase the energy efficiency of an enterprise on the basis of the developed IT for technological data acquisition and processing, i.e.,:
• to develop a structure of the information technology for technological data acquisition and processing in a EEMIS that should be based on a modular principle;
• to design a multi-level energy efficiency enterprise management system (EEMIS) that should be based on modern principles of technical system development;
• to develop mathematical models and methods for information technology of technological data acquisition and processing in a multi-level EEMIS;
• to confirm the practical value of the developed multi-level EEMIS by implementing it for a real enterprise (for a smart mini-greenhouse).
Novelty of the given work lays in the following: the model for the investigation of dynamics of the designed system on the basis of Petri nets is proposed, the methods of structural synthesis, conflict-free data exchange, intelligent data processing are improved.
This paper is structured as follows. It consists of 7 Sections. After a short introduction to the research context Section 2 reviews the recent literature. Section 3 demonstrates the developed structure of a multi-level system for enterprise energy efficiency management and proposes the model for formalization of IT management of enterprise energy efficiency. Section 4 is dedicated to the development of mathematical models and methods for the synthesis of energy efficiency management information system (EEMIS). The results of implementation of the developed models and methods for EEMIS synthesis are presented in Section 5. Section 6 shows the practical example of EEMIS synthesis for the smart greenhouse. Finally, Section 7 includes the main conclusions.
Many scientists have contributed to the research of the theory and practice of energy efficiency at the enterprises, in particular: the basic principles of energy management have been developed in the works of Ganzha [14]; solutions to the problem of municipal energy planning, management and development of local energy systems are highlighted by Nilsson et al. [15] and by others [16,17]; methods and tools for building automated systems of energy efficiency management were described by Capehart et al. [18]; Yang et al. [19] studied energy efficiency management at the state level and interstate cooperation; Thiede [20] investigated the application of ener- gy efficiency management systems in manufacturing; Oung [21] developed guides for improving energy efficiency in production; Smith [22] proposed a solution to the problem of improving energy efficiency in the IT area; Metaxiotis [23] and other authors [16,17,24–26] conducted research on intelligent energy efficiency management systems; Thollander et al. [27] designed engineering solutions to im-proving energy efficiency; Hu et al. [28] defined a generalized energy efficiency factor; Tkachenko [29] proposed energy efficiency management models on the basis of artificial neural networks, etc. However, these methods, models and individual software and hardware for improving energy efficiency of the enterprises are designed to solve local problems. Thus, modern intelligent information technologies are not used to full advantage and the peculiarities of large hierarchical systems are not taken into account.
Today, about two-thirds of the world’s population live in the cities. Consequently, the issue of improving energy efficiency is being actively discussed and solved at the level of municipal administrative management in different ways. Particularly, the approach for effective selection of projects to optimize the use of electricity in the smart city systems is presented in [30] and various methods and approaches to improve energy efficiency in the cities are proposed in [31–35]. However, the effectiveness of the proposed solutions is determined by the peculiarities and specifics of each city, region or country.
Thus, the conducted analysis allows us to state that the development of energy efficiency management system at an enterprise requires consideration of its specifics and peculiarities. The standards of modern enterprises management should be the core of the system development [9–13] that will make it possible to implement the integration of systems for different functional purposes. Moreover, the increase in energy efficiency is associated with the need to apply the developed methods and tools with a high level of intellectualization based on the machine learning, artificial neural networks, etc. [36–40], and the synthesis of a multilevel [41] energy efficiency management system at an enterprise should be implemented with the use of system approach.
3 The Structure of Information Technology for Data Acquisition and Processing in the EEMIS
Presented review of the literature allows us to suggest that the process of an EEMIS development involves solving two main problems. The first problem refers to the collection of prompt and reliable information on the cost of energy and materials in real time and its pre-processing. The second problem is related to the processing of the collected information and making effective management decisions on the basis of it. By its nature, such a system is multi-level and hierarchical. Accordingly, the decision-making process is also hierarchical and multi-level. Based on the analysis of international standards, a three-level energy efficiency management system has been developed.
In the process of multi-level EEMIS implementing, information technology is built, the structure of which is shown in Fig. 1. IT for data acquisition and processing (DAAP) in energy efficiency management system processes the data received from the sensor subsystem. In general, these are technological data on energy consumption, namely electricity, gas, water, etc. The next stage of IT operation is to save the processed data in a format convenient for carrying out the analysis and making optimal decisions to improve energy efficiency in an enterprise.
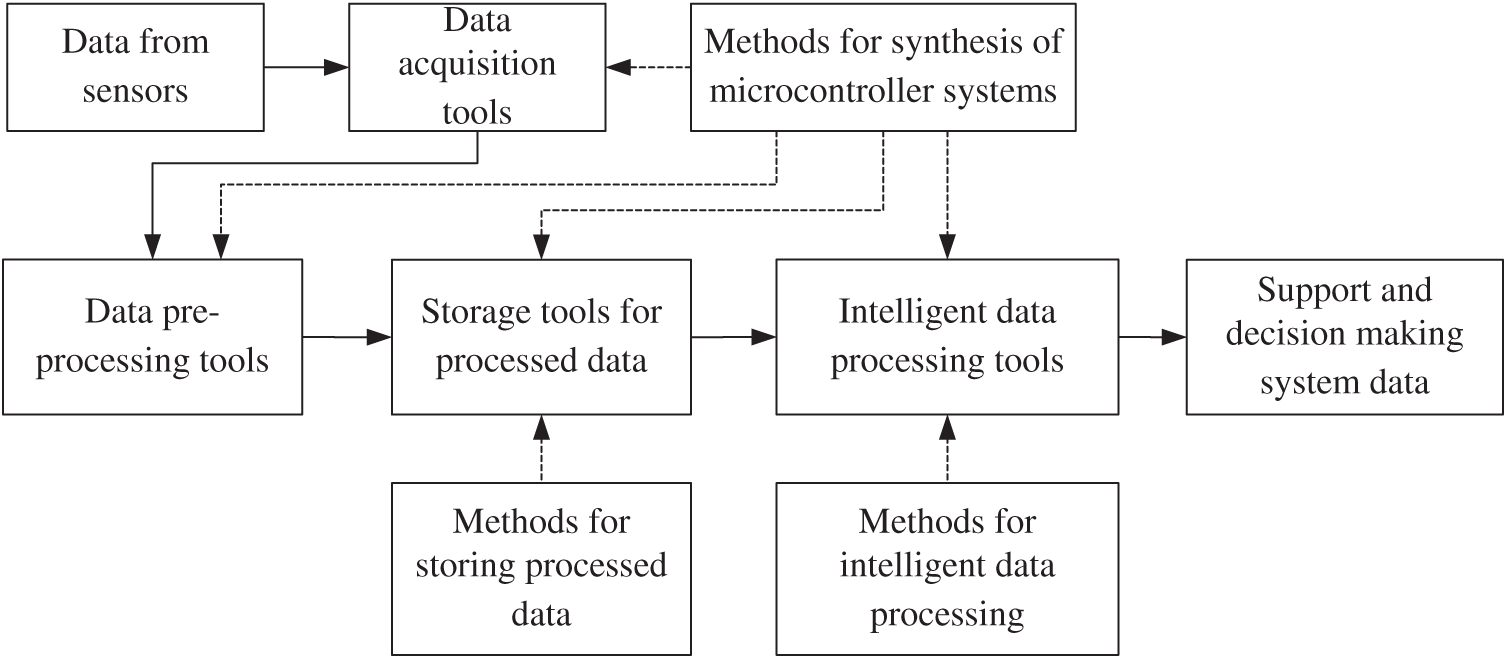
Figure 1: Generalized structure of IT for data acquisition and processing in a multi-level EEMIS
Developed IT for DAAP in EEMIS includes special developed methods and tools, namely data acquisition and data pre-processing tools, data storage tools, intelligent data processing tools and methods for synthesis of microcontroller systems, methods for storing processed data, methods for intelligent data processing.
In mathematical form the developed IT can be described using the tuple theory:
where:
The main task of IT is to process data from sensors in order to generate data for the support and decision-making system. To achieve this goal, the data from the sensors go through several stages of processing using the developed methods and tools. Thus, the developed structure of IT for data acquisition and processing in a multi-level EEMIS is based on the modular principle, which allows us to quickly improve the software and hardware of the developed information technology. In order to explain how the above-described IT is implemented in the EEMIS it is necessary to develop its structure with all hardware and software modules in it. The structure of multilevel energy efficiency management system is shown in Fig. 2, where TCP/IP is a stack of exchange protocols, ETL–Extract, Transform and Load, SCADA–Supervisory Control And Data Acquisition, SoC–System-on-a-Chip, MC–Micro Controller Unit, PLC–Programmable Logic Controller, SS–Smart Sensors, A–actuator, SA–Smart actuator. It includes three levels, namely the level of data acquisition and actuator control; the level of control and management of technological processes; the level of operator control and management decision-making.
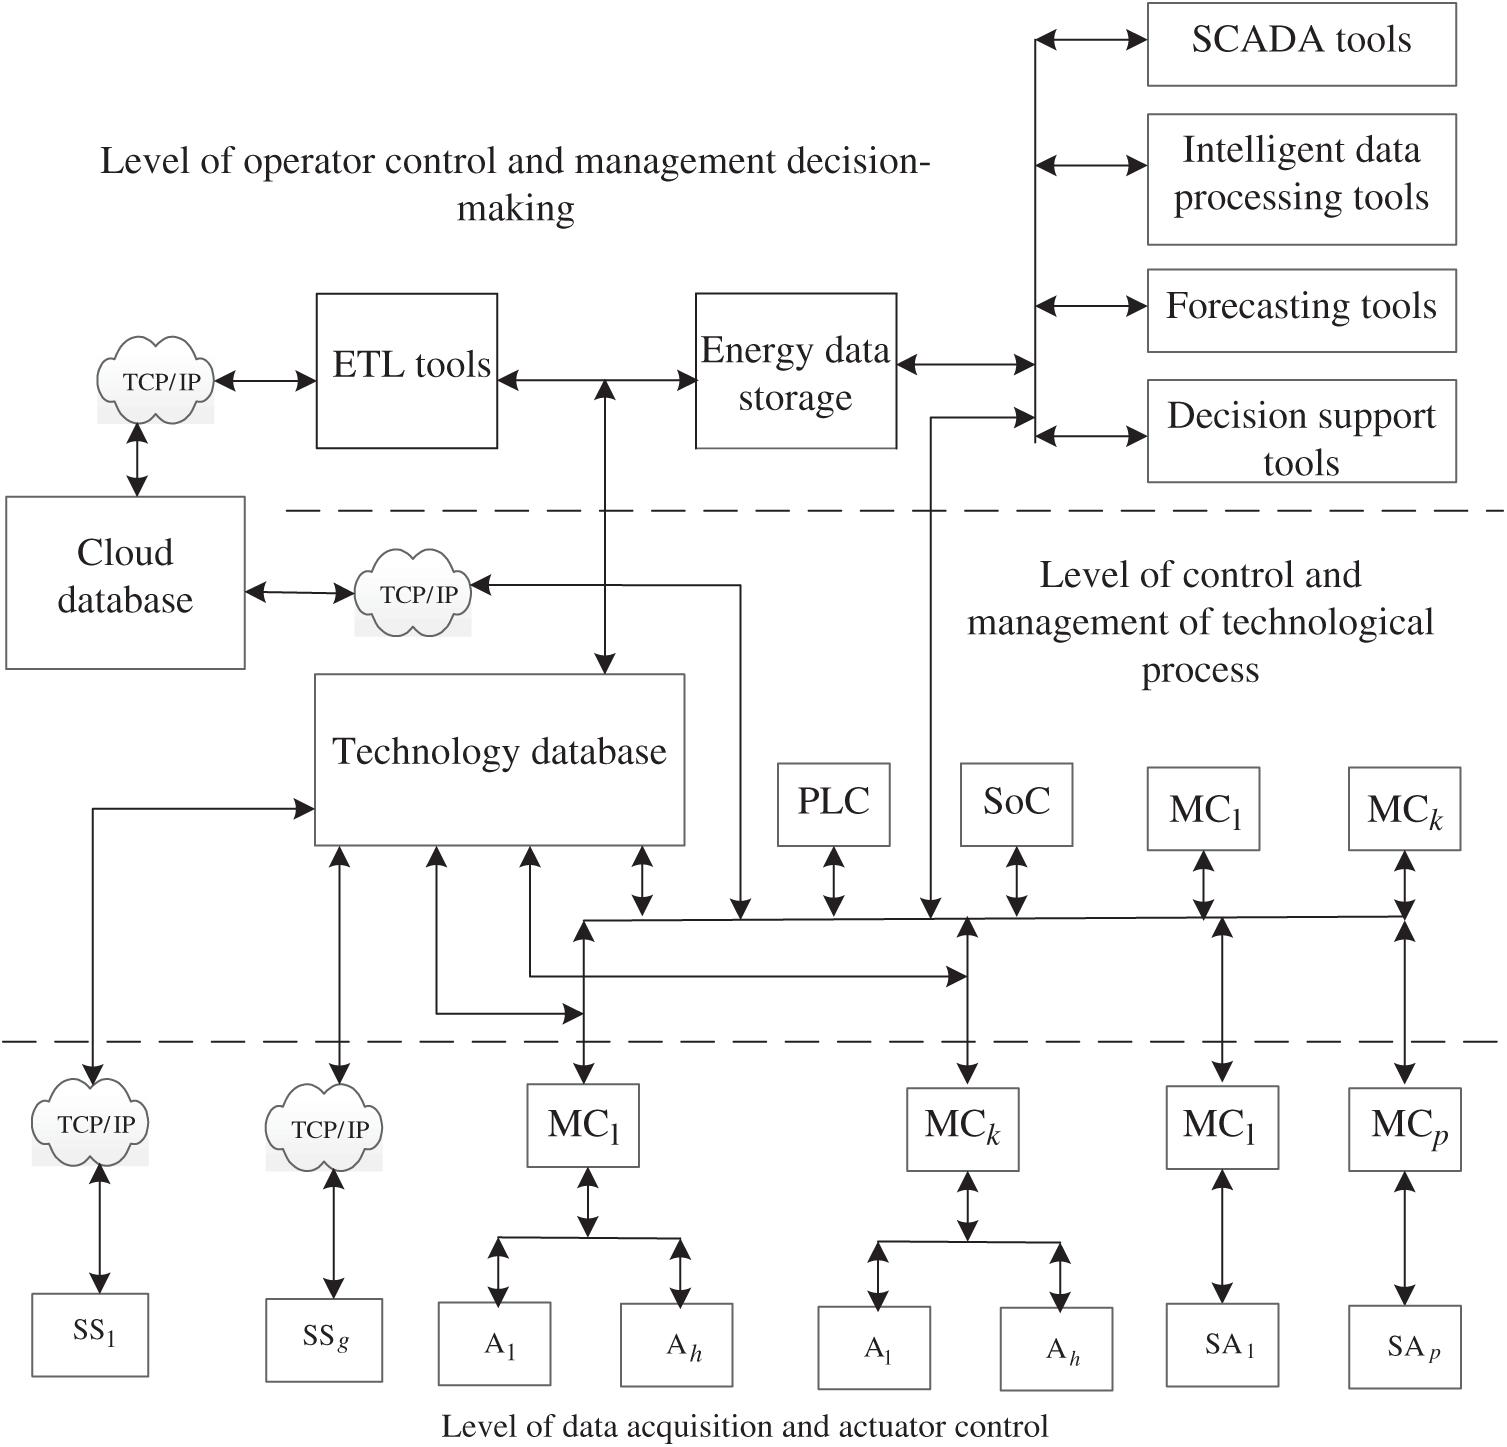
Figure 2: Structure of a multi-level EEMIS at an enterprise
Each of the levels is able to interact with the neighboring ones. The level of data acquisition and actuator control includes a set of microcontrollers, actuators, sensors and additional expansion cards. This level is responsible for obtaining up-to-date technological data on the state of the system and actuator control. The level of control and management of technological processes comprises a technological database, which is implemented on the basis of multi-port memory, programmable logic components and other auxiliary modules. It is liable for data acquisition on the state of the technological process, communication with the level of operator control and direct control over the parameters of the subsystem. The level of control and management decision-making consists of servers, databases, workstations, personal computers, etc. It is accountable for the visualization of data on the state of production and direct control of the operator over the parameters of technological processes.
The developed structure is based on the principles of the universal computing tools usage (computers, microprocessors and microcontrollers) by developing special software; on the use of the specialized FPGA tools that implement algorithms of EEMIS tools in hardware; on functionally-oriented tools (systems-on-a-chip, universal computing tools supplemented by hardware expanders that implement basic algorithms and complex basic operations) and allows you to automate and increase the efficiency of management decisions in the enterprise [42–44].
4 Mathematical Background for IT of Data Acquisition and Processing in EEMIS
The core of the developed information technology is presented by mathematical models and methods and includes the developed methodology of data acquisition and processing in EEMIS. In mathematical form, the methodology is described as a set of tested methods, models and algorithms.
where:
Thus, the developed methodology of IT for data acquisition and processing in EEMIS includes new and improved methods and models [45–55]: the method for synthesis of data acquisition and processing tools [41], the method for conflict-free exchange between data acquisition and processing tools in EEMIS [46], the method for intelligent tools implementation based on artificial neural networks [47] and models for analysis of structure dynamics of the synthesized tools of data acquisition and processing based on simple, colored and hierarchical Petri nets [48].
The role and place of each of the components of the methodology of IT for data acquisition and processing in EEMIS is shown in the scheme in Fig. 3.
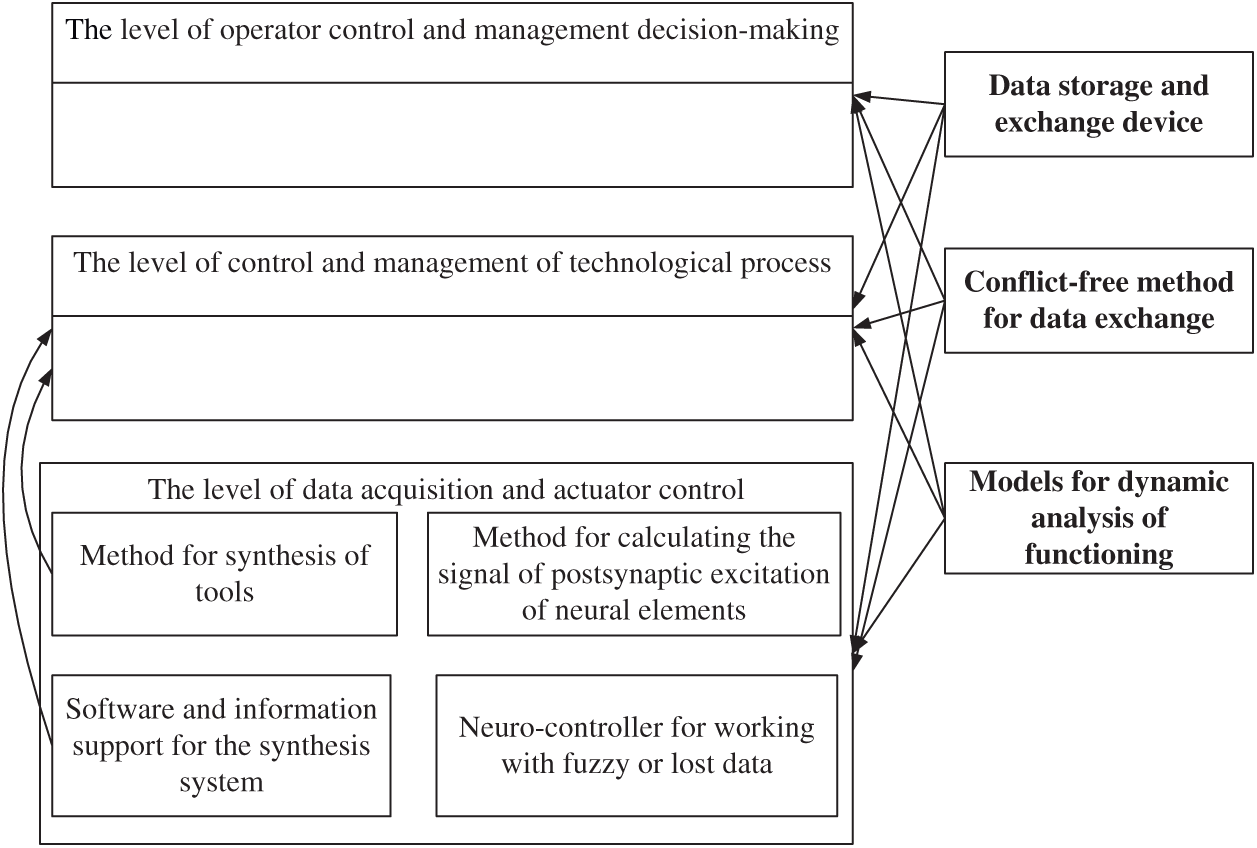
Figure 3: The scheme of application of methods and models in a multi-level EEMIS
4.1 The Method for Automated Synthesis of Software and Hardware Tools
To automate the design of hardware, the method for synthesis of data acquisition and processing in energy efficiency management system at an enterprise is developed [45], which includes two main stages: choosing the element base on the basis of the developed method for selecting the basic elements of IT for multi-level energy efficiency management; the synthesis of data acquisition and processing tools taking into account the requirements of the technical task and the parameters of the interfaces between the basic elements of the synthesized structure.
The first stage involves the method for choosing the basic elements of IT for multi-level energy efficiency management at an enterprise, which is based on the application of the theory of multicriteria analysis [49] and takes into account the requirements of specific applications. The core of this method for selecting the element base is an integrated efficiency evaluation based on partial efficiency criteria for each base element, which are created for each specific application. The evaluation of the integrated efficiency is carried out according to the scheme of compromises, in particular for the evaluation of integrated efficiency of the j-th element base
where:
The ranking method or point method is used to determine the values of weighting factors. The method for selecting the element base for the synthesis of EEMIS tools requires a sequence of steps, namely:
Step 1. To create the list of partial criteria that the efficiency of element base depends on.
Step 2. To determine the scale of changing the numerical values of partial criteria for element base efficiency (due to the requirements of the technical task).
Step 3. To determine the set of the element base that meets the requirements of the technical task for EEMIS components.
Step 4. To calculate the values of weighting factors that determine the relative importance of the i-th partial criterion.
Step 5. To calculate the values of the i-th partial normalized criteria for the element base efficiency.
Step 6. To evaluate an integrated efficiency of each j-th element base.
Step 7. To choose the element base for the synthesis of EEMIS components.
At the second stage of implementing the method for synthesis of DAAP tools, it is necessary to build the structures of new functional tools, which consist of elements obtained at the first stage.
The second stage is based on the developed method for synthesis of information technology tools for EEMIS, which, in contrast to the existing ones, provides a reduction in hardware and time costs due to the communication interfaces of the basic components and their parameters.
The algorithm for the synthesis of data acquisition and processing tools of a multi-level energy efficiency enterprise management system involves five steps:
Step 1. Analysis of the requirements of the technical task and preparation of the sets of basic elements.
Step 2. Synthesis of element sets.
Step 3. Rejection of the synthesized component options, the basic elements of which are not compatible with each other.
Step 4. Calculation of the values of the objective function for each filtered configuration of the synthesized system.
Step 5. Sorting and selecting the synthesized components of multilevel EEMIS from a set of N components with the maximum value of the integrated efficiency assessment
The developed method for synthesis makes it possible to create the list of alternatives to system structures using fewer calculations. All synthesized options, which correspond to the technological task, are compatible with interfaces and are characterized by high technical and economic indicators.
4.2 The Method for Conflict-Free Data Exchange
Modern energy efficiency enterprise management systems are usually three-level systems. The specific of each level is determined by the hardware and software components and the tasks that are solved at this level. One of the main tasks of EEMIS is creating a single information space in real-time with complete up-to-date information and ensuring conflict-free exchange between the components of the developed system. To solve such problems, the method for conflict-free data exchange is improved. Due to the coordination between the intensity of data flow and the intensity of access to exchange tools it provides determining the minimum memory speed for the synthesis of exchange tools in real time with high technical and economic indicators.
The synthesis of data acquisition, exchange and storage module (DAESM) is proposed to carry out on the basis of the method for time allocation of memory resources between external devices (workstations, microprocessor systems, intelligent sensors and actuators), which are connected to DAESM via industrial network interfaces [46]. According to this method, each j-th device, cyclically with a given period
where:
When the period of access of external devices is equal to or larger than
When selecting the memory for developing DAESM, the access cycle is defined by the expression:
The method of time allocation of RAM resources between external devices is improved in this work by coordination of intensity of data flow
Coordination of the intensity of data flow
4.3 The Method for Calculating the Signal of Postsynaptic Excitation of Neural Elements in Artificial Neural Networks
One of the ways to increase the efficiency of methods and tools of data acquisition and processing in a multi-level EEMIS of the enterprise is the use of intelligent IT tools. In EEMIS the intelligent tools are used to solve the following tasks: recovery of lost data fed from sensors under noise conditions; dynamic filtering of data from sensors; data compression and decompression; forecasting, control and management of technological processes; adjustment of technical parameters; ensuring information security and others.
Implementation of intelligent EEMIS tools is carried out on the basis of artificial neural networks [48,51–53]. The main elements on the basis of which neuro-like systems are synthesized are neuro-elements, in which the weighting factors
where:
According to formula (6) it follows that data processing in neuro-element is reduced to the operation of calculating the scalar product and the activation function
The multiplication operation according to the above algorithm is performed in
where:
To calculate the scalar product
In neuro-like systems, the weighting factors
The calculation of the scalar product using the tabular-algorithmic method is performed in
The calculation of the scalar product by this method is performed in
4.4 Models Based on Petri Nets
To study and analyze the work of EEMIS tools, the models were developed on the basis of the theory of simple and colored Petri nets at the system level of EEMIS synthesis [54,55]. In order to describe the functioning of a hierarchical energy efficiency enterprise management system, it is proposed to use hierarchical models based on hierarchical Petri nets [49]. In the general case, the following mathematical model of the hierarchical system is described by the following expression [56]:
where:
Each of the first-level Petri nets is described by a similar expression with only that particularity it may include the second level nets:
where:
For three-level hierarchical Petri net there are Petri nets of the third level:
where:
The models based on the theory of Petri nets and their extensions afforce to study the dynamics and to form decisions on proper functioning of a hierarchical multi-level system in accordance with the technical task requirements.
Let consider an example of a model based on the Petri net, in which the communication between hierarchical levels is taken into account. There exist certain peculiarities of the network, as each level is able to communicate with its neighbors and to transmit instructions or data. For proper system operating there is a dedicated memory area for storing and accumulating instructions and data, it is divided into buffers, which are simultaneously accessible to several hierarchical levels. That is why, the model based on the Petri net is divided into 3 subnets, each of which is responsible for obtaining instructions and generating data at a specific level (Fig. 4).
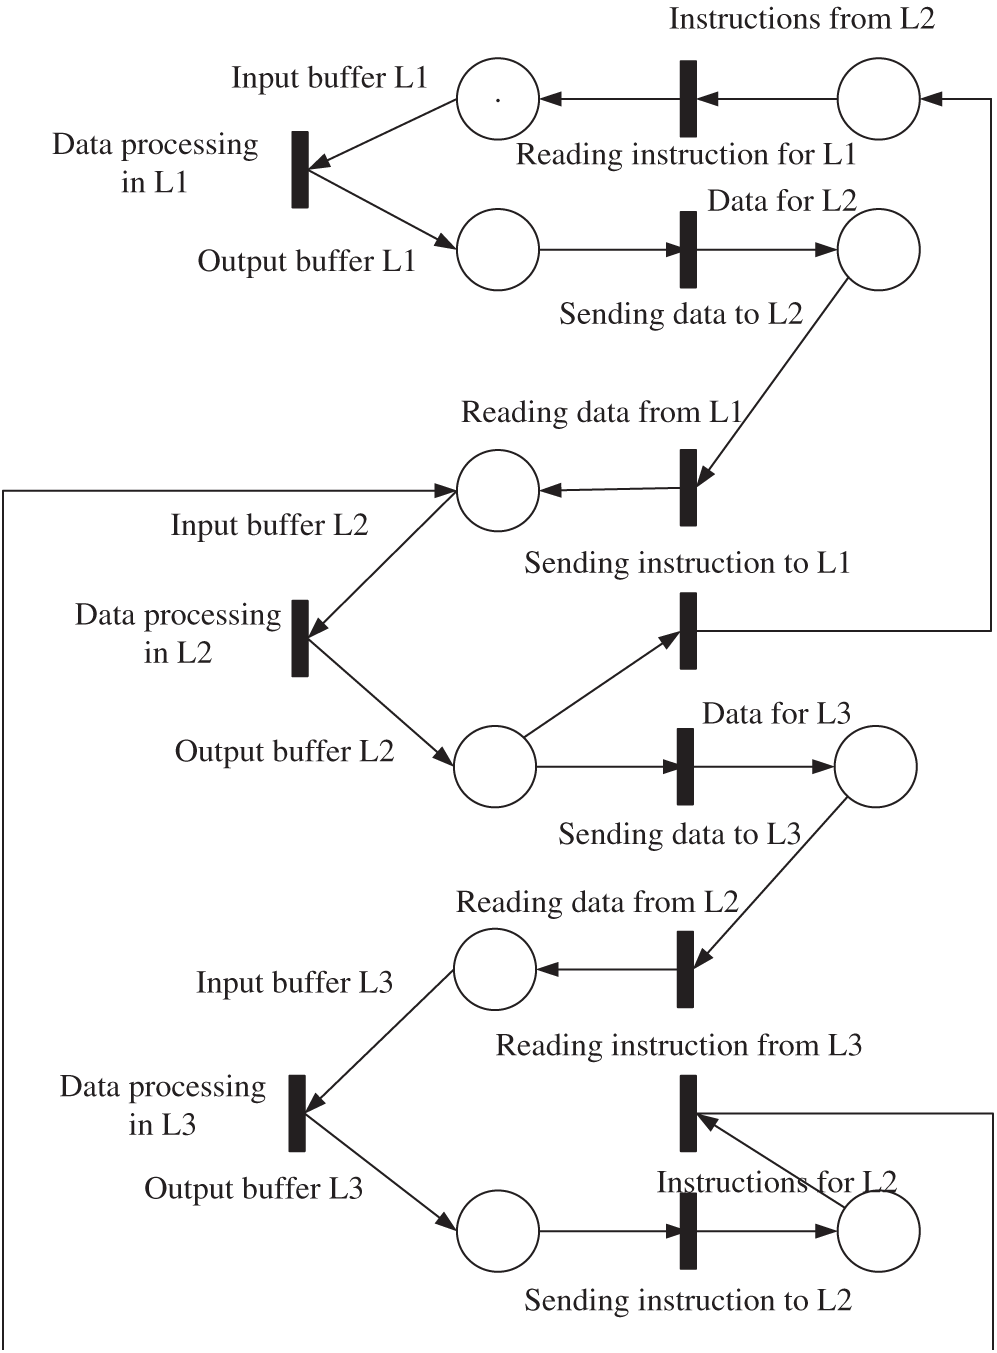
Figure 4: Petri net for modelling the communication and interaction between the EEMIS levels
Based on the constructed model and the Petri net of communication and interaction of hierarchical levels, a graph of reachability of the model states was generated, it is shown in Fig. 5. The graph has 3 main operating cycles, the first one is responsible for communication between the first and second levels, and the second cycle reflects the communication of the second and third levels. According to the obtained results, all the states and subnet transitions are reachable and deadlocks are absent. The model of data acquisition and actuator control level works properly and correctly.
Therefore, it can be concluded that the developed methods and models work properly, correctly, and give the output results with a given accuracy.
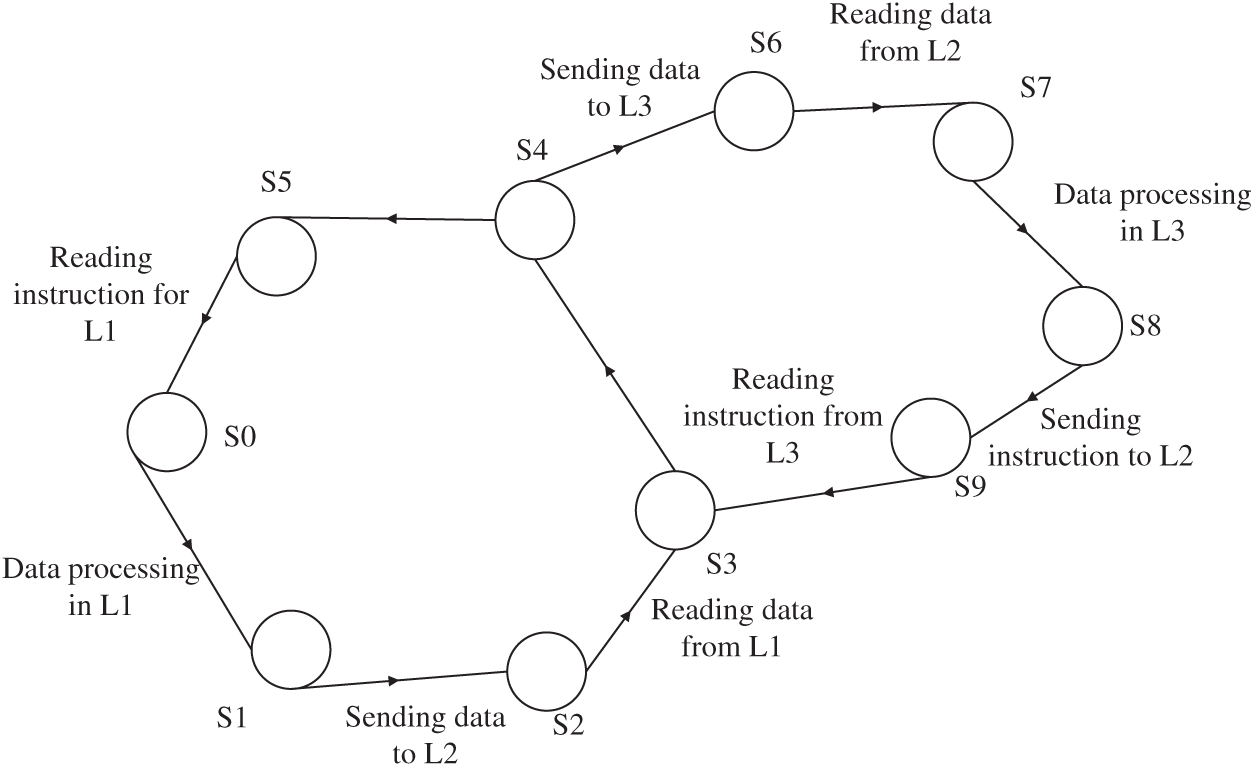
Figure 5: Reachability graph of states for the Petri net
5 The Results of the Study of the Developed Methods and Models
The paper presents the results of the study of the effectiveness of the developed synthesis methods according to different input parameters. The main parameter of the study is the efficiency of synthesis process which depends on the number of parameters of the system under development. In particular, a series of simulations of the synthesis process was performed. Different options of data acquisition and processing with different number of basic elements from 2 to 12 were generated for the experiment. During each simulation of the alternative of the developed system one microcontroller was selected which was the main system element. Auxiliary elements were selected from the list of sensors, actuators and expansion modules. For instance, temperature, light, and smoke sensors, lighting and heating actuators, as well as Bluetooth communication modules and LCD screens were selected for one of the system alternatives.
During each generating of the designed system alternative, the total number of elements’ combination options is calculated as well as the number of options that are filtered for compatibility with the interfaces, and the duration time of the synthesis process is measured too. The simulation was performed on a MacBook Pro 2015 with a Core i7 processor and 16 GB of RAM.
One of the important aspects of the synthesis process is the dependence of the number of options for combining the basic elements on the number of system parameters. An additional filter is used in synthesis process and that allows to reject those options that are not compatible with the number of available interfaces. That is why a special attention in this work was paid to the study of the effectiveness of this method.
The graph of the dependence of the total number of combination options and the number of filtered options on the number of parameters of the designed system alternative is shown in Fig. 6. According to the obtained results, it can be seen that the method for filtering elements by their compatibility with the interfaces is efficient when the number of parameters of the developed system increases. Thus, the more elements the system consists of, the more microcontroller ports are involved. Consequently, many options do not have free ports and the system cannot be connected to a single microcontroller. Accordingly, with the increase in the number of elements the percentage of the rejected options also increases.
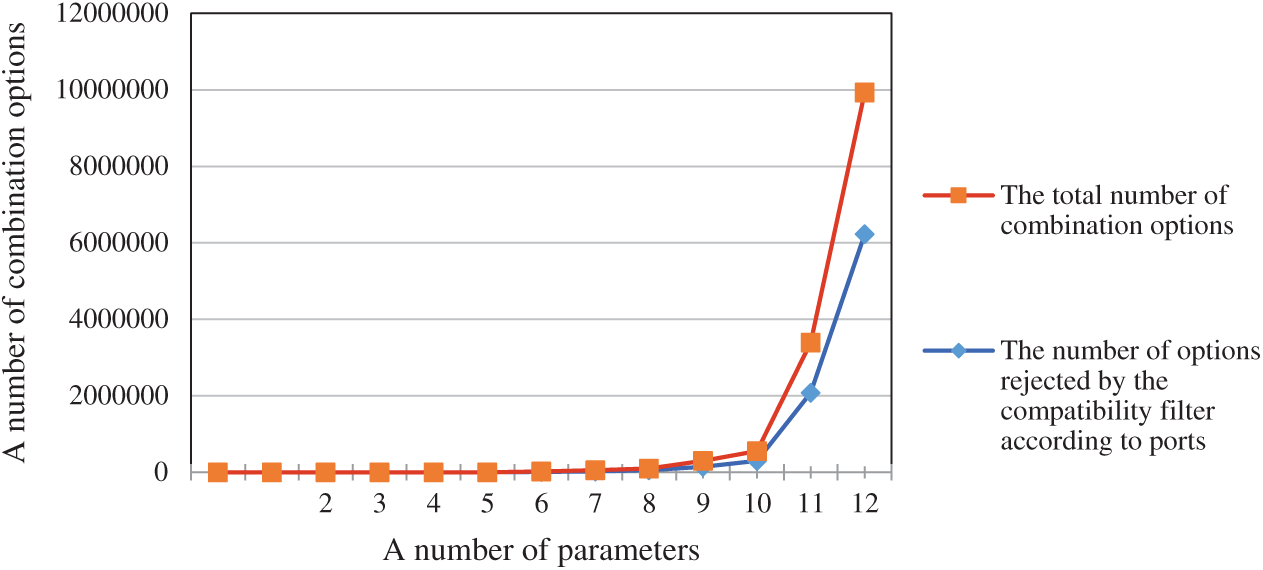
Figure 6: Dependence of element combination options on the number of parameters
The following important characteristic of the synthesis process is the complexity of calculations during it. An important parameter in this case is the synthesis duration time, which depends on the number of options of the element combinations. A series of computational experiments were performed and the dependence of the total time of synthesis on the number of parameters of the designed system alternative is shown in Fig.7. From the obtained data we can conclude that the total time of synthesis depends linearly on the number of options of components’ combinations. Thus, the complexity of the synthesis method is O(n), where n is the number of elements’ combination options.
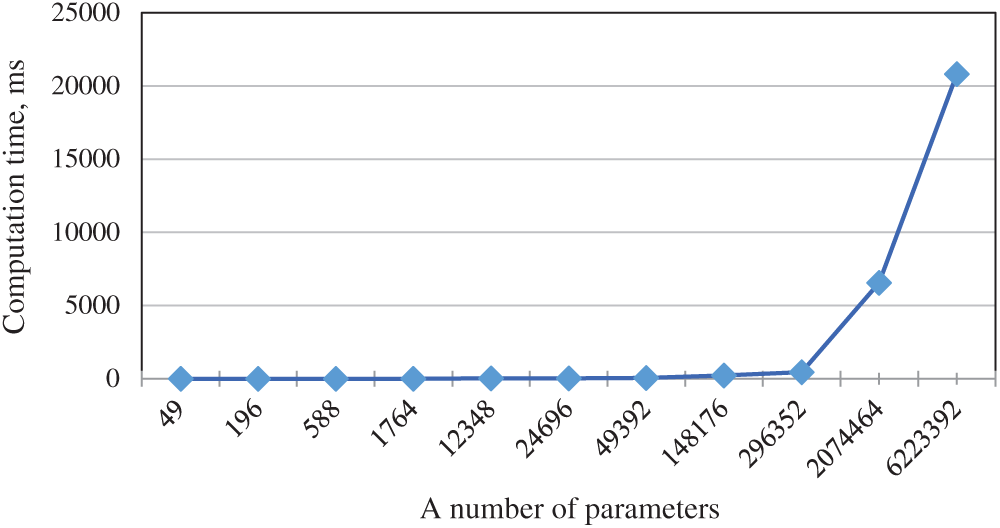
Figure 7: Dependence of the total time of synthesis on the number of parameters
6 Application of the Multi-Level EEMIS for a Smart Mini Greenhouse
The developed methods and IT tools were used in the process of building a multilevel energy efficiency management system for a smart mini greenhouse [57,58]. An example of the designed structure of a multilevel EEMIS for a smart mini greenhouse is presented in Fig. 8.
The system consists of three levels. The first level includes operator control and management decision-making. At this level a PC receives data over a local network and a mobile phone using Wi-Fi. The operator, with the help of the developed programs, is able to view the information about the state of the system, to get statistics for certain time intervals, to adjust the operating parameters, and to make decisions managing the system.

Figure 8: The structure of a multilevel EEMIS for a smart mini greenhouse
The second level involves control and management of technological process. At this level there is a minicomputer with a database and several programs, including a server application that provides data for the level of operator control, and the main program for interaction with the lower level. This level is responsible for aggregating data and instructions, storing data in the database and organizing interaction between the levels.
The level of data acquisition and actuator control consists of microcontrollers, temperature, humidity and lighting sensors and actuators for irrigation, ventilation, heating and lighting. This level is accountable for reading data from sensors and actuator control according to internal logic. Operating parameters can be adjusted at the level of control and management of the technological process. The system is divided into several modules, each of them is responsible for a separate room or climate zone.
An example of the subsystem controlling the whole system from a mobile device based on the Android OS is demonstrated in Fig. 9, where the screenshots of the main menus are shown. In general, there are three main screens where you can get information about climate control zones.
The indicators of energy efficiency of mini greenhouse may vary because they depend on season of the year, weather, peculiarities of certain plants growing, etc. According to a preliminary estimate, the developed system made it possible to reduce energy consumption up to 25%. For example, comparative monitoring of energy consumption was conducted in March. For one greenhouse module with an effective area of 5 m2, energy consumption for lighting was 15.8 kW (using smart sensors) and 18 kW (using hard automation, on/off timers), lighting savings of 12%. For heating, the figures are as follows: 720 and 828 kW (respectively with smart sensors and hard-programmed timers), heating savings are about 13%.
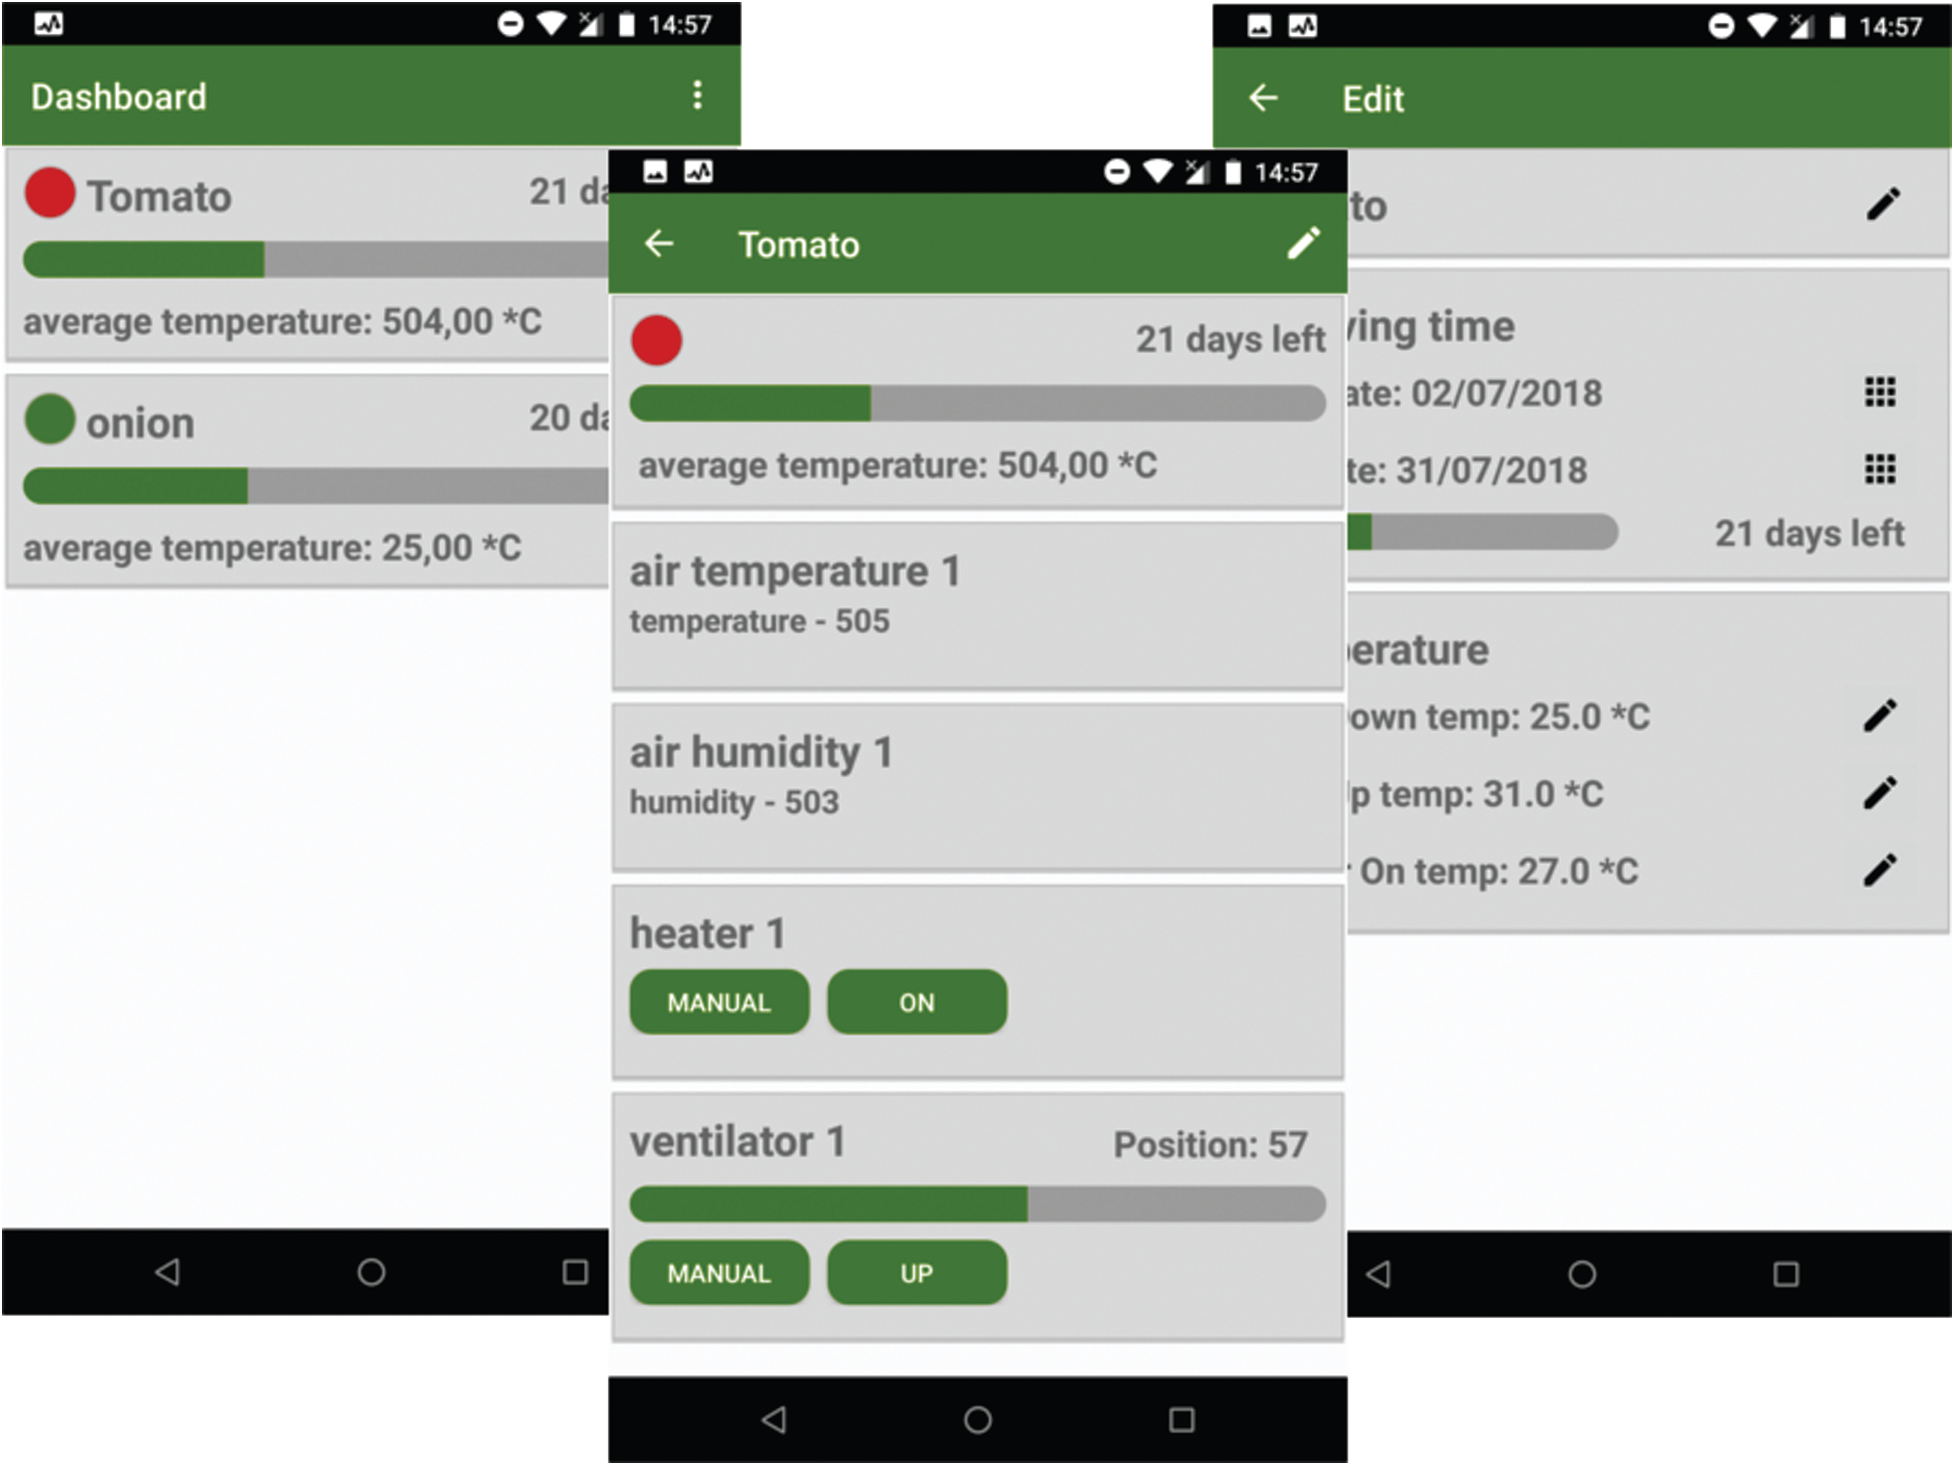
Figure 9: Example of the implementation of multilevel EEMIS for a smart mini greenhouse
The designed three-level basic architecture of the EEMIS with a variable set of the equipment has a constant core and replaceable modules that provide system adaptation to the requirements of a certain enterprise.
The methodology of data acquisition and processing in the EEMIS is developed, it includes the tested methods and models, namely the method for synthesis of data acquisition and processing tools, models of analysis of the structure dynamics of the synthesized data acquisition and processing tools on the basis of simple, colored and hierarchical Petri nets, conflict-free method for the exchange between DAAP tools in the EEMIS and the method for implementing intelligent tools based on artificial neural networks. The developed methodology is the mathematical basis for information technology of data acquisition and processing in the EEMIS and afforce to effectively solve the problems of synthesis of the energy efficiency management system for an enterprise.
The results of the component synthesis of the energy efficiency management system are presented. A prototype of the EEMIS for a smart mini greenhouse is developed, it consists of three levels and allows to reduce energy consumption. The indicators of energy efficiency of mini greenhouse may vary because they depend on season of the year, weather, peculiarities of certain plants growing, etc.
Acknowledgement: This research was supported by the Faculty of Management of Comenius University in Bratislava, Slovakia.
Funding Statement: The authors received no specific funding for this study.
Conflicts of Interest: The authors declare that they have no conflicts of interest to report regarding the present study.
1. E. Hofmann and M. Rüsch, “Industry 4.0 and the current status as well as future prospects on logistics,” Computers in Industry, vol. 89, no. 1, pp. 23–34, 2017. [Google Scholar]
2. J. Vrchota and P. Řehoř, “Project management and innovation in the manufacturing industry in Czech Republic,” Procedia Computer Science, vol. 164, no. 6, pp. 457–462, 2019. [Google Scholar]
3. H. Kagermann, “Chancen von Industrie 4.0 nutzen,” in Handbuch Industrie 4.0 Bd. 4, B, Vogel-Heuser, T. Bauernhansl, M. ten Hompel, (eds.Berlin, Heidelberg: Springer Reference Technik, Springer Vieweg, pp. 237–248, 2017. [Google Scholar]
4. T. Zaimovic, “Setting speed-limit on Industry 4.0–An outlook of power-mix and grid capacity challenge,” Procedia Computer Science, vol. 158, pp. 107–115, 2019. [Google Scholar]
5. F. Tektüfekçi, “A bibliometric analysis of industry 4.0-focused Turkish e-accounting applications,” Procedia Computer Science, vol. 158, no. I, pp. 602–608, 2019. [Google Scholar]
6. B. Park and J. Jeong, “A novel rule-based MPS model for SME manufacturing factory in Korea,” Procedia Computer Science, vol. 155, no. 18, pp. 716–721, 2019. [Google Scholar]
7. I. V. Yashchyshyna, “Sut’ ta osoblyvosti smart-pidpryyemstv, Naukovi zapysky Natsionalnogo universytetu Ostroz’ka academia,” Seria Economika: Naukovyy zhurnal, vol. 11, no. 39, pp. 14–18, (in Ukrainian2018. [Google Scholar]
8. S. Mitrovic Veljkovic, A. Nešić, B. Dudić, M. Gregus, M. Delić, “Emotional intelligence of engineering students as basis for more successful learning process for Industry 4.0,” Mathematics, vol. 8, pp. 1321, 2020. [Google Scholar]
9. B. Wally, C. Huemer and A. Mazak, “ISA-95 based task specification layer for REA in production environments,” in Proc. of the 11th Int. Workshop on Value Modeling and Business Ontologies, Luxembourg, 2017. [Google Scholar]
10. B. Wally, C. Huemer and A. Mazak, “Entwining plant engineering data and ERP information: Vertical integration with automation ML and ISA-95,” in Proc. of the 2017 3rd Int. Conf. on Control, Automation and Robotics, Nagoya, Japan, pp. 356–364, 2017. [Google Scholar]
11. International Electrotechnical Commission (IECEnterprise-control system integration–Part 2: Objects and attributes for enterprise-control system integration, International Standard, Rev. 2.0, IEC 62264-2:2013, 2013. [Online]. Available: https://webstore.iec.ch/publication/6676. [Google Scholar]
12. International Electrotechnical Commission (IECEngineering data exchange format for use in industrial automation systems engineering–automation markup language–part 1: Architecture and general requirements, International Standard, Rev. 2.0, IEC 62714-1:2018, 2018. [Online]. Available: https://webstore.iec.ch/publication/32339. [Google Scholar]
13. International Electrotechnical Commission (IECRepresentation of process control engineering–requests in P&I diagrams and data exchange between P&ID tools and PCE-CAE tools, International Standard, Rev. 2.0, IEC 62424:2016, 2016. [Online]. Available: https://webstore.iec.ch/publication/25442. [Google Scholar]
14. V. L. Ganzha, Osnovy Effektivnogo Ispol’zovania Energoresursov. Minsk: Belorusskaia nauka, 2007. (in Russian). [Google Scholar]
15. J. S. Nilsson and A. Mårtensson, “Municipal energy-planning and development of local energy-systems,” Applied Energy, vol. 76, no. 1, pp. 179–187, 2003. [Google Scholar]
16. D. Alahakoon and X. Yu, “Smart electricity meter data intelligence for future energy systems: A survey,” IEEE Transactions on Industrial Informatics, vol. 12, no. 1, pp. 425–436, 2016. [Google Scholar]
17. K. Sharma and L. M. Saini, “Performance analysis of smart metering for smart grid: An overview,” Renewable and Sustainable Energy Reviews, vol. 49, no. 1, pp. 720–735, 2015. [Google Scholar]
18. B. L. Capehart, W. C. Turner and W. J. Kennedy, Guide to Energy Management, 7th ed., Lilburn, GA, USA, Boca Raton, FL, USA: Fairmont Press, 2012. [Google Scholar]
19. M. Yang and X. Yu, Energy Efficiency: Benefits for Environment and Society. London, UK: Springer, 2015. [Google Scholar]
20. S. Thiede, Energy Efficiency in Manufacturing Systems. Berlin Heidelberg: Springer, 2012. [Google Scholar]
21. K. Oung, Energy Management in Business: The Manager’s Guide to Maximising and Sustaining Energy Reduction. UK: Gower Publishing, 2013. [Google Scholar]
22. B. E. Smith, Green Computing: Tools and Techniques for Saving Energy, Money, and Resources. Boca Raton, FL, USA: CRC Press, 2014. [Google Scholar]
23. K. Metaxiotis, Intelligent Information Systems and Knowledge Management for Energy: Applications for Decision Support, Usage, and Environmental Protection. USA: Information Science Reference, 2010. [Google Scholar]
24. Z. Ullah, F. Al-Turjman, L. Mostarda and R. Gagliardi, “Applications of artificial intelligence and machine learning in smart cities,” Computer Communications, vol. 154, no. 2, pp. 313–323, 2020. [Google Scholar]
25. D. Mariano-Hernández, L. Hernández-Callejo, A. Zorita-Lamadrid, O. Duque-Pérez and F. S. García, “A review of strategies for building energy management system: model predictive control, demand side management, optimization, and fault detect & diagnosis,” J. Building Engineering, vol. 33, pp. 101692, 2021. [Google Scholar]
26. Y. Zhao, T. Li, X. Zhang and C. Zhang, “Artificial intelligence-based fault detection and diagnosis methods for building energy systems: Advantages, challenges and the future,” Renewable and Sustainable Energy Reviews, vol. 109, no. 2, pp. 85–101, 2019. [Google Scholar]
27. P. Thollander and J. Palm, Improving Energy Efficiency in Industrial Energy Systems: An Interdisciplinary Perspective on Barriers, Energy Audits, Energy Management, Policies, and Programs. London: Springer-Verlag, 2013. [Google Scholar]
28. J.-L. Hu and S.-C. Wang, “Total-factor energy efficiency of regions in China,” Energy Policy, vol. 34, no. 17, pp. 3206–3217, 2006. [Google Scholar]
29. R. Tkachenko, “Intelektualizovana systema otsinuvannia parametriv biokomfortu prymishchennia, Visnyk Natsionalnogo universytetu L’vivska politekhnika,” Kompjuterni Nauky ta Informatsijni Tekhnologii, vol. 710, pp. 133–138, (in Ukrainian2011. [Google Scholar]
30. K. Angelakoglou, K. Kourtzanidis, P. Giourka, V. Apostolopoulos, N. Nikolopoulos et al., “From a comprehensive pool to a project-specific list of key performance indicators for monitoring the positive energy transition of smart cities–an experience-based approach,” Smart Cities, vol. 3, no. 3, pp. 705–735, 2020. [Google Scholar]
31. O. Malandrino, D. Sica and S. Supino, “The role of public administration in sustainable urban development: Evidence from Italy,” Smart Cities, vol. 2, no. 1, pp. 82–95, 2019. [Google Scholar]
32. A. Sarkar and J. Singh, “Financing energy efficiency in developing countries–lessons learned and remaining challenges,” Energy Policy, vol. 38, no. 10, pp. 5560–5571, 2010. [Google Scholar]
33. L. Eyraud, B. Clements and A. Wane, “Green investment: Trends and determinants,” Energy Policy, vol. 60, no. 2, pp. 852–865, 2013. [Google Scholar]
34. J. Lin, Trends in Energy Efficiency Investments in China and the US. Berkeley, CA, USA: Lawrence Berkeley National Laboratory Publication, 2005. [Google Scholar]
35. X. Wang, C. Liu and C. V. Hawkins, “Local government strategies for financing energy efficiency initiatives,” The American Review of Public Administration, vol. 47, no. 6, pp. 672–686, 2017. [Google Scholar]
36. M. I. Jordan and T. M. Mitchell, “Machine learning: Trends, perspectives, and prospects,” Science, vol. 349, no. 6245, pp. 255–260, 2015. [Google Scholar]
37. J. Villalba-Diez, D. Schmidt, R. Gevers, J. Ordieres-Meré, M. Buchwitz et al., “Deep learning for industrial computer vision quality control in the printing industry 4.0,” Sensors, vol. 19, no. 18, pp. 3987, 2019. [Google Scholar]
38. Z. Allam, “Achieving neuroplasticity in artificial neural networks through smart cities,” Smart Cities, vol. 2, no. 2, pp. 118–134, 2019. [Google Scholar]
39. A. Yarovyi, R. Ilchenko, I. Arseniuk, Y. Shmet, A. Kotyra et al., “An intelligent system of neural networking recognition of multicolor spot images of laser beam profile,” in Proc. of SPIE 10808, Photonics Applications in Astronomy, Communications, Industry, and High-Energy Physics Experiments 2018, 108081B, Wilga, Poland, 2018. https://doi.org/10.1117/12.2501691. [Google Scholar]
40. V. Lytvyn, V. Vysotska, V. Mykhailyshyn, I. Peleshchak, R. Peleshchak et al., “Intelligent system of a smart house,” in Proc. of the 3rd Int. Conf. on Advanced Information and Communications Technologies, Lviv, Ukraine, pp. 282–287, 2019. [Google Scholar]
41. T. A. Nguyen, D. Min and E. Choi, “A hierarchical modeling and analysis framework for availability and security quantification of IoT infrastructures,” Electronics, vol. 9, no. 1, pp. 155, 2020. [Google Scholar]
42. A. Poniszewska-Maranda, D. Kaczmarek and N. Kryvinska, “Studying usability of AI in the IoT systems/paradigm through embedding NN techniques into mobile smart service system,” Computing, vol. 10, pp. 1–25, 2018. [Google Scholar]
43. A. Batyuk, V. Voityshyn and V. Verhun, “Software architecture design of the real-time processes monitoring platform,” in Proc. of the 2018 IEEE Second Int. Conf. on Data Stream Mining & Processing, Lviv, Ukraine, pp. 98–101, 2018. [Google Scholar]
44. E. Molnár, R. Molnár, N. Kryvinska and M. Greguš, “Web intelligence in practice,” Journal of Service Science Research, vol. 6, no. 1, pp. 149–172, 2014. [Google Scholar]
45. P. Denysyuk, T. Teslyuk, A. Kernyskyy, V. Teslyuk, I. Tsmots et al., “Interface-sensitive method of synthesis of microcontroller-based system structures,” in Proc. of the 2019 IEEE 15th Int. Conf. on the Experience of Designing and Application of CAD Systems, Polyana, Ukraine, pp. 51–54, 2019. [Google Scholar]
46. I. Tsmots, O. Skorokhoda, Y. Tsymbal, T. Teslyuk and V. Khavalko, “Neural-like means for data streams encryption and decryption in real time,” in Proc. of the 2018 IEEE Second Int. Conf. on Data Stream Mining & Processing, Lviv, Ukraine, pp. 438–443, 2018. [Google Scholar]
47. A. Sydor, V. Teslyuk and P. Denysyuk, “Recurrent expressions for reliability indicators of compound electro power systems,” Technical Electrodynamics, vol. 2014, no. 4, pp. 47–49, 2014. [Google Scholar]
48. I. Tsmots, V. Teslyuk, T. Teslyuk and I. Ihnatyev, “Basic components of neuronetworks with parallel vertical group data real-time processing,” in Advances in Intelligent Systems and Computing II, N. Shakhovska, V. Stepashko (Eds.vol. 689, pp. 558–576, 2017. [Google Scholar]
49. T. Teslyuk, I. Tsmots, V. Teslyuk, M. Medykovskyy and Y. Opotyak, ““Architecture and models for system-level computer-aided design of the management system of energy efficiency of technological processes at the enterprise,” in Advances in Intelligent Systems and Computing II. Vol. 689. Cham: Springer, pp. 538–557, 2017. [Google Scholar]
50. R. T. Marler and J. S. Arora, “Survey of multi-objective optimization methods for engineering,” Structural and Multidisciplinary Optimization, vol. 26, no. 6, pp. 369–395, 2004. [Google Scholar]
51. I. Grobelna, R. Wisniewski, M. Grobelny and M. Wisniewska, “Design and verification of real-life processes with application of Petri nets,” IEEE Transactions on Systems, Man, and Cybernetics: Systems, vol. 47, no. 11, pp. 2856–2869, 2017. [Google Scholar]
52. O. Mishchuk, R. Tkachenko and I. Izonin, “Missing data imputation through SGTM neural-like structure for environmental monitoring tasks,” in Advances in Computer Science for Engineering and Education II, Z. Hu, S. Petoukhov, I. Dychka, M. He (Eds.vol. 938. Cham: Springer, pp. 142–151, 2019. [Google Scholar]
53. P. Kravets and V. Shymkovych, “Hardware implementation neural network controller on FPGA for stability ball on the platform,” in Advances in Computer Science for Engineering and Education II, Z. Hu, S. Petoukhov, I. Dychka, M. He (Eds.vol. 938. Cham: Springer, pp. 247–256, 2019. [Google Scholar]
54. K. Jensen and L. M. Kristensen, Coloured Petri Nets: Modelling and Validation of Concurrent Systems, 1st ed., Berlin: Springer, 2009. [Google Scholar]
55. M. Torky and A. E. Hassanein, “Orbital Petri nets: A Petri net class for studying orbital motion of tokens,” in Advances in Intelligent Systems and Computing, A. Hassanien, K. Shaalan, M. Tolba (Eds.Cham: Springer, pp. 621–631, 2020. [Google Scholar]
56. M. Diaz, Petri Nets: Fundamental Models, Verification and Applications. Hudson, NJ, USA: Wiley-IEEE Press, 2010. [Google Scholar]
57. X. Ma, Y. Li and L. Yang, “Design of environment parameter adjustment system for greenhouse based on STM32,” in Proc. of the 13th IEEE Conf. on Industrial Electronics and Applications, Wuhan, China, pp. 719–723, 2018. [Google Scholar]
58. S. Suryawanshi, S. Ramasamy, S. Umashankar and P. Sanjeevikumar, “Design and implementation of solar-powered low-cost model for greenhouse system,” Lecture Notes in Electrical Engineering, vol. 435, pp. 357–365, 2018. [Google Scholar]
 | This work is licensed under a Creative Commons Attribution 4.0 International License, which permits unrestricted use, distribution, and reproduction in any medium, provided the original work is properly cited. |