DOI:10.32604/cmc.2022.019797
| Computers, Materials & Continua DOI:10.32604/cmc.2022.019797 | |
| Article |
A Machine Learning Approach for Early COVID-19 Symptoms Identification
1School of Electrical and Electronic Engineering, Universiti Sains Malaysia (USM), Nibong Tebal, 14300, Penang, Malaysia
2Department of Electrical Engineering, NFC Institute of Engineering and Technology (NFC IET), Multan, 60000, Pakistan
*Corresponding Author: Mohamad Khairi Ishak. Email: khairiishak@usm.my
Received: 26 April 2021; Accepted: 01 July 2021
Abstract: Symptom identification and early detection are the first steps towards a health condition diagnosis. The COVID-19 virus causes pneumonia-like symptoms such as fever, cough, and shortness of breath. Many COVID-19 contraction tests necessitate extensive clinical protocols in medical settings. Clinical studies help with the accurate analysis of COVID-19, where the virus has already spread to the lungs in most patients. The majority of existing supervised machine learning-based disease detection techniques are based on clinical data like x-rays and computerized tomography. This is heavily reliant on a larger clinical study and does not emphasize early symptom detection. The aim of this study is to investigate anomalies in patient physiological data for early COVID-19 symptoms identification. In this context, two of the most prevalent symptoms, fever and cough, were examined in a two-fold manner utilizing an unsupervised machine learning model. To examine disease progression, physiological features from a chest-worn device were analyzed. First, a Single Vector Activity Index (SVAI) parameter is proposed to monitor the breathing and cough patterns. Second, the dataset's variance is examined using the DBSCAN method for clustering and outlier detection. Finally, the model accuracy is evaluated to identify outliers on real-time data based on feature dissimilarities, yielding an overall detection accuracy of 90.34%.
Keywords: COVID-19; symptoms identification; machine learning; dbscan
The outbreak of viral diseases cost thousands of lives every year worldwide. Vaccines for some infectious diseases, such as yellow fever, flu, malaria, and ebola have been researched and developed. However, early identification of underlying signs aid in disease identification and in preventing disease spread. The recent wave of COVID-19 virus cost over two million lives worldwide [1,2]. The initial clinical observations revealed that fever and dry cough were the most frequent early symptoms in any of the recorded cases [3–5]. As a result, it is believed that early symptom diagnosis will be a critical point of consideration for COVID-19 diagnosis and can help to prioritize diagnostic evaluation. This can aid in prioritizing thorough diagnostic evaluation eliminating virus exposure [6,7]. Since the effective diagnosis of the disease requires a complete medical review, it is crucial to understand the role of early detection [8,9].
Breathing is a necessary physiological mechanism for all living things. Inhalation and exhalation are included in the cyclical phase, which contributes to a person's fitness, mood, and stress levels [10–12]. Breathing patterns may be used to distinguish natural, fatigued conditions, as well as underlying acute respiratory disorders. However, to distinguish different breathing patterns, advanced diagnostic tests such as respiratory rhythm, depth, blood oxygen saturation, and heart rate are usually needed [12,13]. For a correct diagnosis, this requires not only access to specialist healthcare services, but also the availability of experienced medical professionals. A healthy adult has 12 to 20 respiratory cycles per minute during normal breathing operation, which is scientifically referred to as Eupnea [14,15]. Comparisons to eupnea intervals were used in this study to detect abnormalities in all test cases.
Several research trials used contact-based human activity identification to assess respiratory rates. Machine learning (ML), convolutional neural networks (CNN), and deep neural networks (DNN) methods have been used in most experiments to perform feature extraction and pattern recognition. However, in order to achieve high accuracy, these branches of supervised ML techniques necessitate very large, labelled datasets [16–18]. Furthermore, the requisite experimental setup is complex, expensive, and lacks self-diagnostic capabilities. In contrast to these techniques, this study focused on utilizing commercially available, low-cost prototype device for physiological features detection. Modern smart wearables and fitness trackers are outfitted with a variety of sensors to track personal activity, which aids in the analysis of underlying biomarkers useful in early disease diagnosis and preventive healthcare [19–21]. The global smart wearable market has over 440 million engaged users, making it an obvious choice and inspiration for prototype design [22,23].
In this study, we focused on contact-based physiological features identification. Texas Instrument (TI) SensorTag [24] was used to record physiological features including body temperature and breathing patterns. The wearable sensor node records observations and transmits the information to IBM Watson Studio. Using the density-based spatial clustering of applications with Noise (DBSCAN) algorithm [25,26], the dataset was then analyzed for anomaly detection.
The following are some of the research's main contributions:
• Real-time physiological feature collection and transmission.
• Design of a breathing pattern recognition algorithm capable of distinguishing between natural breathing and cough patterns.
• Design of a lightweight single vector activity recognition algorithm for monitoring different types of physical activity patterns.
• Anomaly detection using spatial clustering of physiological data. The classifier performance analysis for build time speed and accuracy.
The most challenging testing areas in personal activity monitoring (PA) are activity type identification and severity prediction. Andrea et al. [27] used a large dataset of raw accelerometer-based activity data from 33 subjects in their study to track 26 daily tasks. In the suggested approach, a support vector machine (SVM) classifier was employed to differentiate individual subject's behaviours. The classifier was reported to be 95% accurate in activity detection when sensors were placed on the ankles, but only 84.2% accurate when sensors were placed on the wrist. The activities were largely based on raw data, which indicated a variance in acceleration for different activity groups. Furthermore, the proposed technique stated 4 s latency times on mobile devices. Another study [28] employed chest-worn inertial measurement unit (IMU) sensors to investigate several participants’ exercise and activity behaviour. In this study, 10 people were monitored for 55 different workout kinds in order to identify activity. On a high-performance computer, the suggested CNN model achieved an average accuracy of 89.9% and a quick convergence time of 39.74 μs.
In [29], an activity detection model based on raw accelerometer data was presented. The researchers gathered large datasets of accelerometer data from 10 patients who wore wrist-worn MEMS sensors for 30 days. The suggested model quantifies the activity of daily living (ADL) index using a condensed computational technique. Although it was stated that the suggested method identified all activity categories, no performance measurements in terms of accuracy or convergence times were provided. To cluster patient data from the critical care unit, Sookyung et al. [30] used an unsupervised machine learning method based on the K-Means algorithm. In this context, nine exploratory clinical datasets totaling 1503 observations were investigated. Based on clinical data comparisons, the suggested model contained three clusters that classified nine characteristics. This feature set was used to create patient treatment programmes. The suggested model, on the other hand, merely created clusters based on the features given and did not indicate the model performance measures.
On the other hand, SURF is an adaptive unsupervised lightweight machine learning algorithm designed to reduce the workload of wearable devices. The proposed technique utilized growing neural gas networks (GnG) to observe the recorded electrocardiogram (ECG) patterns for compression and size reduction. This ensured a shorter ECG transmission size, that helped to conserve wearable device energy with shorter and effective transmissions. In addition, the algorithm also reduced the dictionary size of the signal, achieving compression ratios of 90%, allowing energy savings by sending a smaller dataset for more processing [31]. Rashidy et al. [32] suggested an end-to-end CNN-based framework for COVID-19 virus identification and control. In this regard, a dataset containing chest x-ray records of 622 subjects were used to train the CNN model. The suggested system consists of three layers, with the first layer performing real-time data acquisition, which is later analyzed in the cloud. The proposed technique reported a 97.95% classification accuracy, along with 98.85% of average specificity for all COVID-19 positive cases.
Farzad et al. [33] have proposed a hybrid technique for identifying log messages in which the isolation forest algorithm filters and predicts positive samples from the dataset. Autoencoder networks are used to extract features and train the model to identify abnormalities. BlueGene/L and OpenStack datasets with 4,399,502 and 137,074 samples, respectively, were used by the researchers. The suggested approach is an extension of unsupervised learning that relies entirely on positive data for training. The model was reported to have an average accuracy of 88.6%. However, when multi-variate analysis was used, the convergence time increased to 572 s, which may limit their effectiveness in wearable domains. In addition, Milos et al. [34] examined 4486 post-cardiac surgical patients data for diagnoses and early symptoms warnings. The study extensively investigated medical records for outlier detection using supervised support vector machine (SVM) learning methods yielding a classification accuracy of 66%. However, because of its univariate existence and offline computation, it may not be suitable for scalable complex real-time anomaly detection. Similarly, Shafeiy et al. [35] proposed a two-prongs approach for COVID-19 severity in patients. In this study, 13 non-sever COVID-19 positive patients were studied for disease progression. Initially, quick reduce feature selection (QRFS) technique was employed to classify the distinct features in the dataset. Later, quantum neural networks (QNN) were designed to classify the magnitude of disease spread. The stated results reported an accuracy of 92.33% in all positive test cases. However, the proposed technique is computationally complex and may not scale to the wearable platforms.
Dubey et al. [36] compared different machine learning approaches for predicting COVID-19 incidences in patients. To that aim, the researchers examined 3397 patient records from John Hopkins University's Center for Systems Science and Engineering (CSSE). The exploratory study categorized both the initial illness, risk contraction, and the mortality rate in elderly individuals. This study enabled to choose the best production strategy for feature detection, where SVM with grid search provided an accuracy score of 96.5%. It was also reported that the accuracy improves with hybrid ML techniques, however, it may also increase the computational complexity and model convergence times.
Along the same lines, Ali et al. [37] suggested a hybrid unsupervised machine learning approach for identifying early COVID-19 signs. Physiological characteristics such as temperature, cough, and breathing patterns of 40 participants were examined for abnormalities in the dataset, comprising of 25000 samples. This research concentrated on wearable sensors to record data, removing the need for clinical records. The researchers suggested a lightweight fast-converging algorithm for anomaly detection with an accuracy of 89%, as well as fast convergence times of 2.93 s on mobile platforms. Mohammad et al. [38] investigated early COVID-19 identification using radiology images. The suggested approach employed sophisticated inception-based recurrent residual convolution neural networks (AIRRCNN) to identify anomalies in computed tomography (CT) images. 349 CT scan pictures from 216 individuals were examined for COVID-19 detection in this research. The suggested model obtained 99% detection accuracy with a quick convergence time of 0.99 s. However, the model is highly computationally complex and may not scale on wearable platforms to achieve fast convergence times. Amin et al. [39] suggested a controlled ML technique for COVID-19 identification using CT scan images. In this study, 100 positive COVID-19 patient records were investigated for disease detection and progression. This technique reported an accuracy of 99.53% in all test cases. It was also reported that the detection accuracy can be significantly improved by pre-filtering and processing radiology images for noise reduction. Furthermore, the research reported an increase in model accuracy by advanced image segmentation for classification. However, it is highly reliant on clinical evidence, much as the previously described methods.
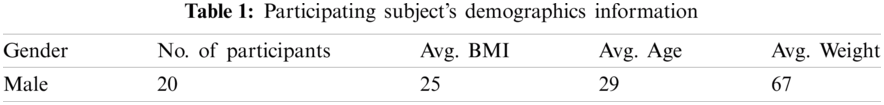
This research is divided into three stages: physiological feature measurement, filtering, and anomaly detection. To that end, the physiological data was first collected using the chest-worn sensorTag. Next, the physiological characteristics were examined in order to classify various activity types and breathing patterns. In addition, the proposed scheme was validated using the dataset given in [37]. Finally, for anomaly identification, a thorough exploratory analysis was carried out using density-based clustering. For the data collection, 20 healthy adult males volunteered. Individuals with chronic diseases or health disorders (such as diabetes, heart disease, or tuberculosis), smokers, and people above the age of 50 were excluded from participating. Tab. 1 provides population demographics participating in this investigation.
This study concentrated on a computationally efficient activity metric. Data from accelerometers, gyroscopes, and temperature sensors were used to calculate the proposed Single Vector Activity Index (SVAI). The recorded dataset was transferred in real-time to a personal computer for analysis and anomaly detection. The chest-worn wearable device recorded variations in inertial activity during coughing and breathing periods. A comprehensive data set was collected in order to analyse three physiological parameters: fever, cough, and breathing patterns. The research methodology is explained in Fig. 1.
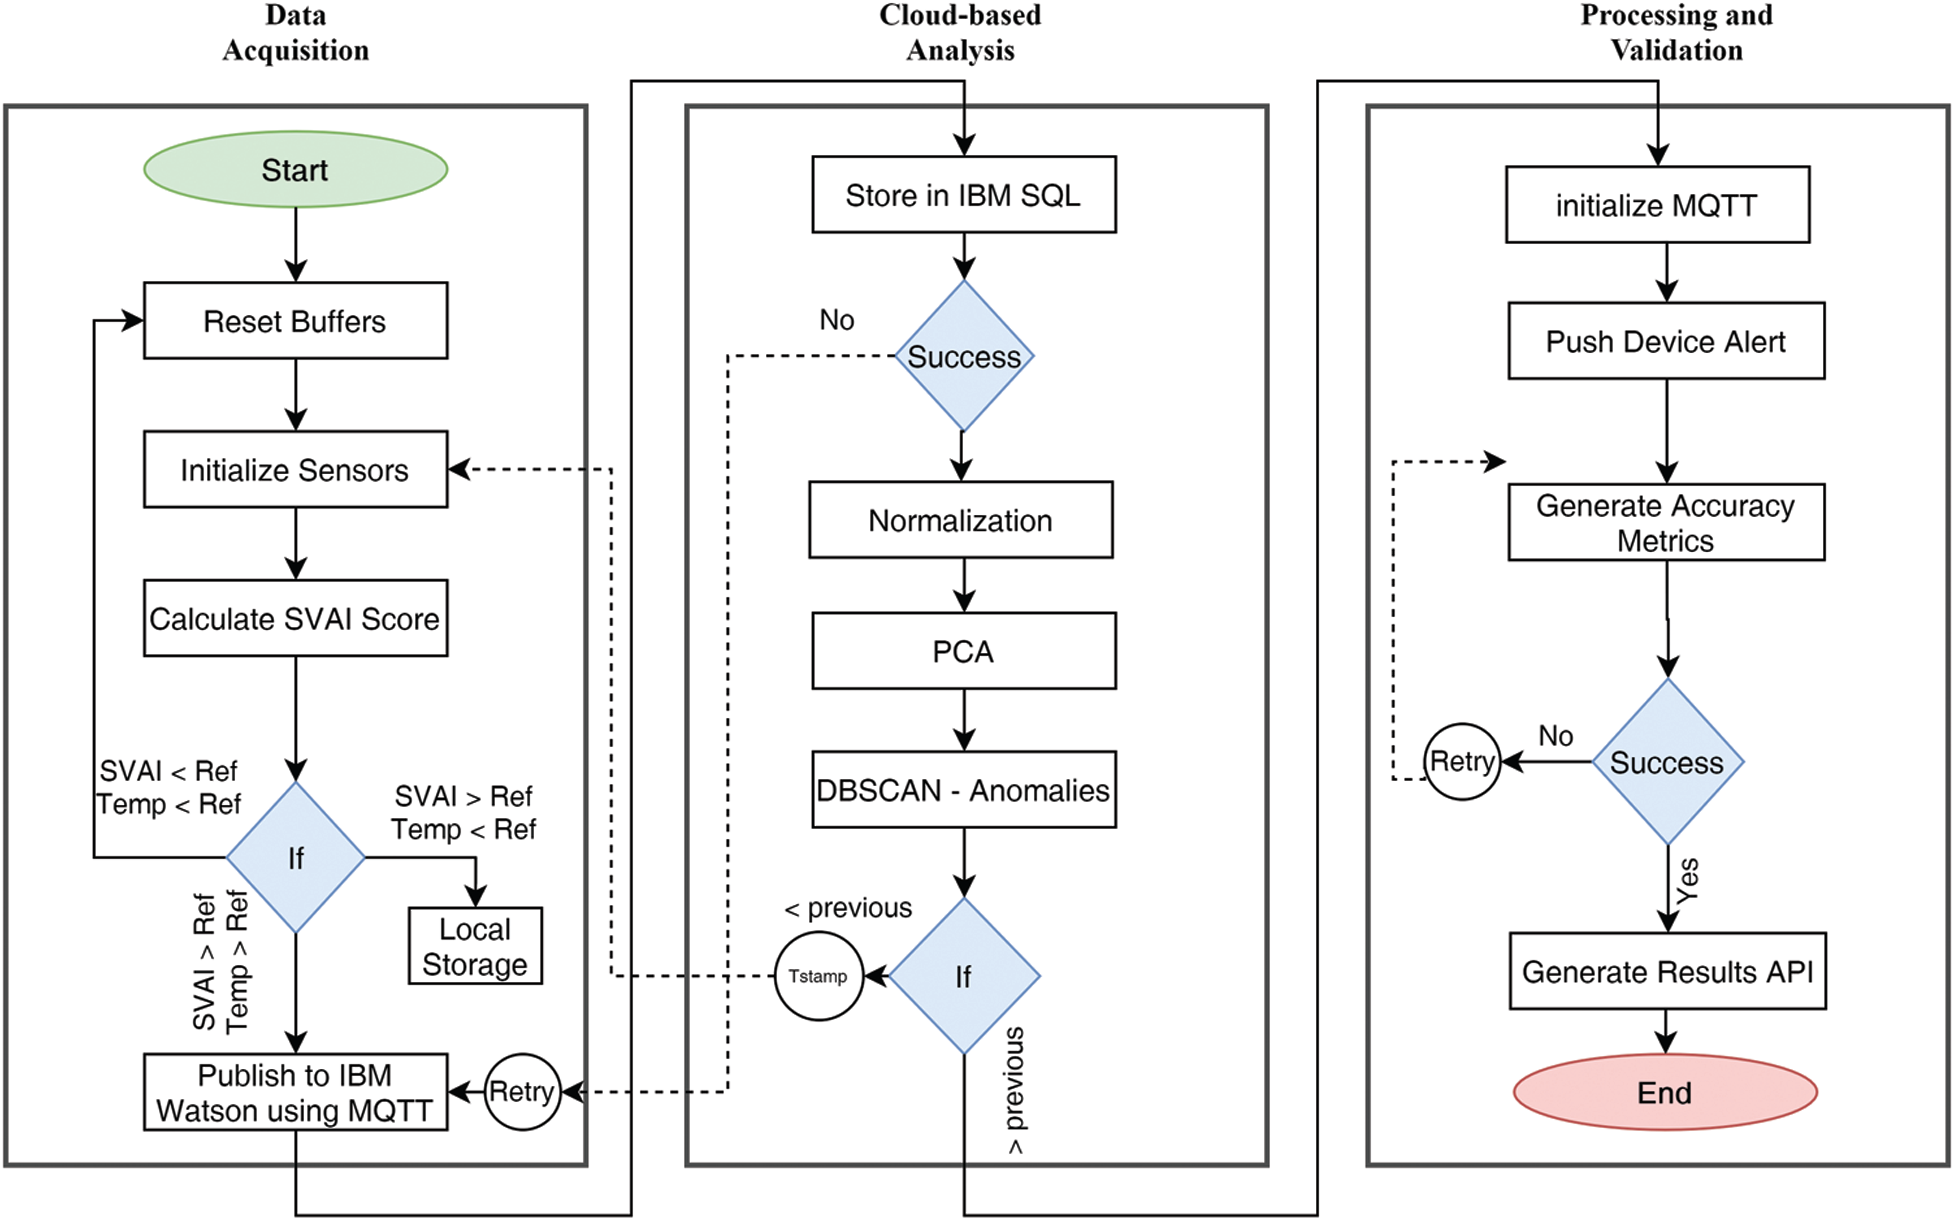
Figure 1: Complete system flowchart: from data acquisition to processing and validation
A small size Texas Instruments (TI) SensorTag device was used in the design to record the required physiological features, as illustrated in Fig. 2. The SensorTag device was programmed to collect data using its on-board sensors (including a dynamic accelerometer, gyroscope, and infrared thermometer). These sensor readings correspond to patterns of breathing and coughing, activity recognition, and body temperature, respectively. Controlled initial observations were recorded to benchmark the normal breathing profiles of the volunteers. In this regard, the research staff assisted the volunteer staff to conduct the following profiling experiments:
a) Five minutes of normal breathing with normal activity.
b) Five minutes of normal breathing without any activity.
c) Two minutes of simulated deep breathing.
d) Ten simulated coughs.
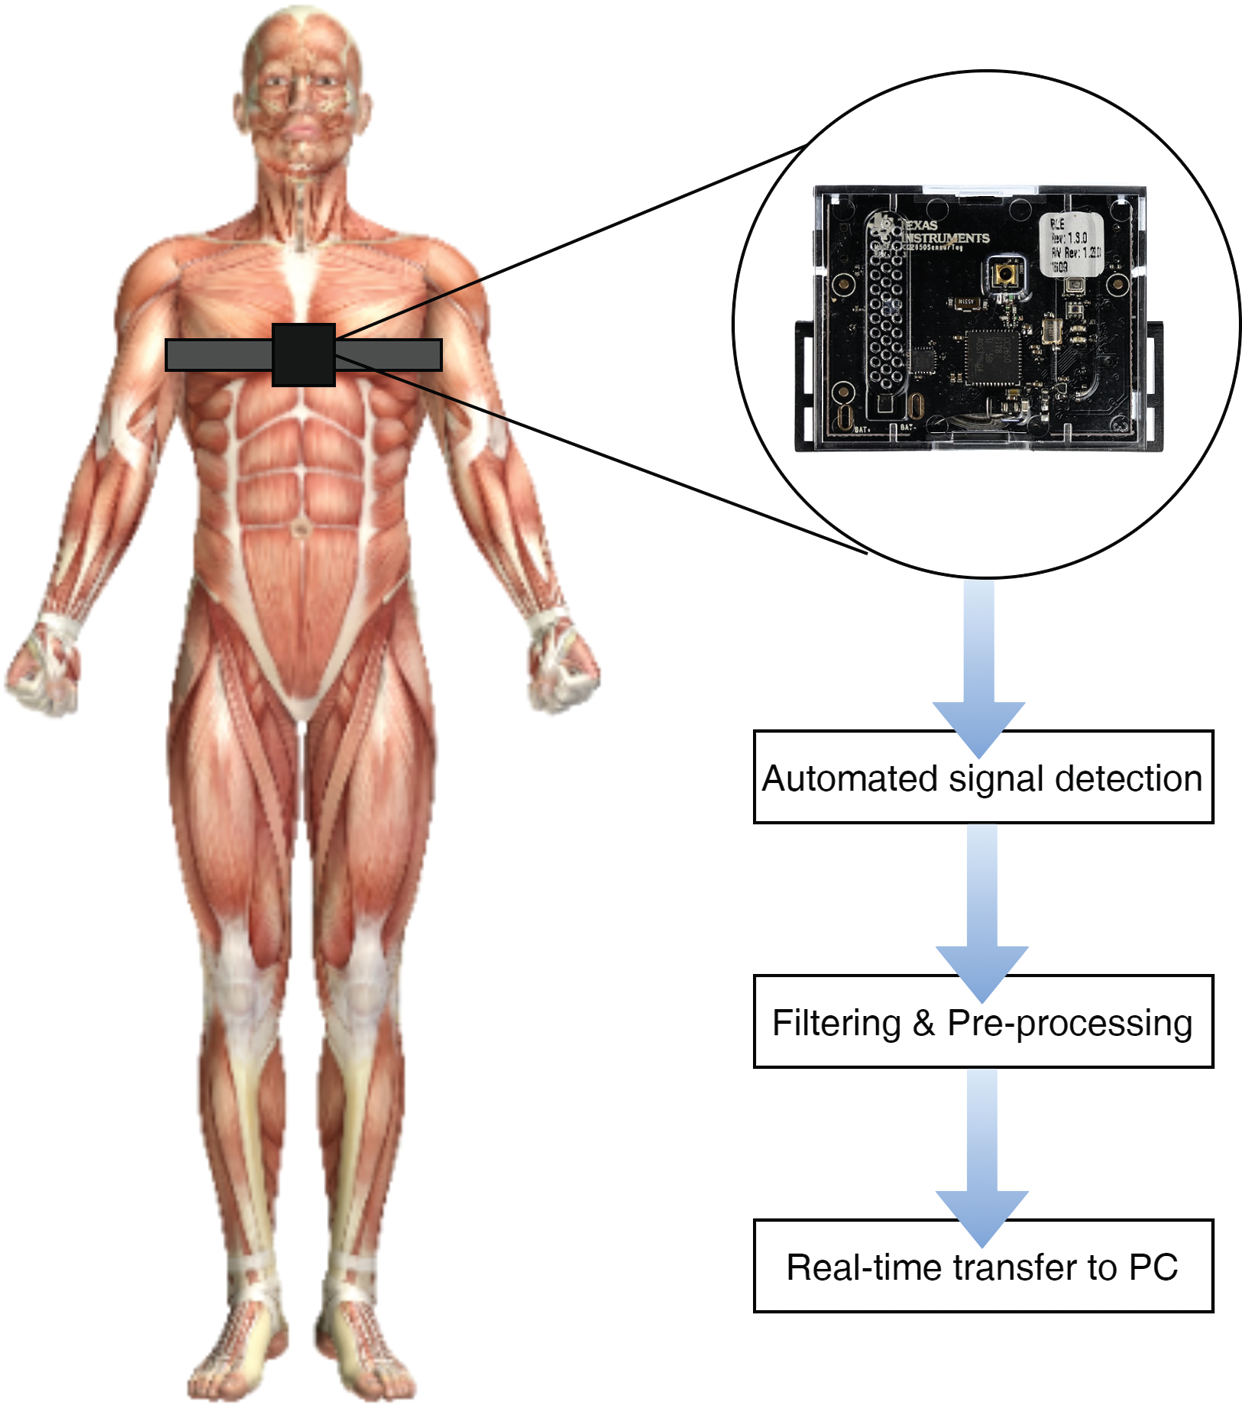
Figure 2: Illustration of chest-worn device for data logging
During this time, the chest-worn device automatically recorded temperature readings at 10-min intervals. The initial experiments were carried out to investigate natural breathing patterns, which were later used as threshold points to detect anomalies.
3.2 Single Vector Activity Index (SVAI)
Specific variations at the x, y, and z-axes are usually detected as static acceleration in a standard accelerometer score. As a result, dynamic accelerometer measurements were taken to estimate cough trends. Furthermore, the angular velocity components aided in the identification of workout modes that were used to set various thresholds to match the rise in body temperature and breathing patterns. The accelerometer's frequency (f) was set to 10 Hz, and the data windows duration (W) was set to 10 s. The scale of the observation windows is an important factor that can affect signal resolution. Smaller window sizes may lack critical attributes, while larger window sizes may well not return any additional details. As a result, per minute, a total of (N = 6) accelerometer measurements (following the window size W) were obtained. This yielded 100 datapoints every minute. The experimental observations were sliced into (T = 4 h) each, resulting in a total of
In addition, the angular velocity (
where
The SVAI (σ) was computed by calculating the standard deviation of the accelerometer datapoints using Eqs. (4)–(5).
where,
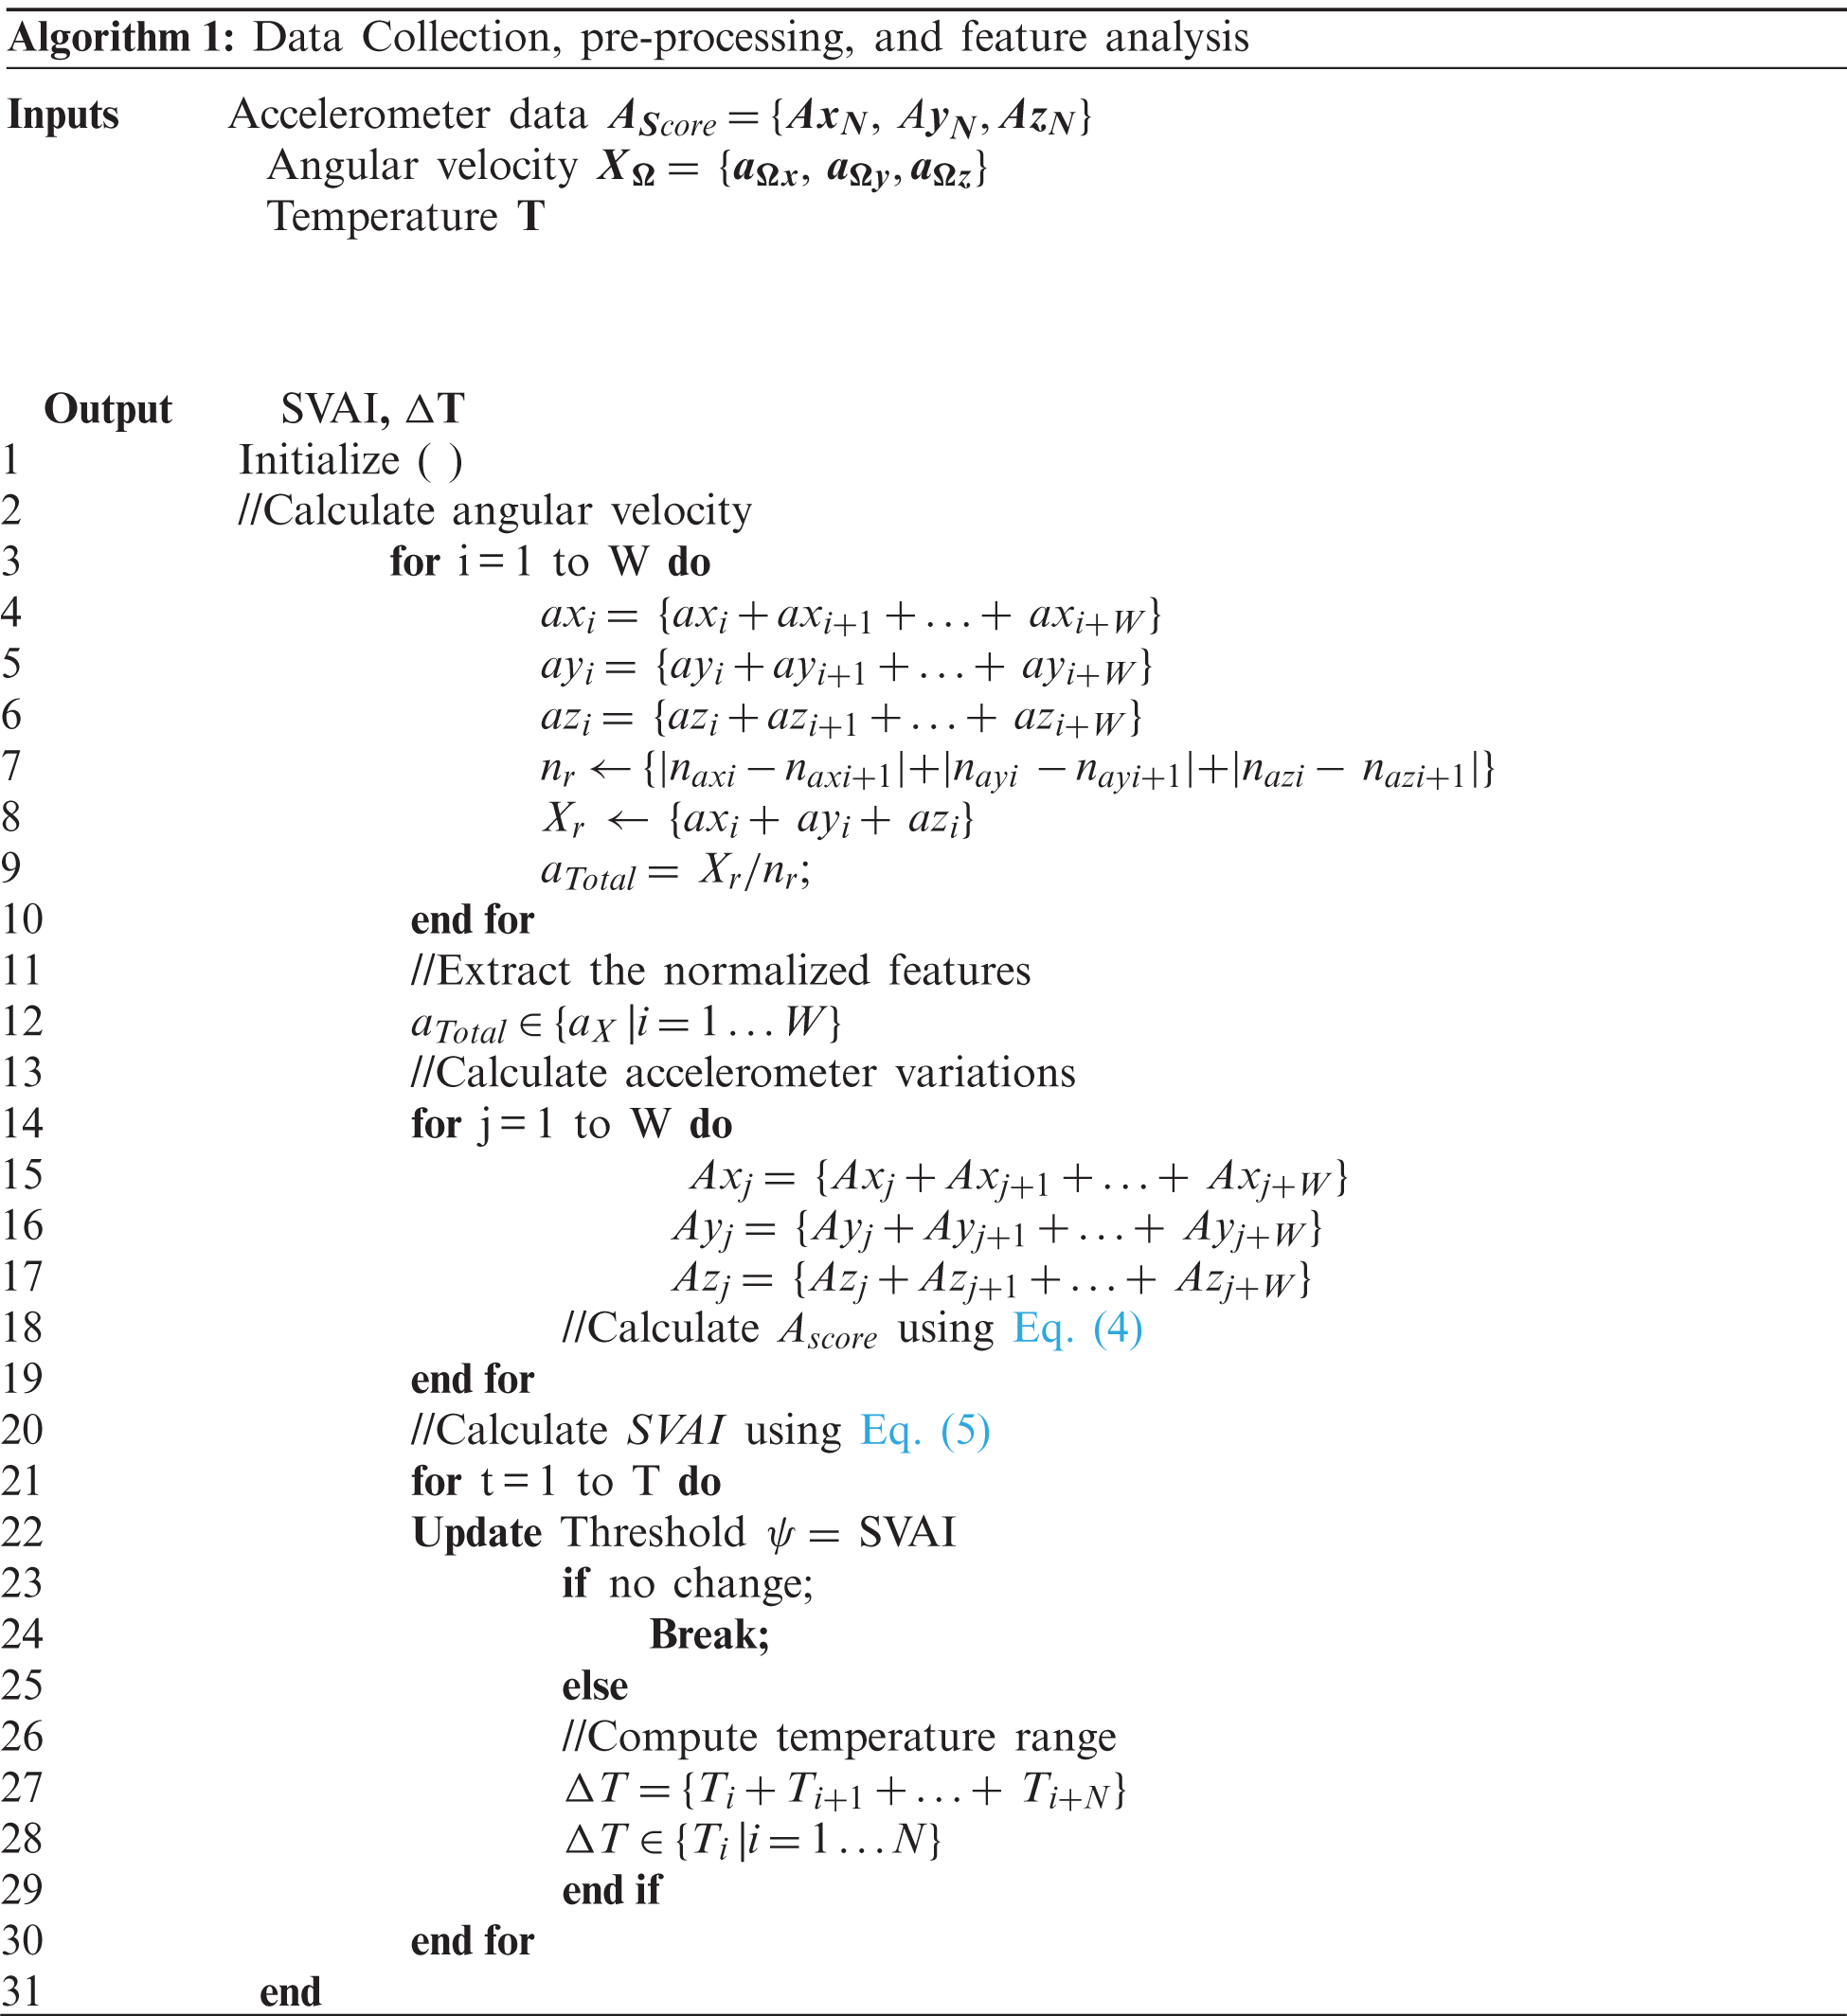
Since the human body temperature does not fluctuate abruptly, a temperature reading was taken every 10 min, yielding a total of 24 readings per series of experiments. Finally, as specified by algorithm 1, the wearable device logs and performs the following calculations.
The initial analysis showed that there were frequent variations in breathing and temperature patterns among five volunteers (referred to as Case 1, Case 2, … Case 5). This sub-set was further analyzed for anomaly detection using DBSCAN algorithm.
3.3 Data Dimension Reduction and DBSCAN
A significant number of multivariate features were present in the recorded dataset. Besides that, the degree of variation within the function set varies. Devices with scarce resources necessitate fast-converging algorithms for quicker computation and lower energy consumption. In order to reduce a larger dataset, dimensionality reduction is often required. The dataset was initially normalised in order to report multivariate features on a common scale. Furthermore, Principle Component Analysis (PCA) method was used to minimise this large-scale data set. PCA technique converts a wide range of variables into a smaller set that retains the majority of information. The PCA technique reduces dimensionality by first standardising the original dataset. This is essential in order to provide a well-balanced collection of observations that add equally to the analysis. This standardised data set is then used to generate a co-variance matrix, which is used to examine the variance from the mean value score. Finally, the covariance matrix is used to measure the principle elements.
The DBSCAN algorithm was then applied to the newly created highly correlated data to construct clusters. The algorithm isolates noise by forming clusters of highly clustered data. The noise in this case are the anomalies with a high variance. DBSCAN clustering is most relevant because it is robust to outliers. In addition, unlike other unsupervised learning methods where we must define the number of centroids, it does not require the number of clusters to be known. Two important parameters, epsilon (ε) and minimum points, are required for this technique. Where density based circles are created by the former, the latter assigns the datapoints inside the circles. This allows a surface-based scan to allocate strongly correlated variables into clusters, thus isolating noise.
DBSCAN partitions the dataset into n dimensions at first. The ranges where data points fall are specified by an epsilon (ε) distance or radius. The algorithm begins at a random location and adjusts the epsilon value to form clusters if the data points fall beyond the defined radii. The iterative method then advances to the next randomly generated point. Any points that differ significantly from neighbouring clusters and fall outside of the distribution of epsilon values are held and appear to be outliers in the dataset.
Silhouette scores are widely used to assess DBSCAN results with univariate feature sets. However, this study recorded multi-variate feature set including (accelerometer, gyroscope, and temperature scores). Anomaly identification on a single function can only register a deviation from its mean score, which cannot be used to classify the anomalies within this data set. As a result, the Receiver Operating Characteristics (ROC) technique was used to compute the likelihood of events that reflect the degree of separability distributed between features. ROC analysis, also known as Relative Operating Characteristic Curves, aids in the identification of optimal models based on their probabilistic distribution, resulting in direct diagnostic or output analysis on models.
Multiple ROC curves were plotted for the multi-variate features model by increasing the threshold, resulting in probabilistic visualisation explaining model precision and its ability for accurate detection or classification. ROC curves are plotted against True Positive Rate (TPR) and False Positive Rate (FPR), which reflect the sensitivity and selectivity of a model, respectively. Binary classification is heavily used in ML and mathematical classification problems, where a value of (0, 1) represents the precision of a detection or prediction result. Typically, an error matrix is used to perform statistical analysis, which maintains a table of unique outcomes for each series of trials. These results are often reported as False Positives (FP), False Negatives (FN), True Positives (TP), and True Negatives (TN). Whereas true positive rate (TPR) and false positive rate (FPR) values, reflect the overall frequency of positive events over positive samples and positive events over negative samples, respectively. As model accuracy increases, separability improves, and the probability trend or area under the curve (AUC) approaches unity. AUCs that are farther away from the baseline and near to 0 show a rather inefficient process. These results are further investigated in the proceding section.
For each test case in this study, over 24000 datapoints were collected. Five test cases were shown to have consistent variations in breathing patterns, as well as mild cough and temperature variations. This subset was then evaluated further to calculate the SVAI score, which indicated the variance threshold. The initial inspection of the feature set's data reveals a sparse distribution of values from the centroid or nominal stage, with anomaly spread clearly visible for the essential features. The subset was standardized, and subsequent detection thresholds for outlier detection were calculated. The normalized score is shown in Tab. 2.
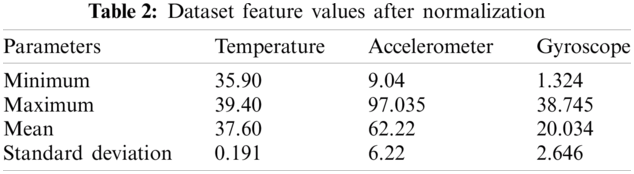
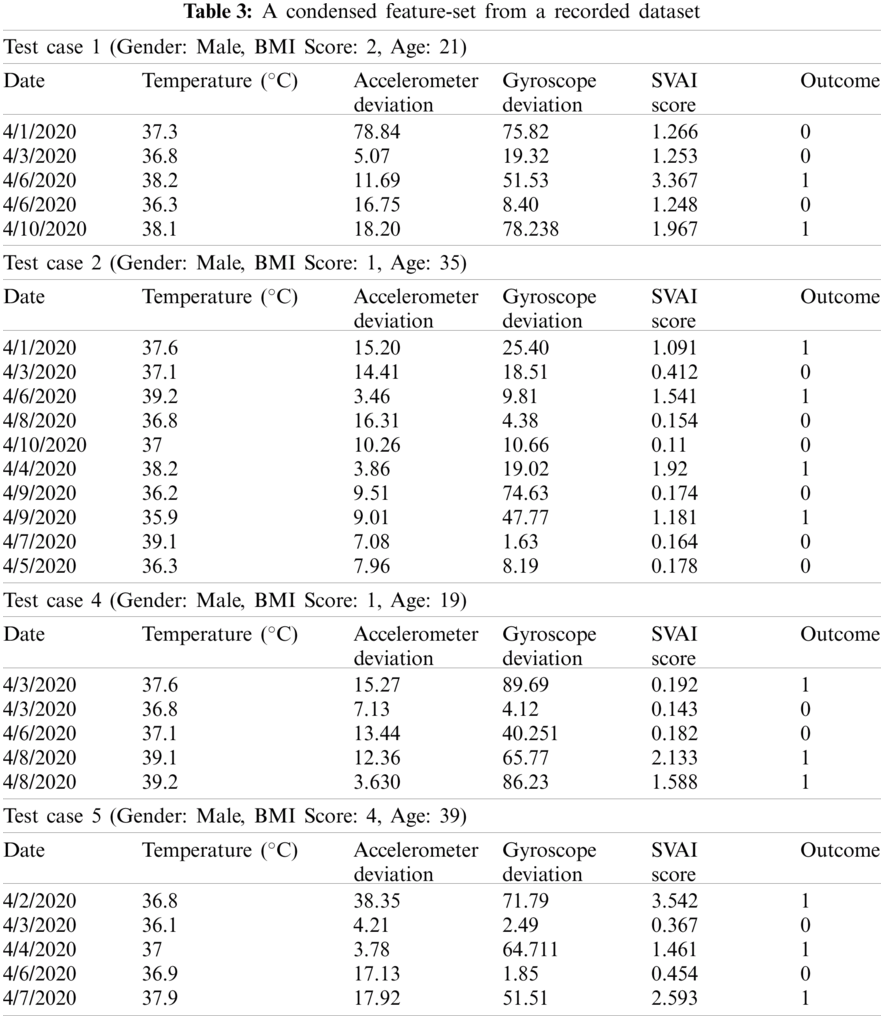
The SVAI score aided in the evaluation of the variance of the observed feature set. It is apparent that the accelerometer readings have a higher variance, resulting in sparse data distribution. This was because of the constant variations in breathing patterns that differed from the eupnea cycle. For all five test cases, the variation is suggestive of inherent respiratory problems. Similarly, the complex shift in gyroscope values was studied in order to document various activities and cough patterns. Since human breathing and body temperature increase during exercise sessions, the data points during workout sessions were only considered when monitoring cough patterns. The high degree of variation of angular velocity has a sparse distribution, which aided in the identification of outliers. Human body temperature, on the other hand, does not increase suddenly. As a result, only high consistent body temperature was studied to find any anomalies. Tab. 3 represents a condensed dataset for all test cases.
The DBSCAN clusters were generated by selecting the two critical variables, epsilon (ε) and minimum points, iteratively. Fig. 3 illustrates the cluster distribution and noise isolation. It was observed that with a smaller ε = 4, the algorithm forms a smaller cluster leaving most of the valid data points as anomalies. This reports false negatives, as the inter-cluster distance. The adjacent clusters, on the other hand, record very few data points. Furthermore, changing the sample size moves the features across the radius of the higher density cluster, resulting in underperformance. Similarly, increasing the epsilon values from 6 to 7 increases the radius size while decreasing the inter-cluster distance, resulting in a sparse datapoint representation over a greater boundary area. The reduction of inter-cluster gap groups both data points and noise, resulting in inaccurate anomaly detection.
The epsilon value = 5 with a sample size of 10 was found to be the optimal value since the algorithm generates three high-density clusters with a large intra-cluster distance. This has assisted in identifying irregularities at the edges of such clusters that are not associated with another cluster and are identified. Furthermore, it was noted that PCA analysis plays a significant role in reducing vector size, which increases cluster formulation accuracy and greatly reduces computational time. Together with cluster size and epsilon values the model was optimized to achieve the maximum accuracy score of 90.34%. With a further increase in epsilon value, the inter-cluster radii distance was increased, resulting in overlapping feature set and no cluster formation. In addition, the model accuracy was investigated using ROC curves. The ROC curves and associated AUC for the proposed scheme are shown in Fig. 4.
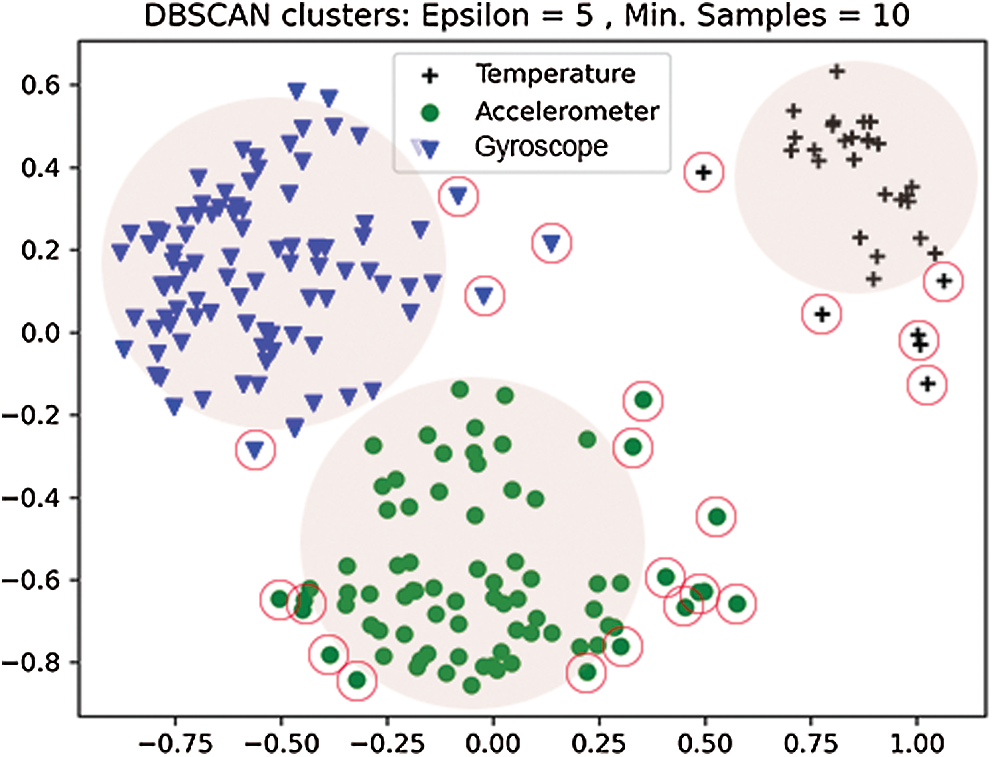
Figure 3: Anomaly detection using DBSCAN algorithm for recorded sensor data
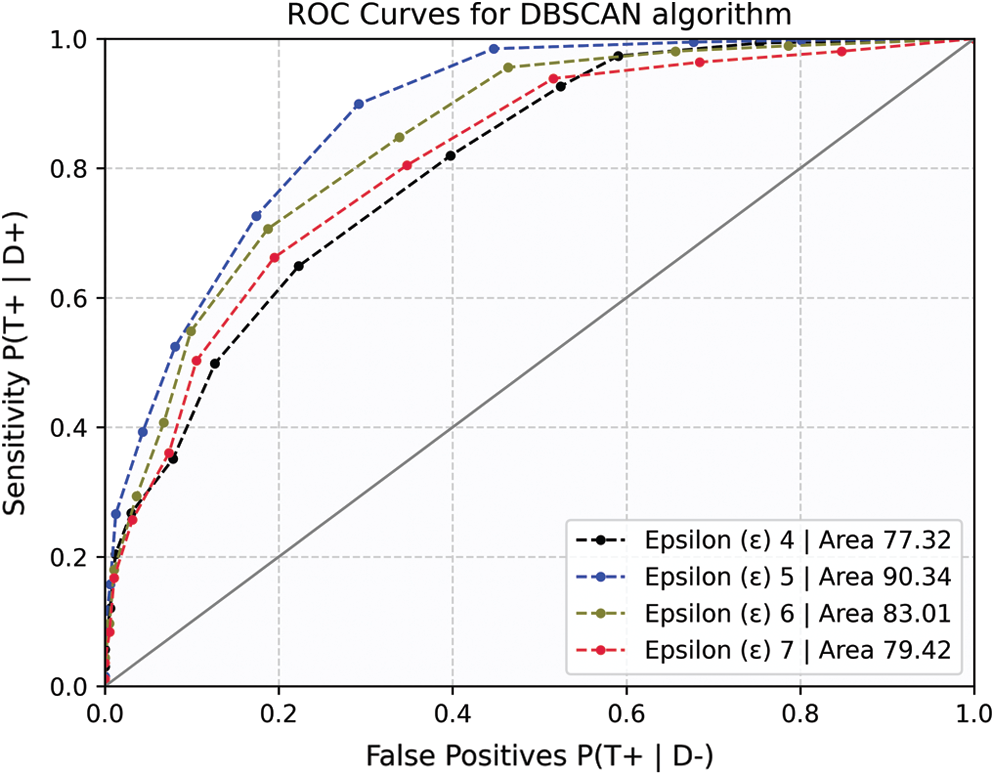
Figure 4: ROC curves for DBSCAN algorithm
Since the dataset is densely correlated, the sample size influences the concentration of data points within the cluster. Smaller sampling sizes showed no statistically meaningful disparity. As a result, the optimal sample size is reported. For a given sample size, the AUC represents the model's sensitivity to TP. Therefore, to determine the best convergence limits, the ROC curves were plotted iteratively, and AUC scores were reported.
Finally, the proposed scheme was investigated further in order to optimize the performance metrics. In this respect, the classifier was compared to the original dataset, which had not been reduced in dimensionality. Furthermore, the model was compared to the Isolation Forest technique, an unsupervised learning tool for anomaly detection. This allowed us to approximate model accuracy and convergence time, as reported in Fig. 5.

Figure 5: A comparison between various classifier models accuracy score
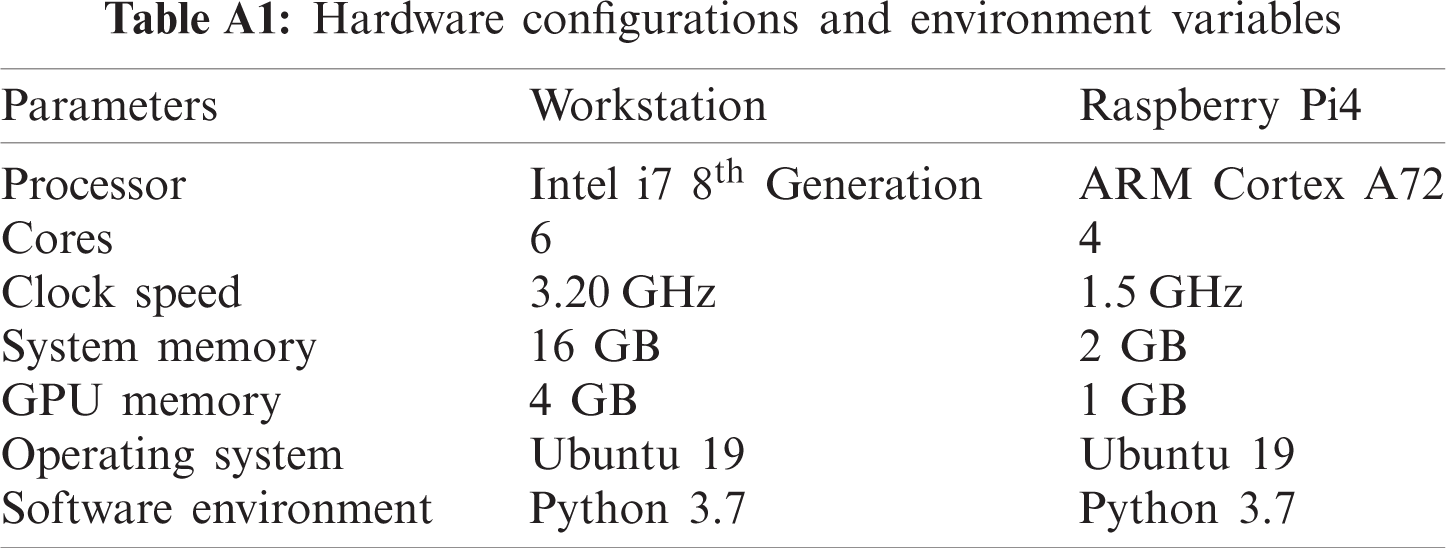
The results show that the proposed technique with dimensionality reduction outperforms other methods. Isolation Forest is a popular technique for anomaly detection. However, its precision decreases for strongly correlated datasets. Furthermore, as the dataset becomes larger, so does the energy demand and processing time. As a result, to assess computational efficiency, the aforementioned techniques were investigated for the convergence time. To that end, the performance of two hardware platforms (referred to as workstation, and RPi4) was examined. Appendix A contains information on the hardware profiles and system configurations. The model convergence metric takes into account both the build time and the classification time and are given in Tab. 4.
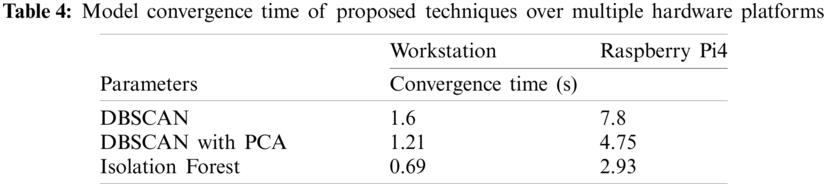
Isolation Forest performs quite well for the dataset used in this study. The RPi4's convergence speed suffers due to insufficient on-board memory and processing capacity. On the other hand, it is worth noting that DBSCAN with prior PCA implementation outmatches both hardware. Dimensionality reduction is an iterative method that uses more CPU cycles, but it also promotes fast model convergence. In summary, the results showed that greater variations in accelerometer and gyroscope readings increase the likelihood of detecting anomalies, and hence were used in this study to report anomalies. to investigate clusters as well as anomalies. DBSCAN cluster creation is an iterative mechanism that is adaptive to cluster radii and sample points. Additionally, data normalization and dimensionality reduction aid in model precision and convergence time. Finally, the proposed approach is applicable to resource-constrained computing devices such as those used in wearable electronics.
This study has examined the physiology of typical COVID-19 symptoms. The most common symptoms of COVID-19 positive individuals, according to clinical research, are fever, cough, and abnormal breathing patterns. This study sought to uncover underlying symptoms in order to help in early clinical investigation and, as a result, reduce disease spread. The solution proposed in this research relies on three primary reasons on a unsupervised learning technique. This includes a smaller dataset, scalability, and reduced resource utilization. In addition, the major objective is to detect the outbreak as early as possible to prevent its growth. For this purpose, a wearable device was used to record the above-mentioned physiological characteristics. The behaviors, with a chest-worn device, of 20 adult male students were tracked. A computationally efficient single vector activity index was calculated to report variation from the several on-board sensors.
Five cases presented symptoms with anomalies and were subsequently studied. The feature set was standardized using PCA method to reduce dimensionality, resulting in improved model accuracy and convergence time. The standardized data set was later used to find outliers using DBSCAN algorithm. This approach does not require any prior configuration knowledge and can be iteratively optimized. The algorithm, however, is sensitive to changes in its data size and data spread, that can potentially affect the detection accuracy. Therefore, the model was iteratively tuned to mitigate this effect, resulting in highly accurate anomaly detection. Finally, a comparative analysis showed that the suggested system outperforms other commonly used approaches. The models have been evaluated on a number of hardware platforms for accuracy and convergence. The convergence time of the model is impacted directly by the device resources. Therefore, the proposed scheme with its smaller computational footprint and fast convergence time is suited for platform-neutral wearable devices.
Optimum feature selection is crucial in model optimization that facilitates fast converging, high-accuracy lightweight algorithms especially for wearable electronics. In addition, lightweight algorithms can also be implemented smart devices (including smart phones, tablets etc) to further extend the computing capabilities from the cloud to the device. Disease detection using wearable electronics holds a promising future in personal well-being and early disease symptom identification that could result in improved lifestyle and reduced fatalities.
Acknowledgement: The authors would like to thank Dr. Hayat Dino Bedru for her support during the critical review of this article.
Funding Statement: This work is sponsored by Universiti Sains Malaysia Research Grant: (RUI: 1001/PELECT/8014049).
Conflicts of Interest: The authors declare that they have no conflicts of interest to report regarding the present study.
1. W. H. Organization, “Coronavirus disease (COVID-19) situation report-209,” World Health Organization, 2020. [Online] Available: https://www.who.int/docs/default-source/coronaviruse/situation-reports/20-200816-covid-19-sitrep-209.pdf?sfvrsn = 5dde1ca2_2. [Google Scholar]
2. V. G. Gude and P. J. Muire, “Preparing for outbreaks–Implications for resilient water utility operations and services,” Sustainable Cities and Society, vol. 64, pp. 102558, 2021. [Google Scholar]
3. G. Wei, Z. Ni, Y. Hu, W. Liang, C. Ou et al., “Clinical characteristics of coronavirus disease 2019 in China,” New England Journal of Medicine, vol. 382, no. 18, pp. 1708–1720, 2020. [Google Scholar]
4. T. Singhal, “A review of coronavirus disease-2019 (COVID-19),” Indian Journal of Pediatrics, vol. 87, no. 4, pp. 281–286, 2020. [Google Scholar]
5. D. Gennaro, Francesco, D. Pizzol, C. Marotta, M. Antunes et al., “Coronavirus diseases (COVID-19) current status and future perspectives: A narrative review,” International Journal of Environmental Research and Public Health, vol. 17, no. 8, pp. 2690, 2020. [Google Scholar]
6. L. Zichao, M. J. Y. Ang, S. Y. Chan, Z. Yi, Y. Y. Goh et al., “Combating the coronavirus pandemic: Early detection, medical treatment, and a concerted effort by the global community,” Research, vol. 20, pp. 35, 2020. [Google Scholar]
7. H. A. S. Hashmi and H. M. Asif, “Early detection and assessment of Covid-19,” Frontiers in Medicine, vol. 7, pp. 311, 2020. [Google Scholar]
8. R. Alvin, J. Dean and I. Kohane, “Machine learning in medicine,” New England Journal of Medicine, vol. 380, no. 14, pp. 1347–1358, 2019. [Google Scholar]
9. A. M. Rahmani and S. Y. H. Mirmahaleh, “Coronavirus disease (COVID-19) prevention and treatment methods and effective parameters: A systematic literature review,” Sustainable Cities and Society, vol. 64, pp. 102568, 2021. [Google Scholar]
10. J. F. Fieselmann, S. M. Hendryx, M. C. Helms and D. S. Wakefield, “Respiratory rate predicts cardiopulmonary arrest for internal medicine inpatients,” Journal of General Internal Medicine, vol. 8, no. 7, pp. 354–360, 1993. [Google Scholar]
11. C. Michelle, J. Chen, K. Hillman, R. Bellomo, S. Finfer et al., “The objective medical emergency team activation criteria: A case–control study,” Resuscitation, vol. 73, no. 1, pp. 62–72, 2007. [Google Scholar]
12. M. J. D. Griffith, D. F. McAuley, G. D. Perkins, N. Barrett, B. Blackwood et al., “Guidelines on the management of acute respiratory distress syndrome,” BMJ Open Respiratory Research, vol. 6, no. 1, pp. 27, 2019. [Google Scholar]
13. M. J. Tobin, T. S. Chadha, G. Jenouri, S. J. Birch, H. B. Gazeroglu et al., “Breathing patterns: 1. Normal subjects,” Chest, vol. 84, no. 2, pp. 202–205, 1983. [Google Scholar]
14. W. M. S. John and J. F. R. Paton, “Defining eupnea,” Respiratory Physiology & Neurobiology, vol. 139, no. 1, pp. 97–103, 2003. [Google Scholar]
15. D. W. Richter, “Commentary on eupneic breathing patterns and gasping,” Respiratory Physiology & Neurobiology, vol. 139, no. 1, pp. 121–130, 2003. [Google Scholar]
16. L. Yaguo, B. Yang, X. Jiang, F. Jia, N. Li et al., “Applications of machine learning to machine fault diagnosis: A review and roadmap,” Mechanical Systems and Signal Processing, vol. 138, pp. 106587, 2020. [Google Scholar]
17. R. B. D. Santis and M. A. Costa, “Extended isolation forests for fault detection in small hydroelectric plants,” Sustainability, vol. 12, no. 16, pp. 6421, 2020. [Google Scholar]
18. R. Bashar, “Supervised and unsupervised learning,” in Biomedical Signal Processing and Artificial Intelligence in Healthcare, Academic Press, Chapter No. 3, pp. 51–89, 2020. [Google Scholar]
19. Y. C. Chang and Y. L. Hsu, “A review of accelerometry-based wearable motion detectors for physical activity monitoring,” Sensors, vol. 10, no. 8, pp. 7772–7788, 2010. [Google Scholar]
20. B. G. Steele, L. Holt, B. Belza, S. Ferris, S. Lakshminaryan et al., “Quantitating physical activity in COPD using a triaxial accelerometer,” Chest, vol. 117, no. 5, pp. 1359–1367, 2000. [Google Scholar]
21. S. G. Trost, R. R. Pate, P. S. Freedson, J. F. Sallis and W. C. Taylor, “Using objective physical activity measures with youth: How many days of monitoring are needed?,” Medicine & Science in Sports & Exercise, vol. 32, no. 2, pp. 426, 2000. [Google Scholar]
22. D. Duarte and J. P. S. Cunha, “Wearable health devices—vital sign monitoring, systems and technologies,” Sensors, vol. 18, no. 8, pp. 2414, 2018. [Google Scholar]
23. Statista, “Fitness wearables market outlook,” 2021. [Online]. Available: https://www.statista.com/statistics/515640/quarterly-wearables-shipments-worldwide-market-share-by-vendor/. [Google Scholar]
24. M. K. Julia, “Usage of a Texas Instruments smart SensorTag for personal applications: Fall detection and prevention to enhance elderly living,” M.S.Thesis, Arizona State University, 2015. [Google Scholar]
25. C. Zhenguo and Y. F. Li, “Anomaly detection based on enhanced DBScan algorithm,” Procedia Engineering, vol. 15, pp. 178–182, 2011. [Google Scholar]
26. J. M. Dudik, A. Kurosu, J. L. Coyle and E. Sejdic, “A comparative analysis of DBSCAN, K-means, and quadratic variation algorithms for automatic identification of swallows from swallowing accelerometry signals,” Computers in Biology and Medicine, vol. 59, pp. 10–18, 2015. [Google Scholar]
27. M. Andrea, S. S. Intille, M. Rosenberger, A. M. Sabatini and W. Haskell “Activity recognition using a single accelerometer placed at the wrist or ankle,” Medicine and Science in Sports and Exercise, vol. 45, no. 11, pp. 2193, 2013. [Google Scholar]
28. S. Kacper, F. M. Roca, R. D. Findling and S. Sigg, “Workout type recognition and repetition counting with CNNs from 3D acceleration sensed on the chest,” in Int. Work-Conf. on Artificial Neural Networks, Springer, Cham, pp. 347–359, 2019. [Google Scholar]
29. L. W. Yen, V. K. Verma, M. Y. Lee and C. S. Lai, “Activity monitoring with a wrist-worn, accelerometer-based device,” Micromachines, vol. 9, no. 9, pp. 450, 2018. [Google Scholar]
30. H. Sookyung, P. Kaewprag, C. Cooper, B. Hixon and S. M. Bruce, “Exploration of critical care data by using unsupervised machine learning,” Computer Methods and Programs in Biomedicine, vol. 194, pp. 105507, 2020. [Google Scholar]
31. H. Mohsen, D. Zordan, T. Melodia and M. Rossi, “SURF: Subject-adaptive unsupervised ECG signal compression for wearable fitness monitors,” IEEE Access, vol. 5, pp. 19517–19535, 2017. [Google Scholar]
32. N. El-Rashidy, S. El-Sappagh, S. M. Islam, H. M. El-Bakry and S. Abdelrazek, “End-to-end deep learning framework for coronavirus (COVID-19) detection and monitoring,” Electronics, vol. 9, no. 9, pp. 1439, 2020. [Google Scholar]
33. A. Farzad and T. A. Gulliver, “Unsupervised log message anomaly detection,” ICT Express, vol. 6, no. 3, pp. 229–237, 2020. [Google Scholar]
34. H. Milos, I. Batal, M. Valko, S. Visweswaran, G. F. Cooper et al., “Outlier detection for patient monitoring and alerting,” Journal of Biomedical Informatics, vol. 46, no. 1, pp. 47–55, 2013. [Google Scholar]
35. E. El-Shafeiy, Engy, A. E. Hassanien, K. M. Sallam and A. A. Abohany, “Approach for training quantum neural network to predict severity of COVID-19 in patients,” Computers, Materials and Continua, vol. 66, no. 2, pp. 1745–1755, 2021. [Google Scholar]
36. A. K. Dubey, S. Narang, A. Kumar, S. M. Sasubilli and V. G. García-Díaz, “Performance estimation of machine learning algorithms in the factor analysis of COVID-19 dataset,” Computers, Materials and Continua, vol. 66, no. 2, pp. 1921–1936, 2021. [Google Scholar]
37. O. Ali, M. K. Ishak and M. K. L. Bhatti, “Early COVID-19 symptoms identification using hybrid unsupervised machine learning techniques,” Computers, Materials and Continua, vol. 69, no. 1, pp. 747–766, 2021. [Google Scholar]
38. M. Yamin, A. Ahmed, Z. M. AlKubaisy and R. Almarzouki, “A novel technique for early detection of COVID-19,” Computers, Materials and Continua, vol. 68, no. 2, pp. 2283–2298, 2021. [Google Scholar]
39. J. Amin, M. Sharif, M. A. Anjum, Y. Nam, S. Kadry et al., “Diagnosis of COVID-19 infection using three-dimensional semantic segmentation and classification of computed tomography images,” Computers, Materials and Continua, vol. 68, no. 2, pp. 2451–2467, 2021. [Google Scholar]
 | This work is licensed under a Creative Commons Attribution 4.0 International License, which permits unrestricted use, distribution, and reproduction in any medium, provided the original work is properly cited. |