DOI:10.32604/cmc.2022.019786
| Computers, Materials & Continua DOI:10.32604/cmc.2022.019786 | |
| Article |
Semi/Fully-Automated Segmentation of Gastric-Polyp Using Aquila-Optimization-Algorithm Enhanced Images
1Department of Electronics and Instrumentation Engineering, St. Joseph's College of Engineering Chennai, 600119, India
2Department of Information Technology, College of Computer and Information Sciences, Majmaah University, Al-Majmaah, 11952, Saudi Arabia
3Faculty of Applied Computing and Technology, Noroff University College, Kristiansand, 4608, Norway
4Research Group of Embedded Systems and Mobile Application in Health Science, College of Arts, Media and Technology, Chiang Mai University, Chiang Mai, 50200, Thailand
*Corresponding Author: Orawit Thinnukool. Email: orawit.t@cmu.ac.th
Received: 25 April 2021; Accepted: 13 July 2021
Abstract: The incident rate of the Gastrointestinal-Disease (GD) in humans is gradually rising due to a variety of reasons and the Endoscopic/Colonoscopic-Image (EI/CI) supported evaluation of the GD is an approved practice. Extraction and evaluation of the suspicious section of the EI/CI is essential to diagnose the disease and its severity. The proposed research aims to implement a joint thresholding and segmentation framework to extract the Gastric-Polyp (GP) with better accuracy. The proposed GP detection system consist; (i) Enhancement of GP region using Aquila-Optimization-Algorithm supported tri-level thresholding with entropy (Fuzzy/Shannon/Kapur) and between-class-variance (Otsu) technique, (ii) Automated (Watershed/Markov-Random-Field) and semi-automated (Chan-Vese/Level-Set/Active-Contour) segmentation of GP fragment, and (iii) Performance evaluation and validation of the proposed scheme. The experimental investigation was performed using four benchmark EI dataset (CVC-ClinicDB, ETIS-Larib, EndoCV2020 and Kvasir). The similarity measures, such as Jaccard, Dice, accuracy, precision, sensitivity and specificity are computed to confirm the clinical significance of the proposed work. The outcome of this research confirms that the fuzzy-entropy thresholding combined with Chan-Vese helps to achieve a better similarity measures compared to the alternative schemes considered in this research.
Keywords: Endoscopic/colonoscopic-image; gastric polyp; aquila-optimization-algorithm; fuzzy entropy; chan-vese segmentation
In humans, the occurrence rate of Gastrointestinal-Disease (GD) is gradually rising due to various causes and appropriate diagnosis is essential to identify and cure the disease. The preliminary clinical level detection of the GD involves in collecting the images of the interior lining of digestive tract using upper/capsule endoscopy or colonoscopic technique [1]. The image collection procedure is to be done in a controlled environment with the help of a gastroenterologist. After collecting the essential images, a systematic examination practice is essential to identify the nature and severity of the GD. Gastric-Polyp (GP) is one of the common abnormalities found in the digestive tract; mainly identified as the grown tissue mass on the lining of stomach. Based on the region and the nature, the GP are categorized as the cancerous and non-cancerous and these abnormalities can be found only during the endoscopy/colonoscopy examination, when the patient is admitted with gastrointestinal problem [2]. Due to its importance, a considerable number of GP detection procedures are proposed and implemented by the researches to examine the endoscopy/colonoscopy images. The earlier research works involves in the implementation of; (i) Conventional segmentation, (ii) Convolutional-Neural-Network (CNN) based segmentation, and (iii) Classification methods based on the machine-learning and deep-learning approaches. The main task considered in the earlier works are to segment/localize the GP region from the RGB scaled clinical/benchmark test image of a chosen dimension [3].
This research proposes a joint thresholding and segmentation technique to extract the GP section from the RGB scale images with better similarity measures (SM). This disease detection pipeline consists the following phases; (i) Image enhancement using a tri-level thresholding, (ii) Segmentation of the GP section from enhanced image and (iii) Comparison of extracted region with Ground-Truth (GT) and validation based on attained SM.
The initial phase implements an image enhancement scheme based on the tri-level thresholding using a chosen monitoring function. In this work, the optimal thresholding was selected using the Aquila-Optimization-Algorithm (AOA) proposed by Abualigah et al. [4]. The aim of the AOA is to enhance the test image by identifying the optimal thresholds in the RGB scaled image by maximizing the objective value based on the chosen thresholding scheme (entropy/between-class-variance). A novel objective value is developed by including the maximization of image quality measures, such as Peak Signal-to-Noise Ratio (PSNR) and Structural-Similarity-Index-Measure (SSIM) along with the thresholding scheme. This phase also presents an appraisal of thresholding schemes, such as Fuzzy, Shannon's, Kapur's and Otsu's, which are considered to enhance quality of the test images using the AOA.
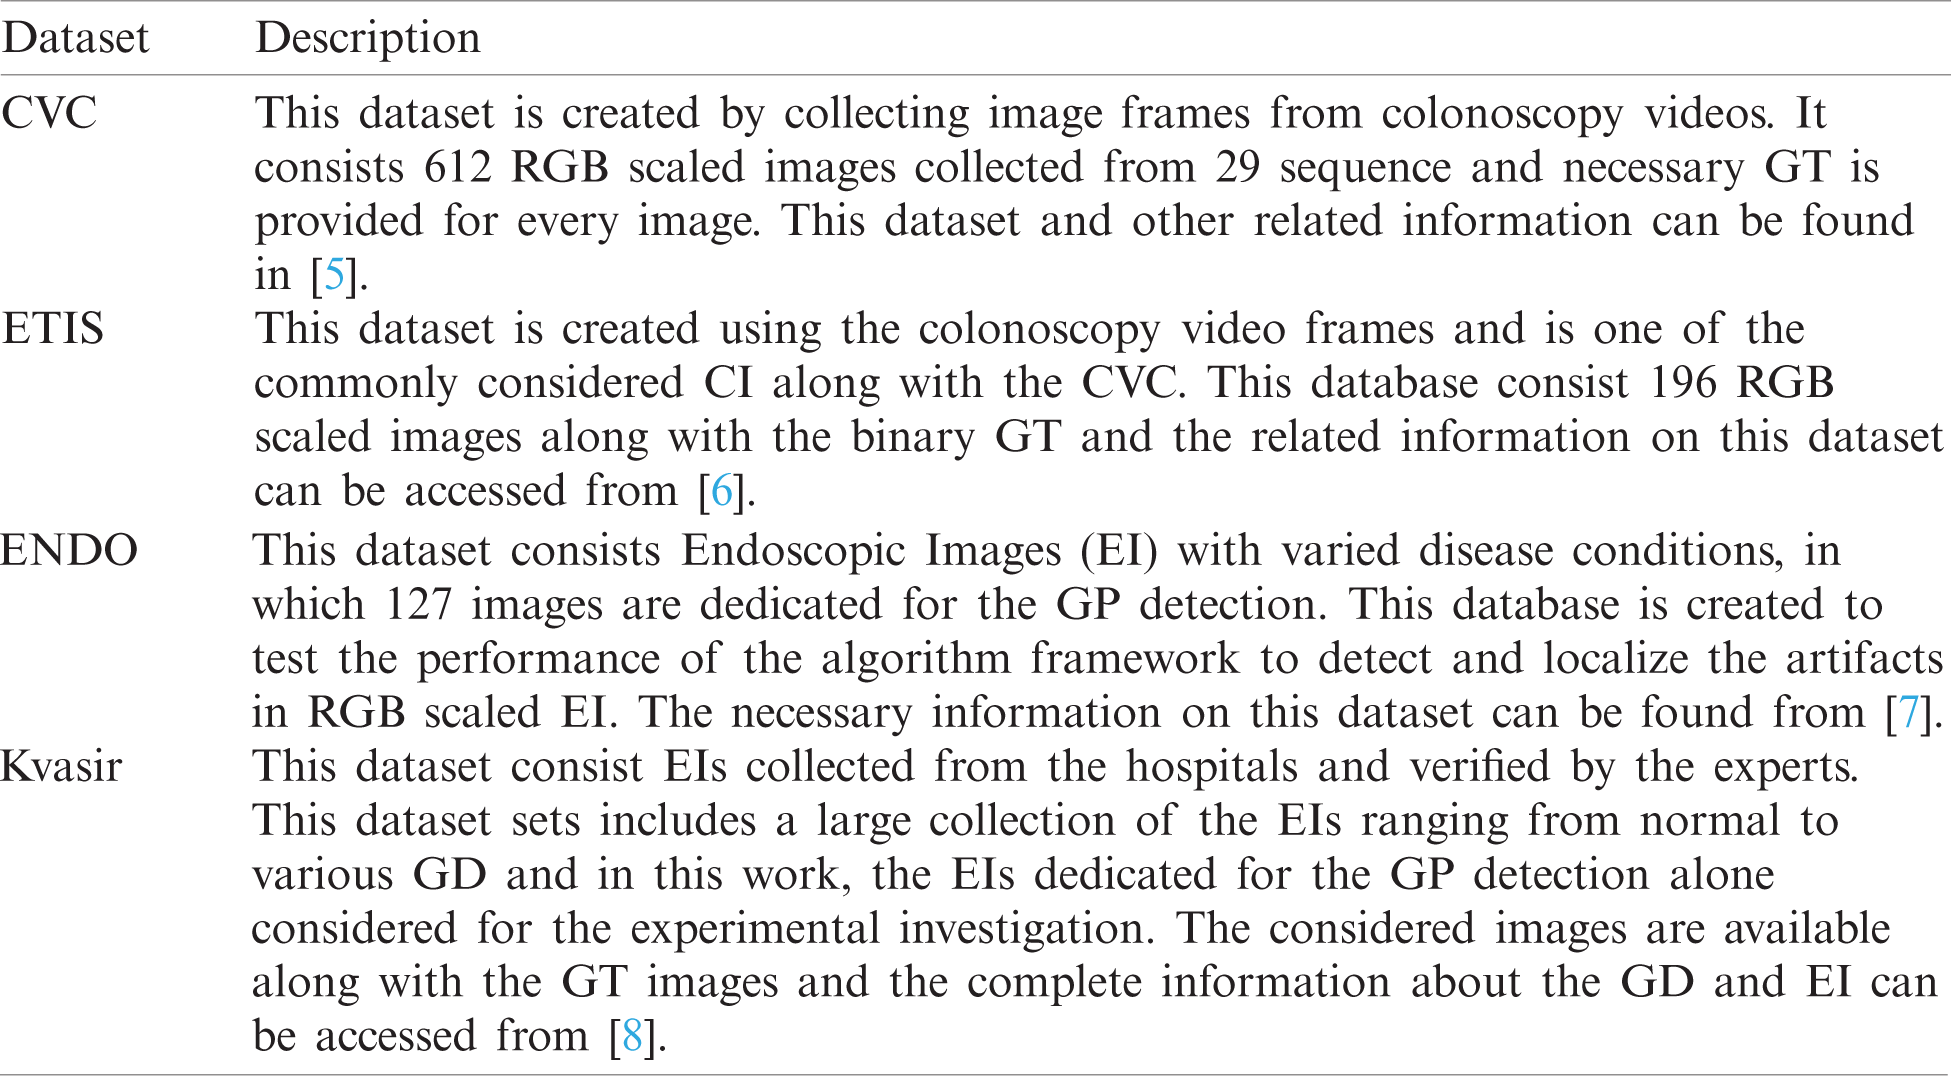
The second phase implements a semi/fully-automated segmentation technique to extract the GP section from the enhanced CI. Initially, the segmentation of the GP is performed using the automated methods, such as Watershed-Segmentation (WS) and Markov-Random-Field (MRF) approaches. Later, the semi-automated procedures, such as Chan-Vese (CV), Level-Set (DRLS), and Active-Contour (AC) are employed and the extracted sections are evaluated separately along with the GT image. This comparison helps to get the SM, such as the Jaccard, Dice, Accuracy, Precision, Sensitivity and Specificity and based on these values, the performance of the joint thresholding and segmentation procedure is confirmed. The clinical significance of the proposed image examination scheme is confirmed using clinical grade CIs collected from the commonly adopted image datasets, like CVC-ClinicDB (CVC) [5], ETIS-Larib (ETIS) [6], EndoCV2020 (ENDO) [7] and Kvasir-Seg (Kvasir) [8]. All these works are implemented using MATLAB software and the outcome of the present study confirms that the GP detection framework which employed the AOA and Fuzzy thresholding along with CV segmentation helped to get better SM on all the four CI datasets compared with other approaches implemented in this work.
The main contribution of this research work includes;
(i) Enhancement of the exploitation phase of AOA with Brownian-Motion
(ii) Implementation of a novel objective function to enhance the thresholding outcome
(iii) Presenting a detailed performance assessment of various combination of thresholding and segmentation techniques using the computed SM
Detection of GD is one of the significant work in which the assessment of EI/CI is necessary to identify the disease and its severity. The earlier research works implemented a considerable number of traditional and CNN segmentation technique to extract the GP section with better similarity measures. Most of these methods considered the datasets adopted in this research work. In [7], authors presented a CNN supported artifact detection and localization. In [8] authors implemented ResUNet++ with the Conditional-Random-Field (CRF) which offered better values of Jaccard (80.80%) and Dice (81.29%) on Kvasir and enhanced Jaccard (88.98%) and Dice (92.03%) on CVC dataset. Authors in [9] proposed an automatic GP segmentation based on HOG feature map and saliency enhancement, in [10] authors implemented a joint thresholding and segmentation of GP employed bran-storm-optimization supported Kapur's thresholding to enhance the image. In [11] authors proposed a CNN supported semantic-segmentation methodology to localize the GP from the CI, in [12] authors implemented CNN supported A-DenseUNet to extract and examine the GP fragment of CVC and Kvasir separately. Authors in [13] proposed MED-Net to separately evaluates CVC and ETIS datasets. The MED-Net is validated with few existing CNN schemes in the literature and the MED-Net provided a mean precision of 93.82% for ETIS and mean dice of 91.3% on CVC. Further, a detailed review on the CI/EI examination is discussed in [3]. Most of the earlier research works implements CNN supported schemes and the computation effort required is large compared to the traditional (thresholding and segmentation) schemes. Hence, in the proposed research, AOA based thresholding and semi/automated segmentation is presented using the freely accessible image datasets.
Implementation of a clinically significant GP detection framework is necessary and in the proposed work, joint thresholding and segmentation supported scheme is proposed to examine the RGB scaled EI/CI. This section presents the framework and the methodologies adopted to construct the proposed disease detection scheme.
3.1 Gastric-Polyp Detection Framework
Fig. 1 depicts the framework proposed in this research work. After collecting the necessary CI test images, every image and the GT are resized to

Figure 1: Disease detection framework with AOA based joint thresholding and segmentation
The performance of the developed disease detection system needs to be checked and confirmed using clinical images. In most of the cases, the clinical images are not available for testing purpose and hence a clinical grade benchmark image datasets are widely adopted by the researchers. This research work considered the openly available benchmark CI to test the performance of the proposed GP detection framework.
The number of images existing in the dataset and the images considered in this research work is presented in Tab. 1 and the sample test images of each dataset is depicted in Fig. 2. From these images, it can be observed that the extraction of the GP from the CI and EI is a tedious task and a perfectly developed image processing scheme is essential to extract the suspicious section from the considered test images.
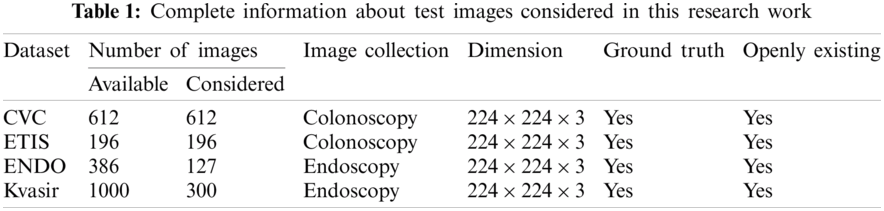

Figure 2: Sample test images collected from dataset (a) CVC (b) ETIS (c) ENDO (d) Kvasir
Image thresholding is a proven pre-processing procedure widely used to enhance the information in grey-scale and RGB-scale images based on the chosen threshold level. The earlier works on the image thresholding with various techniques can be found in [14]. Manual identification of optimal thresholds during the multi-threshold operation is a tedious task and hence the heuristic algorithm supported thresholding is widely adopted by the researchers. The earlier works on the medical image thresholding and segmentation proposed for a class of benchmark images can be found in [15,16]. In the proposed research, enhancement of the test image with tri-level threshold is achieved using the AOA.
3.3.1 Aquila-Optimization-Algorithm
The AOA is proposed in 2021 by Abualigah et al. [4] by mimicking the hunting strategy of the Golden-Eagle (Aquila) in a chosen terrain. The Aquila is having a strong physical strength with sturdy feet and best talon to hunt the prey of varied sizes (rabbit, hare, squirrel, deer, etc). Hence, it is commonly known as one of the most popular birds of prey. In the proposed research, the mathematical model of AOA is considered to adjust the R, G and B thresholds of the test image.
In order to achieve better result with minimal run, the Lévy-Flight (Lf) search strategy existing in the traditional AOA is replaced with the Brownian-Motion (Bm) strategy (only in exploitation stage) and the attained result is confirmed by computing the cost-faction. The main task of this research is to get the enhanced image using optimal threshold value. The traditional AOA considered four search (hunt) strategies to identify the optimal solution (prey) for the chosen problem these tactics are clearly discussed in this section with appropriate mathematical expressions.
Let, in the considered optimization task,
where, X is the current result for the agents for
where,
The four search (hunt) strategies of the AOA have a balanced exploration and exploitation operation with a perfectly chosen search strategy to achieve a finest result for the chosen optimization problem.
Stretched exploration (
where
Pointed exploration (
where
In this phase, the
where

Figure 3: Various search phases of AOA (a) AOA Phase 1 (b) AOA Phase 2 (c) AOA Phase 3 (d) AOA Phase 4
Stretched exploitation (
where
Pointed exploitation (
where
The other related values of Eq. (14) are depicted in Eqs. (15)–(17) and the pictorial representation of this process is depicted in Fig. 3d.
The other related information on the AOA is clearly presented in [4].
Tri-level thresholding is widely employed by the researchers to enhance the suspicious section in the medical images. Tri-level thresholding is employed in this scheme to segregate the pixels of the RGB scaled test images into three groups, such as suspicious segment, normal region and background. This work employed the entropy function and Otsu to enhance the test image. Fuzzy-entropy: Normally, the concept of the entropy is related to the measure of the vagueness in the image. Entropy supported image enhancement task considers the improvement of the vagueness (suspicious section) by altering the pixel levels. The Fuzzy-Entropy (Fuzzy) is one of the measures normally considered in image thresholding task to enhance the section to be examined [15,16].
Shannon's-entropy: Entropy based thresholding helps to find the optimal image
Kapur's-entropy: This entropy is one of the widely adopted thresholding function to enhance the traditional as well as medical grade images [19]. The earlier works on Kapur's confirms that this method helps to get better result on a class of gray as well as RGB images and the necessary information regarding this entropy can be accessed from [18].
Otsu: Compared to the entropy function, Otsu's between-class-variance is widely adopted to enhance the traditional digital photographs and the complete information and the related mathematical expression can be found in [20].
Segmentation and classification are the two commonly adopted methods during the medical image processing. The segmentation technique is widely adopted to extract the suspicious section from the raw/enhanced medical images of a chosen dimension. Mining the essential segment from the enhance image is quite easy and hence, in this work, the chosen segmentation approach is implemented to extract the GP section from the enhanced RGB image. Based on the operator involvement, it is classified as semi/fully automated technique.
3.4.1 Fully-Automated Segmentation
In this scheme, the implemented algorithm can mine the suspicious section from the medical image without the operator's assistance. In this work, the techniques, such as WS and MRF are employed for the automated mining of GP from thresholded CI and EI. The WS involves in a series of operations, such as edge detection, watershed fill, morphological dilation, enhancement and extraction. The earlier works clearly presents the details of WS [21]. The MRF based segmentation involves in MRF enhancement and morphology based segmentation. This technique will segregate the given image into three sections, such as suspicious section, normal segment and background and the details on this scheme can be found in [18].
3.4.2 Semi-Automated Segmentation
In this, operator's help is necessary to initiate the algorithm and then this technique automatically explores the necessary pixel groups based on the iteration level and finally stops and provides the binary image as the outcome. This work considered the methods, like CV [22], DRLS [23,24] and AC [25] to extract the GP and every approach needs an initial bounding box, which is to be assigned by the operator. Every bounding box is associated with a flexible line which alters its orientation to explore the pixel group to be extracted. The essential information regarding the semi-automated segmentation can be found in [15,18].
The proposed disease detection framework consist a tri-level threshold followed by the segmentation and validation. During this process, the following values are assigned for the AOA, number of agents = 30, search dimension = 3, number of iterations
where,

Figure 4: Sample test image of CVC database (a) Image (b) GT (c) Histogram
The performance of the developed disease detection system must be confirmed to measure the clinical significance of the proposed technique. In the literature, well known image SM are computed to verify the performance of the proposed scheme and the measures considered in this work can be found in Fig. 5. The experimental investigation is implemented using a workstation of Intel i5 2.5 GHz processor with 16 GB RAM and 2 GB VRAM set with MATLAB®.

Figure 5: Computation of similarity measures using positive and negative pixels
This section presents the outcome attained during the experimental work and its discussions. Initially, the AOA and Fuzzy based image enhancement is implemented using the CVC dataset and the enhanced GP section is mined using the chosen semi/fully-automated segmentation scheme.
Fig. 6 shows the result attained with the WS scheme in which Fig 7a depicts the enhanced test image with AOA, Figs. 6b–6e depicts the outcome of edge detection, watershed fill, morphological dilation and localized GP section, respectively. The localized pixels are extracted as the binary GP section and the final phase of the WS algorithm. The main advantage of the WS is, it is an automated scheme and before the initiation only the disc size (disc = 20) is to be assigned. The extracted binary image is then separately stored for further analysis. Followed by the WS, the MRF scheme is then implemented and the extracted GP section is then stored.
In order to test the performance of the semi-automated segmentation on the chosen image database, the methods, such as CV, DRLS and AC are separately tested on every test image. Fig. 7 depicts the segmentation outcome of the CV technique. Initially, based on the GP section to be extracted, a bounding-box (BB) is to be initiated and the BB is allowed to converge towards the pixel groups of the GP. This process continues till the contour encircles all the possible pixels of the GP and finally, the pixels inside the converged contour is extracted and presented as a binary image. Figs 7a–7d shows the results attained for Fuzzy + CV, Shannon + CV, Kapur + CV and Otsu + CV respectively. Similar BB is initiated in DRLS and AC and the attained results are stored separately for the AOA enhancement with Fuzzy, Shannon, Kapur and Otsu as depicted in Fig. 8.
Fig. 8 depicts the binary GP images of the adopted thresholding and segmentation procedure. After getting the essential GP fragment; it is then compared with the associated GT and the necessary SM are computed. Tab. 2 shows the computed SM and from this table, it can be noted that the entropy supported scheme provides the expected result compared to the Otsu enhanced images. The overall performance of the proposed scheme is then verified using a Glyph-Plot as in Fig. 9 with six SM and the attained pattern with bigger area is considered as the superior result [25]. From this plot, it is confirmed that the Kaput+CV (K+CV) offers the better result compared to other techniques. Similarly, the overall result by the Otsu+WS (O+WS) is poor and this confirms that the Otsu's thresholding is unsuitable to examine the CI and EI considered in this research work.

Figure 6: Result attained with AOA thresholding and WS (a) Threshold (b) Edges (c) Fill (d) Dilation (e) Localization

Figure 7: Result obtained with AOA thresholding and CV segmentation (a) Fuzzy + CV (b) Shannon + CV (c) Kapur + CV (d) Otsu + CV

Figure 8: The extracted GP segments of sample test image
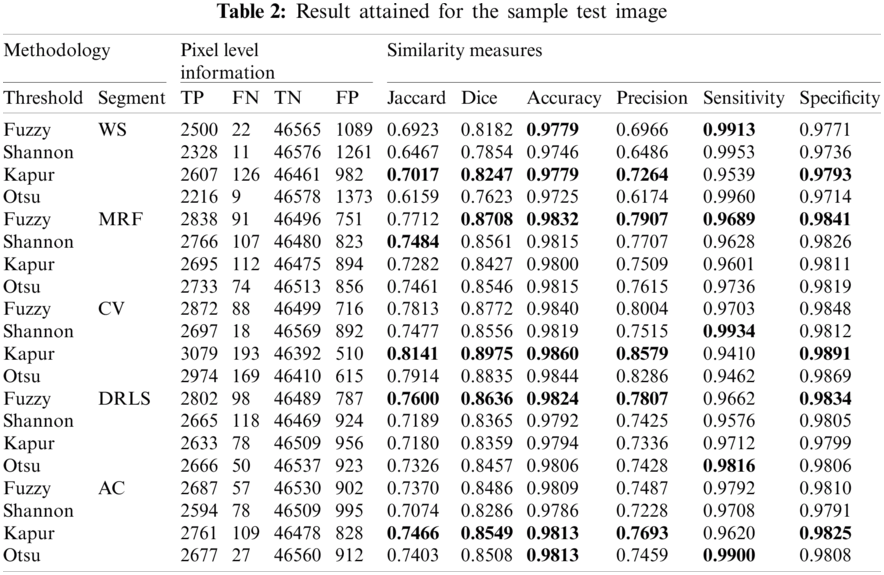

Figure 9: The Glyph-plot of the similarity measures attained with sample image
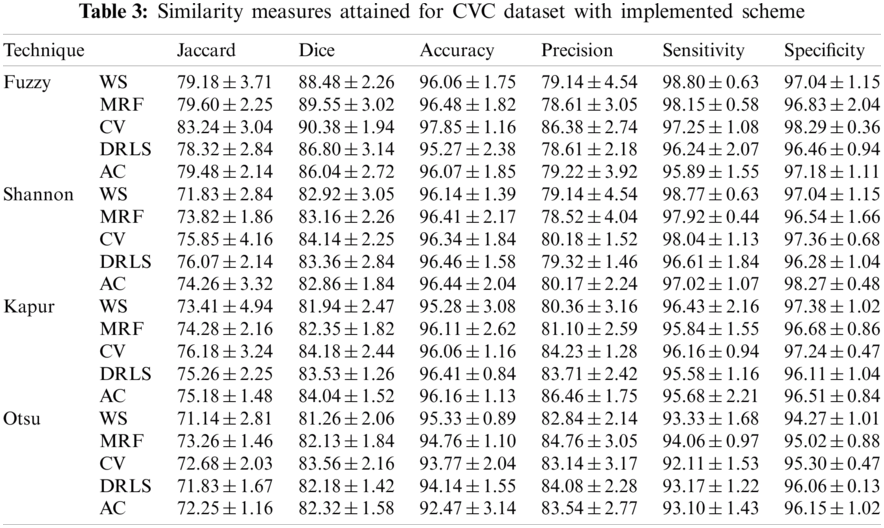
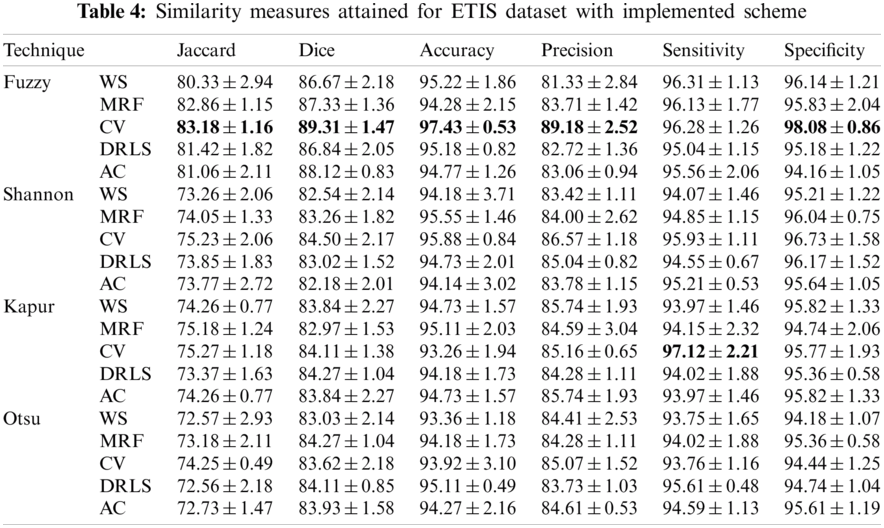
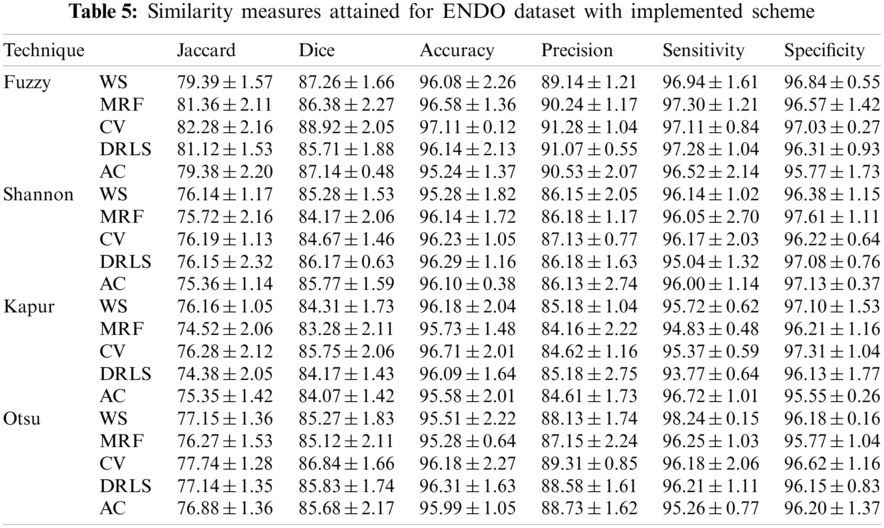
The proposed joint thresholding and segmentation scheme provided the expected result on the sample test image. Later, every image of the considered database, such as CVC, ETIS, ENDO, and Kvasir are separately examined and the results are presented. Tab. 3 presents the SM (mean ± SD) attained for the CVC dataset. During this study, all the 612 images are separately examined using every thresholding and segmentation scheme and the final results are presented for the evaluation. From this table, it can be confirmed that the SMs, such as Jaccard, Dice, accuracy, precision and specificity attained with Fuzzy + CV (F + CV) is superior compared to the alternatives. Further, Fuzzy + WS helped to achieve a better sensitivity of >98%. This confirms that, for the CVC, the AOA combined with Fuzzy provides the enhanced GP segment compared to other thresholding functions. Also, the semi-automated CV scheme outperforms the segmentation outcome of WS, MRF, DRLS and AC. Similar experimental investigation is then proposed on the datasets, like ETIS (196 images), ENDO (127 images) and Kvasir (300 images) and the mean of SM are depicted in Tabs. 4–6 respectively. From these results, it can be noted that the overall result by F + CV is better compared to the alternative methods, irrespective of the image complexity, the proposed F + CV helped to get better values of Jaccard, Dice, accuracy and precision in every dataset considered in this research work.

After computing the essential SM from every dataset, a comparative assessment is executed to verify the GP detection performance of the F+CV on the CI and EI as shown in Fig. 10. From this figure, it can be observed that the Jaccard, Dice, accuracy and precision provided by the F+CV is better on EI compared to the CI. The outcome of this research work confirms that the proposed AOA supported joint thresholding and segmentation is clinically significant and in future this scheme can be considered to evaluate the GP segment in the clinically collected EI and CI. Further, the performance of the AOA is to be confirmed with other heuristic methods existing in the literature.

Figure 10: Performance evaluation of Fuzzy + CV on considered image datasets
The assessment of the suspicious section in CI and EI is essential to identify the nature and the severity of the Gastrointestinal-Disease (GD). In this research, AOA based joint thresholding and segmentation is implemented to extract and evaluate the abnormal section from the test image. In this research, initially a tri-level thresholding is implemented to enhance the test image using a chosen threshold function. After the enhancement, the GP section is then extracted with the chosen segmentation technique. In this work a detailed comparative study on thresholding functions, such as Fuzzy, Shannon's, Kapur's and Otsu's is initially presented and later the performance of the segmentation techniques, such as WS, MRF, CV, DRLS and AC is presented. The experimental investigation of this research confirms that the Fuzzy thresholding combined with the CV (Fuzzy+CV) helped to provide a better SM on the considered benchmark CI and EI datasets. From this research, it is confirmed that the AOA supported scheme provides a clinically significant result with better values of Jaccard, Dice, accuracy and precision and in future, it can be considered to examine the clinically collected CI and EI.
Acknowledgement: Authors of this research thanks the database contributors of CVC-ClinicDB, ETIS-Larib, EndoCV2020, Kvasir for providing the open access to the dataset for research purpose and thank to Deanship of Scientific Research at Majmaah University for supporting this work under the Project No. 155/46683. This research work was partially supported by Chiang Mai University.
Funding Statement: The authors received no specific funding for this study.
Conflicts of Interest: The authors declare that they have no conflicts of interest to report regarding the present study.
1. T. Aoki, N. Nagata, T. Shimbo, R. Niikura, T. Sakurai et al., “Development and validation of a risk scoring system for severe acute lower gastrointestinal bleeding,” Clinical Gastroenterology and Hepatology, vol. 14, no. 11, pp. 1562–1570, 2016. [Google Scholar]
2. M. A. Khan, M. S. Sarfraz, M. Alhaisoni, A. A. Albesher, S. Wang et al., “Stomachnet: Optimal deep learning features fusion for stomach abnormalities classification,” IEEE Access, vol. 8, pp. 197969–197981, 2020. [Google Scholar]
3. A. Liaqat, M. A. Khan, M. Sharif, M. Mittal, T. Saba et al., “Gastric tract infections detection and classification from wireless capsule endoscopy using computer vision techniques: A review,” Current Medical Imaging, vol. 16, no. 10, pp. 1229–1242, 2020. [Google Scholar]
4. L. Abualigah, D. Yousri, M. A. Elaziz, A. A. Ewees, M. A. Al-qanes et al., “Aquila optimizer: A novel meta-heuristic optimization algorithm,” Computers & Industrial Engineering, vol. 157, pp. 107250, 2021. [Google Scholar]
5. J. Bernal, F. J. Sánchez, G. Fernández-Esparrach, D. Gil, C. Rodríguez et al., “WM-Dova maps for accurate polyp highlighting in colonoscopy: Validation vs. saliency maps from physicians,” Computerized Medical Imaging and Graphics, vol. 43, pp. 99–111, 2015. [Google Scholar]
6. J. Silva, A. Histace, O. Romain, X. Dray and B. Granado, “Toward embedded detection of polyps in wce images for early diagnosis of colorectal cancer,” International Journal of Computer Assisted Radiology and Surgery, vol. 9, no. 2, pp. 283–293, 2014. [Google Scholar]
7. S. Ali, M. Dmitrieva, N. Ghatwary, S. Bano, G. Polat et al., “Deep learning for detection and segmentation of artefact and disease instances in gastrointestinal endoscopy,” Medical Image Analysis, vol. 70, pp. 102002, 2021. [Google Scholar]
8. D. Jha, P. H. Smedsrud, D. Johansen, T. de Lange, H. Johansen et al., “A comprehensive study on colorectal polyp segmentation with ResUNet++, conditional random field and test-time augmentation,” IEEE Journal of Biomedical and Health Informatics, vol. 25, no. 6, pp. 2029–2040, 2021. [Google Scholar]
9. F. Deeba, F. M. Bui and K. A. Wahid, “Computer-aided polyp detection based on image enhancement and saliency-based selection,” Biomedical Signal Processing and Control, vol. 55, pp. 101530, 2020. [Google Scholar]
10. N. Dey, F. Shi and V. Rajinikanth, “Image examination system to detect gastric polyps from endoscopy images,” Information Technology and Intelligent Transportation Systems, vol. 323, pp. 107–116, 2020. [Google Scholar]
11. D. Vázquez, J. Bernal, F. J. Sánchez, G. F. Esparrach, A. López et al., “A benchmark for endoluminal scene segmentation of colonoscopy images,” Journal of Healthcare Engineering, vol. 2017, pp. 1–10, 2017. [Google Scholar]
12. S. Safarov and T. K. Whangbo, “A-DenseUNet: Adaptive densely connected UNET for polyp segmentation in colonoscopy images with atrous convolution,” Sensors, vol. 21, no. 4, pp. 1441, 2021. [Google Scholar]
13. N. Q. Nguyen, D. M. Vo and S. W. Lee, “Contour-aware polyp segmentation in colonoscopy images using detailed upsamling encoder-decoder networks,” IEEE Access, vol. 8, pp. 99495–99508, 2020. [Google Scholar]
14. N. R. Pal and S. K. Pal, “A review on image segmentation techniques,” Pattern Recognition, vol. 26, no. 9, pp. 1277–1294, 1993. [Google Scholar]
15. V. Rajinikanth and S. C. Satapathy, “Segmentation of ischemic stroke lesion in brain MRI based on social group optimization and fuzzy-tsallis entropy,” Arabian Journal for Science and Engineering, vol. 43, no. 8, pp. 4365–4378, 2018. [Google Scholar]
16. S. Sarkar, S. Paul, R. Burman, S. Das and S. S. Chaudhuri, “A fuzzy entropy based multi-level image thresholding using differential evolution,” Lecture Notes in Computer Science, vol. 8947, pp. 386–395, 2014. [Google Scholar]
17. P. L. Kannappan, “On shannon's entropy, directed divergence and inaccuracy,” Zeitschrift für Wahrscheinlichkeitstheorie und Verwandte Gebiete, vol. 22, no. 2, pp. 95–100, 1972. [Google Scholar]
18. V. Rajinikanth, S. C. Satapathy, S. L. Fernandes and S. Nachiappan, “Entropy based segmentation of tumor from brain MR images—A study with teaching learning based optimization,” Pattern Recognition Letters, vol. 94, pp. 87–95, 2017. [Google Scholar]
19. J. N. Kapur, P. K. Sahoo and A. K. Wong, “A new method for gray-level picture thresholding using the entropy of the histogram,” Computer Vision, Graphics, and Image Processing, vol. 29, no. 3, pp. 273–285, 1985. [Google Scholar]
20. N. Otsu, “A threshold selection method from gray-level histograms,” IEEE Transactions on Systems, Man, and Cybernetics, vol. 9, no. 1, pp. 62–66, 1979. [Google Scholar]
21. G. Hamarneh and X. Li, “Watershed segmentation using prior shape and appearance knowledge,” Image and Vision Computing, vol. 27, no. 1–2, pp. 59–68, 2009. [Google Scholar]
22. P. T. Chan and L. Vese, “An active contour model without edges,” IEEE Transactions on Image Processing, vol. 10, no. 2, pp. 266–277, 2001. [Google Scholar]
23. C. Li, C. Xu, C. Gui and M. D. Fox, “Distance regularized level set evolution and its application to image segmentation,” IEEE Transactions on Image Processing, vol. 19, no. 12, pp. 3243–3254, 2010. [Google Scholar]
24. M. Kass, A. Witkin and D. Terzopoulos, “Snakes: Active contour models,” International Journal of Computer Vision, vol. 1, no. 4, pp. 321–331, 1988. [Google Scholar]
25. D. H. Chung, P. A. Legg, M. L. Parry, R. Bown, I. W. Griffiths et al., “Glyph sorting: Interactive visualization for multi-dimensional data,” Information Visualization, vol. 14, no. 1, pp. 76–90, 2015. [Google Scholar]
 | This work is licensed under a Creative Commons Attribution 4.0 International License, which permits unrestricted use, distribution, and reproduction in any medium, provided the original work is properly cited. |