DOI:10.32604/cmc.2022.019750
| Computers, Materials & Continua DOI:10.32604/cmc.2022.019750 | |
| Article |
Sales Prediction and Product Recommendation Model Through User Behavior Analytics
School of Computer Sciences, Universiti Sains Malaysia, Minden, Penang, 11800, Malaysia
*Corresponding Author: Pantea Keikhosrokiani. Email: pantea@usm.my
Received: 24 April 2021; Accepted: 25 June 2021
Abstract: The COVID-19 has brought us unprecedented difficulties and thousands of companies have closed down. The general public has responded to call of the government to stay at home. Offline retail stores have been severely affected. Therefore, in order to transform a traditional offline sales model to the B2C model and to improve the shopping experience, this study aims to utilize historical sales data for exploring, building sales prediction and recommendation models. A novel data science life-cycle and process model with Recency, Frequency, and Monetary (RFM) analysis method with the combination of various analytics algorithms are utilized in this study for sales prediction and product recommendation through user behavior analytics. RFM analysis method is utilized for segmenting customer levels in the company to identify the importance of each level. For the purchase prediction model, XGBoost and Random Forest machine learning algorithms are used to build prediction models and 5-fold Cross-Validation method is utilized to evaluate their. For the product recommendation model, the association rules theory and Apriori algorithm are used to complete basket analysis and recommend products according to the outcomes. Moreover, some suggestions are proposed for the marketing department according to the outcomes. Overall, the XGBoost model achieved better performance and better accuracy with F1-score around 0.789. The proposed recommendation model provides good recommendation results and sales combinations for improving sales and market responsiveness. Furthermore, it recommend specific products to new customers. This study offered a very practical and useful business transformation case that assists companies in similar situations to transform their business models.
Keywords: Business transformation; behavior analytics; customer segmentation; sales prediction; product recommendation
Rapid developments in the field of machine learning (ML) and advances in computational power have enabled the possibility of applying implementation and optimization of machine learning in all types of industries [1,2]. The retail industry tried to optimize sales forecasting engine and recommendation engine using advanced algorithms Improved prediction and recommendation models based on user behavior analysis (UBA) provide many benefits for the retail industry. A start-up E-commerce company can find customers’ favorites, electronic equipment, books, or clothes from the historical shopping data. Furthermore, it is beneficial for a company to optimize its inventory, which is a meaningful way to decrease overstocking. Increasing popular items or similar goods with more features can maximize sales to avoid understocking, which can reduce sales due to lack of product availability [3]. Thus, a start-up E-commerce company must build and implement a system for predicting sales and goods recommendation.
The current common problems among companies are due to the company's long-term B2B business model. Many of the companies faced (1) limited market, (2) long sale cycle, and (3) complicated sale process due to the current market situation affected by COVID-19.Most of the consumer purchase decisions involve one or two decision-makers, therefore, the total time for purchase decisions is often short. The decision-maker in the B2B buying process is usually a team composed of experts in different positions or different fields who utilize highly collaborative team activities. The B2B sales cycle involves a series of complex factors, involving multiple stakeholders and decision-makers; therefore, the total decision time may be several months. The long sales cycle creates issues for the capital turnover of enterprises and raises the capital cost. The typical sales process in B2B requires a lot of business negotiations and is driven by quantifiable factors, rather than qualitative and emotional factors that drive B2C sales.
In this paper, we developed a customer segmentation model, a sales prediction model and a product recommendation model using machine learning algorithms with good performance to help business transformation of traditional stores. The remaining part of this paper is organized as follows: Section 2 describes Related works in the Literature, Section 3 presents the methodology including the proposed data science life-cycle and process model, Section 4 discusses the result, and Section 5 includes conclusions and future studies.
Sales prediction and product recommendation are considered as important topic in the field of big data and machine learning [3]. Therefore, existing studies are reviewed in this section to find the most relevant technologies and methods for sales prediction and product recommendation.
Recency, Frequency, and Monetary (RFM) is a customer segmentation method based on online store customer consumption behavior data. This method segments customers based on present customer behavior characteristics. The Customer Value Matrix (CVM) is developed for the retail environment of small businesses based on the RFM method [4]. This method is used by Boston Consulting Group's (BCG) Growth-Share Which is very easy-to-understand.
Sale prediction plays an essential role in modern business intelligence. Predictive analysis needs to be based on massive amounts of historical data. Sales can be regarded as a time series. Nowadays, many scholars have applied different time series models, such as ARIMA, GARCH, Holt-Winters, etc. Various time series methods can be found in some studies [5,6]. However, there are many sales forecasting cases that don't use time series methods as they use supervised machine learning methods such as tree-based machine learning, such as Random Forest [7] Gradient Boosting Machine [8]. Furthermore, Facebook Prophet, a forecasting tool, is published on GitHub in 2017 [9].
The goal of conducting a recommendation system is to suggest items to a particular user. Through historical sales data, the recommendation system predicts the ratings of an item that the user has not seen and purchased, then the system will recommend other similar items to the user [10]. There are mainly four common methods to conduct a recommendation system, (1) Content-Based Filtering, (2) Collaborative Filtering, (3) Hybrid Recommendation Systems, and (4) Association Rules [11,12]. However there are some important issues such as “The cold start problem” [13] and “Shilling attack detection” [14] which need to be addressed by designing recommendation system. The cold start problem refers to recommendations for novel users or new items and Shilling attack is related to the use of user-generated content data, such as user ratings and reviews by attackers to manipulate recommendation ranking [15]. These two important issues needs to be considered in the recommendation systems.
Evaluating and comparing the performance of models constructed using different algorithms is a crucial part of building machine learning models. Using many evaluation metrics can avoid model defects. For improving model performance, it is also crucial to choose the corresponding evaluation metrics such as Mean Absolute Error (MAE), Root Mean Square Error (RMSE), and Mean Absolute Percentage Error (MAPE), which have been used widely for solving regression problems such as stock prediction [16] and supply chain demand forecasting [17]. On the other hand, if it is a classification problem similar to this study, accuracy, precision, recall rate, F1-core, AUC and the evaluation metrics are preferred for evaluating the performance of the proposed model [15].
The dataset used for this study is from public dataset based on a traditional E-commerce platform, from past October 2019 to April 2020. For instance, “time” attribute is used as numeric attribute for describing the time behavior happened. The attribute “behavior _type” is a categorical attribute to identify whether user viewed a product, user added product to shopping cart, or user purchase the product. Attribute “product_id” is numerical and it is used as the products ID. The attribute “category_id” is numeric which is used for category ID of the product whereas “category” is categorical attribute utilized for category of the product. Another categorical attribute is “brand” which describes the brand name. The rest of the attributes such as “price”, “user_id”, and “user_session” are numeric utilized for price of a product, user ID, and users’ session ID respectively. Description of the dataset attributes are shown in Tab. 1.

Fig. 1 displays the counts of different user behaviors such as viewing the products, adding products to shopping card, and purchasing the product per month. The graph illustrates that the number of viewing the products is increased from October 2019 to December 2019. Then it decreases dramatically from December 2019 to March 2020. Finally, viewing behavior is increased from 4 to 5 on April 2020. Fig. 3 displays the conversion rate of purchase calculated according to results shown in Fig. 2.

Figure 1: Counts of three different behaviour

Figure 2: Percentage of each event type

Figure 3: Conversion rate in sale process
As shown in Fig. 3, since “cart” is a user behavior that determines purchase intentions between “view” and “purchase”, it can be seen that the conversion rate from “view” to “purchase” is only 4.77%. The results depicts that some users purchase directly without using “cart”, but it also shows that most of the users who browse the page more times use the shopping cart function less. The number of purchases accounted for 30.29% of the used shopping cart indicates that the stage from browsing to adding to the shopping cart is the key link in index improvement.
3.1 Proposed Data Science Life-Cycle
Fig. 4 shows the proposed data science life-cycle to address the problem and achieve the objectives of this study. The key phases of the proposed data science life-cycle are (1) understanding data, (2) data preprocessing, (3) modeling, (4) evaluation, and (5) developing the sales and marketing strategies, which are explained in details in the following sections.

Figure 4: The proposed data science life-cycle
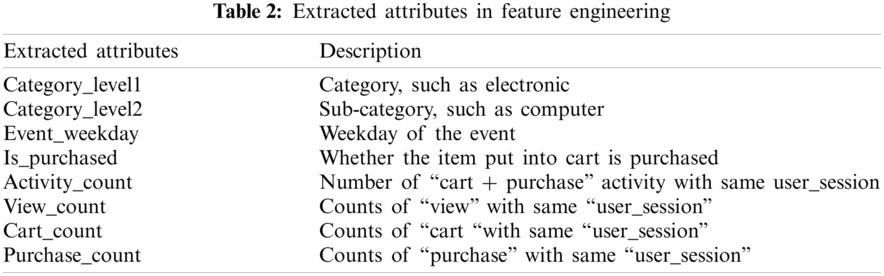
Before constructing the proposed model, many data preparation tasks are required to make the dataset suitable for machine learning algorithms. In this research, data preprocessing process includes (1) removing incomplete or duplicate instances and (2) feature engineering. There are some instances with the missing values in the dataset, which must be removed in the preprocessing stage as they will affect the performance of machine learning algorithms. Thus, the training dataset contains non-duplicated transaction (within the same session, only one record for a particular product in the cart is retained) with new feature. Moreover, dataset is in low dimensional space with limited number of attributes in which only 9 attributes are included in original dataset. To overcome this problem, we extracted some new features into the training dataset for modeling as shown in Tab. 2. We used those features, including the original price and brand to predict whether customers will eventually purchase the item included in the cart. Within the same session, we only keep one record for a particular product in the cart.
3.3 Constructing the Proposed Model
The model development stage is divided into three parts: (1) The first part is to use RFM method to develop a customer segmentation model and to identify customer value for achieving the first objective of the study. (2) The second part is to conduct the sales prediction model, which can predict the next month whole sales performance, or individual sales of a certain type of product. (3) The third part is to get the association information of frequently purchased items by analyzing the results from association rules based on Apriori algorithm. This information helps assist us in decision making process. We can recommend products to customers based on basket rules. For E-commerce, we can also optimize the location of the warehouse where the goods are located to save costs and increase economic benefits.
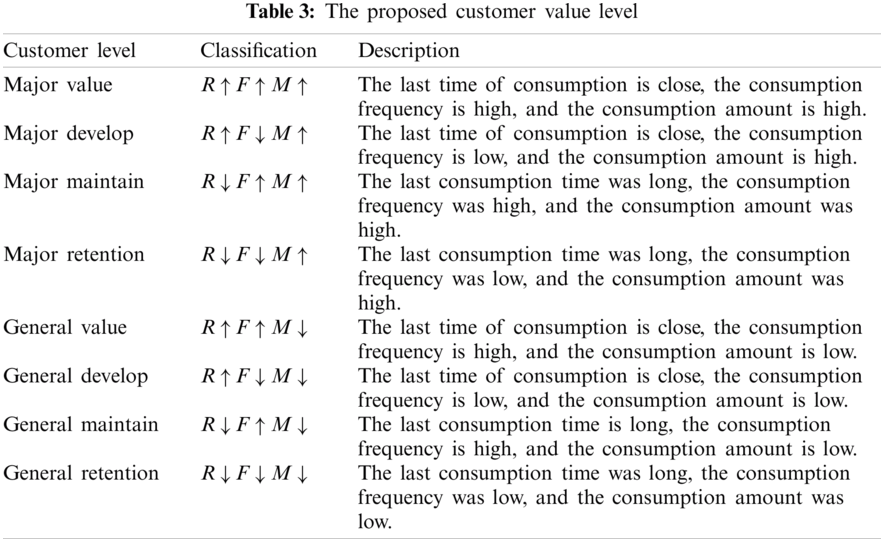
The most recent consumption (Recency), consumption frequency (Frequency) and consumption amount (Monetary) are regarded as important indicators to analyze and segment the customers. In RFM analysis, customers are sorted by the length of time from their last purchase to a given date in descending order (recency); by the number of transactions (frequency) in descending order; and by the amount of money spent in a given period (monetary) in descending order. The higher the total purchase amount of a customer over a period of time, the greater value the customer creates for the company [18].
The RFM score is defined as the follows:
where weights is discussed according to a particular problem and it is determined by experts. The high RFM scores represents high customer value.
RFM segmentation is an effective method to identify customer groups that are treated specially [19]. In this project, we conduct segmentation on customers with purchase experience. According to Tsai and Chiu [20], the sum of the weight of each RFM measure should be equal to 1. In various academic papers or industries, the weights of recency, frequency and monetary need to be determined by expert's opinions according to research goals or actual business objectives. In the project, the main three weight values, and the final weight value for recency, frequency and monetary are from the experiments results and expert's opinions. we set
XGBoost and Random Forest have been used widely in different kinds of research or Kaggle competition because of achieving higher accuracy. Another of advantages of XGBoost is that it is fast to execute, and it provides different hyperparameters like depth of trees, jobs etc. Random Forest can make use of more trees to give high accuracy and prevent overfitting. According to [6], and Wang et al. [15], XGBoost and Random Forest algorithms have achieved a good performance in sales recommendation field. In this project, these two algorithms are applied to the process of building sales prediction models to see the better performance and the better model to get final sales prediction results after comparison.
Association rule is a rule-based machine learning method that can find interesting relations among variables in large datasets. Agrawal et al. [21] introduced association rules for finding relations between products based on historical transaction data in supermarkets. For example, the rule
Transactions set is defined as
Apriori is considered as the best algorithm for identifying association rules within historical transaction dataset. It is designed based on association rules to find the relationship between different items of dataset. Using Apriori algorithm, firstly, we find frequent item sets in the dataset and analyze them accordingly to establish association rules, then we evaluate the decision data based on these rules, finally, we select the rules with greater confidence and support than the minimum required one [27]. The algorithm is usually used in the decision support area. The main idea of the Apriori algorithm is to obtain the frequent item sets is a hierarchical search and iterative method, which uses a priori knowledge of infrequent item sets. K item sets are used to explore (K + 1) item sets. There are few specific steps for finding frequent item sets as follows: The first step is to select the length K = 1, scan the database, and determine all frequent item sets when K = 1. Secondly, the step size increases based on the frequent item sets, the new item sets are calculated again, and a real frequent itemset is generated. Finally, the second step needs to be repeated until no new item sets can be found and the algorithm is terminated [28].
Association rule using Apriori knowledge provides the ability to capture the user preference. After identifying the user preferences, a valid product recommendation is developed;therefore, we can recommend products to customers to get better sales performance. And according to Fatoni et al. [29], the association rules can generate precise recommendations with confidence values 76.92%, which is a relatively satisfactory confidence. Fig. 5 displays the proposed model design process in this study for the sales prediction and product recommendation through user behavior analytics. The proposed model utilize RFM method for customer segmentation, XGBoost, Random Forest and Decision Tree algorithms are combined for sales prediction model, and Apriori algorithm is used to build the basket analysis for product recommendation system.

Figure 5: Model design process
3.4 Model Validation and Evaluation
In the process building models, we use K-fold Cross-Validation method to evaluate the performance of the purchase prediction model, where K is set to be 5.
3.5 Develop Strategy and Implementation
Based on the results of the sales prediction and product recommendation model, we can develop business strategy for sales and inventory management to improve the store profit. In the model development process, Jupyter Notebook and PyCharm are used as the main tools. Moreover, multiple libraries are utilized including Pandas, NumPy, Matplotlib, Scikit-learn, and the open-source software library XGBoost.
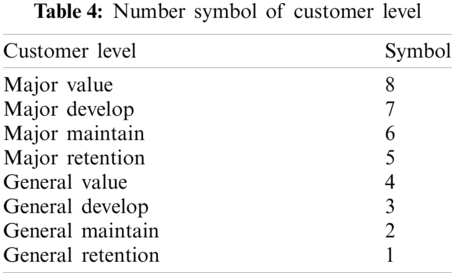
In RFM method, we use the “purchase” data for October 2019 in the model. We need to determine which combination of columns information constitute the order, and transfer the “time” which is deal date time with the format of “%Y%m%d”. Among 742849 rows of data in dataset, 193342 rows are duplicated or incomplete data, thus, we remove them from the datasets. The total number of “purchase” data after removing noisy data became 549507. Tab. 4 illustrates the number of symbols used in each customer level. We set 8 customer levels and use the size of each number to indicate the importance of the customer level, 1, 2, 3, 4, 5, 6, 7 and 8 in the results respectively (Tab. 4). The higher the number of symbol, the more important the customer level become. For instance, the most important customer level is “Major Value” which is assigned as number 8. On the other hand, “General Retention” is the least important customer level that is illustrated as number 1 in Tab. 4.
According to expert's opinion, the data contains amount of durable goods such as phone, computer, air conditioner, etc. The results shown in Fig. 6 indicate that some electric companies such as Samsung, Apple, Xiaomi, Huawei, Oppo, LG, Acer, Indesit, Elenberg and Artel are among the top 10 popular brands based on money spent by customers. In RFM final analysis, we set weightR to 0.4, weightF to 0.1, weightM to 0.5.

Figure 6: Top 10 popular product brand
Fig. 7 demonstrates the RFM analysis results using data for the month October 2019, including the number of customers at each level and money spent by customers at each level. These information is essential for developing reliable and highly implementable sales strategies such as promotion price, whether to provide customers with trial products, vouchers, etc. It can also provide useful tips for prediction and recommendation systems, as shown in Figs. 7 and 8. As illustrated in Figs. 7 and 8, most of the customers belong to the “Major Value Customer” level (28.86%) with the highest rate of money spent around 40.29%. “Major Retention Customer” refers to the second highest group of customer who made the big purchase but did not buy anything for a long time. This group of customer is already on the verge of leaving, and it is very likely to be lost. But this group of customers have the great value to the company's actual contribution. Therefore, we can take the form of contacts or visits to survey the reasons for the low repurchase rate, thereby increasing the retention rate. For “Major Develop Customer” and “Major Maintain Customer”, we need to send messages of the new functions or features for the new products to attract them. However, they can decide whether they require any of these advertised products.

Figure 7: Number of customers in each level and percentage of different customer levels

Figure 8: Money spent by customers in each level and percentage of consumption from different customer levels
For General Customer, their typical characteristic is that the consumption amount is not high enough, but they also have different categories. The “General Value Customer” group is around 10.97% of the total customers, but the amount of consumption only accounts for 8.64%. We can recommend higher-priced products of the same type for them, while introducing other good functions of new products and providing free trial to increase customer interest. For “General Develop Customer” and “General Maintain Customer”, we can appropriately give them vouchers to stimulate the purchase of products or recommend them to purchase accessories with a lower price to improve their experience, such as mobile phone cases. The “General Retention Customer” group have not placed any order for a long time, thus, we basically think it belongs to customer churn.
We applied XGBoost, Random Forest and Decision Tree algorithms into the sales prediction model to compare their performance and get final prediction results through the final model which has the best performance in this project. In the process building models, we use K-fold Cross-Validation method to evaluate the performance of the purchase prediction model, where K is set to be 5. After the features engineering and parameters tuning, we conducted and compared these three models. The comparison results of three models including XGBoost, Random Forest and Decision Tree using evaluation metrics are shown in Tab. 5.
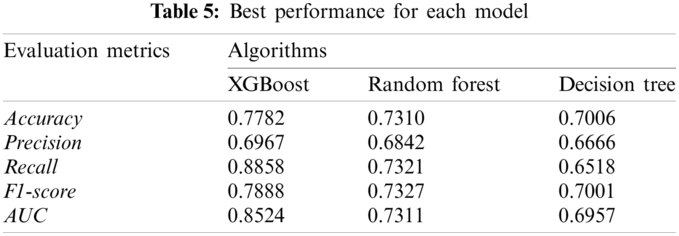
Due to the better performance of model using XGBoost algorithm, we make it as the final purchase prediction model. The detail parameters that were tested in grid search approach are shown in Tab. 6, where it also contains the best parameters used in the final prediction system. Then we conclude the output of the predicted sales through the system.
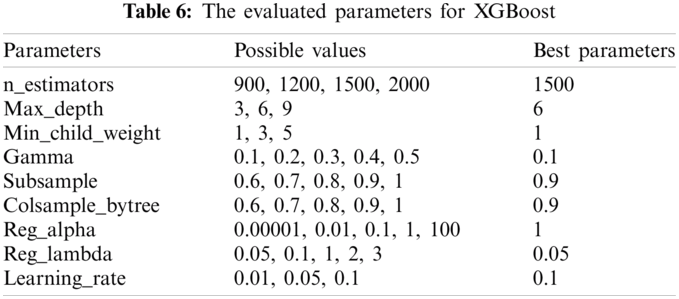
Fig. 9 shows the ROC curve where we can calculate the value of the area under the curve. Based on the results, AUC value is considered as excellent for the values between 0.9 and 1, good for the values between 0.8 and 0.9 [30]. The results indicate that our prediction accuracy is good. Hence, we can conclude that the proposed model can predict the purchase action with high accuracy.

Figure 9: ROC curve of final purchase prediction model
Fig. 10 displays the total amount of sales compared to the total predicted sales from 2019–10-01 to 2019-12-30.

Figure 10: Comparison of predicted and actual sales
We can use simple interactive interface to predict the purchase action for each product category. The result is presented according to the daily sales, which is the total number of product sales and not the total amount. For example, Fig. 11 illustrates a comparison chart for computers actual sales and predicted sales. The total number of sales for computers was around 1500 units while the predicted sales was 2000 units on December 16, 2019.

Figure 11: Comparison of predicted and actual sales of computer
4.3 Product Recommendation Model
Market basket analysis is one of the key techniques used by large retailers to discover the associations between items. The market basket analysis starts with constructing shopping basket data, which is from the purchase combination dataset including user ID, purchase ID and product ID, summarized by user session of the same user ID. Fig. 12 displays the Top 15 popular products and the count of each one.

Figure 12: Top 15 popular products
For mining frequent itemsets and association rules, we use Apriori algorithm in Arules library. After some experiments, we set the minimum support value to 0.001 and the minimum confidence value to 0.1, and we sort the rules by decreasing lift, as shown in Fig. 13.

Figure 13: Result of association rules
From the marketing perspective, it is usually sufficient to focus only on support and confidence to obtain maximum marketing response, that means more customer may purchase the recommended products by the proposed system. For example for the product 1004565 shown in Fig. 14 we want to get the highest marketing response rate, which product should we recommend on this payment success page? The higher the confidence, the more likely the customer will buy the item on the right column. Fig. 14 displays the steps and results to get the highest marketing response and to sort them by confidence level. Furthermore, it depicts we should recommend the product 1004767 as the first product to the customer.

Figure 14: Recommend from marketing perspective
From the perspective of maximizing the sales, Fig. 15 shows that it is better to focus on lift. The bigger the lift, the better value will be gained, thus, we should recommend the product 1004785 as the first product for the customers because its lift value is the largest around 12. This results indicate that the relationship between product 1004565 and 1004785 is stronger than other products, that means customers will purchase product 1004785 after purchasing product 1004565 with the greatest probability.

Figure 15: Recommend from the perspective of maximizing sales
E-commerce platforms often face some new customers who have never purchased a product and we don't have their transaction data to see their preferences, but we can still recommend products to them. For example, Fig. 16 shows that if we want to recommend product 1005203 to customers, using the right-hand rule, is better to find a high-frequency set that appears with product 1005203 and recommend them together. Hence, Fig. 17 shows that we should recommend the products 1005195, 1005256, 1005217, 1004904, 1004723 and 1005203 together to the new customers.

Figure 16: Products recommendation for new customers

Figure 17: Recommendation example for one specific customer
For a specific customer, we can use the steps shown in Fig. 17 to recommend the products. The products recommended are sorted by lift value of association rules. For example, Fig. 17 shows the process of determining the specific customer, the steps, and interaction with the model which recommend the products through customer's historical purchased products included in frequent itemsets and association rules. For example, the recommendation model can recommend product (product ID: 1004226, 1004249, 1005115, 1005105, 1002544) for user (user ID: 557642444) according to association rules with the lift value greater than 2 after the customer purchased the product 1004227.
In this research, we proposed a novel data science life-cycle and process model with RFM analysis method and the combination of various analytics algorithms are utilized for sales prediction and product recommendation through user behavior analytics. In order to propose a sales prediction and product recommendation model, we reviewed the important part and process of traditional store business transformation. We used customer segmentation through RFM methods, and we get clear customer levels from the results as it is a crucial base for E-commerce companies. We also used three machine learning methods in prediction system, and Apriori algorithm to build the basket analysis for recommendation system. In prediction system, we compared the performance of XGBoost and Random Forest in purchase prediction, then we utilized the better one for the final prediction model. This prediction system can judge with 77.82% accuracy whether customers will place orders after customer behaviors such as viewing and adding into cart, then count the results, which is roughly inventory amount required for various commodities. In recommendation system, we used the association rules to analyze the transaction datasets to get strong association rules of historical products purchased by customers. The system can demonstrate how the online shopping platform recommend products to customers. This research is also useful for an E-commerce company to improve its inventory management and to improve the company reputation.
Although the existing customer segmentation, prediction and recommendation systems can predict purchase and recommend suitable products, we believe that there are still a lot to do in order to get better performance. For instance, two important issues of “The cold start problem” [13] and “Shilling attack detection” [14] can be addressed in the recommendation systems. Here we focus on the limitations of these methods which can be resolved in the future work.
Acknowledgement: The authors are thankful to the School of Computer Sciences, Universiti Sains Malaysia and Dr Nasuha Lee Abdullah for the unlimited support. Furthermore, the authors appreciate Division of Research & Innovation, Universiti Sains Malaysia for funding this research.
Funding Statement: This research is funded by the School of Computer Sciences, and Division of Research & Innovation, Universiti Sains Malaysia, Short Term Grant (304/PKOMP/6315435) granted to Pantea Keikhosrokiani.
Conflicts of Interest: The authors declare that they have no conflicts of interest to report regarding the present study.
1. O. Abdelrahman and P. Keikhosrokiani, “Assembly line anomaly detection and root cause analysis using machine learning,” IEEE Access, vol. 8, pp. 189661–189672, 2020. [Google Scholar]
2. I. Teoh Y. Zhe and P. Keikhosrokiani, “Knowledge workers mental workload prediction using optimised ELANFIS,” Applied Intelligence, vol. 51, no. 4, pp. 2406–2430, 2020. [Google Scholar]
3. B. Sarwar, G. Karypis, J. Konstan and J. Riedl, “Analysis of recommendation algorithms for e-commerce,” in Presented at the Proc. of the 2nd ACM Conf. on Electronic Commerce, Minneapolis, Minnesota, USA, 2000. [Google Scholar]
4. C. Marcus, “A practical yet meaningful approach to customer segmentation,” Journal of Consumer Marketing, vol. 15, no. 5, pp. 494–504, 1998. [Google Scholar]
5. C. P. d. Veiga, C. R. P. d. Veiga, W. Puchalski, L. d. S. Coelho and U. Tortato, “Demand forecasting based on natural computing approaches applied to the foodstuff retail segment,” Journal of Retailing and Consumer Services, vol. 31, pp. 174–181, 2016. [Google Scholar]
6. B. M. Pavlyshenko, “Machine-learning models for sales time series forecasting,” Data, vol. 4, no. 1, pp. 15, 2019. [Google Scholar]
7. B. Boehmke and B. M. Greenwell, in Hands-on Machine Learning with R, 1st ed., New York: CRC Press, pp. 488, 2019. [Google Scholar]
8. J. H. Friedman, “Greedy function approximation: A gradient boosting machine,” The Annals of Statistics, vol. 29, no. 5, pp. 1189–1232, 2001. [Google Scholar]
9. S. J. Taylor and B. Letham, “Forecasting at scale,” The American Statistician, vol. 72, no. 1, pp. 37–45, 2018. [Google Scholar]
10. G. Adomavicius and A. Tuzhilin, “Toward the next generation of recommender systems: A survey of the state-of-the-art and possible extensions,” Transactions on Knowledge and Data Engineering, vol. 17, pp. 734–749, 2005. [Google Scholar]
11. S. Li and E. Karahanna, “Online recommendation systems in a B2C E-commerce context: A review and future directions,” Journal of the Association for Information Systems, vol. 16, no. 2, pp. 72–107, 2015. [Google Scholar]
12. M. Soares and P. Viana, “Tuning metadata for better movie content-based recommendation systems,” Multimedia Tools and Applications, vol. 74, no. 17, pp. 7015–7036, 2015. [Google Scholar]
13. B. Lika, K. Kolomvatsos and S. Hadjiefthymiades, “Facing the cold start problem in recommender systems,” Expert Systems with Applications, vol. 41, no. 4, Part 2, pp. 2065–2073, 2014. [Google Scholar]
14. W. Zhou, J. Wen, Q. Qu, J. Zeng and T. Cheng, “Shilling attack detection for recommender systems based on credibility of group users and rating time series,” PLOS One, vol. 13, no. 5, pp. e0196533, 2018. [Google Scholar]
15. Y. Wang, D. Feng, D. Li, X. Chen, Y. Zhao et al., “A mobile recommendation system based on logistic regression and gradient boosting decision trees,” in Presented at the the Int. Joint Conf. on Neural Networks, Vancouver, BC, Canada, 2016. [Google Scholar]
16. Y. Chen and Y. Hao, “A feature weighted support vector machine and K-nearest neighbor algorithm for stock market indices prediction,” Expert Systems with Applications, vol. 80, pp. 340–355, 2017. [Google Scholar]
17. Z. H. Kilimci, A. O. Akyuz, M. Uysal, S. Akyokus, M. O. Uysal et al., “An improved demand forecasting model using deep learning approach and proposed decision integration strategy for supply chain,” Complexity, vol. 2019, pp. 15, 2019. [Google Scholar]
18. R. C. Blattberg, B.-D. Kim and S. A. Nesl, Database Marketing: Analyzing and Managing Customers, 1st ed., (International series in quantitative marketing, no. 18New York: Springer, pp. 872, 2008. [Google Scholar]
19. S. Allegue, T. Abdellatif and K. Bannour, “RFMC: A spending-category segmentation,” in 2020 IEEE 29th Int. Conf. on Enabling Technologies: Infrastructure for Collaborative Enterprises (WETICEBayonne, France, pp. 165–170, 2020. [Google Scholar]
20. C. Y. Tsai and C. C. Chiu, “A purchase-based market segmentation methodology,” Expert Systems with Applications, vol. 27, no. 2, pp. 265–276, 2004. [Google Scholar]
21. R. Agrawal, T. Imielinski and A. Swami, “Mining association in large databases,” in Proc. of the 1993 ACM SIGMOD Int. Conf. on Management of Data - SIGMOD ′93, Washington D.C., pp. 207–216, 1993. [Google Scholar]
22. P. Keikhosrokiani, N. Mustaffa, M. I. Sarwar and N. Zakaria, “E-Torch: A mobile commerce location-based promotion system,” The International Technology Management Review, vol. 3, no. 3, pp. 140–159, 2013. [Google Scholar]
23. Q. Chen, M. Zhang and X. Zhao, “Analysing customer behaviour in mobile app usage,” Industrial Management & Data Systems, vol. 117, pp. 425–438, 2017. [Google Scholar]
24. P. Keikhosrokiani, “The role of m-Commerce literacy on the attitude towards using e-Torch in Penang, Malaysia,” In: J. Xu and X. Gao, (Eds.E-Business in the 21st Century: Essential Topics and Studies, vol. 7, 2nd ed., Singapore: World Scientific, pp. 309–333, 2021. [Google Scholar]
25. P. Keikhosrokiani, N. Mustaffa, F. Damanhoori, N. Zakaria and M. I. Sarwar, “Enhancing E-business using location-based advertisement system,” in Proc. of the 1st Taibah University Int. Conf. on Computing and Information Technology, Al-Madinah Al-Munawwarah, Saudi Arabia, 2012. [Google Scholar]
26. R. Agarwal and R. Srikant, “Fast algorithms for mining association rules in datamining,” in The Proc. of the 20th Int. Conf. on Very Large Data Bases, Santiago, Chile, pp. 487–499, 1994. [Google Scholar]
27. G. Piatetsky-Shapiro, “Discovery, analysis, and presentation of strong rules,” Knowledge Discovery in Databases, vol. 248, pp. 229–238, 1991. [Google Scholar]
28. Y. Guo, M. Wang and X. Li, “Application of an improved apriori algorithm in a mobile e-commerce recommendation system,” Industrial Management and Data Systems, vol. 117, no. 2, pp. 287–303, 2017. [Google Scholar]
29. C. S. Fatoni, E. Utami and F. W. Wibowo, “Online store product recommendation system uses apriori method,” Journal of Physics: Conference Series, vol. 1140, 2018. [Google Scholar]
30. J. N. Mandrekar, “Receiver operating characteristic curve in diagnostic test assessment,” Journal of Thoracic Oncology, vol. 5, no. 9, pp. 1315–1316, 2010. [Google Scholar]
 | This work is licensed under a Creative Commons Attribution 4.0 International License, which permits unrestricted use, distribution, and reproduction in any medium, provided the original work is properly cited. |