DOI:10.32604/cmc.2022.019152
| Computers, Materials & Continua DOI:10.32604/cmc.2022.019152 | |
| Article |
Engagement Detection Based on Analyzing Micro Body Gestures Using 3D CNN
1Department of Computer Science, King Abdul-Aziz University, Jeddah, Saudi Arabia
2MIRACL-Laboratory, Sfax, Tunisia
*Corresponding Author: Shoroog Khenkar. Email: Skhenkar0001@stu.kau.edu.sa
Received: 04 April 2021; Accepted: 23 June 2021
Abstract: This paper proposes a novel, efficient and affordable approach to detect the students’ engagement levels in an e-learning environment by using webcams. Our method analyzes spatiotemporal features of e-learners’ micro body gestures, which will be mapped to emotions and appropriate engagement states. The proposed engagement detection model uses a three-dimensional convolutional neural network to analyze both temporal and spatial information across video frames. We follow a transfer learning approach by using the C3D model that was trained on the Sports-1M dataset. The adopted C3D model was used based on two different approaches; as a feature extractor with linear classifiers and a classifier after applying fine-tuning to the pre-trained model. Our model was tested and its performance was evaluated and compared to the existing models. It proved its effectiveness and superiority over the other existing methods with an accuracy of 94%. The results of this work will contribute to the development of smart and interactive e-learning systems with adaptive responses based on users’ engagement levels.
Keywords: Micro body gestures; engagement detection; 3D CNN; transfer learning; e-learning; spatiotemporal features
According to recent researches [1–4], a large number of universities and educational institutions are increasingly adopting Electronic learning (E-learning) systems; especially after the spread of COVID-19, when schools and universities worldwide announced the closure of dozens of their campuses and governments started exploring alternatives to traditional school programs for a continuous educational process. E-learning systems provide different educational activities (e.g., reading, online meetings and exams) in an efficient, affordable and flexible manner. However, e-learners express different engagement states during these activities (e.g., frustration, excitement, etc.). Negative engagement states may decrease e-learners’ performances leading to potential dropouts. To provide a better pedagogical experience, we suggest the notion of personalizing contents and activities based on users’ engagement levels. Yet, most current e-learning systems do not have engagement level indicators/detectors [5,6]. Thus, it is desired to implement e-leaning systems that have the ability to automatically detect and recognize students’ engagement states [7] in order to improve e-learners’ pedagogical experiences. This will enable e-learning systems to offer proper learning contents and adapt educational materials to meet learners’ needs based on students’ engagement states and preferences [8].
In this work, we propose a novel and affordable computer vision-based method using webcams to be able to detect e-learners’ engagement levels. It aims at learning and analyzing the spatiotemporal features of micro body gestures expressed by e-learners and mapping them to the appropriate engagement states by using the Deep Transfer Learning approach (DTL) and Deep 3-Dimensional Convolutional Neural Networks (3D CNN). Features related to e-learners’ engagement detection methods are still arguable. They include both vision-based features and non-vision-based features. Thus, various datasets with different features have been explored in previous studies, such as body poses, facial expressions, audio features and keyboard/mouse movements [9]. Hence, we have created a new video dataset for learners’ engagement detection. In fact, the development of new datasets in any new approach is very crucial. In spite of the importance of automatic engagement detection applications in an e-learning context, video datasets remain unavailable, especially with realistic settings and scenarios. Our new dataset aims at analyzing and associating e-learners’ micro body gestures, emotional states and engagement levels.
Some related studies utilized deep learning techniques such as, CNN, ANN and DBN [10–12] while others employed traditional machine learning techniques like, SVM and Naïve Bayes [6,13,14]. Vision-based methods have proven their efficiency in detecting e-learners’ engagement levels. These methods considers nonverbal communication cues. More attention has been directed to some nonverbal communication cues, like facial expressions, compared to other cues, such as body behaviours. Hence, diverse engagement detection methods [6,13,14] are based on extracting image features from facial expressions and ignoring the fact that body gestures are as important as facial expressions [10,15–18]. However, even the existing methods that have considered body motions are still lack subjects’ motion modelling due to the analysis of spatial image features without extracting temporal features. In this work, we infer human emotions from the video stream by analyzing the spontaneous reactions and the physiological behaviours of the user, since most emotion theories confirm that both body actions and gestures are important emotional cues [10,15–19]. These spontaneous body gestures reflect real time emotions. In this paper, we also provide a new definition for both macro body actions and micro body actions. In addition, we design a frame selection strategy to choose key-frames, find and derive a representative set of frames from a video clip. Our key-frame selection is based on the cosine similarity between video frames. It has proven its efficiency in improving the quality of the video dataset and detection performance.
The proposed method will open up new research opportunities for developing and personalising interactive e-learning systems. The novelty of this research stems from the fact that it represents the first suggested work that uses a deep 3D CNN model to learn the spatiotemporal features of micro body gestures for engagement level detection in video inputs. We reported that the 3D CNN model performs well in learning motion and appearance information for the detection of e-learners’ engagement levels based on their expressed micro body gestures. The proposed approach outperforms other vision-based methods in the engagement detection task. Contributions: The major contributions of this research are summarized as follows:
• We create a new video dataset for students’ engagement detection of students in an e-learning environment. This dataset is recorded in uncontrolled natural settings using built-in webcams.
• Our new dataset limitations and quality problems have been explored and solved by the reconstruction of the dataset using our method of key-frames selection based on cosine similarity.
• We provide a new definition for both macro body actions and micro body actions.
• We experimentally investigate and implement the first 3D CNN learning model for the automatic detection of e-learners’ engagement levels in an e-learning environment.
• We explore different techniques, settings and approaches in order to produce the model with the best performance.
• We experimentally evaluate the performance of the proposed approaches by conducting three main experiments.
In this paper, we highlight the importance of learning spatiotemporal features of micro body gestures for detecting e-learners’ engagement levels. In this study, we are concerned with the main types of validity threats: (1) internal validity, (2) external validity and (3) reliability.

Figure 1: Article selection diagram
For this research, we have followed [20,21] method to present the threats to validity: we used arXiv.org, ACM digital library, Springer Link, Google Scholar, IEEE Xplore, Web of Science and ScienceDirect. We searched works that include the following combinations of search strings in titles and abstracts: “engagement detection,” “student engagement detection,” “body gestures,” “body behaviour,” “video-based analysis,” “Action Recognition,” “Automatic Action Recognition” and “identify emotions in body language.” We retrieved different research papers and works from conference proceedings, journals, articles, and book chapters. We screened the titles and abstracts of the retrieved documents to identify potential works. In total, we examined about 100 different documents. We removed 21 duplicate documents. We also excluded not only 10 documents based on title and abstract screening, but also 28 documents depending on their relevance to our work. For instance, we have excluded (1) log-based engagement detection methods (2) non-vision-based engagement detection methods, (3) manual engagement detection methods and (4) depth-based action recognition methods. We finally selected 41 studies for data extraction. We were interested in recent studies conducted during the past 10–15 years. However, we had to include older references, which contain some basic definitions and concepts related to our work. Fig. 1 illustrates the document selection process.
In Section 2, we review the related systems and works suggested in the literature. In Section 3, we illustrate our proposed research method and framework. In Section 4, we present the experimental evaluation conducted in order to justify our choices and assess the prediction model. In Section 5, we detail the validity threats related to our work. We finally draw some conclusions in Section 6.
As mentioned in Section 1, the use of e-learning systems in the educational sector has increased over the past years. In this respect, many researchers such as [22,23], aimed to study and investigate students’ digital data using data mining techniques in order to make predictions and draw rules about success and failure factors that affect students’ academic performance. Data mining makes use of big data. Some data can be collected from e-learning systems, namely GPA, test grade, etc. However, machine learning techniques have proven to produce successful results in different fields, such as medicine [24], action recognition [25], emotion recognition [19,26,27], sign language recognition [28]. These inspiring research studies, like in the following Subsection 2.1, used machine learning techniques to predict students’ academic engagement. Machine learning includes supervised, unsupervised and deep learning techniques. Estimating e-learners’ performance is a salient aspect as it helps in improving the learning experience and e-learners’ engagement using e-learning systems. As stated in Section 1, it is desired to implement e-learning systems that have the ability to automatically detect and recognize students’ engagement states [7] in order to promote e-learners’ pedagogical experiences by offering proper learning contents and adapting educational materials to meet learners’ needs based on students’ engagement states and preferences [8]. This will help the development of smart e-learning systems, or even robotics teaching. Advances in robotics have shown that robots can occupy various jobs including teaching [29].
In the following subsection, we review several engagement detection systems found in the literature. Next, we will provide an overview of different researches on emotion recognition via body gestures and we will focus on how to use the findings of these works to develop our proposed method.
Engagement detection methods in e-learning environments can be (1) automatic (e.g., machine learning methods), (2) manual (e.g., an external observer), or (3) a combination of both [30,9]. Engagement is a multifaceted indicator and there is no unified model of engagement levels. For example, researches in [31] propose a two-level model, either engaged or disengaged. Another three-level model was proposed: high, medium and low levels [32]. One of the most recent models is the affective model that describes five levels of engagement, namely strong engagement, high engagement, medium engagement, low engagement and disengagement [9]. Different modalities can be used to determine a student's engagement level e.g., body poses, eye gazes, keyboard/mouse movements and facial expressions [9]. In the following paragraphs, we review different proposed approaches for engagement detection.
Whitehill et al. [6] developed an engagement detection method based on emotional facial expressions. The dataset was collected from 34 undergraduate students who participated in one session of the “Cognitive Skills” Training (Set-Remember-Sum) game. A webcam placed behind an IPad used to privately record students during their participation period. They received a consent form, a 3-min-video explaining the purpose of this research, a pre-test and a post-test. The recorded videos were labelled based on expressions without any audio input. They utilized two approaches for labelling, (1) watching video clips and giving a single label to the entire video and (2) viewing static images and giving a label to each image. The labelling task included four engagement levels (very engaged, engaged in task, nominally engaged, and not engaged at all). The SVM used for classification and the model achieved an accuracy of 72.9%.
The work [13] uses three input modalities including facial expressions, eye gazes, and mouse behaviours. Subjects’ facial expressions and mouse dynamics were recorded in real time. The subjects were required to do a pre-experimental survey and a post-experimental survey for data collection and labelling. The experiment was carried out in an office environment. There were no time constrains for reading sessions. The subjects labelled their attention levels during reading tasks (“low,” “medium” or “high”). Video clips of subjects’ faces were displayed during reading tasks in order to help them remember their mental states and ensure a reliable labelling. Classification was performed using the SVM classifier with an accuracy of 75.5%.
Both emotional facial expressions and heart rates were used as input modalities in [14]. A structured one-hour writing task was conducted in an indoor environment. Students were seated in front of a computer to write an essay about a place they have recently visited. This task requires some research and it triggers emotions and memories. Data was labelled into “engaged” or “not engaged.” The labelling process was conducted based on two schemes; concurrent and retrospective affective annotations. The classification of the engagement levels is performed based on the Naïve Bayes Classifier with an accuracy of 73.3%.
Another method based on facial expressions, full body motions and game events was recommended in [10]. A prosocial game was preinstalled on a desktop PC with a connected Kinect sensor. It was designed in two main versions; a “boring” version and a more “challenging and interesting” version. Each player must play both versions of the game. Each player spent 10–15 min playing. A self-report approach was used for data labelling. Data was labelled as either “engaged” or “not engaged.” ANN classifier was used with an accuracy of 85%.
In [11], a deep learning model was proposed based on facial expressions extracted from images. The model was trained on a new engagement recognition dataset of 4627 samples. The collected samples were classified into ‘engaged’ and ‘disengaged.’ They were extracted from videos of 20 students participating in a virtual world for learning research skills. Six Psychology students carried the annotation task. The researchers presented two deep learning models. The first model was trained from scratch on the new collected dataset. The second model has an architecture similar to the VGG-B architecture [33]. The authors also implemented a third model using both SVM and Histogram of Oriented Gradients (HOG) features. The performances of the proposed models are as follows: the HOG + SVM model achieved an accuracy of 67.69%, the CNN model achieved an accuracy of 72.03%, the VGGnet model achieved an accuracy of 68.11%. Based the results, all deep learning models achieved a higher performance compared to the HOG + SVM model, showing the advantages of using deep learning in the engagement recognition task.
Another deep learning model [12] proposed for detecting engagement based on learners’ facial expressions. They developed both a two-level decision and a three-level decision during the classification process. The two-level decision categorizes inputs into “engaged” and “not engaged” classes. The three-level decision, however, categorizes the data into “engaged,” “normally engaged” and “very engaged” classes. The authors implemented a Deep Belief Network model for engagement classification based on the features extracted. They used the DAiSEE dataset [34]. They developed 2 different DBN models for the two-level and three-level classifications. The outcomes of this work showed that the two-level decision model achieved an accuracy of 90.89% while the three-level decision model achieved an accuracy rate of 87.25%.
These works have shown that computer vision-based methods for engagement detection are one of the most promising approaches. However, the input is a frame-based and it is analyzed without taking into account temporal features. The previous vision-based engagement detection methods followed the same approach for detecting subjects’ engagement levels by extracting image features. Although some of the existing vision-based methods consider body motions, they still lack motion modelling due to the analysis of spatial features only without considering temporal features. Our major objective is to develop a video-based approach by taking into consideration 3D input volume data, spatial information, and temporal features. There are several challenges that must be addressed, such as:
• Limitations of video datasets related to the topic, and problems of data collection.
• High computational cost due to the large amount of data required for video-based analysis.
In this work, we are inspired by the amazing development of video-based analysis of different problems, such as action recognition [25] and abnormal event detection [35]. We suggest to use a deep transfer learning approach by taking knowledge learned in the Action Recognition domain, and leveraging it on our problem of analyzing Micro Actions for engagement detection. Our proposed model will analyze micro body gestures and map them to engagement states. In the next subsection, we review different studies for mapping body gestures to emotions.
2.2 Body Gestures for Emotion Recognition
Body activity recognition (gestures/actions/behaviours) has been one of the hottest research area for the last two decades. Body action recognition is very useful in many applications such as medicine, human-computer interaction and surveillance. Taking the example of the existing action recognition works of [15–17], the developed methods can recognize different actions, like laughing, eating and smoking. However, researchers have recently started to study gestural behaviours to interpret human emotions or affections. There is no universal perception of affectionate expressions and recognition models because human affections are influenced by different factors, like cultures [18]. A large number of researches have shown that body expressions are as effective as facial expressions in conveying emotions [15–18]. We propose a vision-based model to analyze micro body gestures and map them to learners’ engagement states. The performance of the proposed model will be evaluated based on different performance measurements including Loss, Accuracy, Precision and Recall.
Researchers in [26] created the Emilya dataset for emotional body expressions in daily actions. It contains 8 emotions (Joy, Anxiety, Shame, Panic, Anger, Sadness, Neutral, Pride and Fear) for 7 actions collected from 11 actors. The actors were graduate students who have received theatre courses. They were trained by a professional acting director. Researchers used the motion capture technology to record full body movements. Another work conducted by [27] studied multi-cue automatic affect recognition in a child–robot interaction. Their method was based on both facial and body expressions. Their deep learning model used hierarchical multi-label annotations and multi-stage losses. It can be also trained with both fused and separated modalities. They also collected a BabyRobot Emotion Database (BRED) which includes two types of recordings: (1) Pre-Game Recordings: children were requested to express just one emotion, and (2) Game Recordings: children were recorded while playing “Express the feeling” game with robots. However, according to the studied datasets, emotions were recognized based on full body behaviours.
In e-learning settings, we are more concerned with the effect of emotions on the upper body behaviour. Several recent works meet our objective, as they are interested in students’ upper bodily gestures using e-learning systems. For instance, in [36] researchers implemented an automatic deep learning detection method which considers nonverbal behaviours including Hand-Over-Face (HoF) gestures, head and eye movements and facial expressions during sessions. The proposed method used a webcam. They studied the behaviour in a-40-min session including two types of tasks; a reading task followed by a problem-solving task. Each session is composed of three different difficulty levels: an easy level, a medium level and a difficult level.
HoF gestures have been studied in computer vision for automatic recognition. However, HoF indications in the learning context are very little explored. This study does not explicitly associate emotions with HoF gestures but it measures its appearance frequency during different learning activities with different difficulty levels, and investigates the effect of time duration. The results indicate that both time and difficulty levels increase head and eye movements. In addition, HoF gestures considerably occur during the 40 min learning sessions on an average accuracy of 21.35% and these gestures are still not explored in the learning environment. The HoF detection achieved an accuracy of 86.87%. Besides, the more difficult the level, the more obvious the detection. Researchers also noticed that HoF gestures occur more frequently during problem-solving tasks compared to reading tasks, with accuracy rates of 23.79%, 19.84%, and 30.46% for the easy, medium and difficult levels, respectively.
Another work [37] studied the impact of emotional experiences during the interaction with a serious game and posture and activity features of the upper body and the head. 70 undergraduate students participated by playing a serious game for financial education. The data was recorded using Microsoft Kinect in order to capture depth-image data. The set of studied emotions includes enjoyment, boredom, and frustration. The results reveal that enjoyment decreases, while frustration increases during the course of a game play. Participants got a position (closer to the screen), as time passed, which is an indicator of withdrawal and of frustration according to several previous studies, [38]. Moreover, keeping head turned left was a sign of enjoyment according to self-reports, while keeping head turned right was a sign of frustration. It was perceived that many volunteers turned their heads right during the course of the game. Finally, according to [39], the frequency of the head tilting activity indicates boredom. This conforms with the experiment findings, that volunteers increased their heads titling activities during sessions.
The outcomes of the previous studies will help us to label our data. The mapping of emotions to engagement states is based on the proposed affective model in [9]. Unlike macro actions, we believe that involuntary micro actions/gestures expose a person's true emotions. This belief is based on the scientific basis of macro facial expressions and micro facial expressions explained by Ekman [40]. The definition of both Macro and Micro Actions are based on Ekman's explanation:
• Macro Actions: are human voluntary performed actions/activities/gestures. They usually need noticeable physical changes in body position, e.g., walking, turning pages, drinking.
• Micro Actions: are human involuntary performed actions/activities/gestures that do not necessarily need noticeable physical changes in body position. They occur within fraction of a second, e.g., opening both palms up and head scratching.
In the next section, we will present the proposed method of generating a predictive model for detecting engagement levels and fine-tuning the C3D model.
In this section, we present our research framework, see Fig. 2. The first phase comprises a new engagement detection dataset leading to accurate labels and annotations. The second phase, however, processes the collected data in order to improve the quality of the dataset and prepare it to fit into the model. In the third phase, the engagement detection model is generated. Finally, in the fourth phase, we conduct an experimental study to evaluate and validate our method. The following subsections provide more details about our framework.

Figure 2: Proposed research framework
3.1 Building a New Engagement Detection Dataset
In the following subsections, we will detail the different stages made to create a new engagement detection video dataset.
This work aims at developing an affordable vision-based method for detecting e-learners’ engagement levels using cheap and available equipment. The first step consists of building a new proper dataset based on our requirements, due to the lack of public/open source datasets suitable for our proposed method. The dataset was collected from 5 college students who volunteered to record themselves during their online attendance on different courses of lectures using Blackboard or Zoom platforms. This dataset is composed of video recordings of volunteers using built-in webcams on their laptops/PCs. Their ages vary from 20 to 29 years old.
Our data were collected during the COVID-19 pandemic. Due to school closure and social distancing, we collected data remotely by developing a simple tool that provides a video recording and self-reporting functionalities. We had no control over the settings of the recording sessions, such as content, device type, duration, background, etc. Thus, our dataset was uncontrolled and reflected the natural settings of any e-learning student. The duration of video clips ranged from 30 to 50 min. The video recording resolution and frame rate were different depending on the volunteers’ devices and webcams.
We also gathered volunteers’ profiles, preferences and other information. In addition, we collected self-reports filled by volunteers before and after the recording sessions. These data will help us produce annotations and analyze and interpret the results later. We managed to collect more than 1240 min of video recorded by volunteers who participated in 24 lectures. Fig. 3 shows the number of lectures recorded by each volunteer. Based on Fig. 3, the number of recorded lectures is not equal to all volunteers. This can be explained by the fact that volunteers belong to different college levels. They also have different numbers of enrolled courses and lectures per week. Volunteer 1 participated with 10 recorded lectures more frequently than the other volunteers.

Figure 3: Number of lectures recorded by each volunteer
Videos were divided into more than 2,476 video clips. The length of each video clip ranges between 2 and 40 s. For our data collection, we followed an approach that will ensure naturally evoked emotional states, various macro and micro body gestures and movements, data usability and data validity . Therefore, we have developed our own data collection tool (as shown in Fig. 4), which is characterized by the following properties:
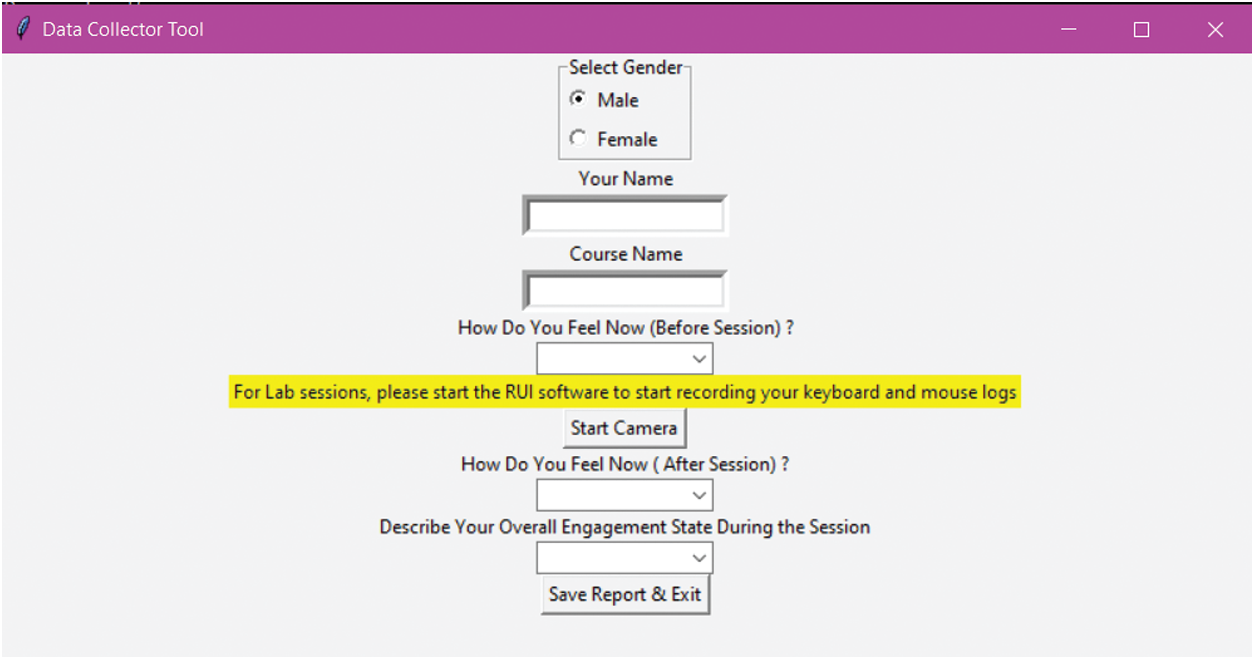
Figure 4: Data collection tool interface
• It includes a simple self-report used before and after the recording session.
• In case the volunteer attends a lab session, this tool serves as a reminder to start the RUI software [41], which is used to record logs of both Keyboard and Mouse events, as we might integrate our model with other input modalities, like in [9].
• It automatically creates and saves video recordings and self-reports.
• It is simple and compact, as we do not want to let volunteers record for a long time or cause them distractions.
3.1.3 Data Analysis and Annotation
For data annotation, data was analyzed based on (1) our observations of video recordings, (2) participants’ self-reports, (3) users’ profiles and (4) our findings by taking into account relevant literature. After collecting volunteers’ video recordings, we observed the recorded clips based on following objectives:
• Recognizing unintentional natural body micro or macro actions and gestures such as head poses/movements, hand gestures, shoulders poses/movements, eating, talking, etc.
• Recognizing the frequency of previous gestures and actions as time progresses.
These objectives were addressed through the analysis of captured videos in a natural uncontrolled e-learning environment without intervening subjects’ interactions during sessions. Apart from our observations, we made use of self-reports collected by volunteers before and after each recording session. Based on our developed data collection tool, we asked each volunteer two questions, about the course name and his/her feelings before the lecture, before the beginning of the session. At the end of the session, these volunteers were asked another two questions, about their feelings after the lecture and their overall engagement levels.
We relied on both course name data and information collected from volunteers’ profiles, such as preferable learning methods (online courses or in-class courses), preferable time duration for online lectures, enrolled courses classification based on volunteers’ engagement levels during lectures, etc. To express their emotions before and after lectures, volunteers picked up one of the following answer options (Angry, Sleepy, Excited, Happy, Sad, Satisfied, Calm, Bored, Surprised, Nervous, Tired and Disappointed). Concerning the overall engagement level question, volunteers chose one of the following options (Strong Engaged, High Engaged, Medium Engaged, Low Engaged and disengaged). Both, emotion lists and engagement levels were extracted from the new emotion based affective model proposed in [9], since this model will be useful for mapping the expressed body movements into emotions and engagement levels.
Volunteers may have different engagement levels during lectures. This is why we split original videos into smaller clips with a maximum video length of 40 s. These clips were later labelled individually. Section 2 will give further details about labelling body gestures/movements into emotions based on our findings. Taking another example, The researchers in [42] have revealed that humans use their hands during conversations and social interactions to convey their emotions and express different affective states. In their book, “the Definitive Book of Body Language,” Pease et al. [43] intended to recognize the emotions conveyed by different hand gestures. They found that different hand gestures and positions imply distinct emotions (see Fig. 5). We also take into consideration macro body actions expressed by volunteers during the recording sessions, such as, eating, talking with others, getting off the screen, using cell phones for texting or calling, etc. Such actions will be labelled as a negative engagement level. Other macro actions, like writing on the keyboard will be labelled as a positive engagement level.
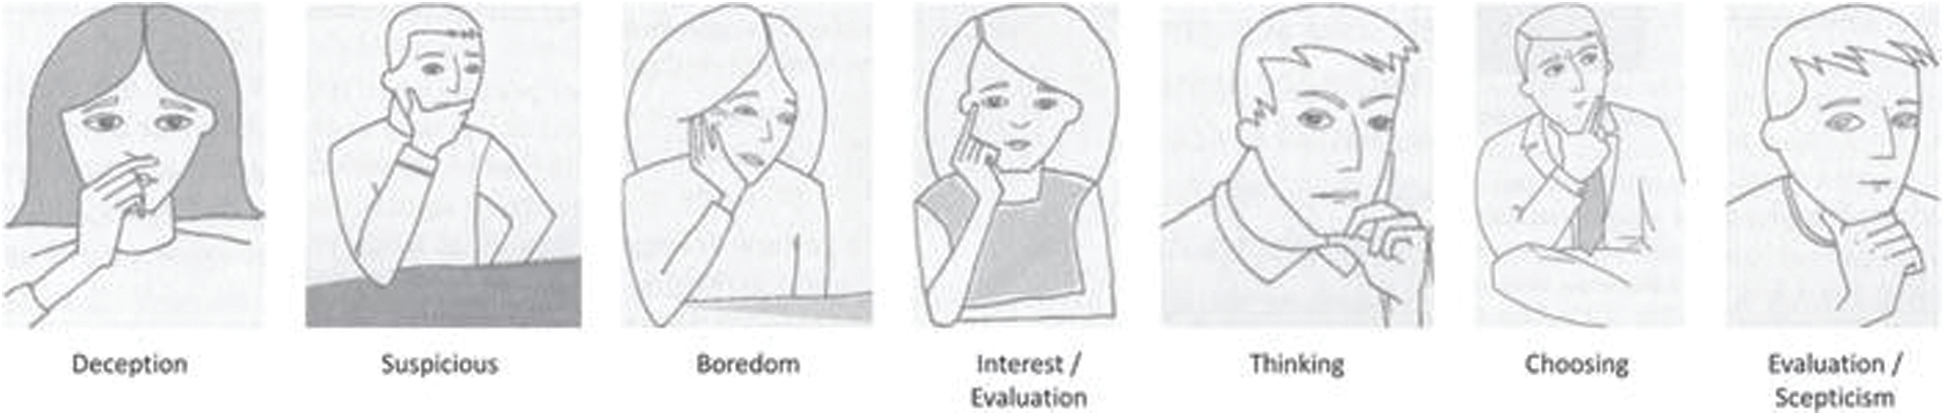
Figure 5: Example of different hand over face gestures imply different affective states [35]
Hence, we should classify data into five different classes based on the effective-model [9]. However, our dataset has some shortcomings: (1) some emotional states were absent in the collected data (surprised). Thus, we did not have any data for the strong engagement class. (2) Our dataset will be extremely imbalanced if we classify it into four other classes. (3) A relatively small amount of information was collected. In order to overcome these challenges, we changed our model from a multiclass model to a binary classification model. Moreover, data were classified into a Positive Engagement class and a Negative Engagement class depending on the type of emotion expressed as shown in model [9]; Fig. 6 shows the distribution of volunteers’ appearances in each class.
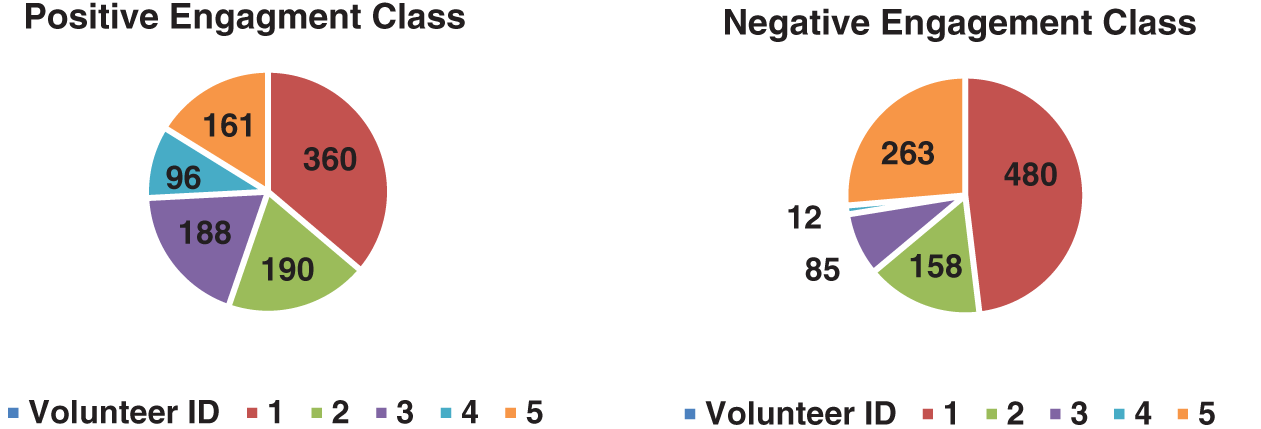
Figure 6: Volunteers appearances in each class
3.2 Data Processing Pipeline and Key-Frame Extraction
In the following subsections, the second phase of our work that consists in processing the collected data will be examined in order to improve the quality of the dataset and prepare it to fit into the model.
In order to improve the quality of our dataset, we have developed a second version of the dataset based on key-frame selection methods. The main idea is to use a Cosine Similarity threshold to significantly reduce redundant information in video clips by extracting only key-frames containing the most important information for classification. This will also reduce the amount of information to be processed and computational cost. We extracted key-frames by comparing consecutive frames based on their Cosine Similarity measures using the following formula, see Eq. (1):
where
3.2.2 Input Processing Pipeline
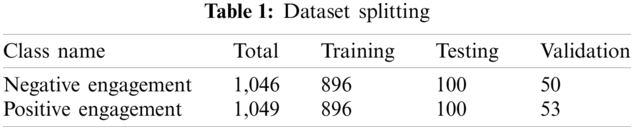
Initially, we started preparing our dataset to fit accurately into the model's requirements. Accordingly, our first step was to apply a pipeline for extracting frames from video clips and saving them as array files. After that, we applied a second pipeline to resize, crop, and pre-process the extracted frames to be prepared as inputs to fit the network. The third pipeline was used to load serialized files and create a data stream for training purposes (see Fig. 7). For splitting the dataset, we used values of 80%-10%-10%, for training, testing and validation phases, respectively (see Tab. 1), where the validation samples are completely not shown or used during the training and testing phases.
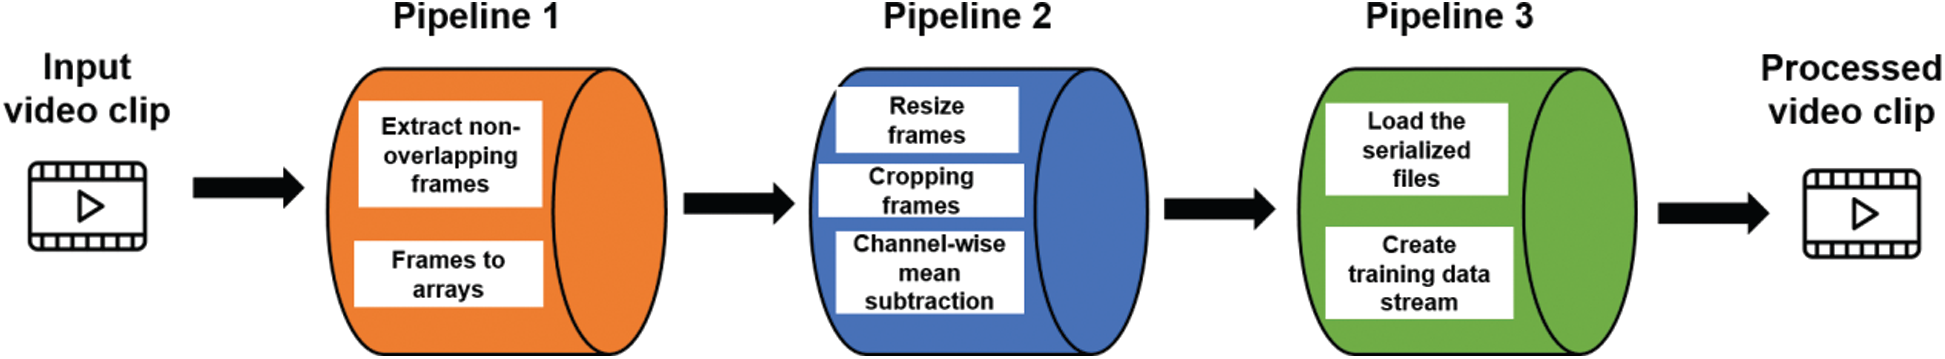
Figure 7: Input data processing pipeline
3.3 Model Generation to Detect Engagement Levels
Transfer learning for spatiotemporal feature extraction is very useful in cases where only small datasets were available, like our case. It is also crucial to speed up overall training and computation time by transferring biases and weights generated by training millions of data samples instead of learning them from scratch. To generate the proposed Prediction Model (PM) that recognizes engagement levels based on a micro-body gesture analysis, we reviewed different approaches for learning and analyzing spatiotemporal features. Eventually, we selected the C3D model [25] thanks to its different properties. It was intensively studied for different video analysis tasks, such as Action Recognition, Action Similarity Labelling, and Scene and Object Recognition. Moreover, this model is not only simple and efficient, but also well-evaluated.
The C3D model is built using the 3D CNN architecture. It takes video frames as input and performs 3D convolution and 3D pooling to preserve and propagate temporal information across the network. The original C3D architecture is composed of 5 convolution layers. A max-pooling layer follows each convolution layer (a total of 5 pooling layers). Finally, 2 fully connected layers and a Softmax loss layer are used for label prediction. The number of filters of convolutional layers is 64, 128, 256, 512 and 512 respectively. All kernels have 3 × 3 × 3 shape. Convolution layers have both spatial and temporal padding and Stride of 1. All pooling layers are max pooling of size 2 × 2 × 2. To prevent temporal signals from merging too early, the first pooling layer was 1 × 2 × 2 (see Fig. 8).
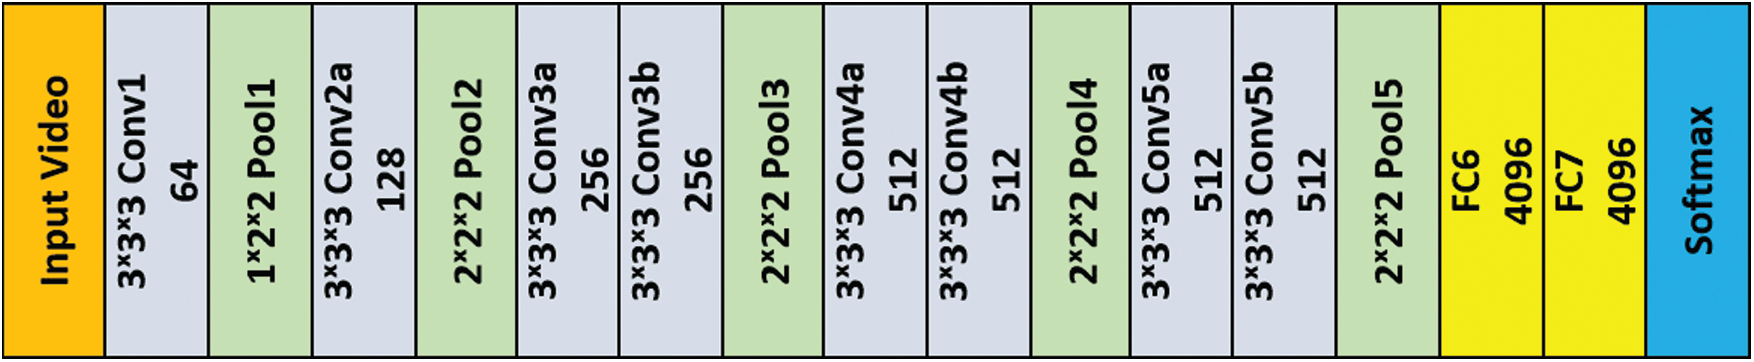
Figure 8: C3D base architecture
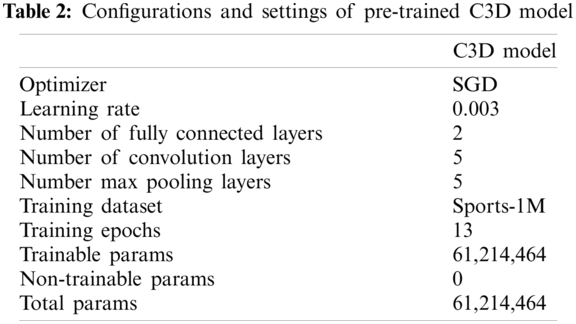
Input videos were divided into 16-frame clips (non-overlapped) and resized to 128 × 171 in order to form the network input shape 3 × 16 × 128 × 171. During the training phase, clips were randomly cropped into 16 × 112 × 112 crops for spatial and temporal jittering. The original C3D model was trained using the Sport-1M dataset [44] which is one of the largest benchmarks for video classification. SGD optimizer was used for training with an initial learning rate of 0.003. Learning rate was divided by 2 every 150 K iterations. Optimization stopped at 1.9 M iterations after about 13 epochs with accuracy rates of 85.2%, 78.3%, 98.1%, and 22.3% for action recognition, action similarity labelling, scene classification, and object recognition, respectively. We proposed two approaches for learning spatiotemporal features using the C3D model. The first approach is to use a pre-trained C3D model and linear classifiers, like the Support Vector Machine (SVM). The second approach is to fine-tune the C3D model for both learning deep spatiotemporal features and classification tasks. Tab. 2, reports the configurations and settings of the C3D model.
3.3.1 Approach 1: A Pre-Trained C3D Model with Linear Classifiers
In the first approach, we used a pre-trained C3D model as a feature extractor to make classifications using linear classifiers, such as SVM and Naïve Bayes. After preparing and processing the dataset as per our requirements, we utilized it for training the C3D model. The training time varies depending on the batch size and other system specifications, like GPU. The extracted features were used with both SVM and Naïve Bayes classifiers. In this approach, the SGD optimizer was used with a learning rate of 0.003 in the training phase. In the next subsection, we will present the details of the second approach that aims at fine-tuning the pre-trained C3D model.
3.3.2 Approach 2: Fine-Tuning the Pre-Trained C3D Model
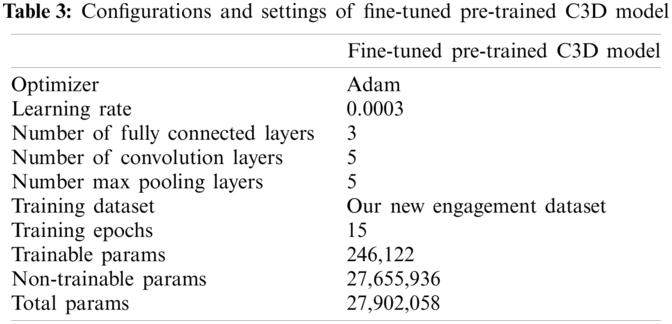
For C3D model classification, we applied a fine-tuning method to be able to replace the last layer and modify the model as per our dataset. Therefore, we had to freeze the previously trained model layers to prevent them from being updated during the training process. We also added 3 new trainable dense layers on the top of the frozen layers. They will learn to turn the old features into predictions on a new dataset. In addition, we used the Adam Optimizer instead of SGD with a learning rate of 0.0003. The model was trained for 15 epochs. We used the categorical cross entropy loss function to compute the loss between true labels and produced predictions (see Fig. 9 and Tab. 3).
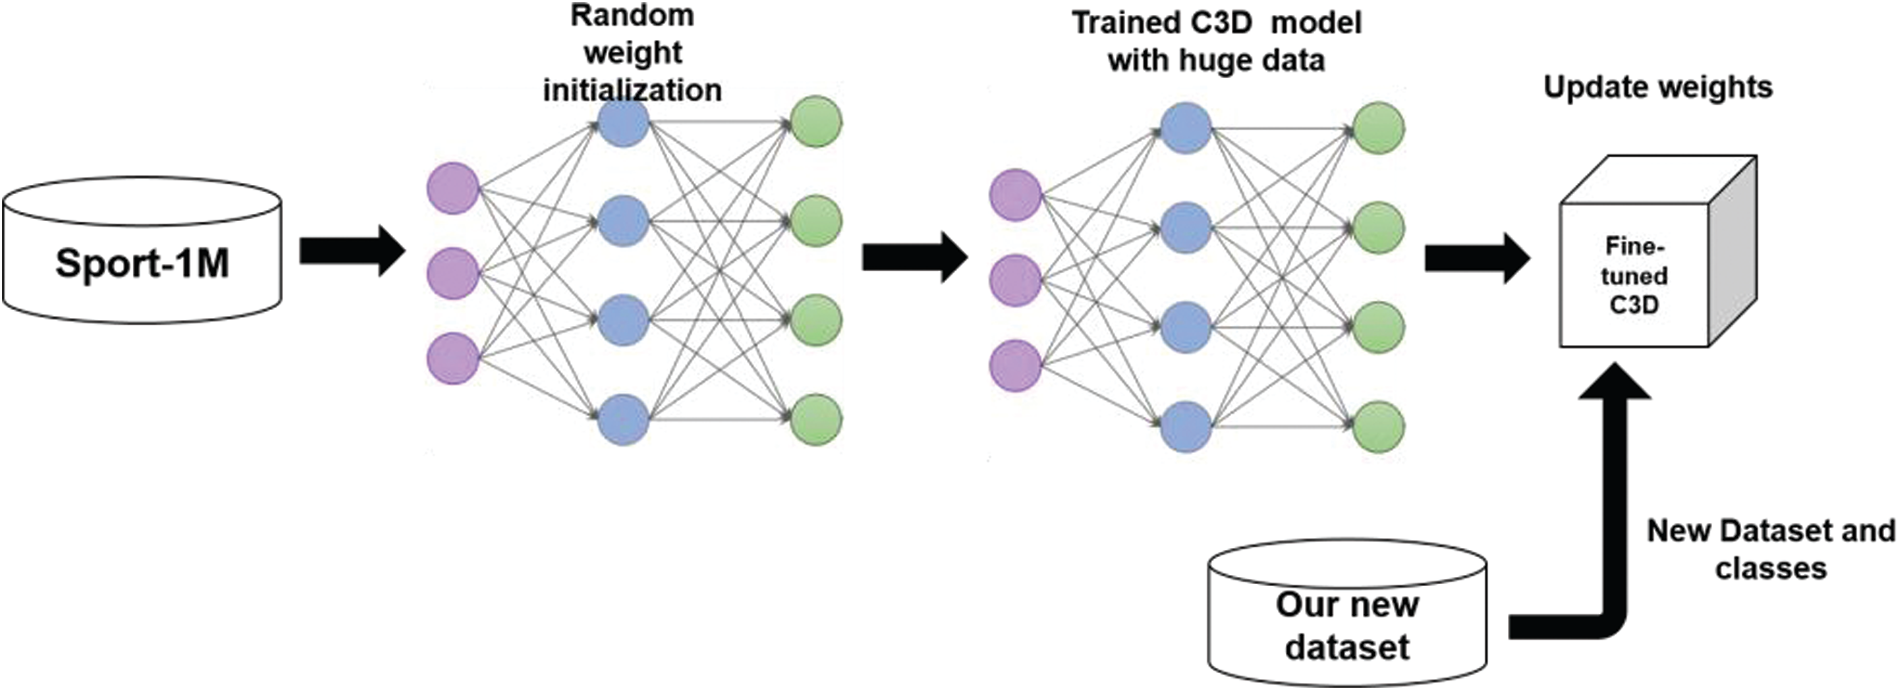
Figure 9: Transfer learning and fine-tuning approach for using C3D model
In this section, we present the conducted experimental study and the evaluation of the proposed work.
We used different performance measures to assess the proposed model, namely accuracy, loss, precision, recall and F1-Score. Accuracy measures the percentage of correctly predicted labels to the total number of predicted labels. Precision measures the fraction of correctly predicted positives out of the retrieved instances belonging to a certain class. Recall measures the fraction of true positives that were retrieved. F1-Score is calculated as a function of precision and recall to measure the test data accuracy. Loss measures the penalty of failure. See (Eqs. (2)–(6)).
In our work, we conducted several experiments. We present the results obtained from the three selected experiments. The aim of the two experiments (1 and 2) consists in justifying our choices. The goal of the third experiment is to measure, evaluate, and validate the model performance.
4.2.1 Classification Results With and Without Key-Frames
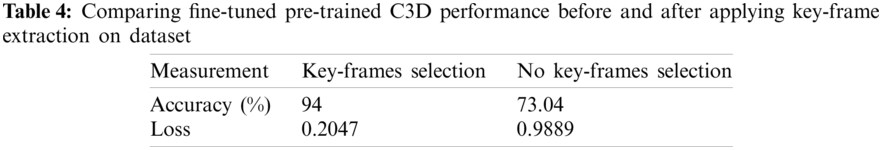
In this experiment, we examined the performance of the fine-tuning pre-trained model before and after extracting and restructuring the dataset using key-frames. The obtained results (as shown in Tab. 4) show considerable improvement with key-frames. Thus, we can conclude that using the key-frame selection method improves both the quality of the dataset and the performance of our prediction model.
4.2.2 Pre-Trained C3D with Linear Classifiers
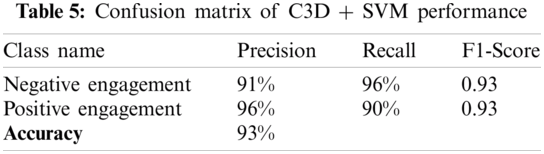
In order to evaluate the performance of using linear classifiers with the pre-trained C3D, we used the pre-trained C3D model as just a feature extractor. Classification was made using both SVM and Naïve Bayes classifiers. The performance of the pre-trained model with the two linear classifiers (SVM and Naïve Bayes) is summarized in Tabs. 5 and 6. Based on the tables, the Naïve Bayes classifier recorded lower performance measures compared to SVM, with a difference of 16% in terms of prediction accuracy.

4.2.3 Fine-Tuning the Pre-Trained C3D
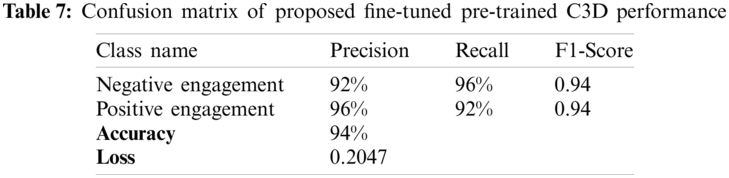
The goal of this experiment is to measure, evaluate and validate fine-tuning the pre-trained model performance (approach 2), which will be compared to the performance of the pre-trained model (approach 1). The performance is summarized in Tab. 7, where it reports the confusion matrix with the five performance measurements mentioned previously. The next table (see Tab. 8), summarizes the performance of both approaches in terms of accuracy (see Tab. 6).

According to the tables, the lowest performance was achieved by the C3D + Naïve Bayes classifier with an accuracy of 77%, while the highest performance was achieved by fine-tuning the pre-trained C3D model with an accuracy of 94%. However, the performance gap between the pre-trained C3D + SVM and fine-tuning the pre-trained model was only 1%. We also compared our approach to the state-of-the-art engagement detection methods. Our proposed method achieved a higher performance in terms of model accuracy, compared to the C3D + Naïve Bayes. (See Fig. 10 and Tab. 9).
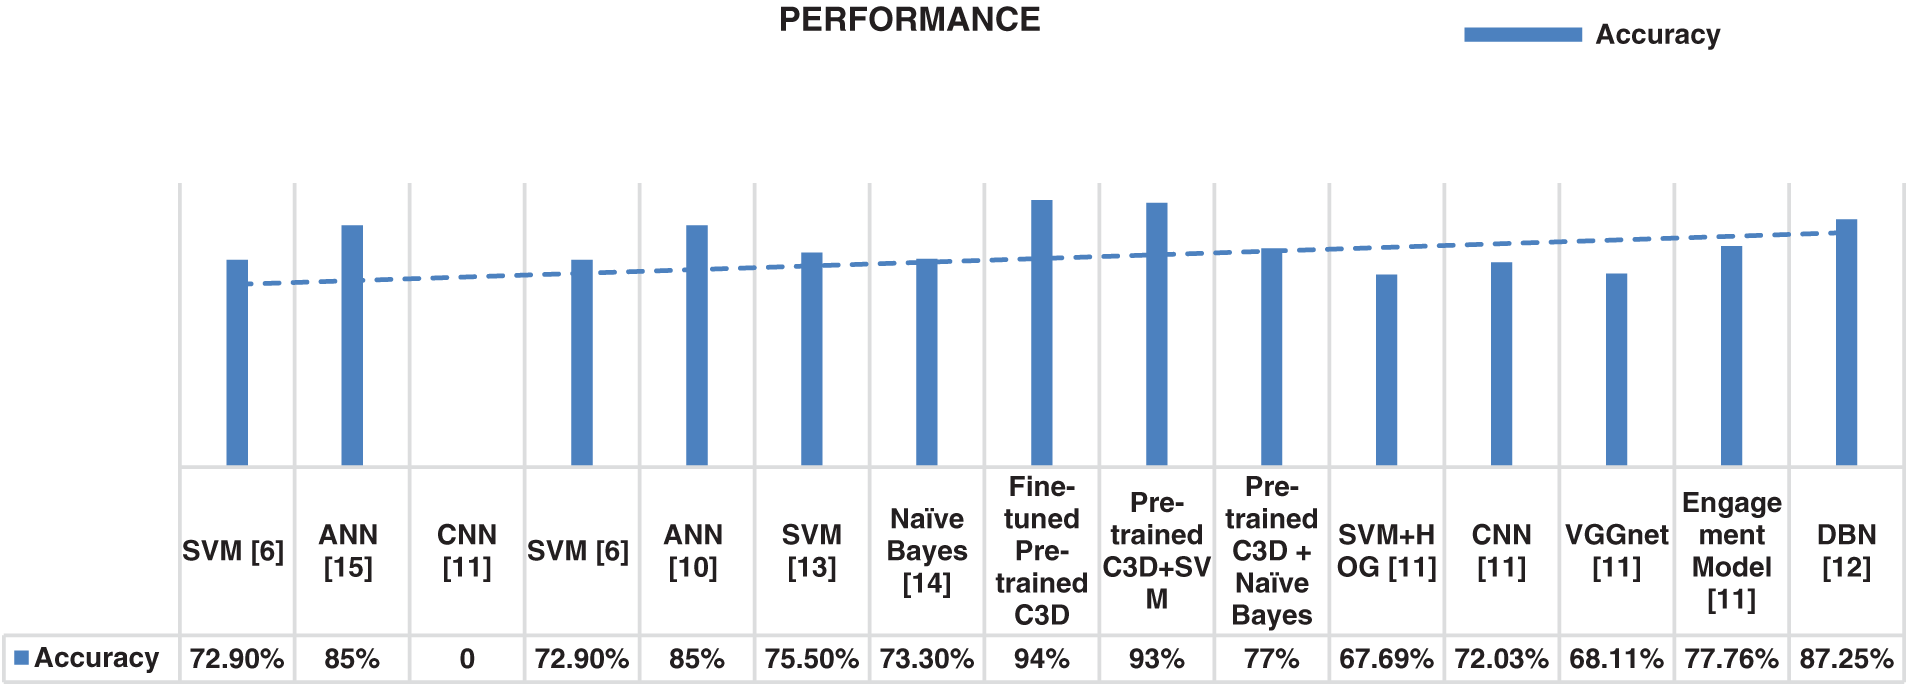
Figure 10: Comparison of our model performance with state-of-the-art methods
Beside, we compared the performance of fine-tuning the pre-trained C3D model and the pre-trained C3D+SVM model based on the number of input modalities used (see Fig. 11). As illustrated in Fig. 11, our single modality models outperform other multi and dual modalities.

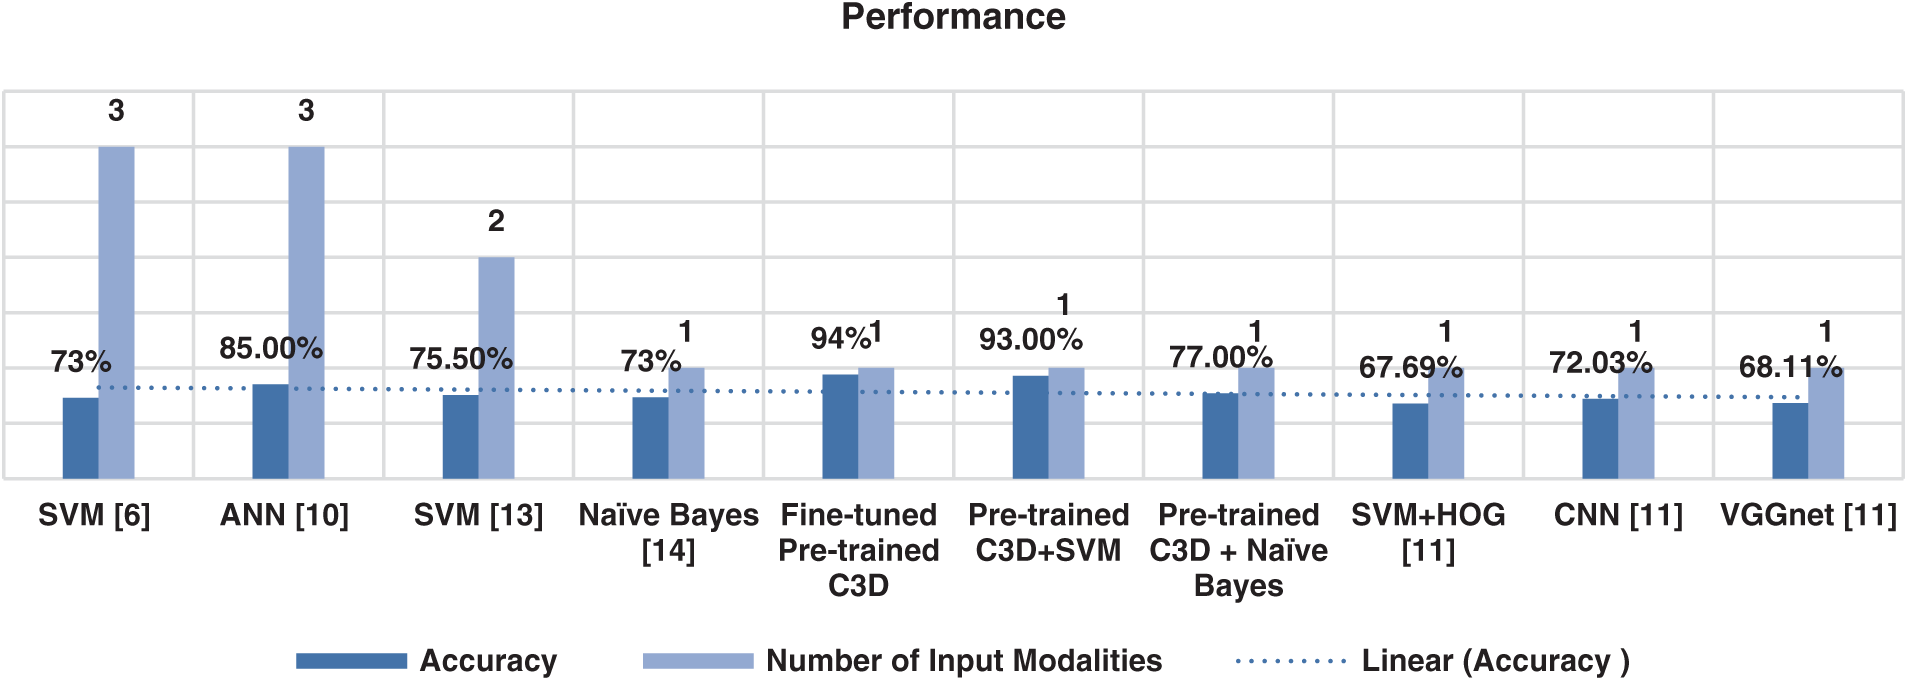
Figure 11: Comparison of our model with other methods based on the number of input modalities
Based on these findings, it is convenient to use the transfer learning approach for analyzing micro body gestures to detect e-learners’ engagement levels. Results also show that using the Key-frame extraction method significantly increased and improved the classification performance. In the following section, we will tackle different validity threats related to our work.
Validity indicates the soundness and the trustworthiness of the results obtained from an experimental study. It demonstrates the extent to which the results can be valid and independent of other researches. In this study, we are concerned with the main types of validity, namely (1) internal validity, (2) external validity and (3) reliability.
Internal validity is concerned with the cause-and-effect relationship between the different factors in a research study. To increase internal validity, all internal factors that could affect the performance would be addressed and fixed. In our study, we have addressed the following threats and tried to minimize their impacts. The first threat is concerned with the collected video dataset from five different volunteers. However, all of them are female college students, as males refused to take part in our study. To reduce the effect of having only female volunteers, we did not take into consideration any aspect of facial features, facial expressions or appearances. We only considered their expressed body gestures and motions. However, it is necessary to include both female and male participants in the dataset, retrain the model, and evaluate performance accordingly. The second threat is concerned with the number of volunteers in the collected dataset. As mentioned earlier, we have only five volunteers due to the COVID-19 crisis and social distancing. This was the maximum number of participants we could get. Thus, our dataset is limited in number. To decrease the impact of this threat, we have collected our dataset in natural uncontrolled settings. No conditions or restrictions were applied to webcam types, laptop types, operating systems, device distance from volunteers, etc. Our dataset uses a cheap technology available to each e-learner. The third threat was our computational capability. For both training and data processing phases, we used a laptop with an Intel core i7 8th generation processor, NVIDIA GEFORCE GTX graphics card and 8 GB RAM. The configuration settings of our used device are not at the highest level. Compromising is a necessary step during the training process, especially in selecting the number of training epochs, the batch size and the size of the processed data. To decrease the effects of such threats, we used the maximum computing capacity to produce the best performance and increase the 8 GB RAM to the maximum allowed capacity of 16 GB RAM. In addition, we increased training time.
External validity is concerned with the extent to which our study findings can be generalized. In this study, we detected the following external threats and tried to minimize their impacts. The first external threat is related to how volunteers, knowing that they are being recorded, may behave in front of the webcam. As humans, we might behave differently and unnaturally in front of other people or during the recording process. To reduce the impact of such factors, volunteers responded to an interview before the start of the data collection phase. They were asked to act and behave as natural and normal as possible. In addition, we developed the data collection tool. No pop up messages, questions or notifications are displayed or required. We did not want to cause any distractions to volunteers during the recording sessions.
The second external threat is our inability to establish emotion stimulations for volunteers. As we did not have any control over the lectures duration, course materials, the starting time of each lecture, etc., we could not offer volunteers specific materials that can stimulate certain emotions and reactions. Thus, labelling the data becomes expensive and error prone. Controlled sessions in terms of given materials and start-end time could lead to a better and clearer data labelling and performance. However, despite this fact, our data reflects the true and natural settings of the e-learning environment of any e-learner. Our model can perform very well in realistic conditions.
The third external threat is the position of the built-in webcam in the device. One out of five volunteers had her built-in webcam at the bottom of her screen. Thus, her recordings were different from other common recordings with at the top built-in webcam. This may have affected the performance of the model. We need a further investigation to address the effect of this factor on the model's performance.
Reliability is concerned with the extent to which results and analysis depend on specific researchers. In this study, we have implemented many procedures and measurements in each phase of our framework in order to ensure the reliability of the proposed work. Therefore, we developed our method to perform well in such natural environmental circumstances. This was accomplished by using input videos recorded in natural settings to generate prediction models. Furthermore, we guaranteed that our developed method is efficiently and effectively applicable on different devices and platforms using simple operations and available resources, such as laptops/PCs and webcams.
In this work, we maintained many practices and procedures in order to minimize the impact of different validity threats and sustain the reliability and validity of our findings. We believe that the reported performance results are real and comprehensive. However, our method still has many limitations that must be resolved. Further investigations are also needed. Therefore, our obtained results cannot be generalized to all situations.
In this work, we proposed an effective, efficient and affordable method for detecting students’ engagement levels in e-learning environments using webcams. We developed and compared the performance of two novel approaches to be able to analyze micro body expressions for engagement level detection. The first approach permits to extract spatiotemporal features of e-learners’ micro body gestures. The second approach uses deep features extracted by the pre-trained model with two linear classifiers (SVM-Naïve Bayes). For both approaches, we used the well-known (C3D) model pre-trained on a large-scale video dataset, called the Sport-1M dataset. The suggested work was experimentally established on a new collected video dataset recorded using webcams. However, it included several challenges. Our findings show that fine-tuning the pre-trained C3D model and the pre-trained C3D + SVM are very efficient as they achieved higher accuracies of 94% and 93% for model 1 and model 2, respectively compared to the state-of-the-art engagement detection methods. Our study generated more encouraging results and promising performance compared to other existing approaches. Our novel approach used the deep 3D CNN architecture to learn spatiotemporal features of micro body gestures for engagement level detection based on input videos. The 3D CNN model performs well in learning motion and appearance information related to the task of detecting e-learners’ engagement levels based on their expressed micro body gestures. The proposed approach outperforms other vision-based methods in the engagement detection task. However, this work has many limitations in terms of the size and the diversity of the collected dataset which is very fundamental and important for generating the prediction model. Although, the generated model performs very well, further improvements and experimentations are required. We have also detailed the different internal and external threats related to our work, see Section 5. Our future works will put special focus on: (1) implementing multilevel engagement detection classifiers. Multilevel classifiers aim at obtaining a more precise engagement level classification. This can be achieved by implementing different classifiers trained on the different parts of dataset and integrating their outcomes in the final decision-making process and label prediction. In addition, (2) increasing our dataset to include more participants from both genders. (3) Fusing our method (based on micro body gestures) with other methods and modalities (e.g., Keyboard and Mouse activities and facial expressions) in order to develop a multimodal engagement level detection method. We will validate the developed multimodal method based on an online comprehensive assessment of accuracy and execution time.
Acknowledgement: This research work was funded by Makkah Digital Gate Initiatives under Grant Number (MDP-IRI-8–2020). Therefore, authors gratefully acknowledge technical and financial support from Emirate of Makkah Province and King Abdulaziz University, Jeddah, Saudi Arabia.
Funding Statement: Makkah Digital Gate Initiatives funded this research work under Grant Number (MDP-IRI-8-2020). Emirate of Makkah Province and King Abdulaziz University, Jeddah, Saudi Arabia. https://science.makkah.kau.edu.sa/Default-101888-AR.
Conflicts of Interest: The authors declare that they have no conflicts of interest to report regarding the present study.
1. M. Dewan, M. Murshed and F. Lin, “Engagement detection in online learning: A review,” Smart Learning Environments, vol. 6, no. 1, pp. 1–20, 2019. [Google Scholar]
2. R. Luis, M. L. Nistal and M. Iglesias, “Analyzing learners’ experience in e-learning based scenarios using intelligent alerting systems: Awakening of new and improved solutions,” in Proc. Int. 13th Iberian Conf. on Information Systems and Technologies, CISTI 2018, Caceres, Spain, pp. 1–3, 2018. [Google Scholar]
3. C. Angeli and N. Valanides, “The essential role of pedagogical knowledge in technology integration for transformative teaching and learning,” in Technological Pedagogical Content Knowledge, 1st ed., Boston, US, MA: Springer US, pp. 3–5, 2015. [Online]. Available: https://www.springer.com/gp/ https://book/9781489980793. [Google Scholar]
4. J. Baxter, G. Callaghan and J. McAvoy, “Creativity and critique in online learning,” in Exploring and Examining Innovations in Online Pedagogy, 1st ed., US, Cham: Palgrave Macmillan, pp. 1–7, 2018. [Online]. Available: https://link.springer.com/book/10.1007%2F978-3-319-78298-0. [Google Scholar]
5. C. Tang, P. Xu, Z. Luo, G. Zhao and T. Zou, “Automatic facial expression analysis of students in teaching environments,” in Proc. Int. Conf. on Biometric Recognition, CCBR 2015, Proc.: Lecture Notes in Computer Science, Switzerland, pp. 439–447, 2015. [Google Scholar]
6. J. Whitehill, Z. Serpell, Y. Lin, A. Foster and J. Movellan, “The faces of engagement: Automatic recognition of student engagement from facial expressions,” IEEE Transactions on Affective Computing, vol. 5, no. 1, pp. 86–98, 2014. [Google Scholar]
7. N. Fragopanagos and J. G. Taylor, “Emotion recognition in human computer interaction,” Neural Net., vol. 18, no. 4, pp. 389–405, 2005. [Google Scholar]
8. N. -T. Le, “A classification of adaptive feedback in educational systems for programming,” Systems, vol. 4, no. 2, pp. 22, 2016. [Google Scholar]
9. K. Altuwairqi, S. Jarraya, A. Allinjawi and M. Hammami, “A new emotion-based affective model to detect student's engagement,” Journal of King Saud University—Computer and Information Sciences, vol. 33, no. 1, pp. 1–11, 2018. [Google Scholar]
10. A. Psaltis, K. C. Apostolakis, K. Dimitropoulos and P. Daras, “Multimodal student engagement recognition in prosocial games,” IEEE Transactions on Games, vol. 10, no. 3, pp. 292–303, 2018. [Google Scholar]
11. M. Nezami, M. Dras, L. Hamey, D. Richards, S. Wan et al., “Automatic recognition of student engagement using deep learning and facial expression,” in Proc. Int. Conf. on Joint European of Machine Learning and Knowledge Discovery in Databases, Cham, Switzerland, pp. 273–289, 2020. [Google Scholar]
12. M. A. A. Dewan, F. Lin, D. Wen, M. Murshed and Z. Uddin, “A deep learning approach to detecting engagement of online learners,” in Proc. Int. 2018 IEEE Conf. on Smart World, Ubiquitous Intelligence & Computing, Advanced & Trusted Computing, Scalable Computing & Communications, Cloud & Big Data Computing, Internet of People and Smart City Innovation, Guangzhou, China, pp. 1895–1902, 2018. [Google Scholar]
13. J. Li, G. Ngai, H. V. Leong and S. C. F. Chan, “Multimodal human attention detection for reading from facial expression, eye gaze, and mouse dynamics,” Association for Computing Machinery Applied Computing Review, vol. 16, no. 3, pp. 37–49, 2016. [Google Scholar]
14. H. Monkaresi, N. Bosch, R. A. Calvo and S. K. D'Mello, “Automated detection of engagement using video-based estimation of facial expressions and heart rate,” IEEE Transactions on Affective Computing, vol. 8, no. 1, pp. 15–28, 2017. [Google Scholar]
15. I. R. Moreno, J. M. M. Otzeta, B. Sierra, I. R. Rodriguez and E. J. Iztueta, “Video activity recognition: State-of-the-art,” Sensors, vol. 19, pp. 31–60, 2019. [Google Scholar]
16. J. Carreira and A. Zisserman, “Quo vadis, action recognition? a new model and the kinetics dataset,” arXiv preprint arXiv: 1705.07750v3, 2017. [Google Scholar]
17. J. Wang, A. Cherian, F. Porikli and S. Gould, “Video representation learning using discriminative pooling,” arXiv preprint arXiv: CoRR, vol. abs/1803.10628, 2018. [Google Scholar]
18. A. Kleinsmith and N. B. Berthouze, “Affective body expression perception and recognition: A survey,” IEEE Transactions on Affective Computing, vol. 4, pp. 15–33, 2013. [Google Scholar]
19. Y. Zhu, M. Tong, Z. Jiang, S. Zhong and Q. Tian, “Hybrid feature-based analysis of video's affective content using protagonist detection,” Expert Systems with Applications, vol. 128, no. 1, 2019, pp. 316–326, 2019. [Google Scholar]
20. K. Shaukat, S. Luo, V. Varadharajan, I. A. Hameed, S. Chen et al., “Performance comparison and current challenges of using machine learning techniques in cybersecurity,” Energies, vol. 13, no. 10, pp. 1–27, 2020. [Google Scholar]
21. K. Shaukat, S. Luo, V. Varadharajan, I. A. Hameed et al., “A survey on machine learning techniques for cyber security in the last decade,” IEEE Access, vol. 8, pp. 222310–222354, 2020. [Google Scholar]
22. K. Shaukat, I. Nawaz, S. Aslam, S. Zaheer and U. Shaukat, “Student's performance in the context of data mining,” in Proc. Int. 19th Conf. on Multi-Topic, Islamabad, Pakistan, pp. 1–8, 2016. [Google Scholar]
23. K. Shaukat, I. Nawaz, S. Aslam, S. Zaheer and U. Shaukat, “Student's performance in the context of data mining,” in Students Performance: A Data Mining Perspective, 1st ed., Koln, Germany: LAP LAMBERT Academic Publishing, 2017. [Google Scholar]
24. T. Saba,“”Recent advancement in cancer detection using machine learning: Systematic survey of decades, comparisons and challenges,” Journal of Infection and Public Health, vol. 13, no. 9, pp. 1274–1289, 2020. [Google Scholar]
25. D. Tran, L. Bourdev, R. Fergus, L. Torresani and M. Paluri, “C3D: Generic features for video analysis,” CoRR, vol. 2, no. 7, pp. 8, 2014. [Google Scholar]
26. N. Fourati and C. Pelachaud. “Perception of emotions and body movement in the emilya database,” IEEE Transactions on Affective Computing, vol. 9, no. 1, pp. 90–101, 2018. [Google Scholar]
27. P. P. Filntisis, N. Efthymiou, P. Koutras, G. Potamianos and P. Maragos “Fusing body posture with facial expressions for joint recognition of affect in child–Robot interaction,” IEEE Robotics and Automation Letters, vol. 4, no. 4, pp. 4011–4018, 2019. [Google Scholar]
28. H. Chao, W. Fenhua, and Z. Ran, “Sign language recognition based on CBAM-resNet,” in Proc. Int. 2019 Conf. on Artificial Intelligence and Advanced Manufacturing, New York, USA, pp. 1–6, 2019. [Google Scholar]
29. K. Shaukat, F. Iqbal, T. M. Alam, G. K. Aujla, L. Devnath et al., “The impact of artificial intelligence and robotics on the future employment opportunities,” Trends in Computer Science and Information Technology, vol. 5, no. 1, pp. 50–54, 2020. [Google Scholar]
30. M. Imani and G. Montazer, “A survey of emotion recognition methods with emphasis on E-learning environments,” Journal of Network and Computer Applications, vol. 147, pp. 102–423, 2019. [Google Scholar]
31. L. Chen and C. Nugent, “Sensor-based activity recognition review,” in Human Activity Recognition and Behaviour Analysis, 1st ed., Switzerland, Cham: Springer International Publishing, pp. 23–47, 2019. [Google Scholar]
32. L. Mo, F. Li, Y. Zhu and A. Huang, “Human physical activity recognition based on computer vision with deep learning model,” in Proc. Int. IEEE Conf. on Instrumentation and Measurement Technology, Taipei, Taiwan, pp. 1–6, 2016. [Google Scholar]
33. K. Simonyan, A. Zisserman, “Very deep convolutional networks for large-scale image recognition,” arXiv preprint arXiv: 1409.1556, 2014. [Google Scholar]
34. A. D'Cunha, A. Gupta, K. Awasthi and V. Balasubramanian, “DAiSEE: Towards user engagement recognition in the wild,” arXiv preprint arXiv: 1609.01885, 2016. [Google Scholar]
35. O. Boiman and M. Irani, “Detecting irregularities in images and in video,” in Proc. Int. 10th IEEE Conf. on Computer Vision, Beijing, China, pp. 462–469, 2005. [Google Scholar]
36. B. Ardhendu, M. Peter, K. Alexander, V. Peter, F. Hui et al., “Associating facial expressions and upper-body gestures with learning tasks for enhancing intelligent tutoring systems,” International Journal of Artificial Intelligence in Education, vol. 30, no. 2, pp. 236–270, 2020. [Google Scholar]
37. R. Valentin, F. Julian, L. Georg, N. Heiko and S. Claudia “Identifying features of bodily expression as indicators of emotional experience during multimedia learning,” Frontiers in Psychology, vol. 8, pp. 1303, 2017. [Google Scholar]
38. H. Gwallbott and K. R. Scherer, “Cues and channels in emotion recognition,” Journal of Personality and Social Psychology, vol. 51, no. 4, pp. 690, 1986. [Google Scholar]
39. S. Garger “Is there a link between learning style and neurophysiology?,” Educational Leadership, vol. 48, no. 2, pp. 63–65, 1990. [Google Scholar]
40. P. Ekman, “Lie catching and micro expressions,” Philosophy of Deception, vol. 1, no. 2, pp. 5, 2009. [Google Scholar]
41. J. Morgan, C. Cheng, C. Pike and F. Ritter, “A design, tests, and considerations for improving keystroke and mouse loggers,” Interacting with Computers, vol. 25, no. 3, pp. 242–258, 2013. [Online]. Available: http://acs.ist.psu.edu/projects/RUI/. [Google Scholar]
42. S. Rautaray and A. Agrawal, “Vision based hand gesture recognition for human computer interaction: A survey,” Artificial Intelligence Review, vol. 43, no. 1, pp. 1–54, 2015. [Google Scholar]
43. A. Pease and B. Pease, “The power is in your hands,” in The Definitive Book of Body Language, 1st ed., Australia: Pease International, pp. 31–66, 2006. [Google Scholar]
44. A. Karpathy, G. Toderici, S. Shetty, T. Leung, R. Sukthankar et al., “Large-scale video classification with convolutional neural networks,” in Proc. Int. IEEE Conf. on Computer Vision and Pattern Recognition, Columbus, OH, USA, pp. 1725–1732, 2014. [Google Scholar]
 | This work is licensed under a Creative Commons Attribution 4.0 International License, which permits unrestricted use, distribution, and reproduction in any medium, provided the original work is properly cited. |