DOI:10.32604/cmc.2022.019036
| Computers, Materials & Continua DOI:10.32604/cmc.2022.019036 | |
| Article |
Multiclass Cucumber Leaf Diseases Recognition Using Best Feature Selection
1Department of Computer Science, HITEC University Taxila, Taxila, Pakistan
2College of Computer Engineering and Sciences, Prince Sattam Bin Abdulaziz University, Al-Khraj, Saudi Arabia
3Department of Applied Data Science, Noroff University College, Norway
4Department of Computer Science, Bahria University, Islamabad, Pakistan
5Department of Information Systems, College of Computer and Information Sciences, King Saud University, Riyadh, 11543, KSA, Saudi Arabia
6Department of natural and engineering sciences, College of Applied Studies and Community Service, King Saud University, Riyadh, 11421, Saudi Arabia
7Faculty of Engineering, Industrial Engineering Department, King Saud University, Riyadh, 11421, Saudi Arabia
*Corresponding Author: Seifedine Kadry. Email: skadry@gmail.com
Received: 30 March 2021; Accepted: 03 July 2021
Abstract: Agriculture is an important research area in the field of visual recognition by computers. Plant diseases affect the quality and yields of agriculture. Early-stage identification of crop disease decreases financial losses and positively impacts crop quality. The manual identification of crop diseases, which are mostly visible on leaves, is a very time-consuming and costly process. In this work, we propose a new framework for the recognition of cucumber leaf diseases. The proposed framework is based on deep learning and involves the fusion and selection of the best features. In the feature extraction phase, VGG (Visual Geometry Group) and Inception V3 deep learning models are considered and fine-tuned. Both fine-tuned models are trained using deep transfer learning. Features are extracted in the later step and fused using a parallel maximum fusion approach. In the later step, best features are selected using Whale Optimization algorithm. The best-selected features are classified using supervised learning algorithms for the final classification process. The experimental process was conducted on a privately collected dataset that consists of five types of cucumber disease and achieved accuracy of 96.5%. A comparison with recent techniques shows the significance of the proposed method.
Keywords: Cucumber diseases; database preparation; deep learning; parallel fusion; features selection
Agriculture is the backbone of the economy in developing and other countries and plays a vital role for prosperity [1]. Weeds and pesticides have a considerable impact on the growth of crops and affect their quality and quantity [2,3]. Early-stage identification of crop disease decreases the financial loss and impact on crop quality [4,5]. Manual detection and identification of crop diseases, which are mostly visible on leaves, are cumbersome and not cost-efficient [6]. The efficient identification and recognition of plant disease can be performed by deploying automated deep learning techniques [7,8].
Plant disease detection and identification can easily be performed using different types of features like shape, color, and texture extracted from leaf images [9,10]. Disease detection and localization for cucumber crops is challenging due to multiple diseases on the leaves, different locality of affected areas on the plate, and a higher number of available features [11]. Various conditions that affect the growth and quality of cucumber crops are scabs, angular leaf spots, downy mildew, anthracnose, and powdery mildew [12]. Different computer vision-based approaches have been adopted for automated detection and classification of cucumber crop diseases [13] like color transformations, Support Vector Machines (SVM), artificial neural networks, and probabilistic and thresholding techniques [14,15].
Several challenges exist to efficiently recognize cucumber crop disease. These challenges affect the accurate recognition of disease and its computability. Cucumber leaf segmentation is a challenging task due to scale variations, shape, contrast, and color schemes. Low contrast images influence the recognition performance and the accuracy of segmentation. The presence of irrelevant and redundant information increases the computational cost and reduces the accuracy of classification. The inclusion of deep learning approaches for computer vision tasks, such as medical imaging [16,17], agriculture [18], and other applications [19,20], has demonstrated efficient computational performance at lower computational cost than traditional systems [21]. The performance of the model is evaluated based on error rate and accuracy. Various deep learning models have been presented by researchers: AlexNet had an error rate of 15.3%, a Vgg deep model had an error rate of 7.3%, and GoogleNet had an error rate of 5.1%. Several deep learning approaches have been adopted for robust detection of crop disease [22,23].
The detection and recognition of cucumber crop disease are challenging tasks due to various factors like color, low contrast, the locality of the affected area, and redundant features that affect the accurate segmentation and localization of the disease. Researchers have come up with various traditional and deep learning-based approaches for the efficient detection of cucumber diseases. Zhang et al. [2] presented a sparse representation technique for the classification of cucumber disease. The implemented practice comprised K means clustering for segmentation of the cucumber leaf by portion and shape. Color-based features were extracted for identification of condition, and sparse representation was utilized to classify disease. The utilization of sparse representation increases the classification rate by reducing the computational cost. Support vector machine (SVM) [24]-based classification was performed for cucumber disease. Each spot on the leaf is considered as a sample. SVM utilized a radial-based function kernel for classifying each area for disease classification. Zhang et al. [25] used the logarithmic frequency variation of the pyramid of the histogram-oriented gradient (P-HoG) and expectation maximization (EM) technique for efficient recognition of cucumber diseases. The affected part of the cucumber leaf is divided into multiple regions using superpixel, which accelerates the classification accuracy and detection processes. Segmented leaf portions were utilized for P-HoG feature extraction. SVM classification was performed on extracted features and achieved competitive performance.
Zhang et al. [26] came up with a deep learning-based method by utilizing a dilated convolutional kernel to augment the feature extraction process. The parameters of the convolutional neural network (CNN) were reduced by using a global pooling layer and reducing the overfitting probability. A multikernel was utilized to extract multi-scale features from database images and achieved robust performance in terms of the accuracy of disease identification. Khan et al. [13] introduced deep feature selection and improved saliency methods to detect cucumber disease. A novel Sharif saliency-based method (SHSB) was utilized to segment the diseased part of the cucumber leaf, and VGG-19 and VGG-M were used for deep feature extraction from segmented leaves. Local entropy, interquartile range , and local standard deviation methods were used for best feature selection. Multi-class SVM was used for classification of the affected cucumber crop. An artificial neural network (ANN) [27] was implemented for the efficient identification of cucumber diseases. Multiple image processing and deep learning methods were implemented on texture features collected from cucumber leaves to detect disease. Ma et al. [1] presented a deep learning-based technique for detecting cucumber disease by utilizing symptom data. Segmentation was performed on the affected area of the cucumber leaf for extraction of features, and data augmentation was performed for reducing the chances of overfitting. Deep learning methods were implemented on the segmented area and were used to recognize the disease based on symptoms using random forest (RF) and SVM classifiers. EfficientNet [28] was utilized for recognition of affected cucumber crops. The data set utilized in the proposed system was collected from the greenhouse in a complex environment and background. EfficientNet-based classification achieved 97% recognition accuracy for downy mildew, powdery mildew, and images of healthy cucumber leaves. The technique achieved a competitive performance in comparison with existing techniques. The segmentation of powdery mildew [29] from the cucumber leaf images was performed by implementing a semantic segmentation model based on deep CNN. The presented method achieved a dice accuracy of 83.45%, average pixel accuracy of 96.08%, and an intersection over union of 72% on twenty test samples of affected cucumber leaves. The proposed model can be robustly utilized for mapping the harshness of powdery mildew.
Different methods have been adopted using deep learning techniques for the efficient recognition of cucumber diseases. Researchers concatenated different deep CNN model features to achieve better accuracy without considering the computational time. Multiple optimization techniques are utilized to achieve better results by selecting robust features to perform classification. In this work, a new hybrid framework is proposed for the recognition of cucumber leaf diseases. In this work, the following major contributions were achieved:
• Fine-tuned VGG19 and Inception V3 according to the prepared dataset of cumber leaf diseases. The final fully connected layer removed from both models and added a new layer, which includes five classes.
• Proposed a parallel maximum correlation approach for the fusion of deep learning features in one vector.
• Implemented a whale optimization algorithm for the selection of best features.
• Separately computed results for each step and compared them with recent techniques.
The rest of this article is organized as follows: Section 2 presents the proposed approach including deep learning-based feature extraction, fusion of features, and selection process. The results of this proposed work are presented in Section 3. Finally, Section 4 concludes the paper.
A detailed description of the proposed method is presented in this section. The proposed technique comprises three phases: first, phase pre-trained deep CNN model implemented for deep features extraction using transfer learning; second, a fusion of deep extracted features is performed; in the last phase, the extracted features are optimized using a WOA, and classification is performed. An ES-KNN classifier achieved competitive performance at a low computational cost. A detailed description of the proposed methodology is presented in Fig. 1.

Figure 1: Proposed method for cucumber disease recognition
Feature extraction is an important research area of pattern recognition, and many techniques are presented in the literature. The role of features is to represent an object based on characteristics such as shape, color, point, and appearance. Recently, deep learning techniques have been widely utilized in recognition applications for computer vision, including medical, agricultural, and other applications [30,31]. A deep CNN model contains different layers like convolutional layers, pooling layers, fully connected (FC) layers, and an activation function called the ReLU layer. The input layer of the first layer of the CNN model passes the input image to the convolutional layer, which calculates the dot product of weights. The ReLU layer performs activation function pooling and removes the inactive neurons. The SoftMax layer classifies the features computed using the FC layer. In our proposed method, two pre-trained deep CNN models, namely VGG19 and inception V3, are utilized for feature extraction. The pre-trained models are briefly discussed in this section.
VGG19 is a deep CNN model trained over the challenging image recognition dataset ImageNet [32]. VGG19 has a depth of 19 layers, which means the network has 19 learnable weights that can be utilized for transfer learning (TL) coupled with FC layers and an output layer. The input size of the VGG19 first layer is
where
An advanced directed acyclic graph (DAG) network has 350 connections and 316 layers. Inception V3 has an input size of
A pooling layer is added between convolution layers to activate neurons. The pooling layers have a filter size of
where
2.1.3 Transfer Learning Based Feature Extraction
We adopted the transfer learning technique for deep CNN feature extraction [34]. Feature extraction was performed using pre-trained deep CNN models Inception V3 and VGG19. We utilized the cucumber dataset for deep feature extraction and adopted the 70:30 approach for training and testing. We implanted preprocessing to resize the images according to the size of input layers of deep CNN models. In VGG19, we utilized the first convolutional layer as an input layer, and activation was performed on the FC layer for deep feature extraction, and we obtained a feature vector of size

Figure 2: Pretrained VGG19 architecture for feature extraction using transfer learning
We utilized Inception V3 for feature extraction by deploying transfer learning. The convolutional layer is used as an input, and average pooling is used for feature extraction by performing activation. A
Training:- We used sigmoid as a training function by modifying the deep learning models. The other parameters were as follows: number of epochs 200; number of iterations per epoch 30; mini-batch size 64; learning rate 0.0001; and shuffle at each epoch.

Figure 3: Pretrained InceptionV3 architecture for feature extraction using transfer learning
Feature fusion is a popular research area in the domain of pattern recognition [35]. Classification of objects requires a strong and dense feature space, and feature fusion is the solution. Feature fusion plays a vital role in achieving accurate results but heavily impacts the computational cost. A new feature fusion method, parallel maximum covariance (PMC), can be used for feature fusion. The fusion process equalizes the size of feature space, and a single feature vector is obtained.
Suppose we have two of the deep CNN feature spaces expressed by
Maximum covariance of
Covariance between
The utilization of feature optimization techniques increases the machine algorithm performance by removing irrelevant and redundant features [36]. In crop disease detection, different algorithms are utilized to optimize the data for better diagnosis of diseases. The whale optimization algorithm (WOA) is implemented for feature optimization in our proposed technique for crop disease classification.
The Whale Optimization Algorithm: The nature-inspired metaheuristic method WOA imitates the behavior of humpback whales to optimize the problem solution [37]. Humpback whales adopt two attacking methods for prey. In the first method, the prey is chased by a random or best search agent. In the second method, the whales swim around the prey by simulating a bubble net, and a winding-shaped spiral is created around the prey. The method’s main phases are expressed in this section.
Encircling Prey: Humpback whales find the location of prey by creating a bubble net circle. The location of prey is unknown in WOA, so the optimal solution is considered the current search agent. The detection of the best search agent helps the other agent to adjust their position in the optimal direction. The repositioning and best search agent can be expressed as
Where
Where the value of
Exploitation Phase: The value of
Where
Where
Exploration Phase: In addition to the bubble net technique, random prey search is performed by humpback whales during the iteration process. The iteration for prey search is presented in the following equations:
Where
The proposed recognition method for cucumber disease has been implemented on an augmented cucumber dataset. The dataset contains images of different colors and orientations and captured under different light conditions. The augmentation has been performed to increase the dataset size and remove the class imbalance. A total of five diseases are considered including angular spot (71 images), powdery mildew (43 images), downy mildew (104 images), blight (54 images), and anthracnose (67 images). All images are in the RGB (red, green, blue) format, and the size of the original images was

Figure 4: Sample images from cucumber leaf image dataset
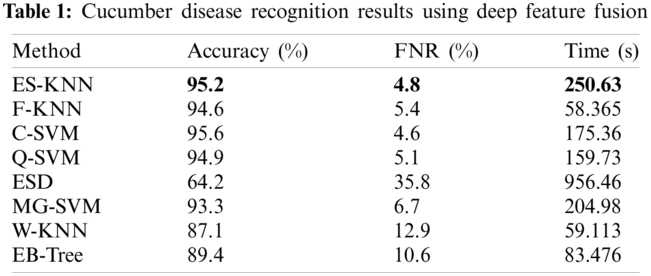
The numerical results of the proposed method have been presented in this section. The results of deep feature fusion are presented in Tab. 1. The deep features extracted using the pre-trained deep CNN models, and parallel concatenation was performed. Multiple classifiers are applied to the fused feature space to perform recognition. ES-KNN achieved the highest accuracy of 95.2% with a 4.8% false-negative rate (FNR), and other classifiers like F-KNN C-SVM, Q-SVM, ESD, MG-SVM, W-KNN, and EB-Tree achieved an accuracy of 94.6, 95.6, 94.9, 64.2, 93.3, 87.1, and 89.4 individually. The fusion of deep features increases the recognition accuracy to a certain level but also increases the computation time.
The proposed feature optimization method is utilized to increase the model recognition performance by decreasing computational time. The fused feature vector is optimized using WOA to select the best features, which impacts the model accuracy and computational time. The results of the proposed method are illustrated in Tab. 2. The results express the proposed method’s robustness and computability.

The optimized feature space is classified using different classifiers and the best one selected based on accuracy and computational time. The results show that ES-KNN achieved the highest accuracy of 96.5% with 3.5% FNR. The functioning of the ES-KNN classifier is also validated using the confusion matrix expressed in Fig. 5. W-KNN accomplished the lowest accuracy of 86.5%. The recognition accuracy of other classifiers like F-KNN C-SVM, Q-SVM, ESD, MG-SVM, and EB-Tree is 94.2%, 93.8%, 93.6%, 93.1%, 93% and 88.2%, respectively.

Figure 5: Cucumber disease recognition proposed method confusion matrix
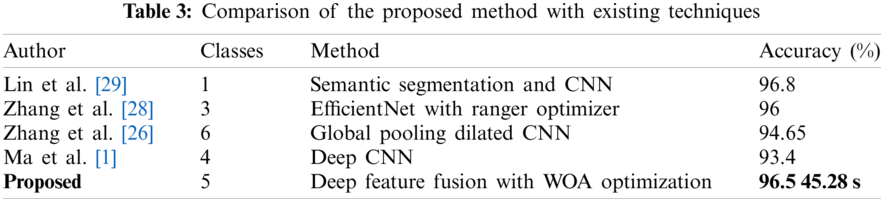
The proposed method compared with existing methods for cucumber disease recognition and achieved competitive performance in terms of accuracy and computational time. A comprehensive comparison with the existing method is presented in Tab. 3. Lin et al. [29] presented a semantic segmentation-based method for the recognition of powdery mildew by implementing a deep CNN model on segmented images and achieved an average accuracy of 96.8% on single class powdery mildew. Zhang et al. [28] came with a feature selection method Ranger combined with EfficientNet for the recognition of three cucumber diseases and achieved an accuracy of 96%. Zhang et al. [26] came up with a global dilated CNN model for the recognition of cucumber diseases. The presented method efficiently recognized the six different diseases of cucumber with an accuracy of 94.65%. Ma et al. [1] presented a deep CNN model-based recognition method for four cucumber diseases, namely anthracnose, powdery mildew, leaf spots, and downy mildew. The presented recognition method achieved an accuracy of 93.4%. The proposed deep feature fusion and feature selection method for cucumber disease achieved an accuracy of 96.5% in recognition of five cucumber diseases like angular spot, powdery mildew, downy mildew, blight, and anthracnose. The proposed method achieved accuracy is on all five diseases in less computational time as compared to existing techniques.
A deep learning method involving feature fusion is presented for the efficient recognition of cucumber diseases. The proposed deep feature fusion method is optimized using a WOA. The deep feature fusion and selection method comprised two stages. In the first stage, deep features were extracted using pre-trained deep CNN models (VGG19 and InceptionV3). The extracted deep features were fused, and different classifiers were applied for the recognition task. The results show that the ES-KNN achieved an accuracy of 95.2% and required 250.63 s computational time. Feature selection was performed to reduce the computational time with an increase in recognition accuracy. The optimized features using WOA were classified using machine learning algorithms. The results shown in Tab. 2 show that the ES-KNN achieved an accuracy of 96.5% and required 45.28 s computational time. The results show the robustness and the reduction in cost that arise from the proposed method for cucumber disease recognition. The primary contributions of the proposed work are the optimization of deep learning fused features, the reduction in computational time, and higher accuracy for recognition of multiple cucumber diseases. The key limitation of this work is the repetition observed in dataset images due to the Jeff augmentation process.
Funding Statement: The authors extend their appreciation to the Deanship of Scientific Research at King Saud University for funding this work through research group number RG-1441-425.
Conflicts of Interest: The authors declare that they have no conflicts of interest to report regarding the present study.
1. J. Ma, K. Du, F. Zheng, L. Zhang and Z. Sun, “A recognition method for cucumber diseases using leaf symptom images based on deep convolutional neural network,” Computers and Electronics in Agriculture, vol. 154, pp. 18–24, 2018. [Google Scholar]
2. S. Zhang, X. Wu, Z. You and L. Zhang, “Leaf image based cucumber disease recognition using sparse representation classification,” Computers and Electronics in Agriculture, vol. 134, pp. 135–141, 2017. [Google Scholar]
3. Z. u. Rehman, M. A. Khan, F. Ahmed, R. Damaševičius and W. Nisar, “Recognizing apple leaf diseases using a novel parallel real-time processing framework based on MASK RCNN and transfer learning: An application for smart agriculture,” IET Image Processing, vol. 1, pp. 1–23, 2021. [Google Scholar]
4. S. Zhang, W. Huang and C. Zhang, “Three-channel convolutional neural networks for vegetable leaf disease recognition,” Cognitive Systems Research, vol. 53, pp. 31–41, 2019. [Google Scholar]
5. M. B. Tahir, K. Javed, S. Kadry, Y.-D. Zhang, T. Akram et al., “Recognition of apple leaf diseases using deep learning and variances-controlled features reduction,” Microprocessors and Microsystems, vol. 2, pp. 104027, 2021. [Google Scholar]
6. Z. Iqbal, M. Sharif, J. H. Shah, M. H. Ur Rehman and K. Javed, “An automated detection and classification of citrus plant diseases using image processing techniques: A review,” Computers and Electronics in Agriculture, vol. 153, pp. 12–32, 2018. [Google Scholar]
7. Z. Iqbal, M. F. Azam, M. I. U. Lali and M. Y. Javed, “Detection and classification of citrus diseases in agriculture based on optimized weighted segmentation and feature selection,” Computers and Electronics in Agriculture, vol. 150, pp. 220–234, 2018. [Google Scholar]
8. N. Muhammad, N. Bibi Rubab, O.-Y. Song and S.-A. Khan, “Severity recognition of aloe vera Diseases using AI in tensor flow domain,” Computers, Materials and Continua, vol. 66, pp. 2199–2216, 2021. [Google Scholar]
9. W. Ismail, S. A. Shah, M. Y. Javed and T. Saba, “An adaptive image processing model of plant disease diagnosis and quantification based on color and texture histogram,” in 2020 2nd Int. Conf. on Computer and Information Sciences, Riydah, SA, pp. 1–6, 2020. [Google Scholar]
10. I.-M. Nasir, A. Bibi, J.-H. Shah, M. Sharif, K. Iqbal et al., “Deep learning-based classification of fruit diseases: An application for precision agriculture,” Computers, Materials and Continua, vol. 66, pp. 1949–1962, 2021. [Google Scholar]
11. T. Akram and T. Saba, “Fruits diseases classification: Exploiting a hierarchical framework for deep features fusion and selection,” Multimedia Tools and Applications, vol. 79, pp. 25763–25783, 2020. [Google Scholar]
12. V. K. Vishnoi, K. Kumar and B. Kumar, “Plant disease detection using computational intelligence and image processing,” Journal of Plant Diseases and Protection, vol. 11, pp. 1–35, 2020. [Google Scholar]
13. T. Akram, K. Javed, M. Raza and T. Saba, “An automated system for cucumber leaf diseased spot detection and classification using improved saliency method and deep features selection,” Multimedia Tools and Applications, vol. 21, pp. 1–30, 2020. [Google Scholar]
14. A. Adeel, T. Akram, A. Sharif, M. Yasmin, T. Saba et al., “Entropy-controlled deep features selection framework for grape leaf diseases recognition,” Expert Systems, vol. 8, pp. 1–23, 2020. [Google Scholar]
15. K. Aurangzeb, F. Akmal, M. Sharif and M. Y. Javed, “Advanced machine learning algorithm based system for crops leaf diseases recognition,” in 2020 6th Conf. on Data Science and Machine Learning Applications, Sakaka, SA, pp. 146–151, 2020. [Google Scholar]
16. A. Majid, M. Yasmin, A. Rehman, A. Yousafzai and U. Tariq, “Classification of stomach infections: A paradigm of convolutional neural network along with classical features fusion and selection,” Microscopy Research and Technique, vol. 83, pp. 562–576, 2020. [Google Scholar]
17. S. Kadry, M. Alhaisoni, Y. Nam, Y. Zhang, V. Rajinikanth et al., “Computer-aided gastrointestinal diseases analysis from wireless capsule endoscopy: A framework of best features selection,” IEEE Access, vol. 8, pp. 132850–132859, 2020. [Google Scholar]
18. T. Akram, M. Sharif, M. Awais, K. Javed, H. Ali et al., “CCDF: Automatic system for segmentation and recognition of fruit crops diseases based on correlation coefficient and deep CNN features,” Computers and Electronics in Agriculture, vol. 155, pp. 220–236, 2018. [Google Scholar]
19. M. Zahid, M. A. Khan, F. Azam, S. Kadry and J. R. Mohanty, “Pedestrian identification using motion-controlled deep neural network in real-time visual surveillance,” Soft Computing, vol. 4, pp. 1–17, 2021. [Google Scholar]
20. M. A. Khan, N. Hussain, A. Majid, M. Alhaisoni, S. Kadry et al., “Classification of positive COVID-19 CT scans using deep learning,” Computers, Materials and Continua, vol. 66, pp. 1–15, 2021. [Google Scholar]
21. J. Hemalatha, S. A. Roseline, S. Geetha, S. Kadry and R. Damaševičius, “An efficient denseNet-based deep learning model for malware detection,” Entropy, vol. 23, pp. 344, 2021. [Google Scholar]
22. M. Loey, “Big data and deep learning in plant leaf diseases classification for agriculture,” in Enabling AI Applications in Data Science. Cham: Springer, pp. 185–200, 2020. [Google Scholar]
23. F. Saeed, M. A. Khan, M. Mittal, L. M. Goyal and S. Roy, “Deep neural network features fusion and selection based on PLS regression with an application for crops diseases classification,” Applied Soft Computing, vol. 103, pp. 107164, 2021. [Google Scholar]
24. Z. Jian and Z. Wei, “Support vector machine for recognition of cucumber leaf diseases,” in 2010 2nd Int. Conf. on Advanced Computer Control, Ny, USA, pp. 264–266, 2010. [Google Scholar]
25. S. Zhang, Y. Zhu, Z. You and X. Wu, “Fusion of superpixel, expectation maximization and PHOG for recognizing cucumber diseases,” Computers and Electronics in Agriculture, vol. 140, pp. 338–347, 2017. [Google Scholar]
26. S. Zhang, S. Zhang, C. Zhang, X. Wang and Y. Shi, “Cucumber leaf disease identification with global pooling dilated convolutional neural network,” Computers and Electronics in Agriculture, vol. 162, pp. 422–430, 2019. [Google Scholar]
27. P. Pawar, V. Turkar and P. Patil, “Cucumber disease detection using artificial neural network,” in 2016 Int. Conf. on Inventive Computation Technologies, Coimbatore, India, pp. 1–5, 2016. [Google Scholar]
28. P. Zhang, L. Yang and D. Li, “EfficientNet-B4-ranger: A novel method for greenhouse cucumber disease recognition under natural complex environment,” Computers and Electronics in Agriculture, vol. 176, pp. 105652, 2020. [Google Scholar]
29. K. Lin, L. Gong, Y. Huang, C. Liu and J. Pan, “Deep learning-based segmentation and quantification of cucumber powdery mildew using convolutional neural network,” Frontiers in Plant Science, vol. 10, pp. 155, 2019. [Google Scholar]
30. M. A. Khan, S. Kadry, Y.-D. Zhang, T. Akram, A. Rehman et al., “Prediction of COVID-19-pneumonia based on selected deep features and one class kernel extreme learning machine,” Computers & Electrical Engineering, vol. 90, pp. 106960, 2021. [Google Scholar]
31. M. S. Sarfraz, M. Alhaisoni, A. A. Albesher, S. Wang and I. Ashraf, “StomachNet: Optimal deep learning features fusion for stomach abnormalities classification,” IEEE Access, vol. 8, pp. 197969–197981, 2020. [Google Scholar]
32. J. Deng, W. Dong, R. Socher, L.-J. Li and L. Fei-Fei, “Imagenet: A large-scale hierarchical image database,” in 2009 IEEE Conf. on Computer Vision and Pattern Recognition, Miami, FL, USA, pp. 248–255, 2009. [Google Scholar]
33. C. Szegedy, V. Vanhoucke, S. Ioffe, J. Shlens and Z. Wojna, “Rethinking the inception architecture for computer vision,” in Proceedings of the IEEE Conf. on Computer Vision and Pattern Recognition, Las Vegas, USA, pp. 2818–2826, 2016. [Google Scholar]
34. M. Rashid, M. Alhaisoni, S.-H. Wang, S. R. Naqvi, A. Rehman et al., “A sustainable deep learning framework for object recognition using multi-layers deep features fusion and selection,” Sustainability, vol. 12, pp. 5037, 2020. [Google Scholar]
35. I. Ashraf, M. Alhaisoni, R. Damaševičius, R. Scherer, A. Rehman et al., “Multimodal brain tumor classification using deep learning and robust feature selection: A machine learning application for radiologists,” Diagnostics, vol. 10, pp. 565, 2020. [Google Scholar]
36. M. Qasim, H. M. J. Lodhi, M. Nazir, K. Javed, S. Rubab et al., “Automated design for recognition of blood cells diseases from hematopathology using classical features selection and ELM,” Microscopy Research and Technique, vol. 84, pp. 202–216, 2021. [Google Scholar]
37. S. Mirjalili and A. Lewis, “The whale optimization algorithm,” Advances in Engineering Software, vol. 95, pp. 51–67, 2016. [Google Scholar]
 | This work is licensed under a Creative Commons Attribution 4.0 International License, which permits unrestricted use, distribution, and reproduction in any medium, provided the original work is properly cited. |