DOI:10.32604/cmc.2022.018131
| Computers, Materials & Continua DOI:10.32604/cmc.2022.018131 | |
| Article |
COVID19 Outbreak: A Hierarchical Framework for User Sentiment Analysis
1Department of Computer Science, Faculty of Computer Science, Nahda University, Banisuef, Egypt
2Department of Computer Science, Faculty of Computers and Information, South Valley University, Qena, Egypt
3Faculty of Computers and Information, Minia University, Al Minia, Egypt
4Department of Computer Science and Engineering, Soonchunhyang University, Asan, Korea
*Corresponding Author: Yunyoung Nam. Email: ynam@sch.ac.kr
Received: 26 February 2021; Accepted: 26 April 2021
Abstract: Social networking sites in the most modernized world are flooded with large data volumes. Extracting the sentiment polarity of important aspects is necessary; as it helps to determine people’s opinions through what they write. The Coronavirus pandemic has invaded the world and been given a mention in the social media on a large scale. In a very short period of time, tweets indicate unpredicted increase of coronavirus. They reflect people’s opinions and thoughts with regard to coronavirus and its impact on society. The research community has been interested in discovering the hidden relationships from short texts such as Twitter and Weiboa; due to their shortness and sparsity. In this paper, a hierarchical twitter sentiment model (HTSM) is proposed to show people’s opinions in short texts. The proposed HTSM has two main features as follows: constructing a hierarchical tree of important aspects from short texts without a predefined hierarchy depth and width, as well as analyzing the extracted opinions to discover the sentiment polarity on those important aspects by applying a valence aware dictionary for sentiment reasoner (VADER) sentiment analysis. The tweets for each extracted important aspect can be categorized as follows: strongly positive, positive, neutral, strongly negative, or negative. The quality of the proposed model is validated by applying it to a popular product and a widespread topic. The results show that the proposed model outperforms the state-of-the-art methods used in analyzing people’s opinions in short text effectively.
Keywords: COVID19; COVID data; sentiment analysis; hierarchical clustering; sentiment tree
The increasing popularity and growth of internet technology, specifically on social media sites has brought with it myriad challenges to document management. It contributes to producing an unlimited amount of information made by clients like customer feelings, tweets, guesses, comments, and reviews. This information may be about products, individuals, topics
Today, Twitter is deemed one of the social media networking sites that contain more than 650 million registered users. Twitter is right now ranked the 49th most popular site in the world [2]. The post on Twitter is a short message, which can be defined as a ‘tweet’; as it can’t contain more than 280 characters. However; those characters were previously 140 ones until November 2018. Twitter holds 500 million daily tweets, 152 million active users per day, and 330 million active users per month [3]. All this information helped Twitter to be one of the most important social networks over the Internet; due to the user interaction and the information circulation. It is estimated that the average participation of American users on social media is more than 3 h per day. Also, 45% of American users between the age of 18 and 24 years old are Twitter users [4]. Additionally, 27,000 scie.pngic publications contain the word ‘Twitter’ in their titles in Google Scholar. The details of these publications that came out from 2006 (when Twitter was created) till 2020, compared to the number of scie.pngic publications containing in their title the word ‘Facebook,’ are presented in Fig. 1.
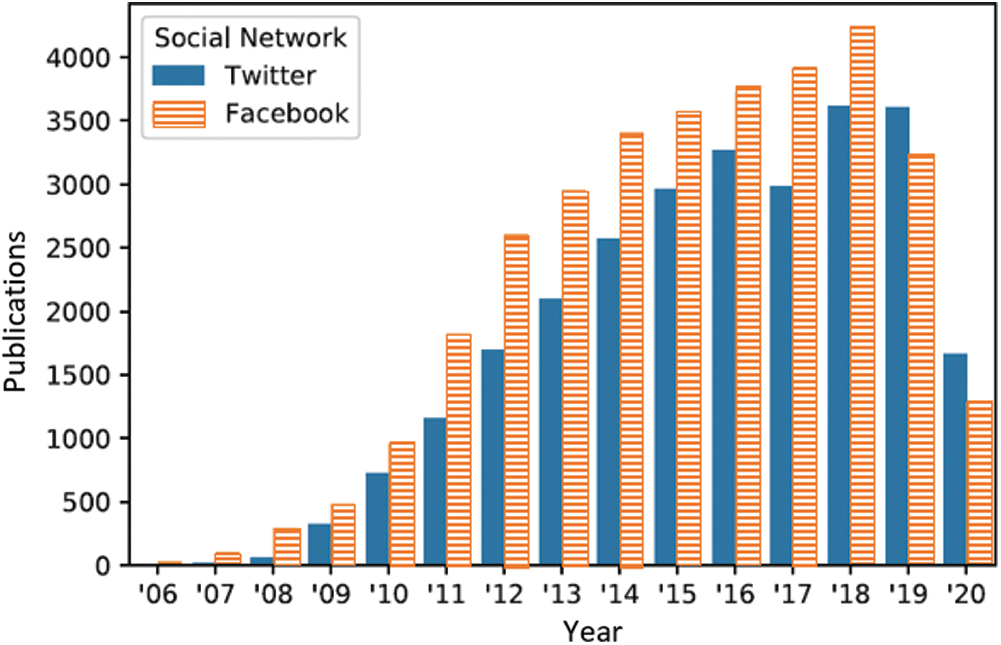
Figure 1: Number of research articles including the word ‘Twitter’ and ‘Facebook’ on their title from 2006 to 2020 on Google Scholar
Nevertheless, analyzing such an amount of information is challenging and time-consuming. Therefore, it is essential to make an intelligent system that automatically analyzes such a huge amount of data. Sentiment analysis is broadly utilized for analyzing people’s sentiments and opinions to discover the reasons why they desire certain products. Furthermore, it learns about their opinions regarding general topics through what they write. Sentiment analysis methods have been applied to various types of texts which include news, tweets [5], and customer reviews. In recent years, short texts such as Twitter and Weiboa have become a popular shape of data on social networks. Discovering hidden relationships from short texts can assist clients to comprehend the contents contained at different granularity levels. Building a concept hierarchy from short texts can facilitate many applications, such as sentiment analysis applications, summarization, and user recommendations. Various approaches have been developed to comprehend people’s feelings and opinions in texts. Nevertheless, applying these approaches to short text in social media networks usually produces incomprehensible and ineffectual results; due to text sparsity and shortness.
There are two main challenges when extracting the hierarchical sentiment tree from short texts. The first challenge is that many approaches produce understandable and inaccurate concept hierarchy; due to text sparsity and briefness in short texts. The second challenge is that there are many existing approaches ignoring the concept hierarchy and making a flat sentiment analysis on each discovered aspect autonomously. Consequently, the sentiment polarity for an aspect doesn’t cover the polarity of their children. Otherwise, the polarity of this aspect may not include people’s actual opinions as a whole. The proposed HTSM is used to deal with these two challenges as follows: i) a hierarchical method is suggested to discover important aspects and determine relationships between aspects concurrently. In this approach, the weak semantic relationships between aspects can be determined. Also, the extracted tree is organized from general to specific; and ii) a hierarchical sentiment method is suggested to discover peoples’ opinions for each node in the sentiment tree. The proposed method classifies the polarity for each message followed by hierarchical statistics to recognize people’s opinions. Each aspect of the extracted sentiment tree contains the polarity of the aspect itself followed by the polarity of its children.
The rest of the paper is organized as follows: Section 2 introduces a brief review of the related works. Section 3 explains the proposed methodology. Section 4 presents the experimental results. Section 5 provides the discussion and the evaluation analysis. Finally, Section 6 provides the conclusions and future suggestions.
Topic modeling and aspect-based sentiment analysis become a prevalent important research point among researchers’ community. The content of social media messages is characterized by the limited length of messages, as well as the use of irregular, concise, unceremonious, and dynamically changing words [6]. In the natural language processing, text sentiment analysis or short text classification is a difficult task [7]. Researchers suggested many approaches to address the problem of sentiment analysis and feature extractions. For example, Popescu et al. [8] proposed a system, namely, OPINE, to address the problem of feature extractions. This system can recognize peoples’ opinions and polarity of their opinions from reviews with high precision and recall. Additionally, several topic model approaches have shown amazing results in extracting the hidden patterns inside the texts in different domains [9]. Hu et al. [10] proposed a set of methods that captures highly frequent feature words by applying the association rules. They discover nouns and noun phrases by using part-of-speech (POS) tagging. Nevertheless, when all the methods mentioned above are applied to the short texts; the results are incomplete; because these methods are based on the flat topic model.
Several methods have been proposed to conduct the sentiment analysis. For example, Xu et al. [11] proposed an improved word representation approach that conducts a sentiment analysis of comment texts based on the bidirectional long short term memory (BiLSTM). To effectively obtain the context information, they used the weighted word vectors as input to BiLSTM. They can get a better text representation of the comments. Dos Santos et al. [12] proposed a new deep convolutional neural network that carries out sentiment analysis of short texts. Wang et al. [13] proposed a new model merging the hierarchical knowledge enhancement and multi-pooling (HKEM) along with the knowledge learning and the multi-pooling. To solve the problem of weak features, this approach fully integrates the knowledge and information of various levels in the text through Hierarchical Knowledge Enhancement. To solve the problem of multi-confounding weak features in the sentiment sentences, this method used a multi-pooling approach to analyze and extract the multi-features. This approach improves the ability of feature extraction. The above methods conduct a flat sentiment analysis and ignore the hierarchical sentiment analysis. It is not able to produce the natural hierarchical structure of the aspects and their polarity. On the other hand, Barkur et al. [14] introduced a method that sentiment analysis of Indians tweets can be used to gauge their feelings after announcements of nationwide lockdown; due to the Coronavirus outbreak. Lwin et al. [15] proposed a sentiment analysis model to analyze the universal trends of four emotions: sadness, fear, anger, joy, as well as the latent narratives behind those emotions resultant from the Coronavirus outbreak. Rao et al. [16] proposed a model to get benefit from Twitter for emergency management by analyzing alarming and reassuring official tweets then n.pngying the people by emergency information through the social media networks for proving reassurance. Samuel et al. [17] proposed a model which used the tweets relating to Coronavirus and (R) a statistical software to ide.pngy the sentiments correlated with the pandemic. They use the Naïve Bayes and logistic regression as machine learning classification methods. The two methods showed strong performance for the short tweets and relatively lower performance for the long tweets. However, all these methods are based on a flat sentiment analysis and don’t put into consideration the hierarchical structure.
Based on the previously mentioned drawbacks in the flat sentiment analysis methods to effectively extract the hierarchical structure from the text; the analysts have proposed a hierarchical topic modeling approach. Kim et al. [18] proposed a model, i.e., the hierarchical aspect sentiment model (HASM) which automatically discovers the hierarchical representation of aspects from online reviews. Titov et al. [19] suggested a multi-grain topic framework that extracts the hierarchical structure of the topic from the online users’ reviews at different granularities. Titov et al. [19] approached the problem by proposing a model that uses the hierarchical Pachinko allocation model (hPAM); to ide.pngy the correlations between topics. Chen et al. [20] suggested a graphical model, i.e., the hierarchical latent tree models (HLTMs), which is used to model document collection and extract topics in a hierarchical form. Blei et al. [21] proposed a nested Chinese restaurant process (nCRP) model; to learn the latent structures from data in a hierarchical form. Additionally, several research papers approached the problem by proposing methods to find topics in review data in the hierarchical forms. Jain et al. [22] proposed a hybrid system, namely, Senti-NSetPSO; to analyze the large-sized text. The framework consists of two classifiers which are binary and ternary. It is based on hybridization of particle swarm optimization with Neutrosophic Set. This approach shows great results when applied to classification of the large-sized text. Nevertheless, all the methods mentioned above are designed to be applied to the traditionally long text. The extracted hierarchical tree becomes incomplete and incomprehensive when the above methods are applied to the short texts.
The main objective of the proposed HTSM is to construct a hierarchical sentiment tree of the important aspects showing the number of positive, neutral, and negative tweets in each extracted aspect. It is worth mentioning that a list of tweets LT = {t1, t2,
• The first task is to extract a hierarchical tree which is organized from general, near to the root, down to specific near to the leaf. Moreover, the parent relatedness with its children must be stronger than its relatedness with non-children. The aspect relatedness score is calculated using Eqs. (6), (7) for its children’s and non-children’s then comparing the two relatedness scores.
• The second task is to analyze opinions expressed by people regarding those discovered aspects in HT. The polarity score P = {p1, p2,
The system architecture of the proposed model is illustrated in Fig. 2. There are five steps in the proposed model as follows: (1) Data Pre-Processing: it’s necessary to preprocess the data to avoid noise and the irrelevant words, (2) Data Visualization: after data preprocessing, the word cloud is used to visualize the most important data, (3) Hierarchical Extraction: the input to this step is a set of tweets after making preprocessing. The aim is to extract the foremost regularly mentioned aspects and construct a hierarchical tree of extracted aspects, (4) Sentimental Analysis: in this step, VADER sentiment analysis is used to discover the sentiment polarity of those extracted aspects and construct a hierarchical sentiment tree, and (5) Evaluation Methods: The quality of the extracted hierarchical sentiment tree is evaluated by estimating the effectiveness and efficiency thereof. The following subsections explain the five steps in detail:
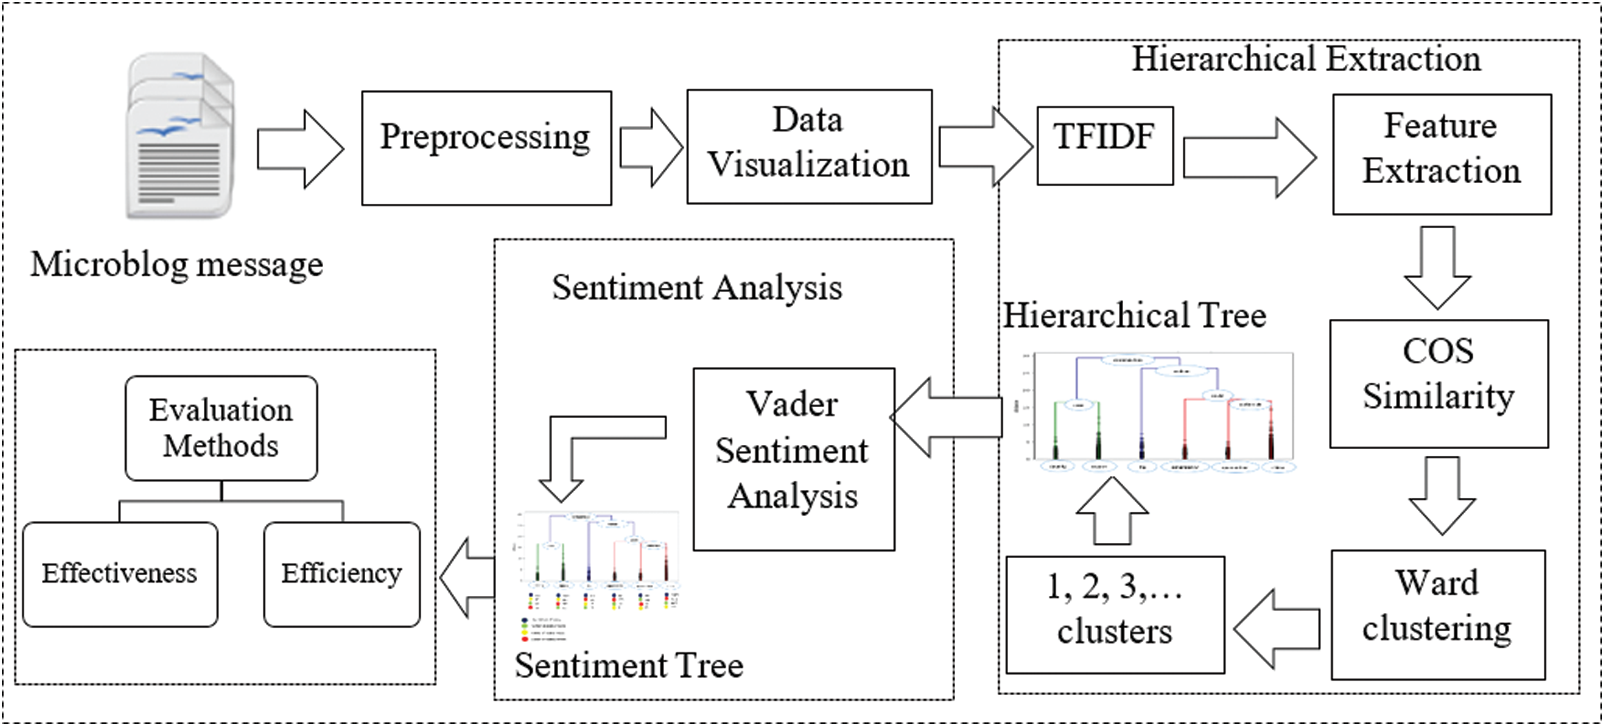
Figure 2: Architecture of the proposed HTSM
Pre-processing and cleaning of data is an essential step as the quality of the hierarchy depends on the production of this process. To improve the quality of HTSM results and diminish the noise, the data must be cleaned at first to disregard irrelavant words that have less important meanings. Also, the data contains unwanted characters, lots of numbers, stop words, white spaces, duplicate texts, and URLs that need to be removed. In this step, data preprocessing is a necessary step to perform the following: stopping-words removal, punctuation removal, lemmatization and stemming. Then, all texts will be turned into lowercase. NLTK WordNet Lemmatizer is used to make lemmatization.
Data visualization is a crucial step that provides businesses with an important way to show critical data at a glance. After data preprocessing, HTSM utilizes a word cloud to visualize tweets used to quickly display important data according to its importance and frequency. Word clouds are broadly utilized for analyzing information from social media networks. This is the first step of any data visualization approach that helps analyze the feedback.
In this section, the problem of how to build a hierarchical tree of important words that individuals care about from Twitter in short texts is discussed. The input of this approach is a set of short messages about a certain product or topic. The purpose is to discover the relationships between nouns that usually occur together in the same context and to construct a hierarchical tree of these important words. The hierarchical extraction method of the proposed model consists of three main phases as follows: converting text to features, finding similarity among texts, and hierarchical clustering technique. It is known that natural language processing machine algorithms are unable to comprehend characters, words, or sentences. They can only understand numbers as input that contains binaries. Machines cannot interact with text data; because of their inherent nature of being unorganized and noisy. Machines will go through difficult time to comprehend text data; because it is made out of characters [23]. To solve this problem, it is necessary to convert text data into features to allow algorithms and machines to understand them. There are many methods used to convert text into features. In the proposed model, the term frequency-inverse document frequency (TF-IDF) algorithm is implemented which produces a great result in feature extraction [24].
The next phase, after converting text data into features, is finding the similarity among texts. There are several metrics to compute similarity among texts same as Jaccard, cosine, Euclidian
To measure the distance among two clusters, it must draw a straight line from the first cluster to another cluster and measure the length of this drawn line. The distance metric ought to be selected based on theoretical concerns from the area of study. Namely, a distance metric should determine similarity in a manner that is sensible for the domain of study. Many research papers show that the Euclidean distance is the most usually used to measure the distance in clustering [27]. Therefore, Euclidean distance is used as a distance metric in HTSM. There are several methods used to measure the distance between two clusters. Ward’s hierarchical clustering algorithm is frequently used to perform the clustering [28]. Therefore, Ward’s hierarchical clustering method is used in the proposed HTSM. If all words in each cluster are considered, the noise will be appended to the result of HTSM. Therefore, for each cluster, only the top five nouns are considered for making sentiment analysis. The cluster name is represented by the first noun in the cluster.
The opinions expressed by people about those discovered aspects will be analyzed and classified hierarchically. The proposed sentiment model differs from the other methods; because it extracts sentiment in hierarchical form. To determine people’s sentiment about a certain product, people usually utilize verbs and adjectives words to express their opinions. In HTSM, VADER is used to ide.pngy the polarity of aspects. VADER is a lexical utilized to define both the polarity of tweets and the intensity of people’s sentiment. Then, it classifies them according to the multiclass sentiment analysis [29]. The VADER lexicon is one of the most widely used lexicons which perform very greatly and outstandingly in the social media contexts [30]. The compound value is a useful metric that is measured by calculating the sum of all lexical ratings then normalizing them to be between ( −1) and (+1): where ( −1) refers to the most intense negative and (+1) refers to the most intense positive [31]. In HTSM, it is necessary to determine threshold values that are used to classify sentences as follows: strongly positive sentiment, positive sentiment, strongly negative sentiment, negative sentiment, or neutral sentiment. The typical threshold values used in the proposed model are given as follows:
Strongly positive sentiment where compound value is greater than or equal 0.5; positive sentiment where compound value is between 0.05 and 0.5; neutral sentiment where compound value is between −0.05 and +0.05; negative sentiment: where compound value is between −0.05 and −0.5; strongly negative sentiment where compound value is less than or equal 0.5. The polarity of a node is decided by adding sentiment polarity for the node itself and its offspring. The polarity score ‘Pi’ of the aspect is computed as follows:
where
To evaluate the quality of the extracted sentiment tree, the effectiveness and efficiency are measured. Node specialization and parent-child relatedness [32] are used to evaluate the effectiveness of HTSM. The good tree must organize the extracted aspects rom general, near to the root node, to specific close to the leaf node. The relationships between parents and their children must be stronger than parents’ relationships with non-children. Efficiency evaluation is used to measure the efficiency of the proposed HTSM where the execution time is calculated for different numbers of tweets.
The goal of this method is to evaluate parent-child relatedness. To build an ideal tree, the parent aspect must be more similar to its children than to its non-children. In HTSM, Given an aspect x we calculate aspects relatedness score to its children’s childrenscore(x) then comparing it to its non-children non-childrenscore(x) using Eqs. (6) and (7).
where
HTC: A collection of more than 22977 tweets taken from Twitter about the HTC smartphone weren’t clean. This dataset has been previously used in [26]. When looking at the data, it is clear that it contains two types of texts as follows: the main text and the quoted text. On the one hand, the main text contains lots of stop-words and whitespaces for which pre-processing is necessary. On the other hand, the quoted text contains lots of numbers and unwanted characters that must be removed. Duplicate text and stop-words are removed and then the quoted text will be combined with the main text.
Coronavirus: A collection of more than 60 K random tweets from public Twitter accounts about the search word “Covid-19” are written in many languages. The dataset was collected from Twitter’s Stream API between 1
4.2 Configuration of Execution System
The proposed model (HTSM) is written by Python in Pycharm application which executes the algorithms with the following system configuration: processor: Intel(R) Core i5-4200 M CPU @ 2.5 GHz; memory: 8 GB DDR3; operating system: Windows 10 Education; Python version: Python 2.7; and Pycharm Version: 2019.3.3.
After proceeding to extract the concepts, let us visualize the tweets using a word cloud. From the word cloud shown in Fig. 3a, it can be seen that the word HTC has been mentioned repeatedly in the tweets. From the word cloud shown in Fig. 3b, it can be seen that the Coronavirus word has been mentioned repeatedly in the tweets. The larger the word is present in the word cloud, the more frequently the word occurs.
The input to hierarchical extraction is a collection of tweets after making preprocessing. The output is a hierarchical clustering dendrogram. Fig. 4 shows HTC and Coronavirus hierarchical clustering dendrogram. To name each node in the extracted hierarchical dendrogram, it’s necessary to extract the important aspects in each cluster.
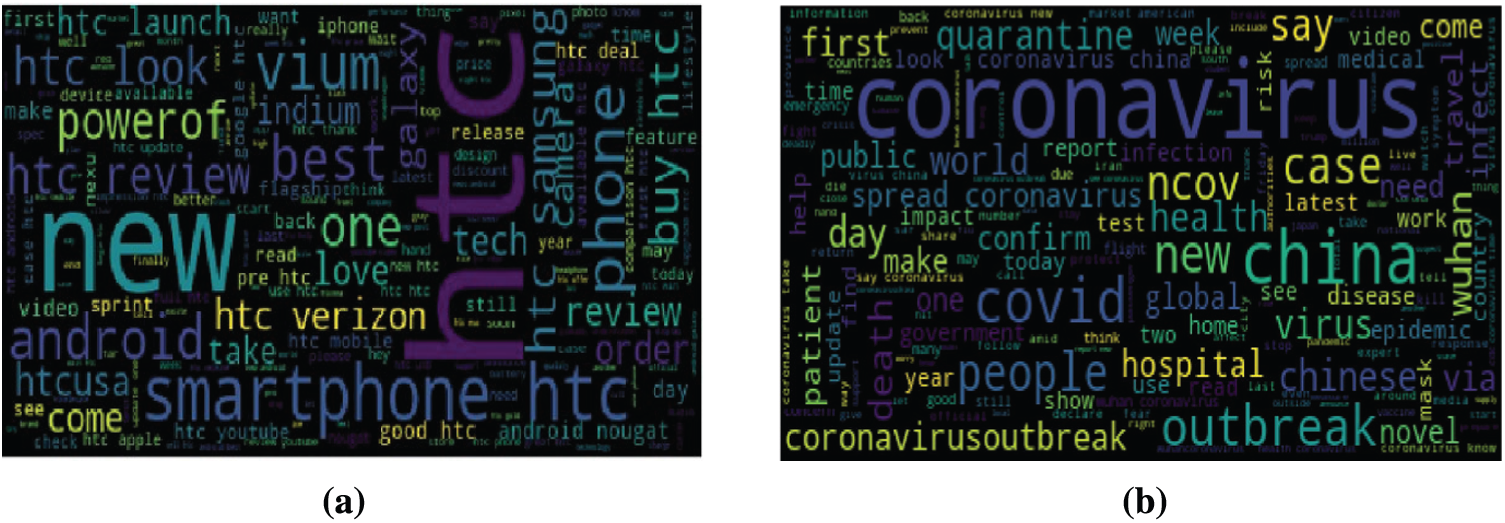
Figure 3: HTC and Coronavirus wordcloud visualization. (a) HTC wordcloud (b) Coronavirus wordcloud
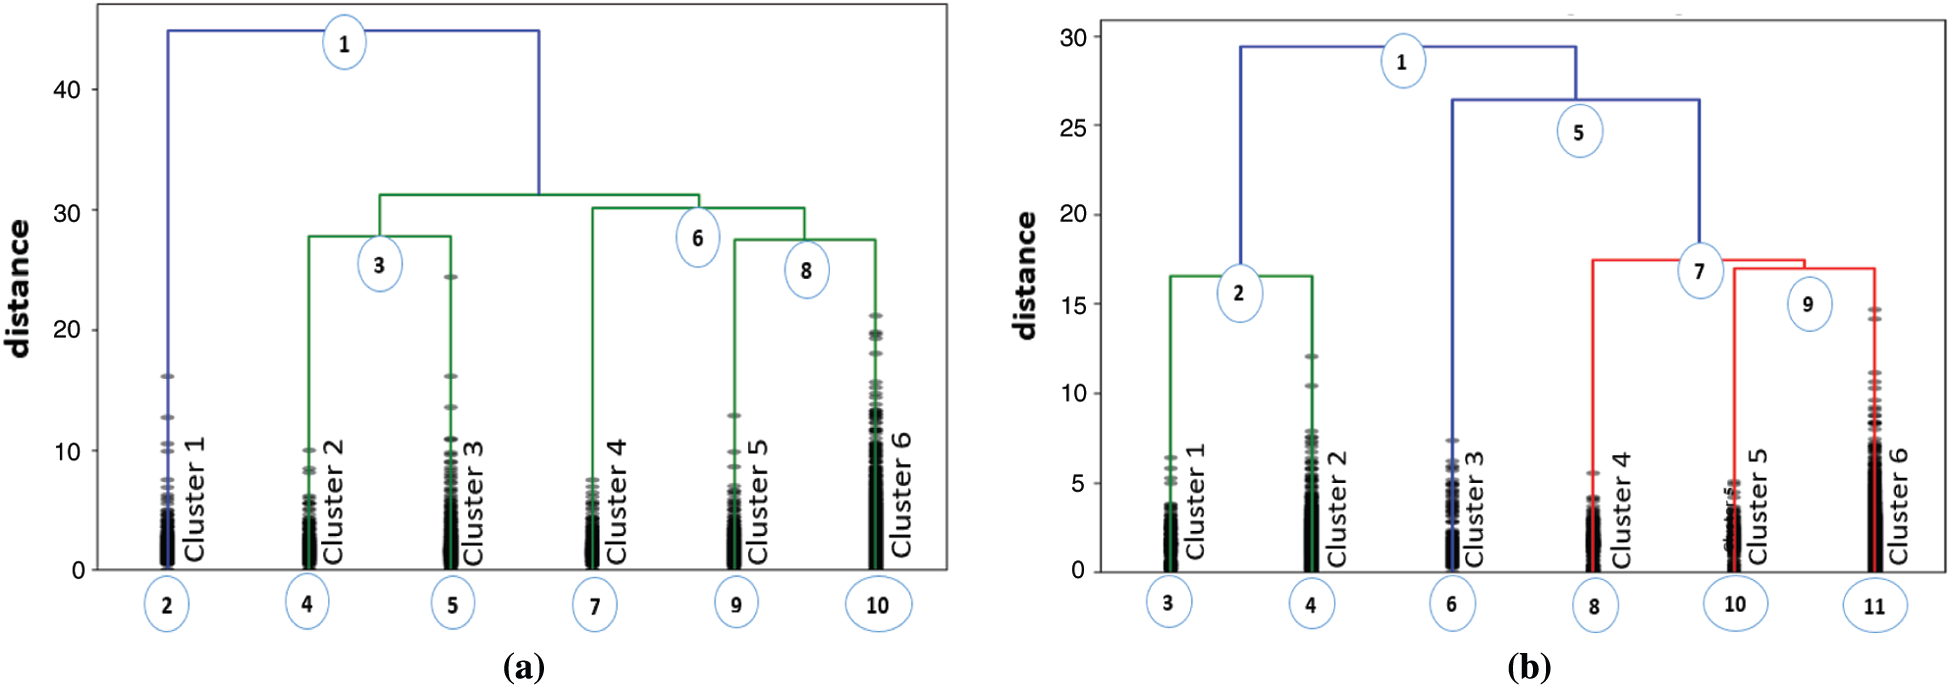
Figure 4: Hierarchical clustering dendrogram of HTC tweets. (a) HTC tweets (b) Coronavirus tweets
If all words that people talk about are considered important, the noise will be added to the algorithm. To avoid noise, the top five nouns in each cluster are selected as listed in Tab. 1. To extract the important words that people talk about during the coronavirus pandemic outbreak, the most five words repeated in the people’s posts on Twitter in each cluster are chosen as listed in Tab. 2.
After extracting the hierarchical tree of the important aspects, The VADER sentiment analysis is applied to two datasets to analyze people’s opinions towards the extracted aspects.
HTC Sentiment Analysis: After performing VADER sentiment analysis on the HTC dataset and applying the thresholds the tweets can be categorized as follows: strongly positive, positive, neutral, strongly negative, or negative. Fig. 5 represents the category of HTC tweets based on sentiment polarity in each cluster. In Fig. 5a, cluster 1 contains 405 tweets that can be categorized as follows: 89 strongly positive tweets, 248 positive tweets, 62 neutral tweets, and 6 negative tweets. As it is presented in Fig. 5b cluster 2 contains 328 tweets that can be categorized as follows: 82 strongly positive tweets, 52 positive tweets, 176 neutral tweets, 10 strongly negative tweets, and 8 negative tweets. As shown in Fig. 5c cluster 3 contains 1098 tweets that can be categorized as follows: 415 strongly positive tweets, 195 positive tweets, 421 neutral tweets, 10 strongly negative tweets, and 57 negative tweets. As it is given in Fig. 5d the cluster 4 contains 238 tweets that can be categorized as follows: 3 strongly positive tweets, 17 positive tweets, 212 neutral tweets, 2 strongly negative tweets, and 4 negative tweets. As presented in Fig. 5e cluster 5 contains 528 tweets that can be categorized as follow: 43 strongly positive tweets, 87 positive tweets, 364 neutral tweets, 8 strongly negative tweets, and 26 negative tweets. It is clear from Fig. 5f the cluster 6 contains 9923 tweets that can be categorized as follows: 2161 strongly positive tweets, 2471 positive tweets, 4282 neutral tweets, 219 strongly negative tweets, and 790 negative tweets.
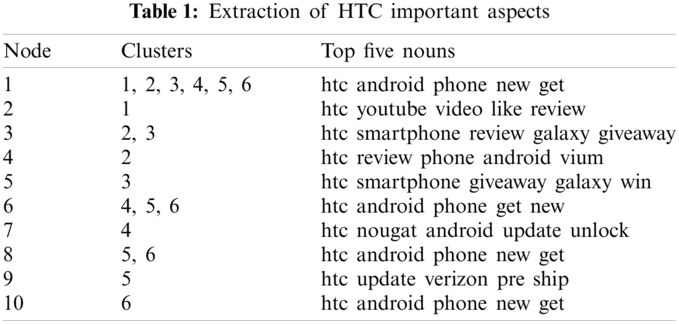
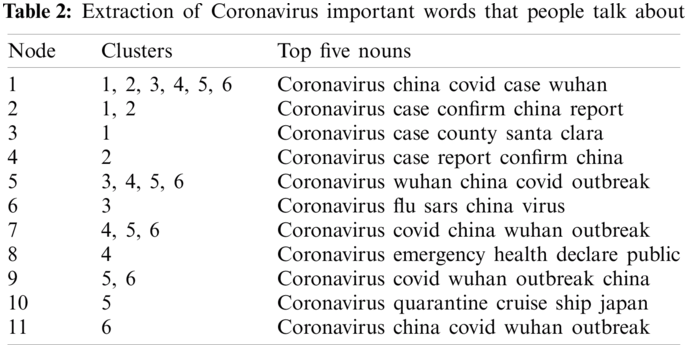
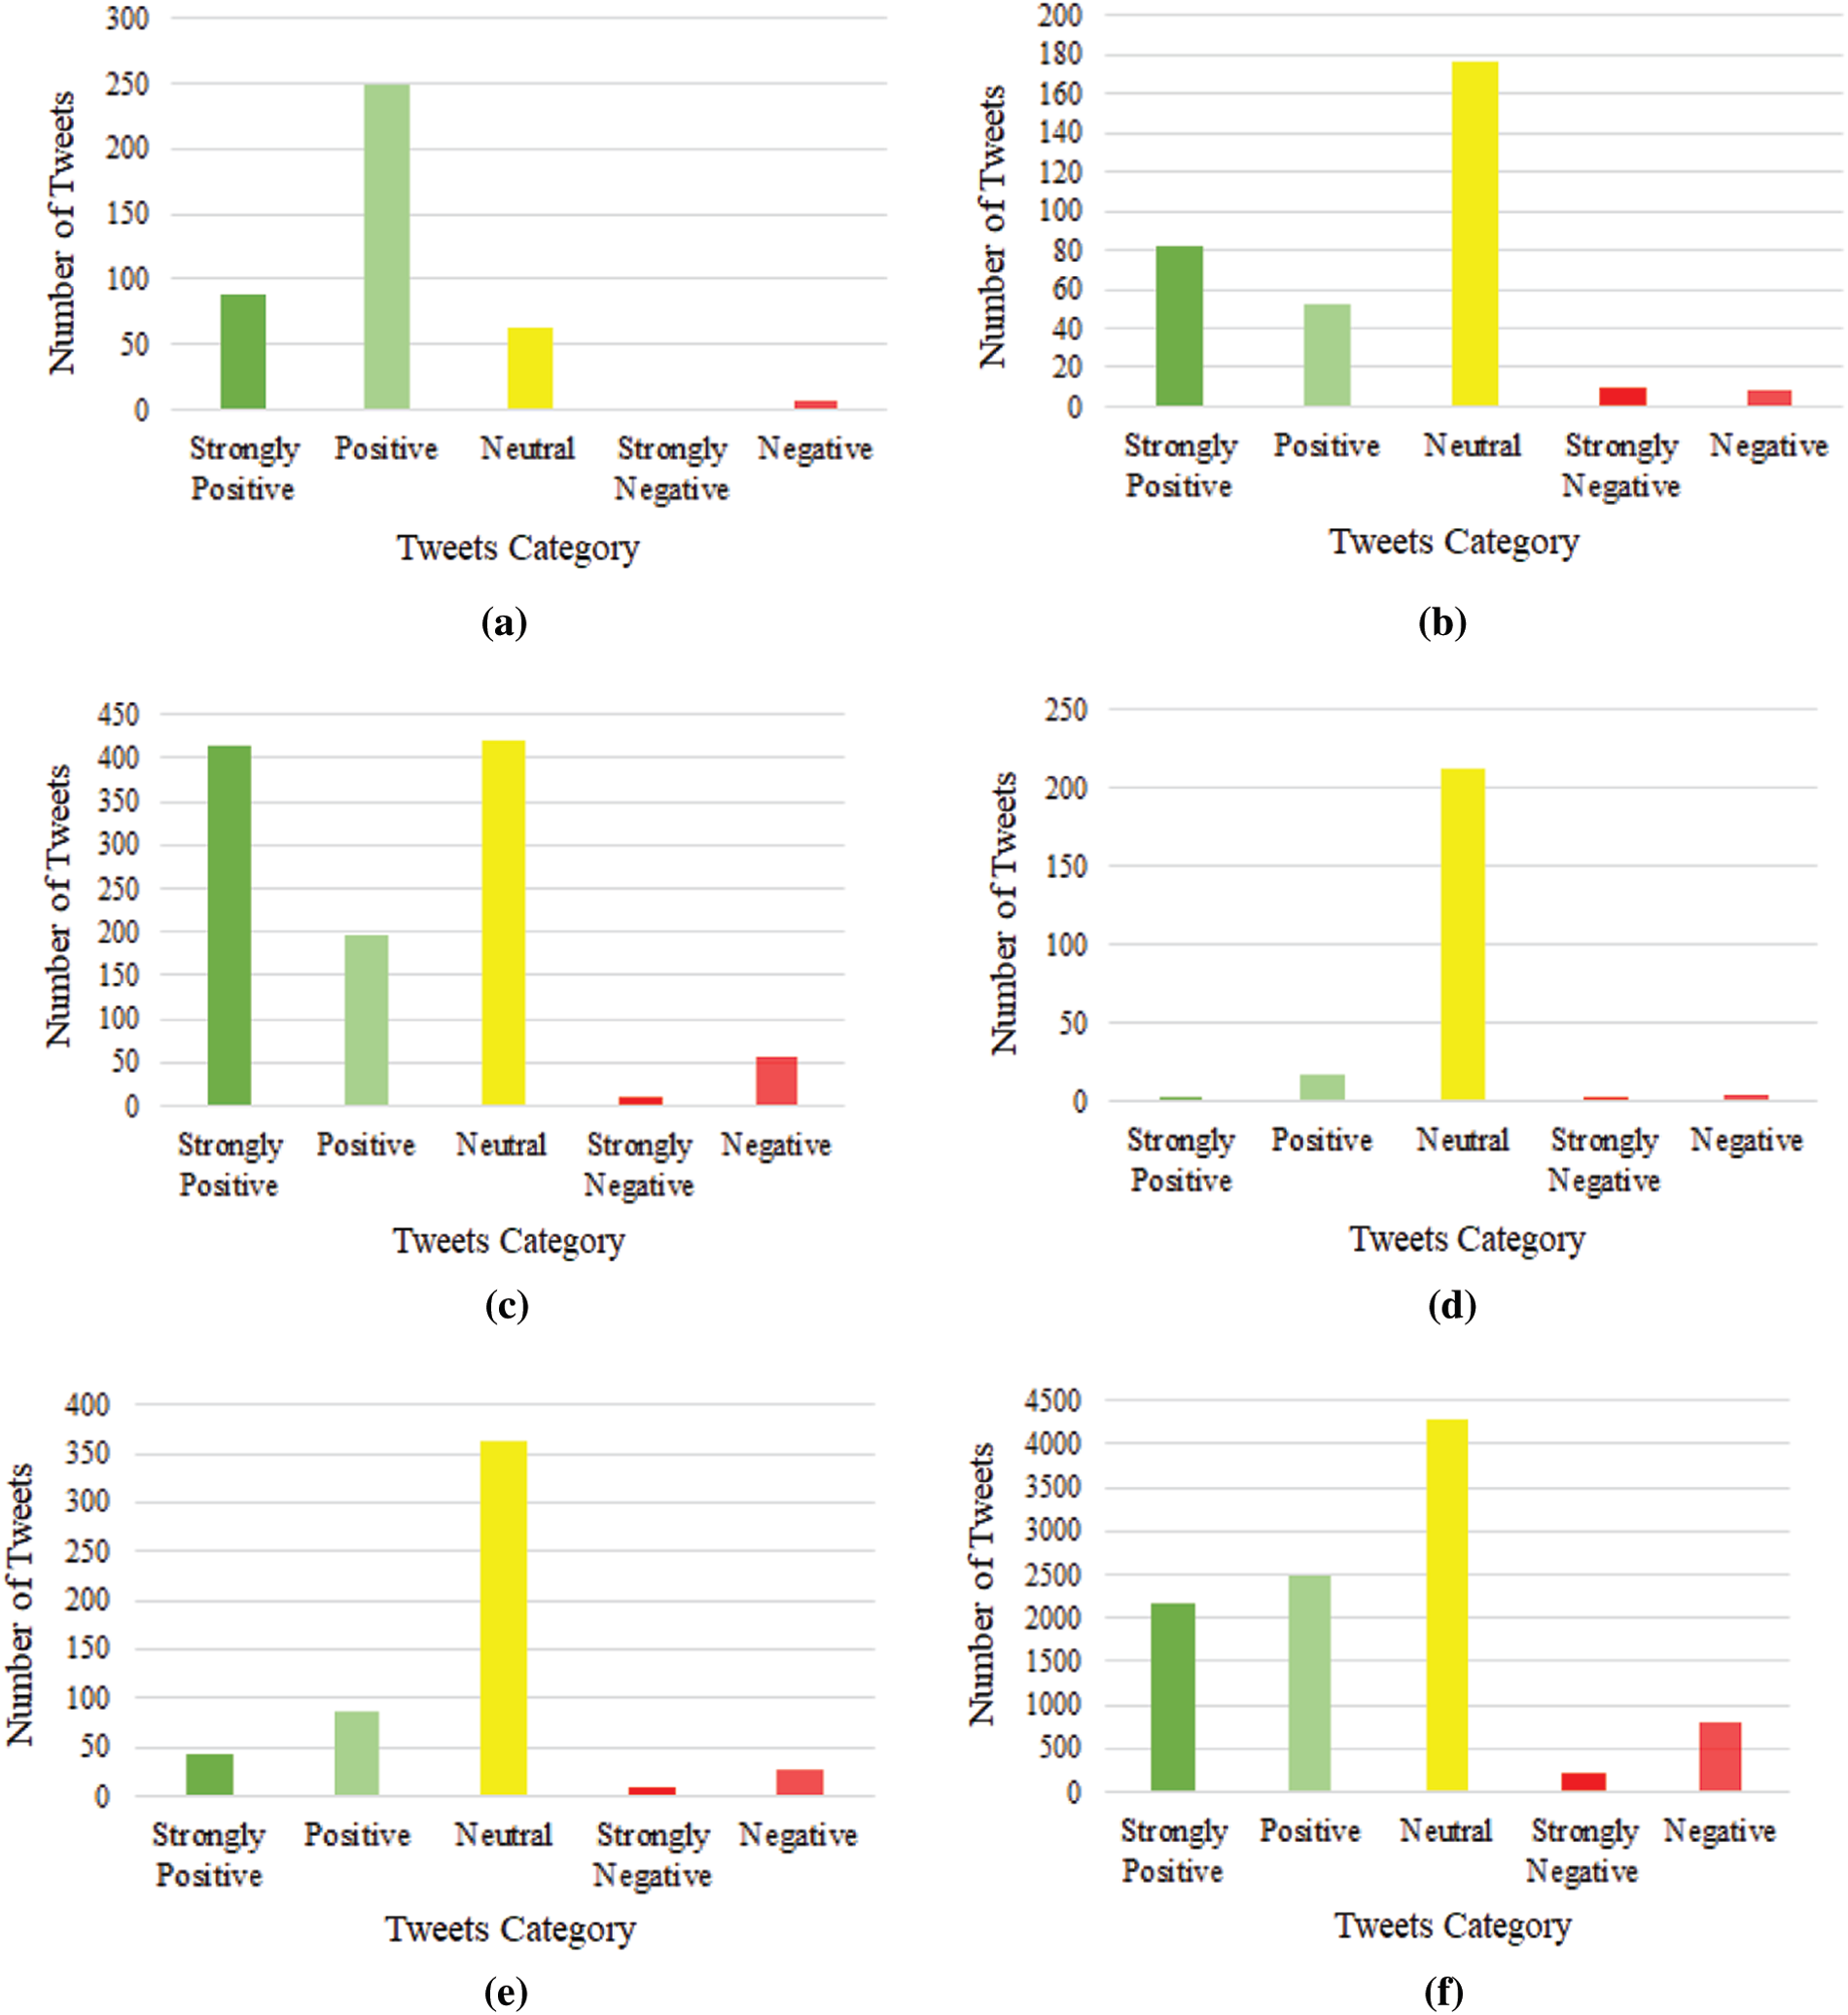
Figure 5: Category of HTC tweets based on sentiment polarity in each cluster. (a) HTC cluster 1 (b) HTC cluster 2 (c) HTC cluster 3 (d) HTC cluster 4 (e) HTC cluster 5 (f) HTC cluster 6

Figure 6: Category of Coronavirus tweets based on sentiment polarity in each cluster. (a) Coronavirus cluster 1 (b) Coronavirus cluster 2 (c) Coronavirus cluster 3 (d) Coronavirus cluster 4 (e) Coronavirus cluster 5 (f) Coronavirus cluster 6
Coronavirus Sentiment Analysis: After performing VADER sentiment analysis on the coronavirus dataset, the tweets can be categorized as follows: strongly positive, positive, neutral, strongly negative, or negative. As presented in Fig. 6a cluster 1 contains 156 tweets that can be categorized as follows: 18 strongly positive tweets, 21 positive tweets, 97 neutral tweets, 4 strongly negative tweets, and 16 negative tweets. In Fig. 6b, cluster 2 contains 1471 tweets that can be categorized as follows: 67 strongly positive tweets, 260 positive tweets, 559 neutral tweets, 380 strongly negative tweets, and 205 negative tweets. It is clear from Fig. 6c that cluster 3 contains 179 tweets that can be categorized as follows: 10 strongly positive tweets, 17 neutral tweets, 67 strongly negative tweets, and 85 negative tweets. As given in Fig. 6d cluster 4 contains 214 tweets that can be categorized as follows: 13 strongly positive tweets, 20 positive tweets, 8 neutral tweets, 60 strongly negative tweets, and 113 negative tweets. In Fig. 6e, cluster 5 contains 306 tweets that can be categorized as follows: 63 strongly positive tweets, 90 positive tweets, 65 neutral tweets, 43 strongly negative tweets, and 45 negative tweets. As presented in Fig. 6f cluster 6 contains 12472 tweets that can be categorized as follows: 1792 strongly positive tweets, 2658 positive tweets, 3251 neutral tweets, 2171 strongly negative tweets, and 2600 negative tweets.
The total sentiment polarity score for each cluster based on Eq. (5) is represented as shown in Tab. 3. If the polarity score of aspects is (0).8, that means the polarity of 80% of messages related to this aspect is positive. It is clear from Tab. 3 all HTC polarity score is greater than (0.7) that refers to the total polarity of the extracted tree is positive. Also, all coronavirus polarity score is less than (0.6) that means the total polarity of the coronavirus sentiment tree is negative. Finally, the HTC tweets can be categorized as follows: (22%) strongly positive tweets, (25)% positive tweets, (44%) neutral tweets, (2%) strongly negative tweets, (7%) negative tweets as shown in Fig. 7a. The Coronavirus can be categorized as follows: (13%) strongly positive tweets, (21%) positive tweets, (27%) neutral tweets, (18%) strongly negative tweets, (21%) negative tweets as presented in Fig. 7b.
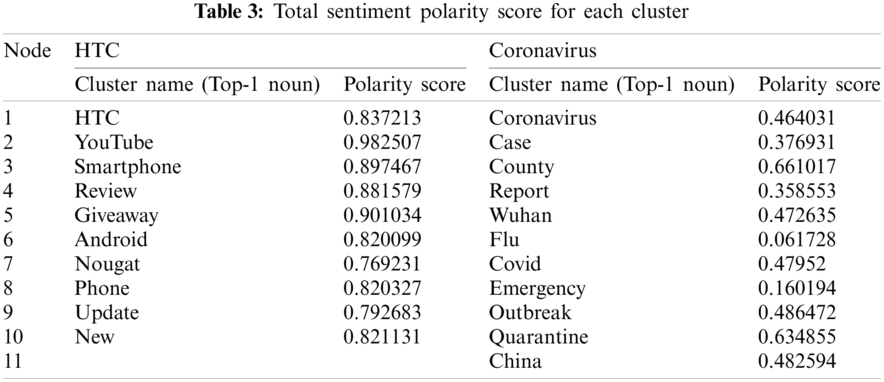
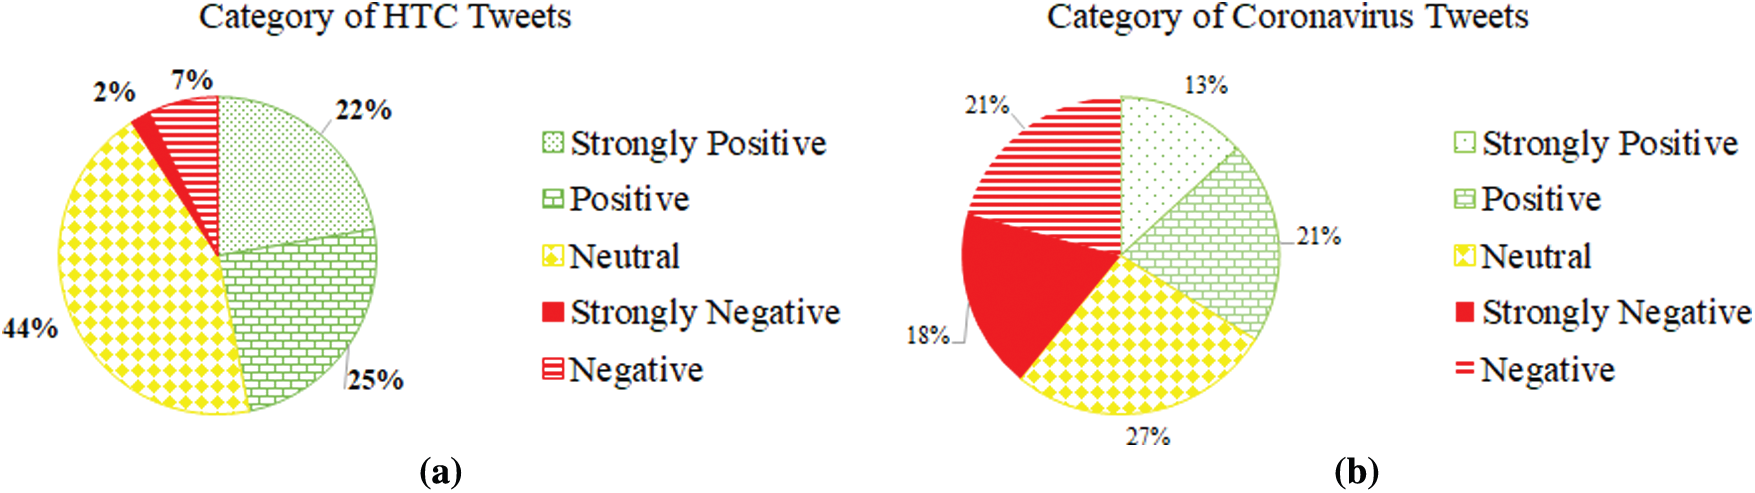
Figure 7: Sentiment analysis of HTC and Coronavirus tweets. (a) Sentiment analysis of HTC tweets (b) Sentiment analysis of Coronavirus tweets
5 Discussion and Evaluation Analysis
In this subsection, the result of two methods is illustrated namely: node specialization and parent-child relatedness.
It is clear from Fig. 8 that the greater the depth of the tree is, the more accurate the properties are. Children are less repetitive in the text than parents and grandparents. The results show that the extracted aspects are organized from general to specific.

Figure 8: Node specialization indicating the extracted aspects are organized from general to specific. (a) HTC dataset (b) Coronavirus dataset
5.1.2 Parent-Child Relatedness
To calculate the parent-child relatedness, the average score of relatedness to non-children and children aspects for all parent aspects at the same level is calculated. As presented in Fig. 9 the highest relatedness scores for children show that a parent is more related to its children, compared to non-children at the same level.
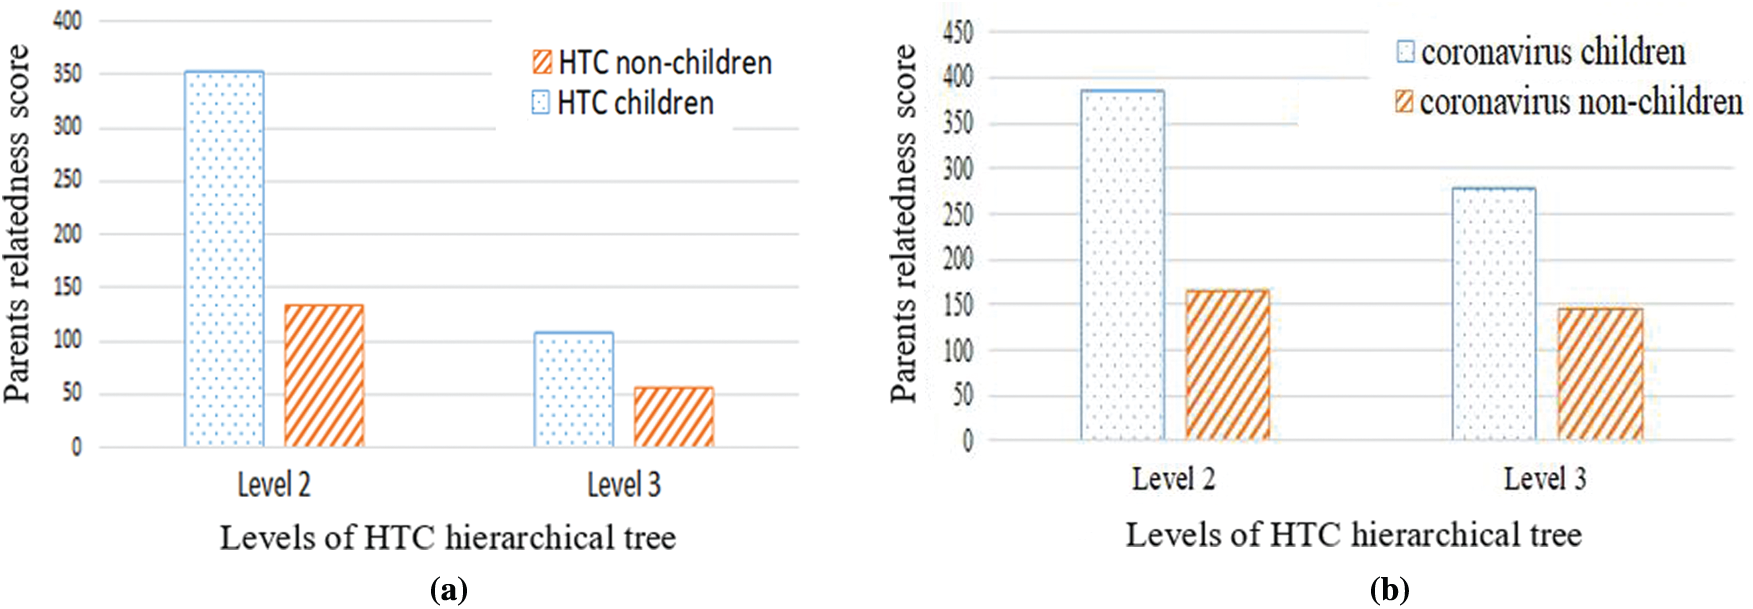
Figure 9: Parent-children relatedness. A high distance indicates that the parent is similar to its children. (b) HTC dataset (b) Coronavirus dataset
5.2 Comparison with Other Methods
The proposed HTSM is compared with four models of hierarchical creation based on the parent-child relatedness. The first model was proposed by Kim et al. [33] which uses the recursive Chinese restaurant process (rCRP) to extract a hierarchical structure of topics. The second model is HASM that was proposed by Kim et al. [18] and discovered aspects hierarchically from online reviews. The third model is the structured sentiment analysis (SSA) model [34] which extracts a hierarchical sentiment tree with a specified width and depth. The fourth model is the hierarchical user sentiment topic model (HUSTM) [35] which performs hierarchical sentiment analysis by discovering the hidden structure of topics and users. The aspect that represents the parent must be more similar to its direct children than to the children descending from another aspect. The parent-child relatedness is computed for a parent aspect at level (2) with the children aspects at level (3) on the HTC dataset using Eqs. (6) and (7). As given in Fig. 10a the results show significant differences among children and non-children when using HTSM and HUSTM, while the SSA and rCRP did not. When calculating the relatedness of the HASM for the HTC dataset, it produces duplicate children and is not consequently considered. Finally, the results show that HTSM outperformed the other algorithms and the reason for this was that the proposed model uses the ward’s hierarchical clustering algorithm to build a hierarchical tree of important aspects. Moreover, it uses VADER sentiment analysis in analyzing the extracted opinions and discovering the sentiment polarity. The results show its effectiveness in dealing with a short text. In the proposed model, after making HTC tweets preprocessing, the execution time for different numbers of tweets is measured to see and use the time taken to then extract the hierarchical sentiment tree. Fig. 10b illustrates the execution time of three models SSA, rCRP and HTSM. The result shows that HTSM outperforms in execution time the SSA method.
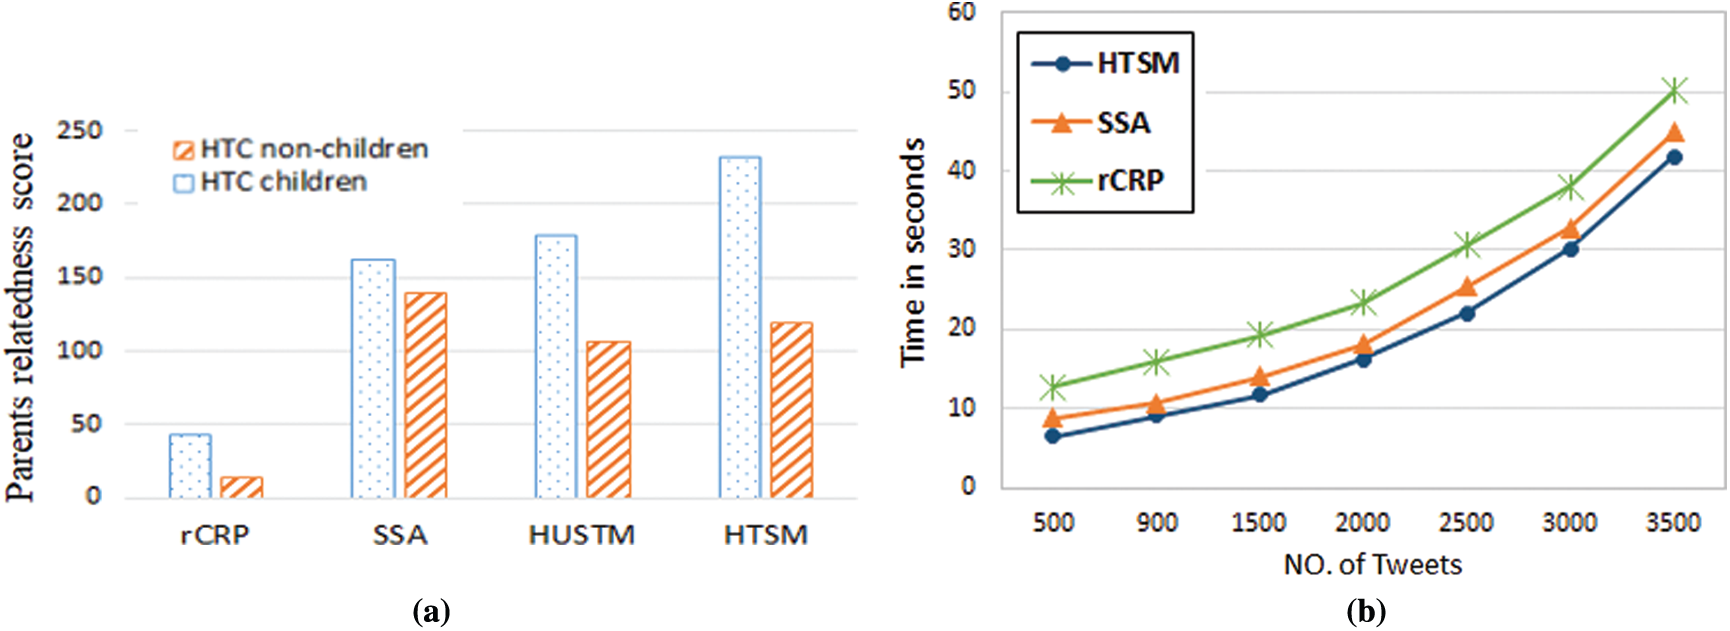
Figure 10: Comparison with other methods. (a) Parent-child relatedness of HTC dataset (b) Execution time
Analyzing people’s opinions on Twitter is very important because most people express their opinions on social media sites. In this paper, HTSM is proposed to analyze people’s sentiments and feelings about an HTC product and the Coronavirus topic in short texts without determining the width and depth of the discovered hierarchical tree at first. The suggested model first extracts the hierarchical tree of important aspects. Then, it performs the VADER sentiment analysis on those aspects to discover people’s opinions and classify their opinion’s into the following values: strongly positive, positive, neutral, strongly negative, or negative. The experimental results show that the suggested model can effectively analyze opinions expressed by peoples in short texts. Another advantage of HTSM is that it is effective, simple and easy to implement. In future work, we would like to extend the proposed model to effectively extract an understandable summary then providing explanations of the extracted results. People like to know the reasons why the sentiment polarity of each extracted aspect is positive, neutral, or negative.
Funding Statement: This research was supported by Korea Institute for Advancement of Technology (KIAT) grant funded by the Korea Government (MOTIE) (P0012724, The Competency Development Program for Industry Specialist) and the Soonchunhyang University Research Fund.
Conflicts of Interest: The authors declare that they have no conflicts of interest to report regarding the present study.
1. S. Bekhet, M. Hassaballah, M. A. Kenk and M. A. Hameed, “An a.pngicial intelligence based technique for COVID-19 diagnosis from chest X-ray,” in 2nd Novel Intelligent and Leading Emerging Sciences Conf., Giza, Egypt, pp. 191–195, 2020. [Google Scholar]
2. D. E. Apollonio, K. Broyde, A. Azzam, M. De Guia and T. Brock, “Pharmacy students can improve access to quality medicines information by editing wikipedia articles,” BMC Medical Education, vol. 18, pp. 1–8, 2018. [Google Scholar]
3. D. Antonakaki, P. Fragopoulou and S. Ioannidis, “A survey of twitter research: Data model, graph structure, sentiment analysis and attacks,” Expert Systems with Applications, vol. 164, pp. 114006, 2021. [Google Scholar]
4. M. Anderson and J. Jiang, “Teens, social media & technology 2018,” Pew Research Center, vol. 31, pp. 1673–1689, 2018. [Google Scholar]
5. J. A. Morente-Molinera, G. Kou, K. Samuylov, R. Ureña and E. Herrera-Viedma, “Carrying out consensual group decision making processes under social networks using sentiment analysis over comparative expressions,” Knowledge-Based Systems, vol. 165, pp. 335–345, 2019. [Google Scholar]
6. J. Zhan and B. Dahal, “Using deep learning for short text understanding,” Journal of Big Data, vol. 4, pp. 1–15, 2017. [Google Scholar]
7. X. Sun and J. He, “A novel approach to generate a large scale of supervised data for short text sentiment analysis,” Multimedia Tools and Applications, vol. 79, pp. 5439–5459, 2020. [Google Scholar]
8. A.-M. Popescu and O. Etzioni, “Extracting product features and opinions from reviews,” in Natural Language Processing and Text Mining, Cham: Springer, pp. 9–28, 2007. [Google Scholar]
9. J. Weng, E.-P. Lim, J. Jiang and Q. He, “Twitterrank: Finding topic-sensitive influential twitterers,” in 3rd ACM Int. Conf. on Web Search and Data Mining, Chennai, India, pp. 261–270, 2010. [Google Scholar]
10. M. Hu and B. Liu, “Mining and summarizing customer reviews,” in ACM SIGKDD Int. Conf. on Knowledge Discovery and Data Mining, NY, USA, pp. 168–177, 2004. [Google Scholar]
11. G. Xu, Y. Meng, X. Qiu, Z. Yu and X. Wu, “Sentiment analysis of comment texts based on BiLSTM,” IEEE Access, vol. 7, pp. 51522–51532, 2019. [Google Scholar]
12. C. Dos Santos and M. Gatti, “Deep convolutional neural networks for sentiment analysis of short texts,” in 25th Int. Conf. on Computational Linguistics: Technical Papers, Dublin, Ireland, pp. 69–78, 2014. [Google Scholar]
13. H. Wang, M. Hou, F. Li and Y. Zhang, “Chinese implicit sentiment analysis based on hierarchical knowledge enhancement and multi-pooling,” IEEE Access, vol. 8, pp. 126051–126065, 2020. [Google Scholar]
14. G. Barkur and G. B. K. Vibha, “Sentiment analysis of nationwide lockdown due to COVID 19 outbreak: Evidence from India,” Asian Journal of Psychiatry, vol. 51, pp. 102089, 2020. [Google Scholar]
15. M. O. Lwin, J. Lu, A. Sheldenkar, P. J. Schulz, W. Shin et al., “Global sentiments surrounding the COVID-19 pandemic on twitter: Analysis of twitter trends,” JMIR Public Health and Surveillance, vol. 6, pp. e19447, 2020. [Google Scholar]
16. H. R. Rao, N. Vemprala, P. Akello and R. Valecha, “Retweets of officials’ alarming vs. reassuring messages during the COVID-19 pandemic: Implications for crisis management,” International Journal of Information Management, vol. 55, pp. 102187, 2020. [Google Scholar]
17. J. Samuel, G. Ali, M. Rahman, E. Esawi and Y. Samuel, “Covid-19 public sentiment insights and machine learning for tweets classification,” Information, vol. 11, pp. 314, 2020. [Google Scholar]
18. S. Kim, J. Zhang, Z. Chen, A. Oh and S. Liu, “A hierarchical aspect-sentiment model for online reviews,” in AAAI Conf. on A.pngicial Intelligence, Washington, USA, pp. 1–5, 2013. [Google Scholar]
19. I. Titov and R. McDonald, “Modeling online reviews with multi-grain topic models,” in 17th Int. Conf. on World Wide Web, Washington, USA, pp. 111–120, 2018. [Google Scholar]
20. P. Chen, N. L. Zhang, T. Liu, Z. Chen and F. Khawar, “Latent tree models for hierarchical topic detection,” A.pngicial Intelligence, vol. 250, pp. 105–124, 2017. [Google Scholar]
21. D. M. Blei, T. L. Griffiths and M. I. Jordan, “The nested Chinese restaurant process and Bayesian nonparametric inference of topic hierarchies,” Journal of the ACM, vol. 57, pp. 1–30, 2010. [Google Scholar]
22. A. Jain, B. P. Nandi, C. Gupta and D. K. Tayal, “Senti-nSetPSO: Large-sized document-level sentiment analysis using neutrosophic Set and particle swarm optimization,” Soft Computing, vol. 24, pp. 3–15, 2020. [Google Scholar]
23. J. Y. Ong, M. Mun’im Ahmad Zabidi, N. Ramli and U. U. Sheikh, “Sentiment analysis of informal malay tweets with deep learning,” IAES International Journal of A.pngicial Intelligence, vol. 9, pp. 212, 2020. [Google Scholar]
24. R. Ahuja, A. Chug, S. Kohli, S. Gupta and P. Ahuja, “The impact of features extraction on the sentiment analysis,” Procedia Computer Science, vol. 152, pp. 341–348, 2019. [Google Scholar]
25. A. Gazdar and L. Hidri, “A new similarity measure for collaborative filtering based recommender systems,” Knowledge-Based Systems, vol. 188, pp. 105058, 2020. [Google Scholar]
26. V. Cohen-Addad, V. Kanade, F. Mallmann-Trenn and C. Mathieu, “Hierarchical clustering: Objective functions and algorithms,” Journal of the ACM, vol. 66, pp. 1–42, 2019. [Google Scholar]
27. X. Wang, F. Yu, W. Pedrycz and J. Wang, “Hierarchical clustering of unequal-length time series with area-based shape distance,” Soft Computing, vol. 23, pp. 6331–6343, 2019. [Google Scholar]
28. S. Barak and T. Mokfi, “Evaluation and selection of clustering methods using a hybrid group MCDM,” Expert Systems with Applications, vol. 138, pp. 112817, 2019. [Google Scholar]
29. A. Borg and M. Boldt, “Using VADER sentiment and SVM for predicting customer response sentiment,” Expert Systems with Applications, vol. 162, pp. 113746, 2020. [Google Scholar]
30. C. Song, X.-K. Wang, P.-F. Cheng, J.-Q. Wang and L. Li, “SACPC: A framework based on probabilistic linguistic terms for short text sentiment analysis,” Knowledge-Based Systems, vol. 194, pp. 105572, 2020. [Google Scholar]
31. V. Bonta and N. K. a. N. Janardhan, “A comprehensive study on lexicon based approaches for sentiment analysis,” Asian Journal of Computer Science and Technology, vol. 8, pp. 1–6, 2019. [Google Scholar]
32. A. M. Almars, I. A. Ibrahim, X. Zhao and S. Al-Maskari, “Evaluation methods of hierarchical models,” in Int. Conf. on Advanced Data Mining and Applications, Cham, Springer, pp. 455–464, 2018. [Google Scholar]
33. J. H. Kim, D. Kim, S. Kim and A. Oh, “Modeling topic hierarchies with the recursive Chinese restaurant process,” in 21st ACM Int. Conf. on Information and Knowledge Management, NY, USA, pp. 783–792, 2018. [Google Scholar]
34. A. Almars, X. Li, X. Zhao, W. Yuan and B. Li, “Structured sentiment analysis,” in Int. Conf. on Advanced Data Mining and Applications, NY, USA, pp. 695–707, 2017. [Google Scholar]
35. A. Almars, X. Li, and X. Zhao, “Modelling user attitudes using hierarchical sentiment-topic model,” Data & Knowledge Engineering, vol. 119, pp. 139–149, 2019. [Google Scholar]
 | This work is licensed under a Creative Commons Attribution 4.0 International License, which permits unrestricted use, distribution, and reproduction in any medium, provided the original work is properly cited. |