DOI:10.32604/cmc.2022.017820
| Computers, Materials & Continua DOI:10.32604/cmc.2022.017820 | |
| Article |
A Multilevel Deep Feature Selection Framework for Diabetic Retinopathy Image Classification
1Department of ECE, COMSATS University Islamabad, Wah Campus, 47040, Pakistan
2Department of Computer Science and Engineering, Soonchunhyang University, Asan, Korea
3Department of Electrical Engineering, NUML, Rawalpindi, Pakistan
4Department of Computer Science, HITEC University Taxila, Taxila, Pakistan
*Corresponding Author: Yunyoung Nam. Email: ynam@sch.ac.kr
Received: 12 February 2021; Accepted: 19 April 2021
Abstract: Diabetes or Diabetes Mellitus (DM) is the upset that happens due to high glucose level within the body. With the passage of time, this polygenic disease creates eye deficiency referred to as Diabetic Retinopathy (DR) which can cause a major loss of vision. The symptoms typically originate within the retinal space square in the form of enlarged veins, liquid dribble, exudates, haemorrhages and small scale aneurysms. In current therapeutic science, pictures are the key device for an exact finding of patients’ illness. Meanwhile, an assessment of new medicinal symbolisms stays complex. Recently, Computer Vision (CV) with deep neural networks can train models with high accuracy. The thought behind this paper is to propose a computerized learning model to distinguish the key precursors of Dimensionality Reduction (DR). The proposed deep learning framework utilizes the strength of selected models (VGG and Inception V3) by fusing the extracated features. To select the most discriminant features from a pool of features, an entropy concept is employed before the classification step. The deep learning models are fit for measuring the highlights as veins, liquid dribble, exudates, haemorrhages and miniaturized scale aneurysms into various classes. The model will ascertain the loads, which give the seriousness level of the patient’s eye. The model will be useful to distinguish the correct class of seriousness of diabetic retinopathy pictures.
Keywords: Deep neural network; diabetic retinopathy; retina; features extraction; classification
Numerous examinations have shown that early discovery and treatment can diminish the measure of Diabetic Retinopathy (DR) cases [1], alleviating the therapeutic and monetary effects of the sickness [2]. Precise early detection of eye illness utilizing retinal images, also called retinal screening, is critical because of its potential for decreasing the number of instances of visual impairment around the globe [3]. Precise screening for DR utilizing retinal photography has appeared to decrease visual impairment among individuals with diabetes [4]. In Britain [5], there was considerable proof that bolstered the presentation of a national screening program for DR. In 2000, they started presenting a foundational national screening program dependent on computerized photography, which effectively proceeds right up to the present time [6]. Computerized Retinal pictures are manageable to the utilization of refined picture investigation procedures that can aid the screening procedure by making more proficiency in the reviewing/perusing process and subsequently expanding the throughput as the interest all the while increments [7]. The programmed screening calculations point to DR injuries when variations are found in the retinal fudus pictures as compared to the norm. Along these lines, two purposes can be accomplished: i) evaluation and opportune referral for treatment in the DR populace, and ii) increased productivity in the utilization of medicinal services assets for those that require the timeliest consideration.
DR is a term connected to the impacts of diabetes in the eye, or to be more specific, the neural tissue in the eye, the retina [8]. DR is an exceedingly explicit vascular entanglement of the two types, Type 1 and Type 2 diabetes, with pervasiveness certainly identified with the length of diabetes. DR is the most common reason for new visual impairment instances among grown-ups and matured within the age range of 20–74 years [9]. Notwithstanding diabetes, different variables that expand the danger of, or are related with, retinopathy are constant hyperglycemia, nephropathy, and hypertension [10]. This disorder is generally asymptomatic in its beginning times, and, as an outcome, people with diabetes don’t consider being analyzed all the time. Once DR has been identified in the retina, visual examinations by an eye care professional will require more successive observations and visits. DR influences the portion of the populace with diabetes. The worldwide pervasiveness of diabetes has been ceaselessly expanding, and current projections gauge that 438 million grown-ups will be influenced by 2030 [11]. With this gauge, at least 2.4 million eyes should be assessed for retinopathy consistently.
There are four phases that are portrayed by the National Eye Institute (NEI) as demonstrated beneath:
1. Mild Non-Proliferative Retinopathy (NPDR): In this stage, a couple of smaller-scale aneurysms are characterized as little outpouchings in the dividers of the minor veins (called vessels) show up in the retina.
2. Moderate Non-proliferative Retinopathy (NPDR): More sores show up in this phase as more vessels that sustain the retinal tissue wind up harmed, and the retina turns out to be more ischemic (absence of bloodstream, and along these lines absence of oxygen).
3. Severe Non-proliferative Retinopathy (NPDR): At this dimension of DR, many veins are influenced. Vein supply of oxygen to the retina is seriously bargained because of gathered vessel harm. When this happens, certain zones of the retina begin sending biochemical signs to the body that they require oxygen.
4. Proliferative Retinopathy (PDR): Because of the oxygen requirement, new vessels (neovascularization) start to develop inside the retina. These new vessels are a premature endeavour of the retina to recapture its oxygenation, yet these vessels are endangered and delicate. These vessels “break” effortlessly, causing extreme seeping into the eye’s vitreous gel and ensuing loss of vision. Likewise, these new vessels can connect themselves into the vitreous gel and cause footing on the retinal plane, causing retinal separations.
As depicted by Fig. 1, DR may progress in two different ways [12]: proliferative retinopathy, which has been portrayed previously, and maculopathy, which can be much of the time named as diabetic macular oedema, or DME. As its name recommends, maculopathy is an infection that influences the macula, which is the piece of the retina that is most sensitive to light.
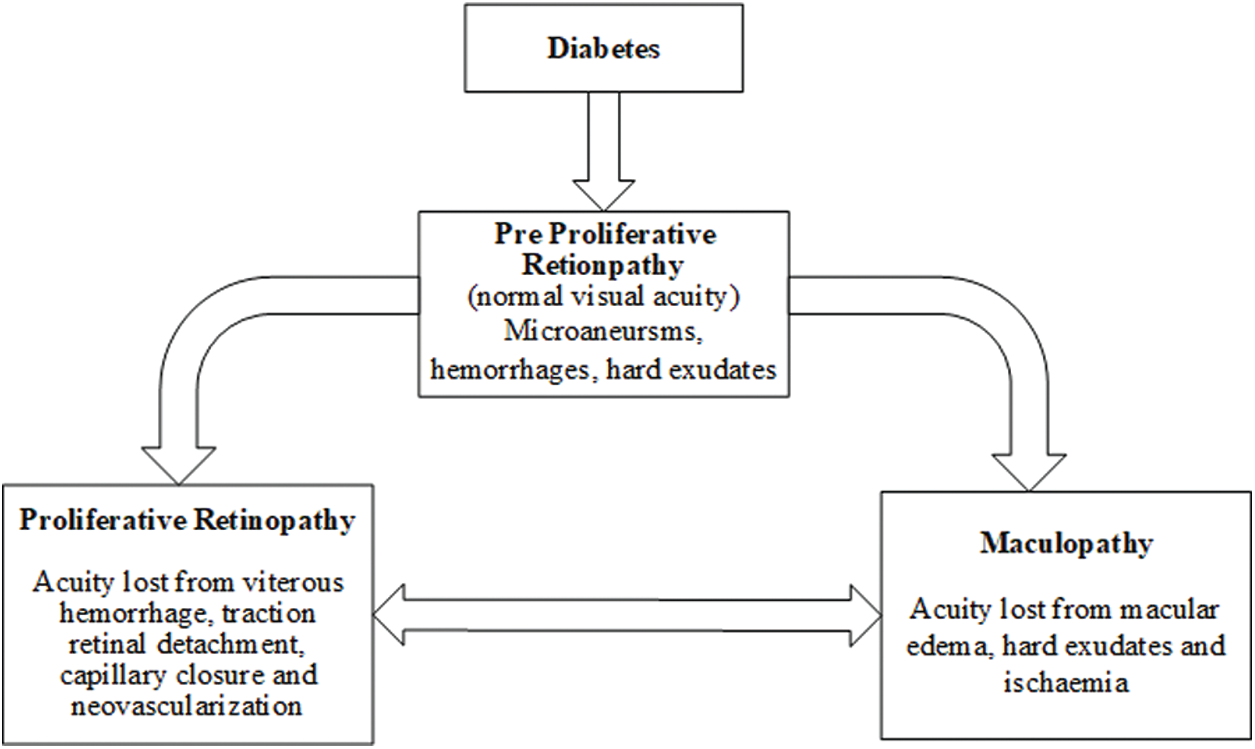
Figure 1: Development of eye disease produced by diabetes
This condition happens when liquid breaks into the macula, making it swell and causing obscured vision. This sickness is exceptionally regular in patients with proliferative retinopathy, influencing up to half of the cases. It tends to be seen in Fig. 2 how the patients who are at a propelled phase of DR see the pictures hazy and deficient, with dark patches created by pathologies, for example, hard exudates (HE) in the macula [13].
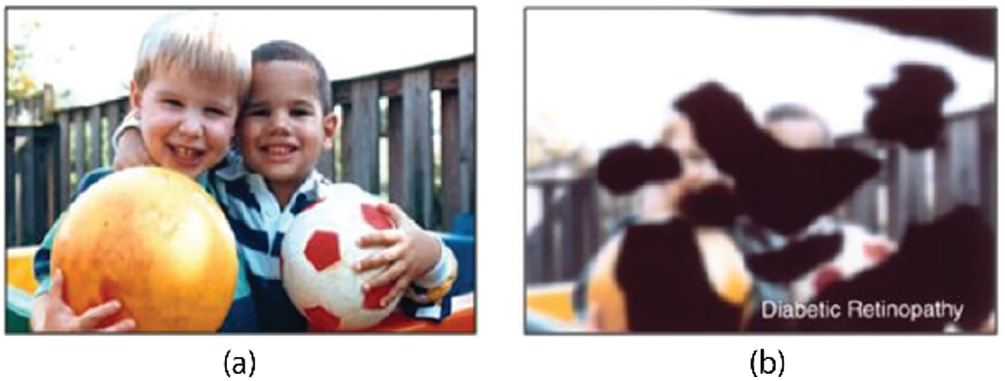
Figure 2: Eye disease simulations: (a) Normal image, (b) Image seen by an advanced case of DR. (Image courtesy of [14])
As indicated by the International Diabetes Federation in 2010, the number of individuals with diabetes had achieved 285 million worldwide [15]. “Unfortunate propensities” in the populace, for example, absence of activity, utilization of cheap food with high substance of fat, and so forth, add to the expansion of overweight populace that prompts diabetes Type II. Consequently, the quantity of diabetes cases is expanding every year, making it troublesome for the social insurance framework to screen all the diabetic individuals for retinopathy. As a choice to help cover the appeal, programmed Diabetic Retinopathy (DR) screening calculations have been produced which utilizes fundus pictures [16]. This work's inspiration is to apply various picture investigation procedures to recognise pathologies related to DR in the retina with more accentuation on the identification of sight undermining illnesses that can prompt serious vision harm. We build up a picture investigation calculation to identify anomalies in the macula, in which high visual goals is obtained, to search for macular edema [17]. We expect that by creating and applying these calculations to actual patients, we can recognise basic maladies. At that point, this early location will prompt timely treatment that can anticipate visual deficiency [18].
Eye screening is critical for the early recognition and treatment of diabetic retinopathy. Ordinary screening can help recognize patients with diabetes initially; consequently, prior distinguishing proof of any retinopathy can permit changes in circulatory strain or blood glucose to be overseen effectively to moderate the rate of movement of the infection. The proposed research’s significance is to defeat the ebb and flow issues looked in the diabetic retinopathy screening process, for example, hugely imbalanced dataset, manual finding by the ophthalmologist, time taken, and constraints of screening assets, and noisy, misty and low-differentiate pictures.
The accuracy of previously designed models has been degraded by the challenges mentioned above. Also, existing techniques dealt with multiple situations like their accuracy is better when dealing with fewer classes, but as the number of classes increase, the accuracy decreases. Therefore, it is important to address the above challenges by suggesting a better solution for improving accuracy, performance, computation time, and maintaining accuracy even after the number of classes increase. A programmed framework will help an ophthalmologist (or optometrist) distinguish diabetic retinopathy (and its nitty gritty arrangement) in a more effective and quicker route contrasted and manual investigation additional tedious. Subsequently, the proposed framework will aid the procedure of prescribed follow-up timetables as every classification of diabetic retinopathy depends on the framework discovery. Besides, the improvement of the proposed framework will add to conquering the diabetic retinopathy screening confinement’s characteristic in the present manual screening method, particularly given the issues of deficiently prepared staff and the utilization of the fundus camera. Primary commitments of this theory include:
Initially, image scaling is performed to make each image of the same size. To perform the scaling, the size of images for each class is calculated and then resized using the proposed algorithm according to the inputs of DCNN pre-trained models.
Two different pre-trained deep CNN features are used to extract and perform activation on FC layers. This activation on the FC layer extracts deep features, which are later tuned by max-pooling to remove the features causing the noise. The features obtained after max-pooling, are fused into a vector and selection of best features is performed. The best features are selected by employing Entropy on a fused vector.
As of now, image preprocessing methods are generally utilized as methods for diagnosing various illnesses, including eye infections, skin cancer [19,20], brain tumor [21,22], lung cancer [23], stomach infections [24,25], COVID19 [26,27], and name a few more [28,29]. PC based imaging instruments are important to distinguish indications of diabetic retinopathy adequately. Early identification would enable the ophthalmologist to treat patients before significant harm happens and would display the most obvious opportunity to ensure thepatient's vision. The automated diabetic retinopathy evaluation framework would permit a quicker and effective analysis. Preventive moves could be made right on time to stay away from visual deficiency [30].
Currently, Diabetic retinopathy screening is a typical research region. A few specialists centre around finding and proposing few procedures or strategies for distinguishing certain highlights of diabetic retinopathy (i.e., microaneurysms, haemorrhages, exudates, and Neovascularisation). Some scientists proposed the improvement of robotized frameworks for distinguishing and ordering typical or strange diabetic retinopathy [31].
Order based DR identification techniques are comprised of picture handling, design acknowledgement, machine learning and measurable strategies to review the DR from computerized fundus pictures, as indicated by a standard evaluation convention for DR. The current programmed DR evaluating strategies are clarified beneath the multilayer neural system strategy was utilized to arrange standard retinal pictures and different phases of DR pictures [32] and this framework produces 80.21% affectability and 70.66% particularity. As far as particularity, it was a noteworthy accomplishment. 81.7% exactness was accomplished on the serious and PDR phases of DR pictures [33]. As it may, these techniques did not characterize the DR pictures influenced by excess of one variation from the norm [34]. Afterwards, the mechanized finding of NPDR dependent on three injuries (haemorrhages, microaneurysms, complex and delicate exudates) was proposed by Derwin [35]. This strategy creates a precision of 81.7% at NPDR organize; however its execution should be approved on different stages. Koh et al. [36] proposed another early identification framework for DR, utilizing DR pictures’ characterisation into the distinctive phases of the ailment. The feed-forward neural system was utilized to discover sickness advance. This technique accomplishes an affectability of 90% and a particularity of 100% with an exactness of 84%. Nayak et al. [37] built up another technique to recognize DR stages. Abramoff et al. [38] proposed a programmed DR framework location dependent on KNN characterization of injury pixels. The proposed calculation gave the affectability of 90% and a particularity of 54.1%. A programmed calculation actualized to identify the DR depended on identifying various kinds of pathologies [39,40].
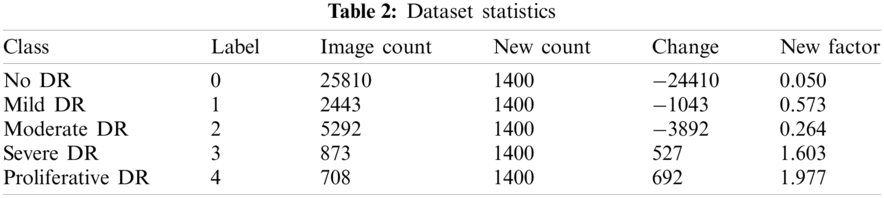
The first dataset utilized in this work was obtained from Kaggle, where the California Healthcare Foundation issued a test to make a program to distinguish diabetic retinopathy. This test involves a dataset of high-goals retina pictures taken under an assortment of imaging conditions with 35126 preparing pictures. For comments, the dataset has the pictures ordered in five gatherings (0, 1, 2, 3, 4), contingent upon the illness’ seriousness. Level 0 contains pictures without any indications of retinopathy, while level 4 pictures demonstrate propelled manifestations. The size of every one of the degrees of DR relates to no DR, mellow, moderate, severe and proliferative, from 0 to 4, respectively. The preparation set is unbalanced as listed in Tab. 2, with 25810 dimension 0 pictures, 2443 for label 1, 5292 of label 2, 873 in label 3, and 708 in label 4. We held a fair arrangement of 1560 pictures for approval from this database, and the rest were utilized for preparing. Note that the database contains testing pictures with low quality (poor lighting and unfocused), which makes it troublesome for any calculation to arrange them accurately in the ailment phases. Tab. 1 illustrates the overall structure of a dataset.
In this research a technique based on the combination of distinctive strategies is proposed for diabetic retinopathy arrangement. The main advancement of this proposed technique depends on recognising diabetic retinopathy (either typical or with retinopathy present). Framework investigated and actualized some essential image preprocessing strategies utilized for further advancements of the DR framework. Rahim and others (2014) announced the improvement of such a programmed screening and characterization of diabetic retinopathy fundus pictures in detail while investigating the current frameworks and applications identified with diabetic retinopathy screening and location techniques. The proposed work makes advances in various stages of the procedure for diabetic retinopathy characterization, including conquering data imbalance issue, pre-processing, image scaling, feature extraction, features fusion, and feature selection. The stream of this examination thinks about is appeared in Fig. 3.
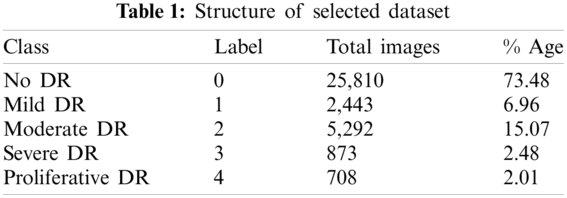
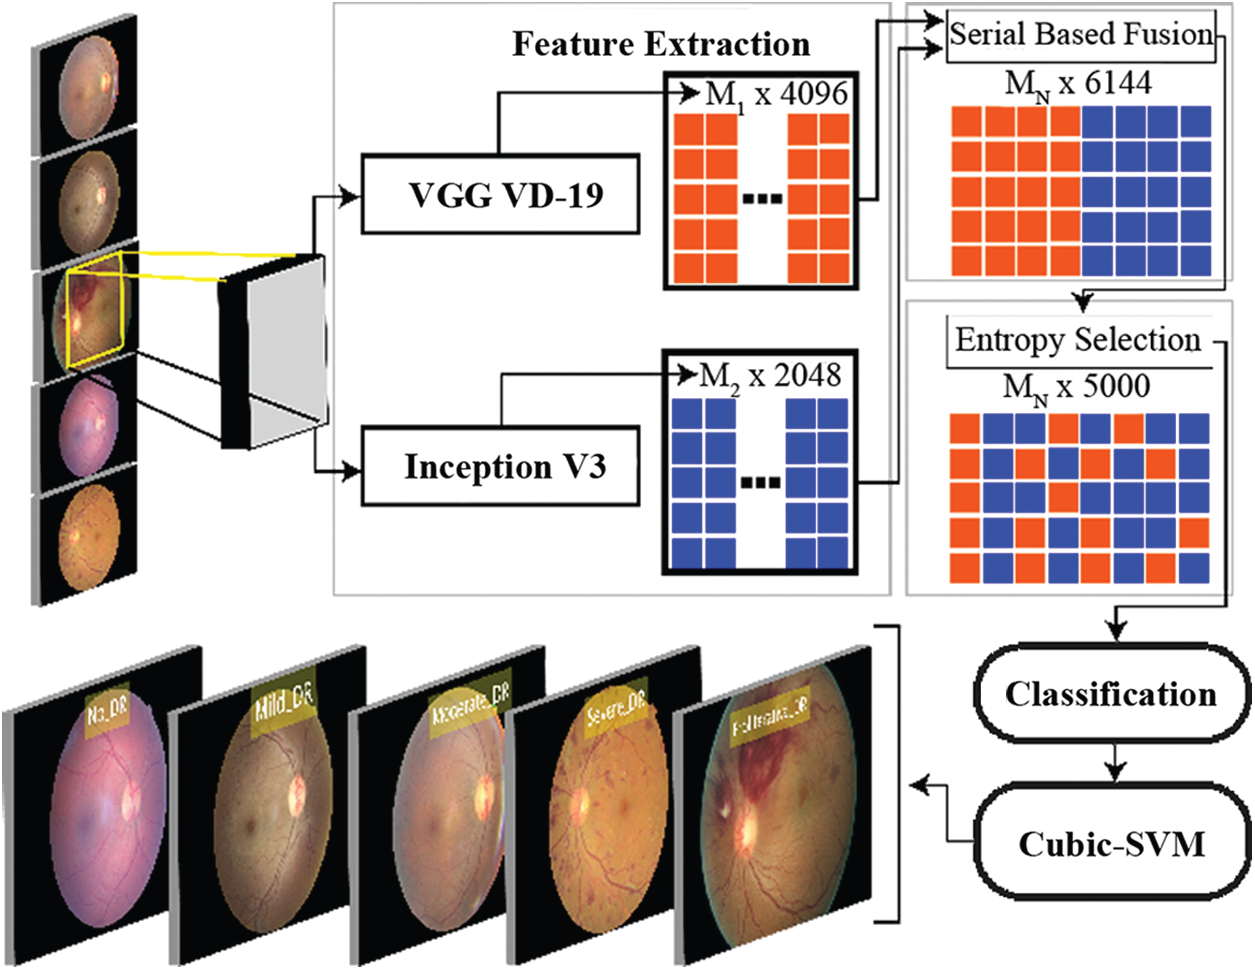
Figure 3: Overview of the proposed methodology
The first preprocessing strategy is to convert a fundus image into an RGB image, as an RGB image is generally a superior arrangement for image preprocessing. An RGB image has pixel values of solitary esteem; to be specific, its power data. It is otherwise called a “highly contrasting” image. Adaptive Histogram Equalization is a PC image handling method for enhancing the complexity of an image. The contrast between the versatile histogram evening out and the normal histogram leveling is that the versatile histogram adjustment registers a few histograms for various image segments, thus circulating the delicacy esteems. This procedure is utilized to enhance neighbourhood difference and upgrade more points of interest in the image. Consequently, the Contrast Limited Adaptive Histogram Equalization (CLAHE) is utilized in the proposed framework with the end goal to keep the over enhancement of commotion.
Advanced Image scaling is a method for resizing a computerized image, including an exchange between productivity, smoothness, and sharpness. An image addition calculation is utilized to change over an image, starting with one goal then onto the next goals without losing an image’s substance. Image interjection calculations is gathered in two classifications, non-versatile and versatile [41]. In non-versatile calculations, the computational rationale is settled regardless of the info of image features. In contrast, in versatile calculations, computational rationale relies upon the inborn image features and substance of the information image [42].
3.3 Convolutional Neural Network (CNN)
In the field of computer vision, CNNs have been an influential addition. In 2012, Alex Krizhevsky won the ImageNet competition by using the CNNs and classification error was reduced from 26% to 15%. This was an outstanding improvement at that time. CNN’s were used at the root level for many well-known organizations after that achievement. These networks are commonly used to solve the problems related to digital image processing. An input image is processed and assigned to single or multiple related class or classes. Humans can do this task easily as this is the first skill which is learned by a new-born. Computers see an input image as a matrix of pixels that depends on the size and resolution of image. CNNs take an input image and forward it to multiple layers, such as convolutional, non-linear, fully-connected, and pooling to get an output. Activation maps are generated by merging non-linearity layers, ReLU layers and pooling layers to represent each class which is the main goal of FC layer. With only one exception to the input layer, a fully connected layer operates identically to the layers of a multilayer perceptron.
Pretrained CNN Models: In computer vision, transfer learning is usually expressed through pre-trained models. Accordingly, due to the computational cost of training such models, it is common practice to import and use models from published literature (e.g., VGG, Inception, MobileNet).
InceptionV3: This engineering was presented as an enhanced adaptation of the ILSVRC-2014 arrangement assignment champ, the GoogLeNet. The system was intended to decrease the computational expense while enhancing the characterization precision with the goal that vision-related applications can also be versatility ported with it. It achieves 22.0% best 1 and 6.1% best 5 mistake ratios on the ILSVRC-2012 characterization [43]. The structure of the AlexNet is depicted in Fig. 4.
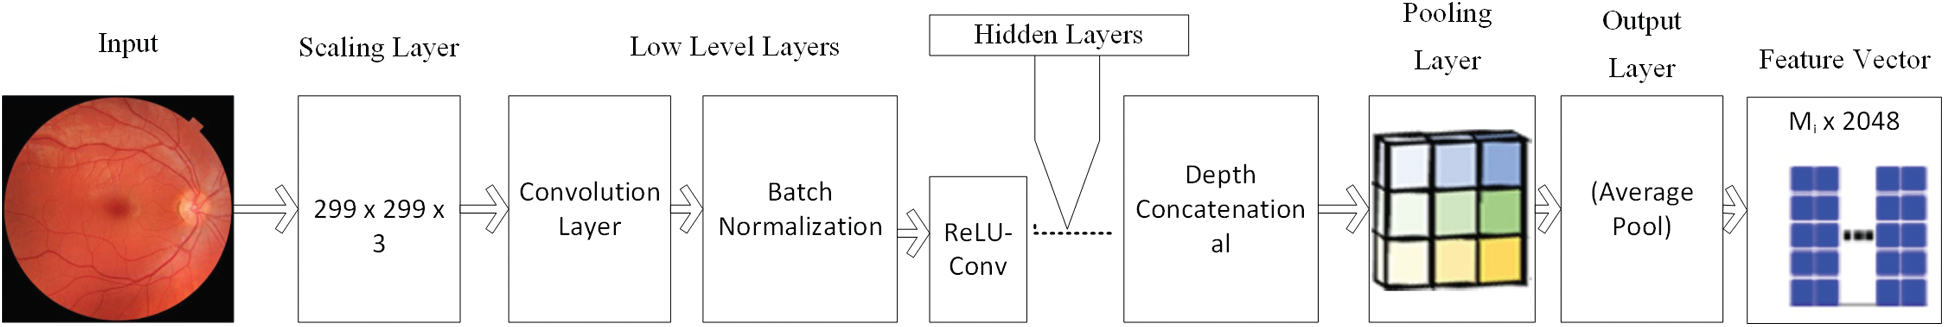
Figure 4: Structure of InceptionV3 model
VGG: CNNs have been broadly connected in pre-trained models, for example, VGG-16. VGG-16 demonstrates 13 convolutional layers, five pooling layers and three full association layers as shown in Fig. 5. VGG-16 has two sections, include extractor and classifier [44]. The extractor can move an image into a vector, which can be connected to various classifiers. The benefit of VGG-16 is that it accomplishes high exactness and high strength; however, the time cost is high, and it also requires massive amount of data for prepration. If the amount of our preparation images isn't sufficiently huge or preparing time is an extravagance, utilizing this incredible profound learning device may not be savvy. In our element combination calculation, we get the image highlight vector before the last full association layer, a vector of length 4096. This is a gullible image highlight, and it may not perform well while being utilized for classifier preparing straightforwardly. So, this vector is just a piece of our last combination vector, and it will be withdrawn later.
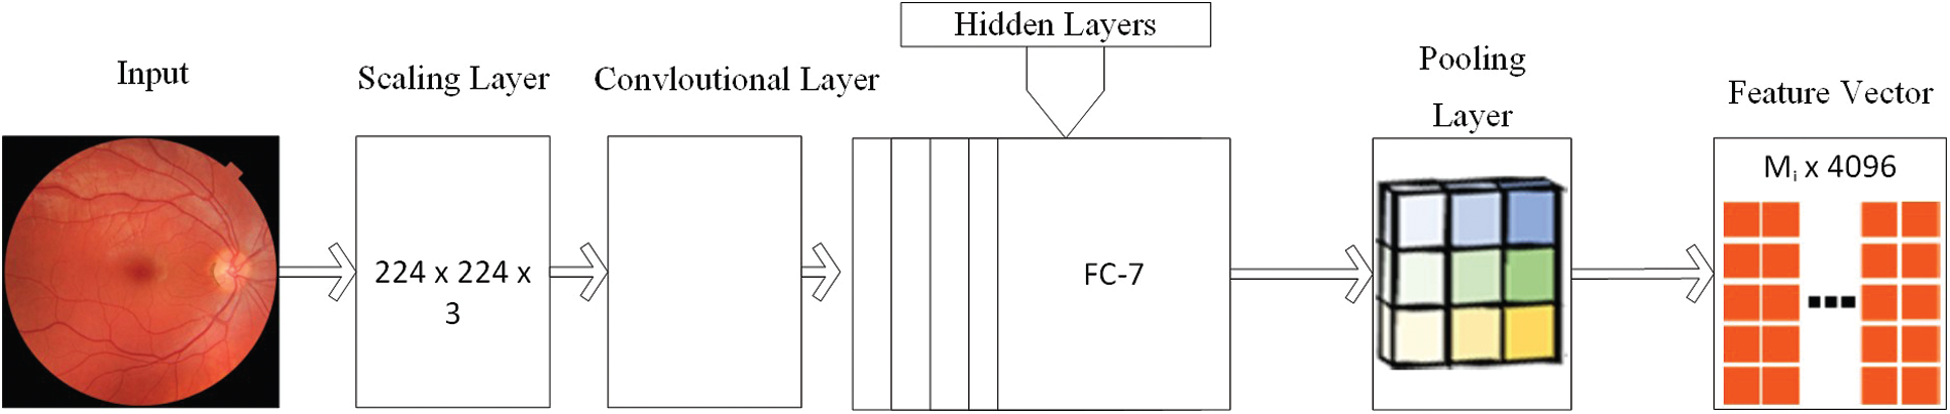
Figure 5: Structure of VGG model
For any issue space of grouping or acknowledgement, a solitary methodology-based component does not have the capacity of taking care of the wide changeability of image insights. Subsequently, present-day order systems join different features, whereby enhancing the exactness is the primary target. Notwithstanding, the features should be changed into a summed-up highlight space since m unmistakable component extractors can produce m distinctive portrayals with differing measurements and spaces as:
where i = 1, 2, · · ·, D0 is the total number of images in the dataset and F(-) is the image database. Individual features are normalized as:
The following equation defines the concatenation, which is further refined through the product, summation, average pooling, and max pooling.
where FFV is the feature vector generated after performing the series of steps–as mentioned in Eqs. (4)–(8). Among the previously mentioned highlight combination techniques, the valuable one ought to refute an element’s impact, which does not give class detachability prompts and upgrade the wealth of the intertwined highlight subspace. In a few cases, accepted relationship investigation-based strategies are utilized for joint dimensionality decrease in the element space change [45]. All things being equal, how to intertwine multi-modular portrayals generalized to accomplish the best execution, is an open issue.
The feature choice is regularly utilized as a preprocessing venture before building models for an order. The point of feature choice is to expel the insignificant and excess features so that the enlistment calculations can create better expectation correctness’s with more succinct models and better effectiveness. The redundant features will, in general, offer zero or little MI with the class trait within sight of clamour. In this manner, the unimportant features can be dispensed by picking those features with generally substantial MI with the class characteristic in displaying process. Specifically, our method uses the following criterion:
whereas,
4 Experimental Results and Discussion
In this section, proposed experimental results are presented in the form of numerical and graphical plots. The proposed method was validated on Kaggle dataset, which contains 5 different classes. The original dataset contained imbalanced. The processed dataset contains 1400 images per class. The classes in the selected dataset are No DR, Mild DR, Moderate DR, Severe DR and Proliferative DR. To test the performance of proposed method, seven (7) classification methods, including Cubic SVM (C-SVM), Ensemble Subspace Discriminant (ESD), Fine KNN (F-KNN), Weighted KNN (W-KNN), Ensemble Subspace KNN (ES-KNN), Quadratic SVM (Q-SVM) and Linear Discriminant (LD). The performance of each classification method is measured by five statistical measures such as Sensitivity, Precision, AUC, FNR and Accuracy. Moreover, the execution time of each classifier is noted to make the system more efficient. All simulations are performed on MATLAB 2018a using core i7 with 16 GB RAM and 256 GB SSD.
The Kaggle dataset contains 35,126 planning pictures assessed into five DRP stages and 53,576 test pictures with undisclosed DRP sort out. Pictures were picked up using different fundus cameras and various field of view. Experiences about picture anchoring, for instance, camera make and field out of view, are not revealed. More data about the data can be found in the test site. A subset comprising of 7000 images was chosen from the Kaggle preparing set. We chose a subset from the first dataset. This subset comprises 1400 arbitrarily chosen images from DRP arranging 0 (ordinary), 1400 haphazardly chosen images from each DRP organize. Images on which the retina was not obvious were excluded in this examination dataset. The chosen 6,679 images were additionally part into a settled preparing, observing and test set by 80:20 split. Images from a similar patient were kept in a similar subset. Tab. 2 demonstrates the chose rate. We utilized 80% for preparing and 20% for testing. 10 cross crease approval was performed in tests.
Results of proposed method are computed using 4 different experiments. In the first and second experiment, classification results are obtained by extracting the features from pre-trained deep CNN models like VGG19 and InceptionV3. In the third experiment, fusion strategy is performed, which was later improved in Experiment 4by selection of best features. Summary of each experiment is presented in Tab. 3.
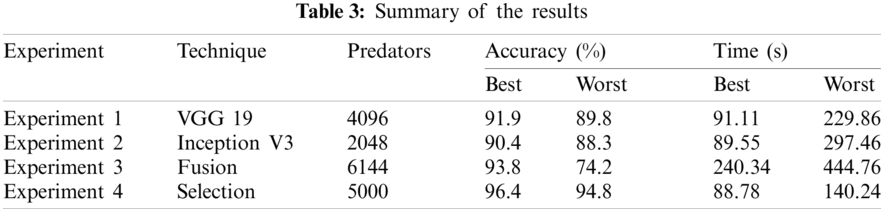
Here we will only discuss our proposed technique which is Experiment #4, in Tab. 3, features extracted by fusion in Experiment #3 are reduced by applying Entropy Based Selection. After that, the new feature vector was sorted in descending order to get the best features to start with. This new feature vector is then forwarded to obtain the classification results. All testing results are obtained using 10-fold cross validation. During this experiment, best testing classification accuracy for selected feature vector was recorded at 96.4%, FNR 3.6%, AuC 99.80%, Precision Rate 96.4% and Sensitivity of 96.4% on C-SVM. Classification results of C-SVM are compared with nine (9) other classifiers in Tab. 4. Classification accuracy of Cubic SVM is confirmed by the confusion matrix in Fig. 6. Second highest accuracy of 96.0% with Sensitivity rate of 96.0% and execution time of 23.584 s was achieved on F-KNN. Moreover, execution time of each classifier is also computed and shown in the table. Best execution time of 88.787 seconds was recorded for C-SVM and worst execution time of 140.24 s was recorded by ESD with accuracy of 95.6%. The graphical representation of selected classification methods is shown in Fig. 7. Execution time is also compared in Fig. 8. The above results show that the Cubic SVM performed well for fused feature vector.
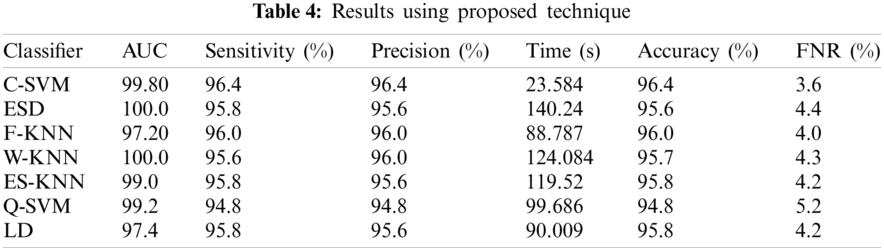
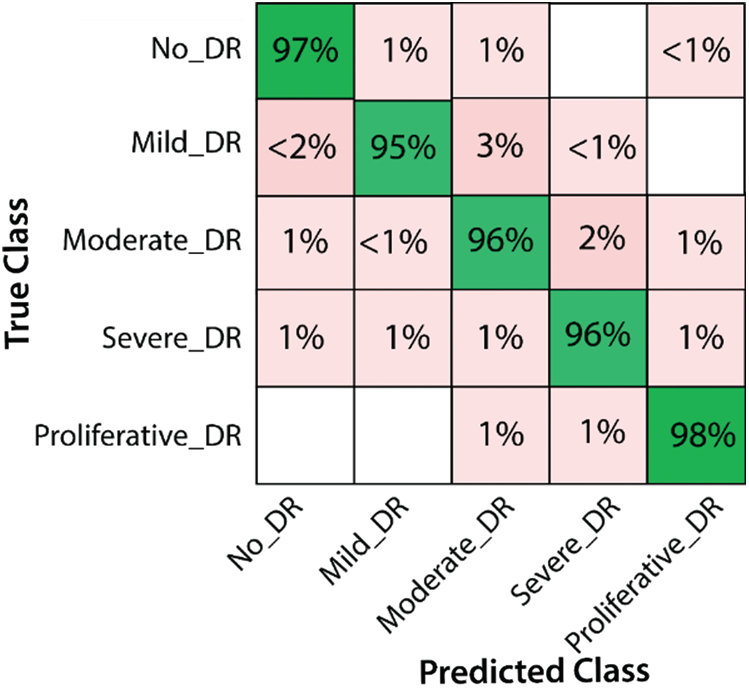
Figure 6: Confusion Matrix for results of proposed features
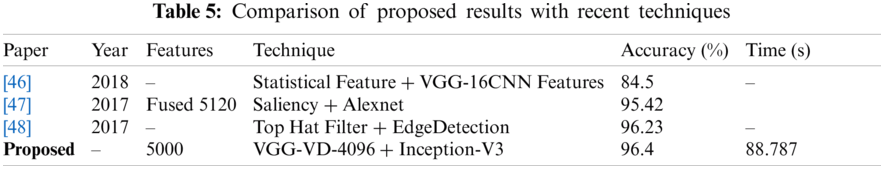
In this research, a hybrid approach to classifying diabetic retinopathy using deep convolutional neural networks is proposed consisting of steps like data selection, image scaling, feature extraction, feature fusion and feature selection. The overall structure of the proposed method is shown in Fig. 3. The training set is highly unbalanced, as shown in Tab. 1 and Fig. 3, with 25810 label 0 images, 2443 for label 15292 of label 2,873 in label 3, and 708 in label 4. To allow training and optimization of large-capacity models, we split the data into training and validation. We reserved a balanced set of 1560 images for validation from this database, and the rest were used for training. After that, data normalization was performed, which mainly resized the dataset images according to pre-trained models' size. The proposed model was tested on Kaggle Dataset using pre-trained models, InceptionV3 and VGG19. The structure of both pre-trained models, InceptionV3 and VGG19, are shown in Figs. 4 and 5, respectively. Pre-trained models provide the feature vectors, which were later fused into a standalone vector. At the end, the best features were selected by applying the max-pooling and Entropy-based selection technique. The feature vector containing the best features was classified using the ten (10) classifiers. Four (4) experiments were used to test the accuracy of the proposed method on Kaggle Dataset. In the first three (3) experiments, simple activations were performed on pre-trained models. In Experiment 4, activations were performed on the fused feature vector improved in Experiment 5 by only selecting the best features. Among those classifiers, Cubic SVM gave the highest accuracy of 96.4%. The comparison is conducted with recent techniques as listed in Tab. 5.
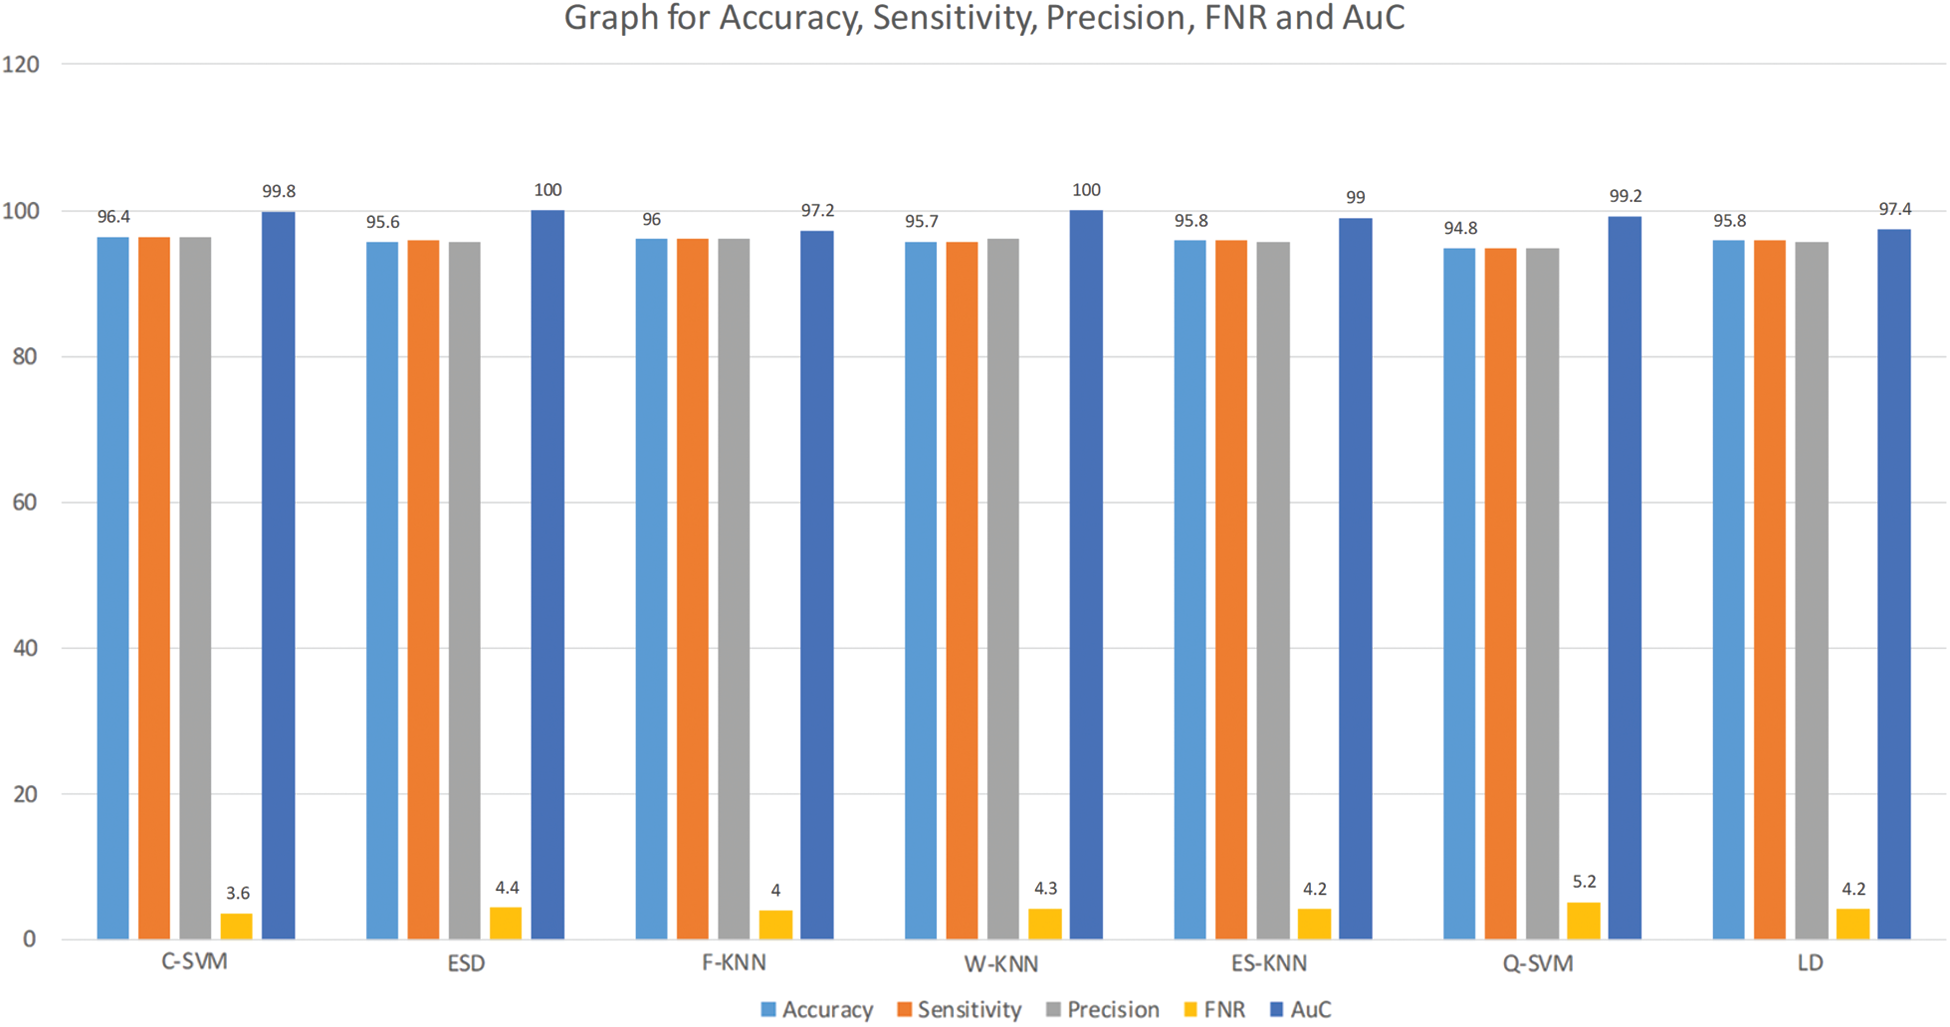
Figure 7: Graph for accuracy, sensitivity, precision, FNR and AuC for selected features
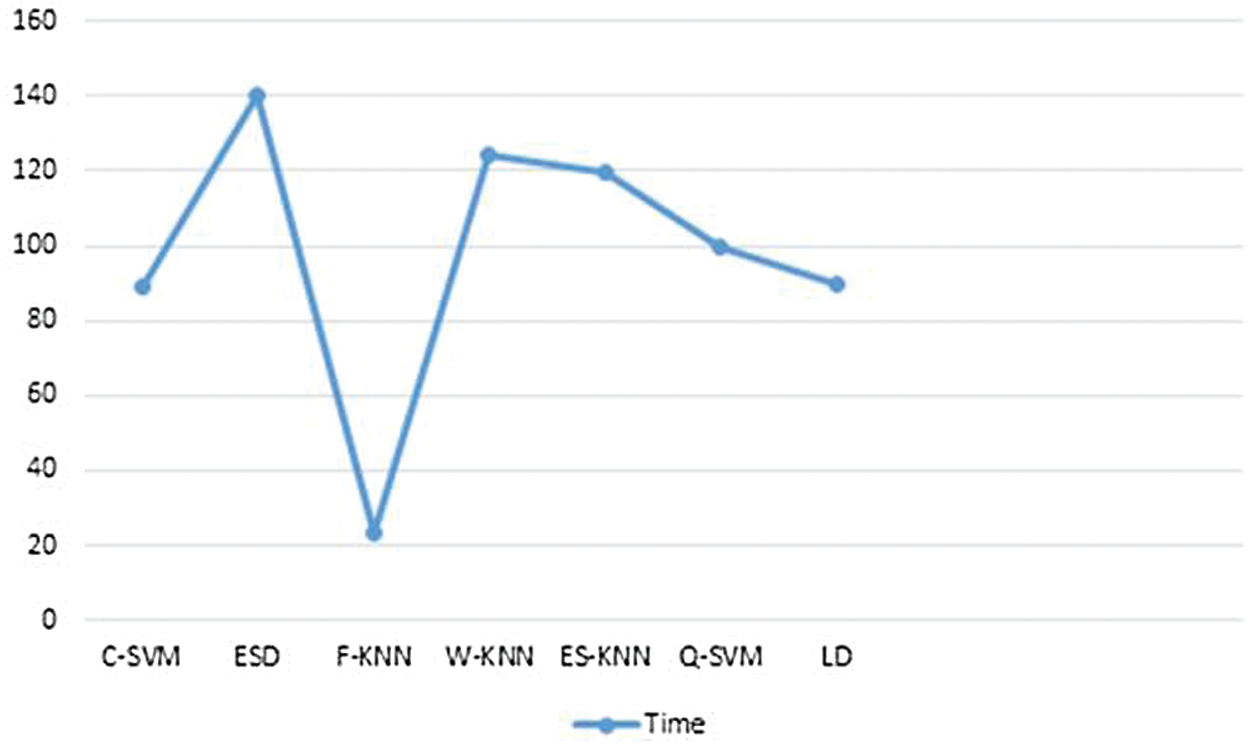
Figure 8: Training time comparison for classifiers on selected features
A model is proposed to characterise DR stages depending on the seriousness of utilizing shading fundus images. The execution of the model is surveyed utilizing diverse measurements. Considering the heterogeneity of the dataset, the execution of the proposed model is acceptable. The precision of the model can be expanded by utilizing other complex denoising methods. Consolidating test mistakes amid image catch will be helpful in growing more effective standardization strategies. Previous techniques have been discussed in literature of this problem, including Image Preprocessing, Classification, Abnormalities Detection, Microaneurysm and Haemorrhage Detection, Exudate Detection, Retinal Vessels Extractions and Pattern recognition retinal vessels extraction techniques. All these techniques are presented. A hybrid approach is proposed, which uses deep convolution neural networks for pre-trained networks like InceptionV3 and VGG19. The result of these pre-trained models is then fused using feature fusion, and at the end, a feature selection technique has been applied to select the best features. These classification results prove the efficiency of the proposed technique in term of accuracy, FNR, AuC and execution time. The selection of features is a limitation of this work because features are selected without any fitness function.
Funding Statement: This work was supported by the National Research Foundation of Korea (NRF) grant funded by the Korea government (MSIT) (No. NRF-2021R1A2C1010362) and the Soonchunhyang University Research Fund.
Conflicts of Interest: The authors declare that they have no conflicts of interest to report regarding the present study.
1. J. D. Cavallerano, L. P. Aiello, A. A. Cavallerano, P. Katalinic, K. Hock et al., “Nonmydriatic digital imaging alternative for annual retinal examination in persons with previously documented no or mild diabetic retinopathy,” American Journal of Ophthalmology, vol. 140, no. 4, pp. 667, 2005. [Google Scholar]
2. G. S. Scotland, P. McNamee, A. D. Fleming, K. A. Goatman, S. Philip et al., “Costs and consequences of automated algorithms vs. manual grading for the detection of referable diabetic retinopathy,” British Journal of Ophthalmology, vol. 94, no. 6, pp. 712–719, 2010. [Google Scholar]
3. A. Vidyarthi, “Multi-scale dyadic filter modulation based enhancement and classification of medical images,” Multimedia Tools and Applications, vol. 79, no. 37–38, pp. 28105–28129, 2020. [Google Scholar]
4. A. Chu, D. Squirrell, A. M. Phillips and E. Vaghefi, “Essentials of a robust deep learning system for diabetic retinopathy screening: A systematic literature review,” Journal of Ophthalmology, vol. 20, no. 7160, pp. 1–11, 2020. [Google Scholar]
5. D. Vojta, T. B. Koehler, M. Longjohn, J. A. Lever and N. F. Caputo, “A coordinated national model for diabetes prevention: Linking health systems to an evidence-based community program,” American Journal of Preventive Medicine, vol. 44, no. 4, pp. S301–S306, 2013. [Google Scholar]
6. J. Gillow and J. M. Gray, “The national screening committee review of diabetic retinopathy screening,” Eye, vol. 15, no. 1, pp. 1–2, 2001. [Google Scholar]
7. C. Maylahn, D. M. Gohdes, A. Balamurugan and B. A. Larsen, “Peer reviewed: Age-related eye diseases: An emerging challenge for public health professionals,” Preventing Chronic Disease, vol. 2, pp. 1–6, 2005. [Google Scholar]
8. A. D. Association, “Standards of medical care in diabetes—2013,” Diabetes Care, vol. 36, no. Supplement_1, pp. S11–S66, 2013. [Google Scholar]
9. E.-Y. Park, J. Baik, H. Kim, S.-M. Park and C. Kim, “Ultrasound-modulated optical glucose sensing using a 1645 nm laser,” Scientific Reports, vol. 10, no. 1, pp. 1–9, 2020. [Google Scholar]
10. K. S. Yadav, R. Rajpurohit and S. Sharma, “Glaucoma: Current treatment and impact of advanced drug delivery systems,” Life Sciences, vol. 221, pp. 362–376, 2019. [Google Scholar]
11. S. K. Wagner, D. J. Fu, L. Faes, X. Liu, J. Huemer et al., “Insights into systemic disease through retinal imaging-based oculomics,” Translational Vision Science & Technology, vol. 9, no. 2, pp. 6, 2020. [Google Scholar]
12. P. M. Seferović, A. J. Coats, P. Ponikowski, G. Filippatos, M. Huelsmann et al., “European society of cardiology/heart failure association position paper on the role and safety of new glucose-lowering drugs in patients with heart failure,” European Journal of Heart Failure, vol. 22, no. 2, pp. 196–213, 2020. [Google Scholar]
13. N. Hill, D. Michell, M. Ramirez-Solano, Q. Sheng, C. Pusey et al., “Glomerular endothelial derived vesicles mediate podocyte dysfunction: A potential role for miRNA,” PloS One, vol. 15, no. 3, pp. e0224852, 2020. [Google Scholar]
14. S. S. Soedamah-Muthu, J. H. Fuller, H. E. Mulnier, V. S. Raleigh and R. A. Lawrenson, “High risk of cardiovascular disease in patients with type 1 diabetes in the UK: A cohort study using the general practice research database,” Diabetes Care, vol. 29, no. 4, pp. 798–804, 2006. [Google Scholar]
15. P. Porwal, S. Pachade, R. Kamble, M. Kokare, G. Deshmukh et al., “Indian diabetic retinopathy image dataset (IDRiDA database for diabetic retinopathy screening research,” Data, vol. 3, no. 3, pp. 25, 2018. [Google Scholar]
16. F. Orujov, R. Maskeliūnas, R. Damaševičius and W. Wei, “Fuzzy based image edge detection algorithm for blood vessel detection in retinal images,” Applied Soft Computing, vol. 94, no. 1, pp. 106452, 2020. [Google Scholar]
17. L. Giancardo, F. Meriaudeau, T. P. Karnowski, K. W. Tobin, E. Grisan et al., “Textureless macula swelling detection with multiple retinal fundus images,” IEEE Transactions on Biomedical Engineering, vol. 58, no. 3, pp. 795–799, 2010. [Google Scholar]
18. X. D. Chen and T. W. Gardner, “A critical review: Psychophysical assessments of diabetic retinopathy,” Survey of Ophthalmology, vol. 7, pp. 1–21, 2020. [Google Scholar]
19. Y.-D. Zhang, M. Sharif and T. Akram, “Pixels to classes: Intelligent learning framework for multiclass skin lesion localization and classification,” Computers & Electrical Engineering, vol. 90, pp. 106956, 2021. [Google Scholar]
20. M. A. Khan, T. Akram, Y.-D. Zhang and M. Sharif, “Attributes based skin lesion detection and recognition: A mask RCNN and transfer learning-based deep learning framework,” Pattern Recognition Letters, vol. 143, pp. 58–66, 2021. [Google Scholar]
21. A. Rehman, T. Saba, Z. Mehmood, U. Tariq and N. Ayesha, “Microscopic brain tumor detection and classification using 3D CNN and feature selection architecture,” Microscopy Research and Technique, vol. 84, no. 1, pp. 133–149, 2021. [Google Scholar]
22. I. Ashraf, M. Alhaisoni, R. Damaševičius, R. Scherer and A. Rehman, “Multimodal brain tumor classification using deep learning and robust feature selection: A machine learning application for radiologists,” Diagnostics, vol. 10, pp. 565, 2020. [Google Scholar]
23. M. A. Khan, S. Rubab, A. Kashif, M. I. Sharif, N. Muhammad et al., “Lungs cancer classification from CT images: An integrated design of contrast based classical features fusion and selection,” Pattern Recognition Letters, vol. 129, pp. 77–85, 2020. [Google Scholar]
24. M. S. Sarfraz, M. Alhaisoni, A. A. Albesher, S. Wang and I. Ashraf, “StomachNet: Optimal deep learning features fusion for stomach abnormalities classification,” IEEE Access, vol. 8, pp. 197969–197981, 2020. [Google Scholar]
25. M. A. Khan, S. Kadry, M. Alhaisoni, Y. Nam, Y. Zhang et al., “Computer-aided gastrointestinal diseases analysis from wireless capsule endoscopy: A framework of best features selection,” IEEE Access, vol. 8, pp. 132850–132859, 2020. [Google Scholar]
26. T. Akram, M. Attique, S. Gul, A. Shahzad, M. Altaf et al., “A novel framework for rapid diagnosis of COVID-19 on computed tomography scans,” Pattern Analysis and Applications, vol. 8, pp. 1–14, 2021. [Google Scholar]
27. H. T. Rauf, M. I. U. Lali, S. Kadry, H. Alolaiyan, A. Raza et al., “Time series forecasting of COVID-19 transmission in Asia Pacific countries using deep neural networks,” Personal and Ubiquitous Computing, vol. 2, pp. 1–18, 2021. [Google Scholar]
28. M. Qasim, H. M. J. Lodhi, M. Nazir, K. Javed, S. Rubab et al., “Automated design for recognition of blood cells diseases from hematopathology using classical features selection and ELM,” Microscopy Research and Technique, vol. 84, no. 2, pp. 202–216, 2021. [Google Scholar]
29. M. I. Sharif, J. P. Li and M. A. Saleem, “Active deep neural network features selection for segmentation and recognition of brain tumors using MRI images,” Pattern Recognition Letters, vol. 129, no. 10, pp. 181–189, 2020. [Google Scholar]
30. G. T. Zago, R. V. Andreão, B. Dorizzi and E. O. T. Salles, “Diabetic retinopathy detection using red lesion localization and convolutional neural networks,” Computers in Biology and Medicine, vol. 116, no. Pt 2, pp. 103537, 2020. [Google Scholar]
31. R. E. Hacisoftaoglu, M. Karakaya and A. B. Sallam, “Deep learning frameworks for diabetic retinopathy detection with smartphone-based retinal imaging systems,” Pattern Recognition Letters, vol. 135, no. 4, pp. 409–417, 2020. [Google Scholar]
32. H. Wu, S. Zhao, X. Zhang, A. Sang, J. Dong et al., “Back-propagation artificial neural network for early diabetic retinopathy detection based on a priori knowledge,” in Journal of Physics: Conference Series, NY, USA, pp. 12019, 2019. [Google Scholar]
33. O. Faust, R. Acharya, E. Y.-K. Ng, K.-H. Ng and J. S. Suri, “Algorithms for the automated detection of diabetic retinopathy using digital fundus images: A review,” Journal of Medical Systems, vol. 36, no. 1, pp. 145–157, 2012. [Google Scholar]
34. A. K. Gangwar and V. Ravi, “Diabetic retinopathy detection using transfer learning and deep learning,” in Evolution in Computational Intelligence. Cham: Springer, pp. 679–689, 2020. [Google Scholar]
35. D. J. Derwin, S. T. Selvi and O. J. Singh, “Discrimination of microaneurysm in color retinal images using texture descriptors,” Signal, Image and Video Processing, vol. 14, no. 2, pp. 369–376, 2020. [Google Scholar]
36. B. M. Q. R. Koh, R. Banu and C. Sabanayagam, “The 100 most cited articles in ophthalmology in Asia,” The Asia-Pacific Journal of Ophthalmology, vol. 9, no. 5, pp. 379–397, 2020. [Google Scholar]
37. J. Nayak, R. Acharya, P. S. Bhat, N. Shetty and T.-C. Lim, “Automated diagnosis of glaucoma using digital fundus images,” Journal of Medical Systems, vol. 33, no. 5, pp. 337–346, 2009. [Google Scholar]
38. M. D. Abràmoff, J. M. Reinhardt, S. R. Russell, J. C. Folk, V. B. Mahajan et al., “Automated early detection of diabetic retinopathy,” Ophthalmology, vol. 117, no. 6, pp. 1147–1154, 2010. [Google Scholar]
39. A. A. Tehrani, A. M. Nickfarjam, H. Ebrahimpour-komleh and D. Aghadoost, “Multi-input 2-dimensional deep belief network: Diabetic retinopathy grading as case study,” Multimedia Tools and Applications, vol. 9, pp. 1–16, 2020. [Google Scholar]
40. S. S. Rahim, V. Palade, J. Shuttleworth and C. Jayne, “Automatic screening and classification of diabetic retinopathy and maculopathy using fuzzy image processing,” Brain Informatics, vol. 3, no. 4, pp. 249–267, 2016. [Google Scholar]
41. J. Hurtado, A. Montenegro, M. Gattass, F. Carvalho and A. Raposo, “Enveloping CAD models for visualization and interaction in XR applications,” Engineering with Computers, vol. 18, pp. 1–19, 2020. [Google Scholar]
42. F. Boukouvala, M. F. Hasan and C. A. Floudas, “Global optimization of general constrained grey-box models: New method and its application to constrained PDEs for pressure swing adsorption,” Journal of Global Optimization, vol. 67, no. 1–2, pp. 3–42, 2017. [Google Scholar]
43. C. Szegedy, W. Liu, Y. Jia, P. Sermanet, S. Reed et al., “Going deeper with convolutions,” in Proc. of the IEEE Conf. on Computer Vision and Pattern Recognition, NY, USA, pp. 1–9, 2015. [Google Scholar]
44. A. Sharif Razavian, H. Azizpour, J. Sullivan and S. Carlsson, “CNN features off-the-shelf: An astounding baseline for recognition,” in Proc. of the IEEE Conf. on Computer Vision and Pattern Recognition Workshops, Las Vegas, Nevada, pp. 806–813, 2014. [Google Scholar]
45. S. Stolte and R. Fang, “A survey on medical image analysis in diabetic retinopathy,” Medical Image Analysis, vol. 64, no. 2, pp. 101742, 2020. [Google Scholar]
46. S. Dutta, B. Manideep, S. M. Basha, R. D. Caytiles and N. Iyengar, “Classification of diabetic retinopathy images by using deep learning models,” International Journal of Grid and Distributed Computing, vol. 11, no. 1, pp. 89–106, 2018. [Google Scholar]
47. F. Yu, J. Sun, A. Li, J. Cheng, C. Wan et al., “Image quality classification for DR screening using deep learning,” in 2017 39th Annual Int. Conf. of the IEEE Engineering in Medicine and Biology Society, NY, USA, pp. 664–667, 2017. [Google Scholar]
48. A. Roy, D. Dutta, P. Bhattacharya and S. Choudhury, “Filter and fuzzy c means based feature extraction and classification of diabetic retinopathy using support vector machines,” in 2017 Int. Conf. on Communication and Signal Processing, Kottayam, India, pp. 1844–1848, 2017. [Google Scholar]
 | This work is licensed under a Creative Commons Attribution 4.0 International License, which permits unrestricted use, distribution, and reproduction in any medium, provided the original work is properly cited. |