DOI:10.32604/cmc.2021.019876
| Computers, Materials & Continua DOI:10.32604/cmc.2021.019876 | |
| Article |
Optimal Deep Dense Convolutional Neural Network Based Classification Model for COVID-19 Disease
1Department of Computer Science and Engineering, St. Joseph's College of Engineering, 600119, Chennai, India
2Department of Computer Science and Engineering, KPR Institute of Engineering and Technology, Coimbatore, 641407, India
3Faculty of Engineering, Karpagam Academy of Higher Education, Coimbatore, 641021, India
4Faculty of Applied Computing and Technology, Noroff University College, Kristiansand, 4608, Norway
5Research Group of Embedded Systems and Mobile Application in Health Science, College of Arts, Media and Technology, Chiang Mai University, Chiang Mai, 50200, Thailand
*Corresponding Author: Orawit Thinnukool. Email: orawit.t@cmu.ac.th
Received: 29 April 2021; Accepted: 08 June 2021
Abstract: Early diagnosis and detection are important tasks in controlling the spread of COVID-19. A number of Deep Learning techniques has been established by researchers to detect the presence of COVID-19 using CT scan images and X-rays. However, these methods suffer from biased results and inaccurate detection of the disease. So, the current research article developed Oppositional-based Chimp Optimization Algorithm and Deep Dense Convolutional Neural Network (OCOA-DDCNN) for COVID-19 prediction using CT images in IoT environment. The proposed methodology works on the basis of two stages such as pre-processing and prediction. Initially, CT scan images generated from prospective COVID-19 are collected from open-source system using IoT devices. The collected images are then pre-processed using Gaussian filter. Gaussian filter can be utilized in the removal of unwanted noise from the collected CT scan images. Afterwards, the pre-processed images are sent to prediction phase. In this phase, Deep Dense Convolutional Neural Network (DDCNN) is applied upon the pre-processed images. The proposed classifier is optimally designed with the consideration of Oppositional-based Chimp Optimization Algorithm (OCOA). This algorithm is utilized in the selection of optimal parameters for the proposed classifier. Finally, the proposed technique is used in the prediction of COVID-19 and classify the results as either COVID-19 or non-COVID-19. The projected method was implemented in MATLAB and the performances were evaluated through statistical measurements. The proposed method was contrasted with conventional techniques such as Convolutional Neural Network-Firefly Algorithm (CNN-FA), Emperor Penguin Optimization (CNN-EPO) respectively. The results established the supremacy of the proposed model.
Keywords: Deep learning; deep dense convolutional neural network; covid-19; CT images; chimp optimization algorithm
Coronavirus Disease (COVID-19) has significantly affected the economic growth of global nations for the past two years [1]. World Health Organization (WHO) declared COVID-19 as pandemic by 11th March 2020. Some of the countries that controlled the spread of COVID-19 successfully are France, Germany, New Zealand, Vietnam, South Korea, Taiwan, and so on. While, few countries such as Brazil, the USA, and India have been struggling to contain the virus for a considerable period of time. India had her strictest lockdown in the history starting from 25th March 2020 to 31st May 2020 to contain the spread of coronavirus. However, the government of India started unlocking the country in a phase by phase manner starting from 01st June 2020 to 31st August 2020 since it is not feasible for an emerging economy like India to manage her financial losses incurred due to lengthy lockdown [2]. Unlock-1 lasted between 1st June 2020 and 30th June 2020 followed by second unlock from 1st July 2020 to 31st July 2020 and third unlock between 1st August 2020 and 31st August 2020 [3].
When unlocking the country for its functioning, the Government of India laid down the regulations universally for both public and private organizations on how to restart business functioning, transportation, different social, religious and business happenings. To date, scientists have not been able to find a cure for COVID-19 [4]. Symptoms of the disease include mild-to-severe severity, sore throat, cough, sneezing, diarrhea, loss of smell and taste, breathlessness etc. Early detection of the disease can help in the isolation of patients on time and monitor their health. Machine-based approaches that analyze X-rays/CT scan images of the lungs can be used to diagnose patients with pneumonia, an adverse effect of COVID-19 infection. This machine-based approach can be used as a reliable alternative for COVID-19 detection tools. This is applicable especially in developing countries where large numbers of people are infected with virus and there is no accomplishment to diagnose an individual as either COVID-19 or non-COVID-19 [5].
Various methods have been proposed to detect the presence of COVID-19 from CT images. But these methods fail to achieve the best results in long-tailed distributions [6]. COVID-19 dataset may contain triplets-labeled instances that easily segregate the affected and non-affected individuals [7]. Similarly, some datasets have CT images without labels and pose difficulty in arriving at the results. Large datasets also difficult for these methods to identify the presence of COVID-19 from CT images. These drawbacks motivate the search for new techniques in deep learning and machine learning frameworks [8]. Machine learning techniques such as Artificial Neural Network (ANN) [9], Bayesian network and Support Vector Machine (SVM) are also used in the identification of COVID-19 from image datasets [10]. However, these machine learning techniques are not suitable for handling huge-sized image database. So, deep learning is preferred these days to identify the presence of COVID-19 from the images. Deep learning can manage huge databases for COVID-19 detection.
A number of deep learning techniques is available to identify the presence of COVID-19 from images such as Deep Neural Network (DNN) [11], Deep Belief Neural Network (DBNN) [12], in addition to CNN [13]. These deep learning techniques are used in many submissions. Among them, CNN is the most suitable technique for image processing applications especially for detection and recognition of the region-of-interest. But CNN may be affected by undefined structure during COVID-19 diagnosis from images. To enhance the performance of CNN structure, many optimization algorithms are utilized like Genetic Algorithm (GA) [14], Ant Lion Optimization (ALO), and Particle Swarm Optimization (PSO) [15]. Optimal hyperparameters are selected with the help of optimization algorithm. Every optimization algorithm may trap the convergence. Hence, novel deep learning with optimization method is required to enable the optimal detection of COVID-19 from CT images in IoT environment.
The remaining sections of the paper are as follows, Section 2 provides the review of works related to COVID-19 prediction using machine learning and deep learning. Section 3 gives a clear description of the proposed methodology of COVID-19 prediction methods. Section 4 gives the results and discussion of the proposed methodology. Finally, conclusion part is presented in Section 5.
Researchers have proposed numerous methods to predict the presence of COVID-19. Some of the methods are reviewed in this section.
Gifani et al. [16] presented an automatic COVID-19 detection method using an ensemble of a deep learning algorithm. A total of 15 pre-trained CNN architectures such as Inception_resnet_v2, ResNext50, DenseNet121, Xception, SeResnet 50, ResNet-50, InceptionV3, NasNetMobile, NasNetLarge and EfficientNets (B0-B5) are used which are then fine-tune on the basis of target task. The designed CNN was utilized to achieve COVID-19 detection. From that point onwards, a group technique was developed that heavily relied on the ballot of optimal combination of in-depth transfer learning that in turn enhances the approval process. Furthermore, CT scan images were used in this research from a publicly-accessible database of checks. This database contained 349 CT filters which are categorized as positive for COVID-19 and 397 for negative COVID-19 CT tests i.e., either normal or other kinds of lung infections. The experimental outcomes demonstrate that the performance of in-depth transactional learning design with EfficNetB0, Xception, Inception_resnet_v2, EfficientNetB5 and EfficientNetB3 produced higher results in comparison with individual transfer learning structure. These models further achieved the best output in terms of precision (0.857), recall (0.854) and accuracy (0.85) when it comes to prediction of coronavirus disease from CT scan images.
Singh et al. [17] introduced in-depth learning design for COVID-19 series in which chest CT scan images were used. The decorative model specifically used three notable architectures such as DCCN, Resnet 152 V2, and VGG16. The team had a mandatory option to deal with vulnerability issue associated with RT-PCR. The panel model is a large chest CT scan image database and was attempted using fifteen different intensive models. The test outcomes found that the proposed model reveals the current design in terms of accuracy (1.2738%), f-measurement (1.3274%), area under curvature (1.8372%) and exposure (1.283%) and transparency 1.8382% respectively.
In the study conducted by Jain et al. [18], the researchers considered the PA (Posteroanterior) view of chest X-rays collected from the COVID-19 patients whereas healthy patients were taken as control. After the collection of images, it was cleaned and data was augmented for which deep learning-based CNN models were applied. Then, the performances were compared. In this study, the author used Inception V3, Xception, and ResNeXt models and their accuracy values were contrasted. In order to assess the performance the proposed model, the researcher sourced 6432 chest X-ray images from Kaggle repository. Out of these images, the authors used 5467 for training while the rest of the images i.e., 965 were used for validation. The outcomes inferred that the highest accuracy i.e., 97.97% was achieved by Xception net model in identifying COVID-19 using chest X-ray images in comparison with other models. The model verified in the study shows only the possible opportunities to classify the patients as either COVID-19 or non COVID-19, whereas its medical accuracy remains unclaimed. The study established the possibility of using such deep learning techniques to automate the diagnostic procedures. High accuracy would have been a result of over-fitting issue while it can be validated with new datasets.
Azemin et al. [19] introduced deep learning prediction model. COVID-19 chest X-ray images are scarce and challenging to acquire. Due to this, generalization as well as the uniqueness of deep learning models for detecting corona virus using these images need validation. Readily-available chest radiograph images are used as training data in this study since these images possess clinical findings associated with COVID-19. While the images acquired from confirmed COVID-19 patients were used as testing dataset. Deep learning model based on Resnet-101 CNN architecture was used in this study. This architecture has been already training to identify objectives in images. Further, they are retrained to spot the abnormalities in chest X-ray images. The model was tested for its performance under different parameters such as accuracy, sensitivity, specificity and receiver operating curve while the values achieved were 71.9%, 77.3%, 71.8% and 0.82 respectively. This study has two strengths such as usage of labels in the study which created a strong clinical association with COVID-19 cases and the exploitation of publicly available data for experimental procedures.
Narin et al. [20] introduced five pre-configured deep learning-based architectures in the diagnosis of COVID-19. Five models such as Resnet 50, Resnet 101, Resnet 152, InceptionV3, and Inception-ResnetV2, were developed utilizing chest X-ray radiographs to diagnose covid-19 pneumonia patients. It has made three separate double orders with four cases (COVID-19, normal (solid), bacterial pneumonia and viral pneumonia) utilizing 5-layer cross-validation. The study results inferred that the existing model i.e., Resnet 50 model offered the most significant results i.e., processing (99.7% for Dataset-3%, 99.5% accuracy for Dataset 2% and 96.1% accuracy for Dataset-1) among the designs used in the study.
3 The Proposed OCOA-DDCNN Model
A total of 201 new coronaviruses has been grouped under the common name ‘COVID-19’, a severe health issue globally. COVID-19 disease is characterized by severe illness called Severe Acute Respiratory Syndrome Coronavirus 2 (SARS-CoV-2) across the globe. Those individuals who are able to breath without any issues can get affected if they are exposed to COVID-19, a life-threatening disease. To avoid the complications involved in COVID-19, prior diagnosis and detection of the affected people are critical so that they can be quarantined, provided casual or critical medical support based on their prognosis and contain the spread of virus further. In recent days, machine learning and deep learning techniques are considered for diagnosing COVID-19 from X-ray and CT scan images. Fig. 1 shows the working procedure of OCOA-DDCNN technique.
In the current research article, OCOA-DDCNN model is developed for the prediction of COVID-19. The main objective of the proposed methodology is to efficiently predict the presence of COVID-19. The proposed methodology has two stages such as pre-processing stage and the prediction stage. Initially, COVID-19 CT scan images are gathered from open source system. The collected images are then sent to pre-processing stage in which Gaussian filter is used. Gaussian filter is utilized to remove the unwanted noise from the collected CT scan images. Afterwards, the pre-processed images are sent to prediction phase. The prediction phase processes the images with the help of DDCNN. The proposed classifier is optimally designed by considering OCOA. This optimization is utilized to select the optimal parameters for the proposed classifier, for instance kernel size. Finally, the proposed method is utilized for predicting COVID-19 and classifying the same under two classes namely, non-COVID-19 (normal) and COVID-19 (abnormal).
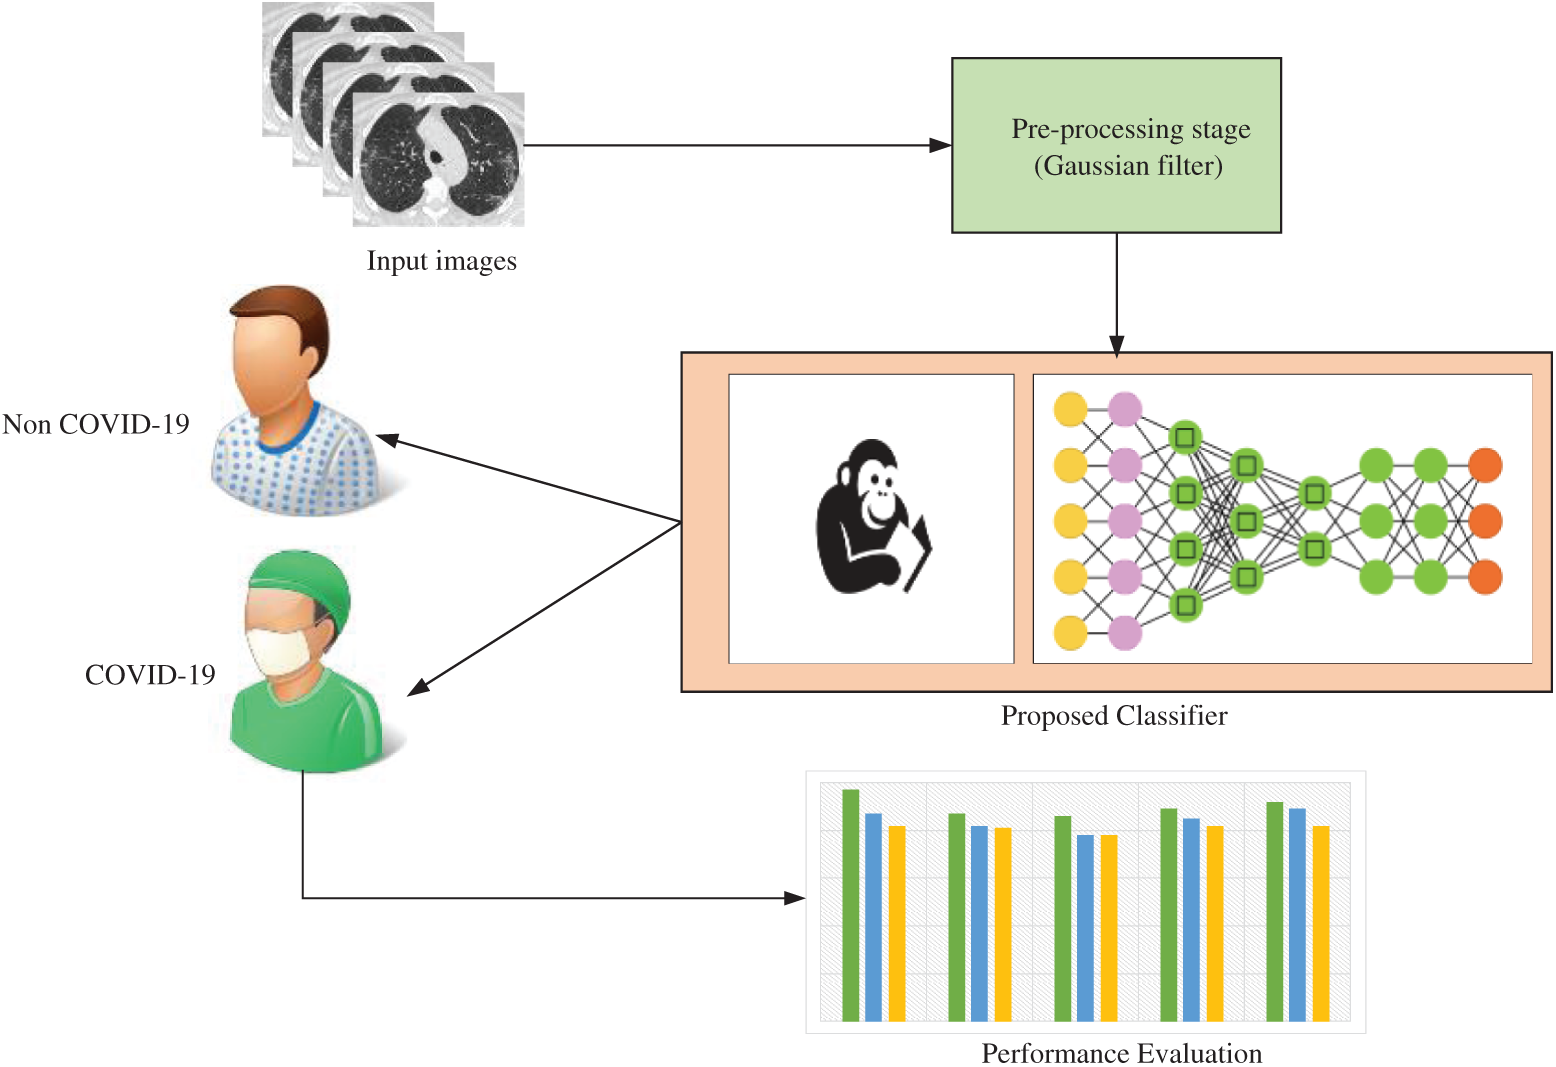
Figure 1: Architecture of the proposed methodology
During preprocessing, the noise present in CT scan image is removed and image contrast is enhanced. CT scan images are unique from one patient to another. Based on this feature, detection maybe fail at times to achieve the best results. In the proposed model, Gaussian filter is utilized to remove the unwanted features and noises from the images during feature extraction process. Gaussian filter computes the distribution of the pixel strength in frame [21]. Pixel strength is a combination of probability of intensity and Gaussian function in frame at time, `
where
In this classification stage, the proposed classifier is utilized to classify the two classes of COVID-19 using CT images. The proposed classifier is designed with DDCNN and OCOA algorithm while the former is enhanced with the help of latter. Oppositional-based optimization algorithm is utilized to select the optimal hyperparameters of DDCNN method. The detailed descriptions of DDCNN and OCOA algorithms are explained in the upcoming sections.
3.2.1 Deep Dense Convolutional Neural Network Model
DDCNN is unique among the deep learning methods and is a feed forward neural network which has integrated design among the neurons. From neurons, it has overlapping districts with separate neurons in COVID-19 detection. DDCNN structure is also optimized with the help of chimp optimization algorithm. This model is designed with a complex architecture of stacked layers which are utilized in the detection of COVID-19 from CT scan images. DDCNN is highly sensitive and robust in nature when finding a feature from the image of video frames. The basic structure of DDCNN is shown in Fig. 2.
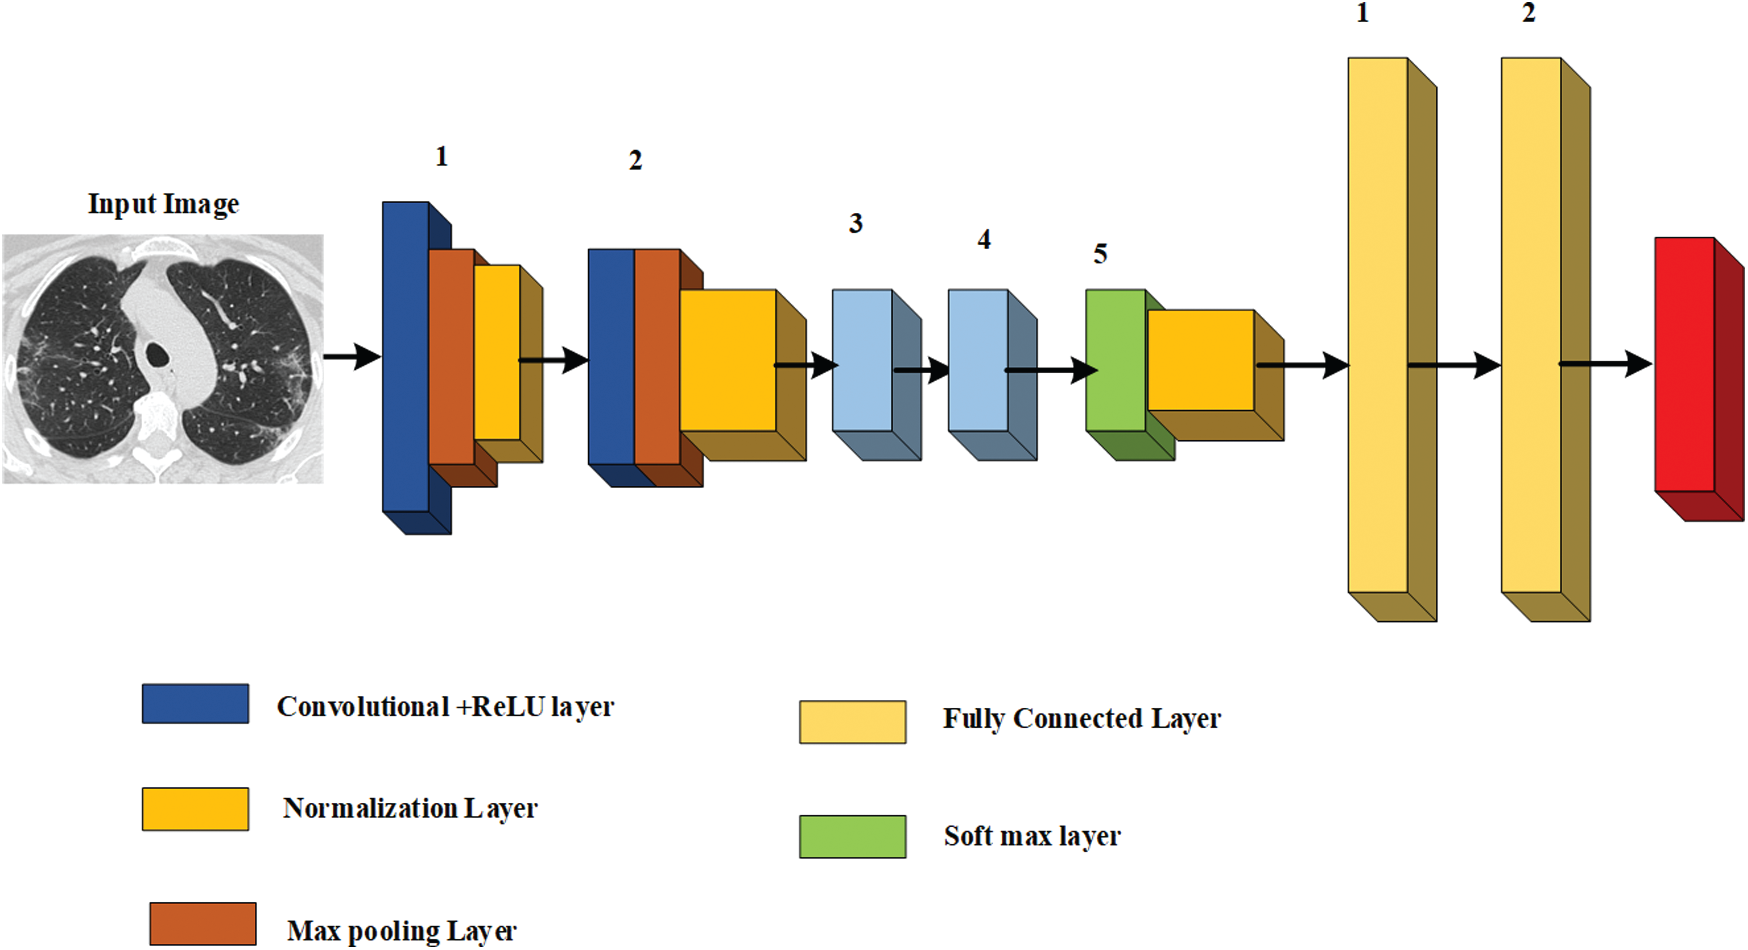
Figure 2: Architecture of DDCNN model
In this research, DDCNN is developed and used to predict the presence of COVID-19. The designed DDCNN consists of an output layer, fully-connected layer, flattened layer, two convolutional layers and input layer. Among these layers, input layer is considered as the initial layer. Then, convolutional layer is the second layer which consists of Rectified Linear Units (ReLu), Batch Normalization layer (BN) and a convolution layer. The convolution layer contains filters which move through the time axis for extracting the features. The third layer is used to extract time-domain features by moving through horizontal axis [22]. Flatten layer is the fourth layer that corresponds to C3 vector. After that, fully-connected layer is present. Finally, the Softmax layer is presented to detect the COVID-19 classes from the image based on the classification of output classes. In DDCNN, a neuron is mentioned as the equation given below.
where J denotes several position feature maps, K denotes the number of feature maps and M denotes the count of layers in neural network respectively. The input and output of the neuron can be defined as herewith,
From the Eq. (3), the activation function is denoted by F which can be formulated as follows,
The input image is denoted as,
The output expression of the convolution layer 2 is presented herewith.
where,
where,
From the above equations, forward propagation computation flow of the DDCNN network is determined. DDCNN network biases and weights function on the basis of error backpropagation algorithm. This network is trained with labeled training database in addition to difference between reference value and the predicted value. Both weight and bias of the DDCNN network is updated with the help of gradient descent as presented herewith.
During the training phase of DDCNN, minimum error rate is computed and resolved. In this DDCNN structure, no pooling layer is presented. DDCNN network does not contain the pooling layer and it abridges the network design while at the same time, it also evades the misplaced optimal features. Feature vectors can be sent to the input layer of ReLu from which each feature vector can be standardized. In layer 4, time domain feature vector and frequency feature vector are conjoined formerly to feed the fully-connected layer. At last, Softmax layer is considered for the classification purposes. DDCNN design parameters are optimally selected with the help of OCOA algorithm. Before explaining OCOA, the basic behavior and characteristics of COA are presented in the following section.
3.2.2 Chimp Optimization Algorithm
In the proposed methodology, COA is utilized due to the advantages such as better convergence, reduced processing and minimum complexity. Its mathematical formulation is presented herewith.
i) Inspiration
Normally, chimp's society is a fission-fusion society. This is one of the societies where the combination of societies may be time-variant function. Further, every member in this society has a specific duty and special ability that may change over time. Based on these considerations, the aim of independent concepts is developed in this algorithm. Hence, every group of chimpanzees separately attempts to find the search space with its singular characteristics that are intended to achieve specific action. In general, there are four types of chimps present such as attackers, chasers, barrier, and driver. Based on these types, the behaviors of the chimps also get changed during hunting process in order to achieve an efficient hunt operation. In chimp's algorithm, the drivers collect the prey without the hunting process. Barriers reside at trees and act as check points to monitor and lock the prey. Preys are grabbed by chasers rapidly. At last, the attackers identify the prey's escape route into inferior canopy. The attackers are required to have efficient identification ability that predicts the way in which the prey may travel. Moreover, the attackers should collect the large piece of meat after an efficient hunt [23].
In chimp calculation, the attack method is strictly related to actual ability, intelligence and age. Also, chimps can change practices during a particular hunt or interact with their whole community to use different strategies. It is authorized by the chimps which chase to hunt the meat in exchange for social honors such as preparation and firm assistance. Henceforth, by opening another domain of interest and benefits. chimps may indirectly affect the chase. People use social motivation as chimps. In this way, the chimps have an advantage compared to other social predators. In addition to sexual motivation, chimps start acting turbulent as the last advance of the chase. Therefore, bulk chimps drop the mistakes of obtaining meat independently. Based on the social behavioral pattern of chimps, it can be segregated under two primary stages such as investigation and misuse. There is a way to track, prevent and drive prey in the investigation. Basically, misuse is considered as prey attack. The details of misuse and investigation numbers are introduced herewith.
ii) Driving and Chasing Prey
In COA, the prey can be hunted throughout the exploitation stage in addition to exploration stage. The mathematical design of chasing, in addition to driving the prey, is formulated herewith.
where,
where,
iii) Exploration Phase
The mathematical model of the chimp's attacking behaviour is arrived at herewith. At first, the chimps finds the location of the prey and then it surrounds the prey. Finally, the prey is attacked by the attackers. Chaser, barrier and driver are usually involved in the hunt. In research works, there is no information available about the optimal condition of the prey during initial repetition. So, the states of the chaser, barrier and driver must be updated using the attacker's status. So four optimal solutions can be saved and the other chimps are stopped from updating their positions related to the locations of the best chimps. This creation is presented mathematically as follows,
The position of the search agent is updated in the search space based on another chimp position. So, the final position of the chimp is arbitrarily placed in the orbit and is described as the position of drivers, chaser, barrier, and attacker.
iv) Exploitation Phase
As explained earlier, the chimps hunt the prey by attacking process, while the prey stops running. In the attacking process of chimps, the value of f is linearly minimized. The vector of a also gets reduced in the manner of f vector. Additionally, a is an arbitrary variable in the interval of
v) Exploitation Phase Using the Social Incentive
In COA, both social incentive and the society of chimps are related to meat hunting. In the final stage of chimp hunting process, it may abort the hunting process altogether. Hence, they chaotically attempt at grabbing the hunted meat for social essences. These characteristics are designed with chaotic maps which is formulated herewith.
where
3.3 Oppositional Based Chimp Optimization Algorithm
To enhance the convergence level of COA models, Oppositional-Based Learning (OBL) is developed. This learning procedure is applied in the computation of optimal global solution and empower convergence. Here, the opposite population is concurrently created in the search space. The impression of OBL is related to the generation of opposite numbers nearby the global solution over arbitrarily-created number. Additionally, both points and the opposite numbers can be defined. The opposite variable can be computed as a glass opinion in interplanetary solution from intermediate point which is mathematically formulated as given herewith.
where A and B denote the search region points. To achieve the opposite results, the initial population of COA is mathematically formulated as given herewith.
The initial population of the COA provides the opposite results which are formulated as follows.
This oppositional function is utilized in COA to achieve the best DDCNN hyperparameters and classify the COVID-19 cases. The proposed approach is utilized to improve the presentation of DDCNN during classification stage. Finally, the proposed classifier is utilized for efficient classification of COVID-19 under two classes such as COVID-19 and non-COVID-19. The performance analysis of the projected method is presented in the following section.
The performance of the proposed methodology was evaluated and justified in this section. The proposed methodology was validated by considering statistical measurements such as accuracy, precision, recall, sensitivity, specificity, and F_Measure. The proposed methodology was compared with existing methods such as CNN-EPO, and CNN-FA. The proposed method was tested using COVID-19 CT scan image database that consists of 2,482 images. The database containing the CT images has two folders such as COVID-19 and non-COVID-19 respectively. The database consists of 1,252 COVID-19 positive images and 1230 non-COVID-19 images. Among the images, 1865 images were utilized for testing whereas the remaining was used for training the proposed classifier. The implementation parameters of the proposed method are presented in Tab. 1. The performance metrics of the statistical measurements are presented in this section. A set of sample CT images is shown in Fig. 3.
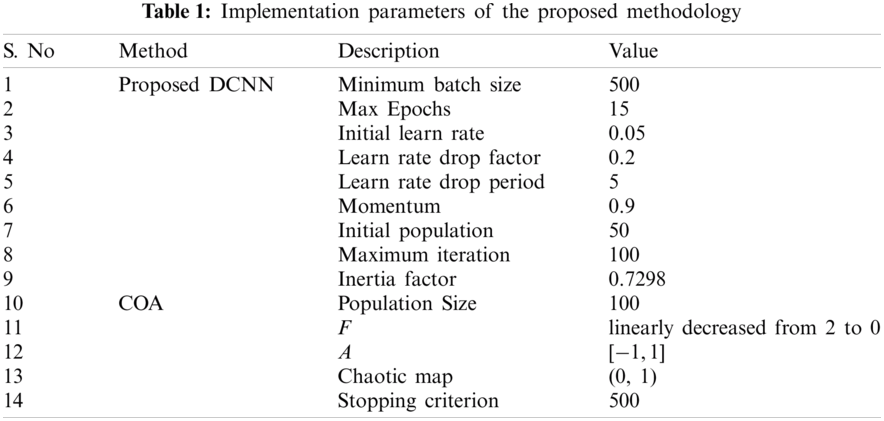
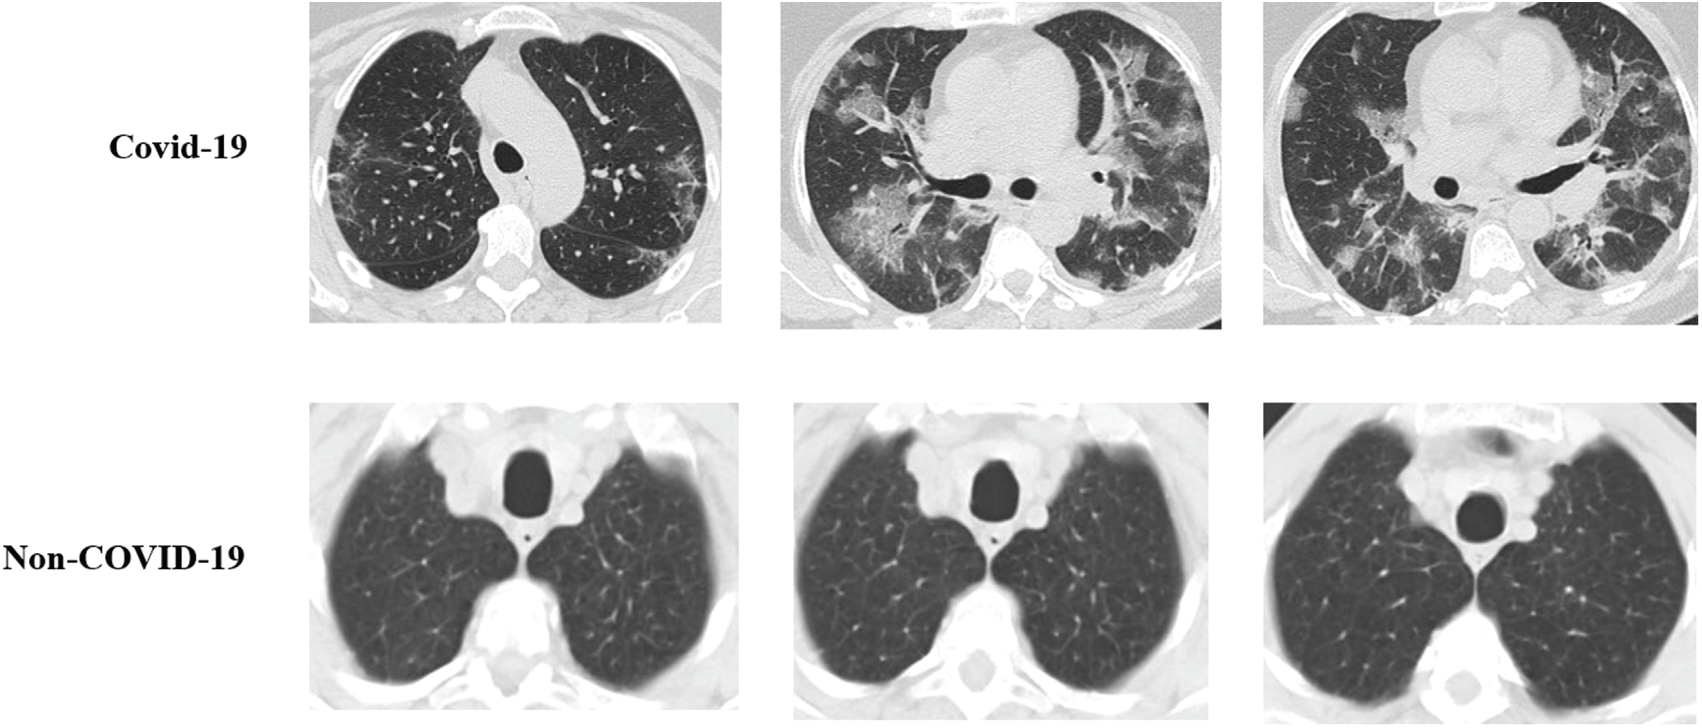
Figure 3: Sample CT images of COVID-19 and non-COVID-19
The proposed DCNN model was used to predict COVID-19 from CT scan images. COVID-19 is termed to be positive and detected, if the person is infected with the virus and it shows non-COVID-19 if the person remains uninfected or infected with other infections. The confusion matrix is computed based on the following constraints,
■ Presence of COVID-19 and was detected positive which is named as True Positive (TP).
■ Absence of COVID-19 and was not detected which is named as True Negative (TN).
■ Absence of COVID-19 but was detected positive which is named as False Positive (FP).
■ Presence of COVID-19 and was not detected which is named as False Negative (FN).
Based on the progress of confusion matrix terms, the proposed methodology was evaluated using the performance metrics.
The proposed method was validated using the collected CT scan images. CT scan images from COVID-19 patients were sourced from the literature [25]. In this database, a total of 1252 CT images that are positive for COVID-19 and 1230 CT images of patients who are not infected by SARS-CoV-2, 2482 CT is present. This information was collected on a real-time basis from patients admitted in medical clinics from Sao Paulo, Brazil. The aim of this research work is to stimulate an innovative artificial intelligence technique that can distinguish a person as either COVID-19 positive or negative by examining his/her CT scan image. The collected CT scan images were utilized to validate the performance of the proposed methodology. Sample images of COVID-19 positive cases and non-COVID-19 are illustrated in Fig. 3.
The proposed method was validated using comparative analysis and is shown in Tab. 2. During comparison analysis, the proposed method was compared with CNN-FA and CNN-EPO models respectively. Fig. 4 shows the results of comparison analysis conducted for the parameter, accuracy. The figure conveys that the proposed method achieved 0.99 accuracy in epoch 10. Similarly, CNN-FA and CNN-EPO methods achieved the accuracy values of 0.89 and 0.85 respectively. In comparison analysis, the proposed method achieved the best accuracy in every epoch of COVID-19 detection. Fig. 5 shows the results of comparison analysis conducted for the parameter, precision. The figure portrays that the proposed method achieved 0.98 accuracy in epoch 10. Similarly, CNN-FA and CNN-EPO methods achieved the accuracy values such as 0.92 and 0.85 respectively. So, it can be inferred that the proposed method achieved the best precision in every epoch during COVID-19 detection.
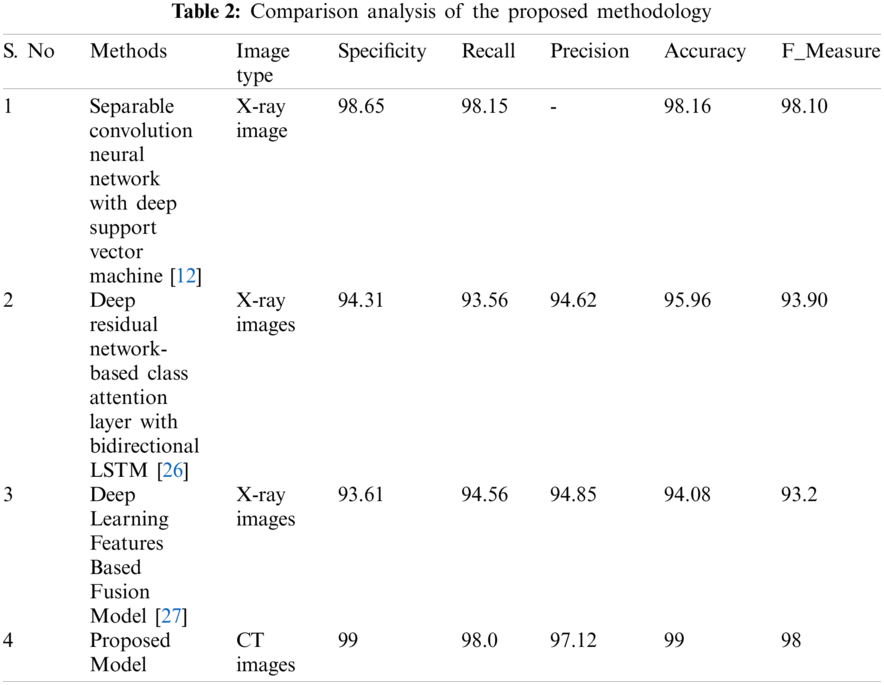
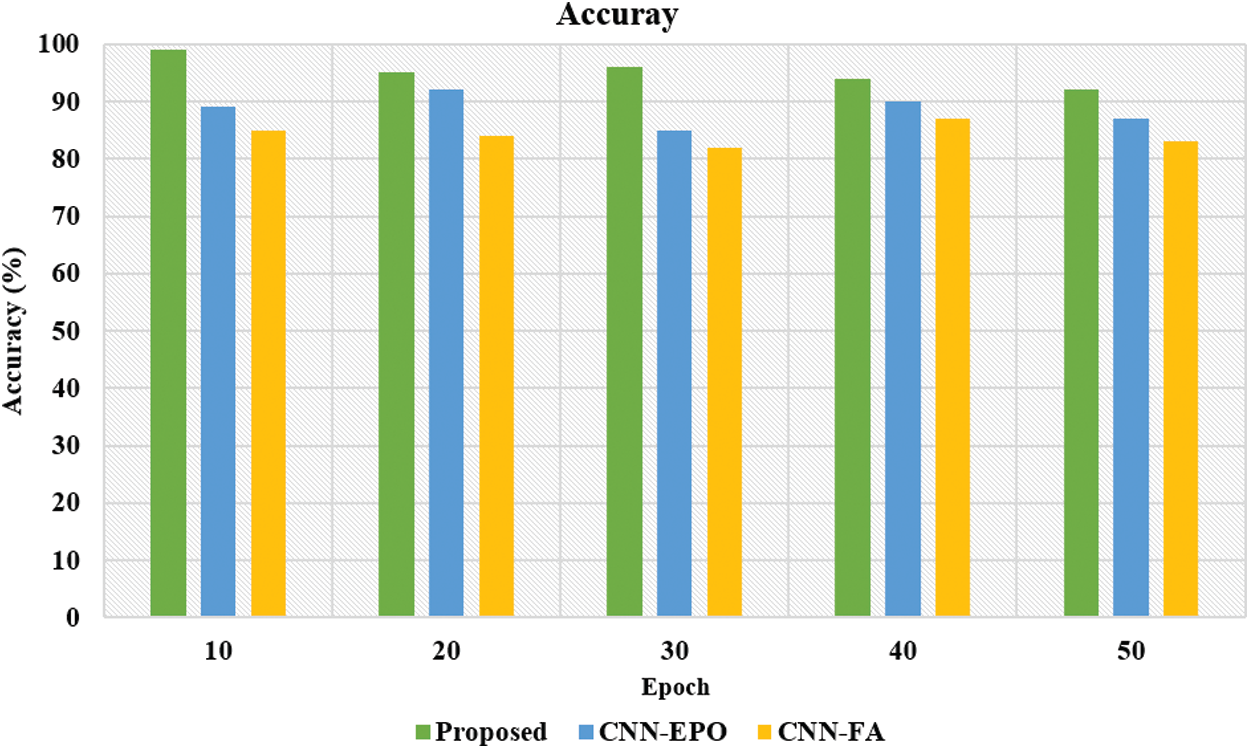
Figure 4: Analysis of accuracy
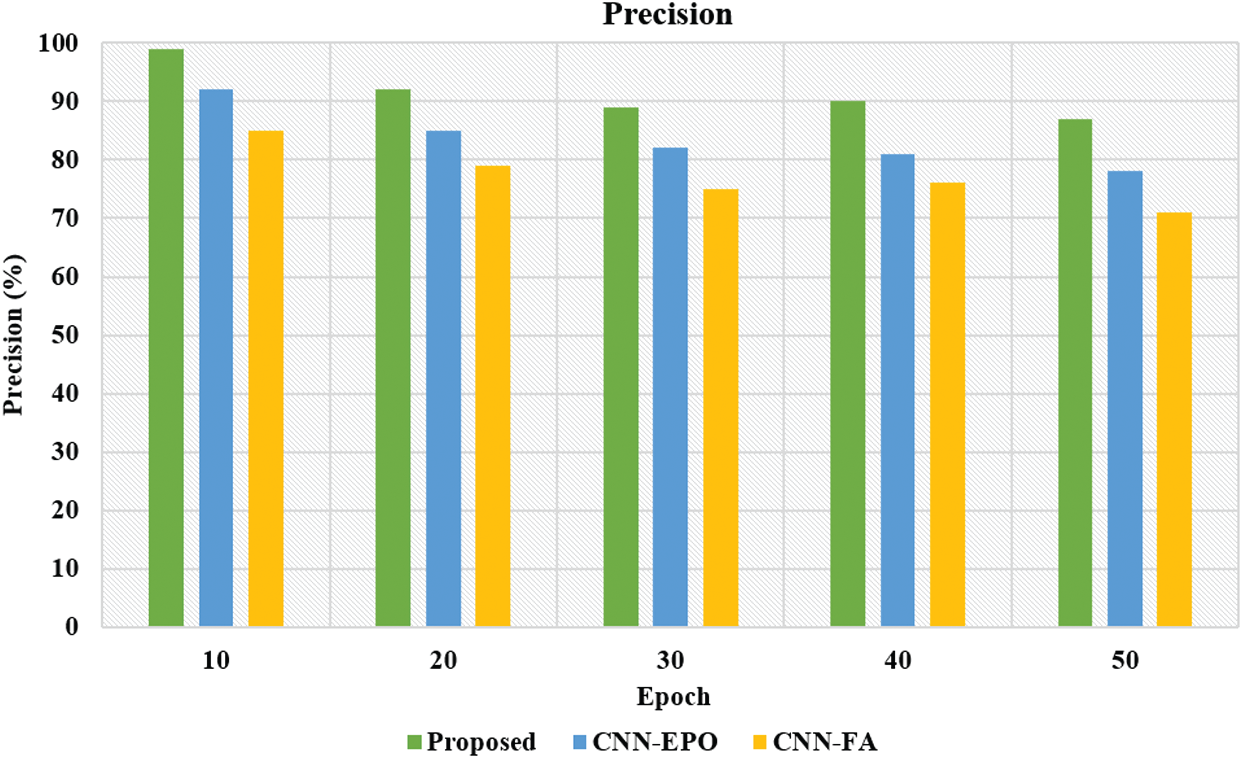
Figure 5: Analysis of precision
Fig. 6 shows the results for the comparison analysis of recall. The proposed method achieved a recall rate of 0.98 under epoch 10. Similarly, CNN-FA and CNN-EPO methods achieved the accuracy values such as 0.85 and 0.81 respectively. The comparison analysis inferred that the proposed method achieved the best recall in every epoch during COVID-19 detection. Fig. 7 shows the results for the comparison analysis of sensitivity. The proposed method achieved high sensitivity of 0.97 under epoch 10. Similarly, CNN-FA and CNN-EPO methods achieved the sensitivity values such as 0.87 and 0.82 respectively. The proposed method thus achieved the best sensitivity under every epoch in the detection of COVID-19. Fig. 8 shows the results for the comparison analysis of F_Measure. The proposed method achieved 0.98 F_Measure under epoch 10. Similarly, CNN-FA and CNN-EPO methods achieved the F_Measure values such as 0.85 and 0.81 respectively. The comparison analysis thus affirmed the effectiveness of the proposed method in achieving the best F_Measure under every epoch.
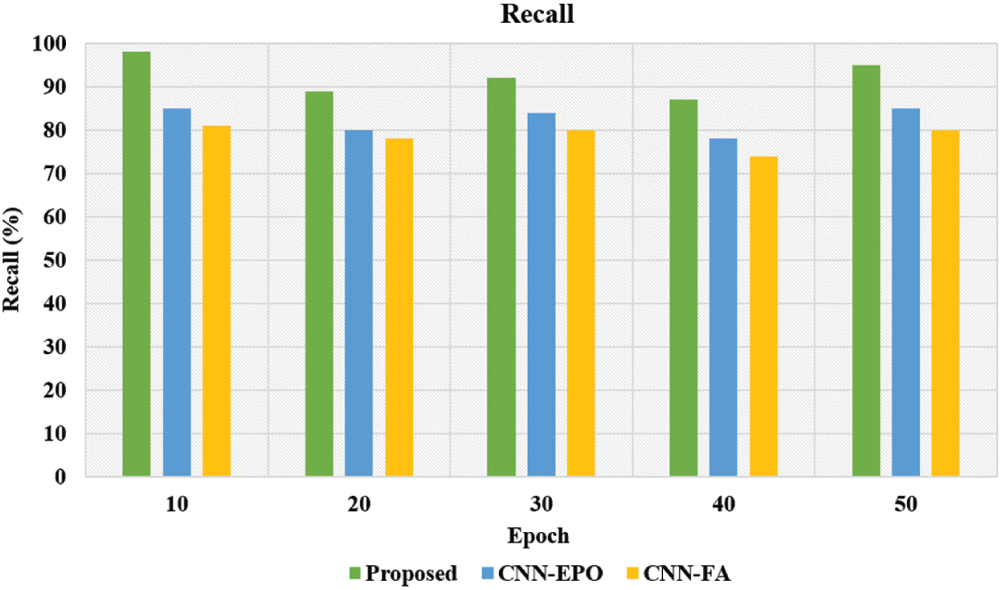
Figure 6: Analysis of recall
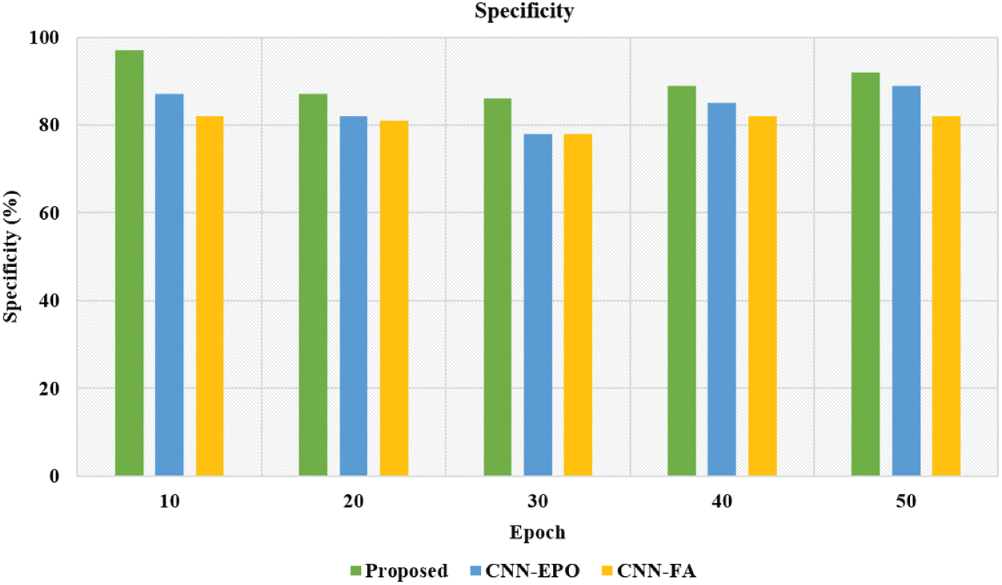
Figure 7: Analysis of specificity
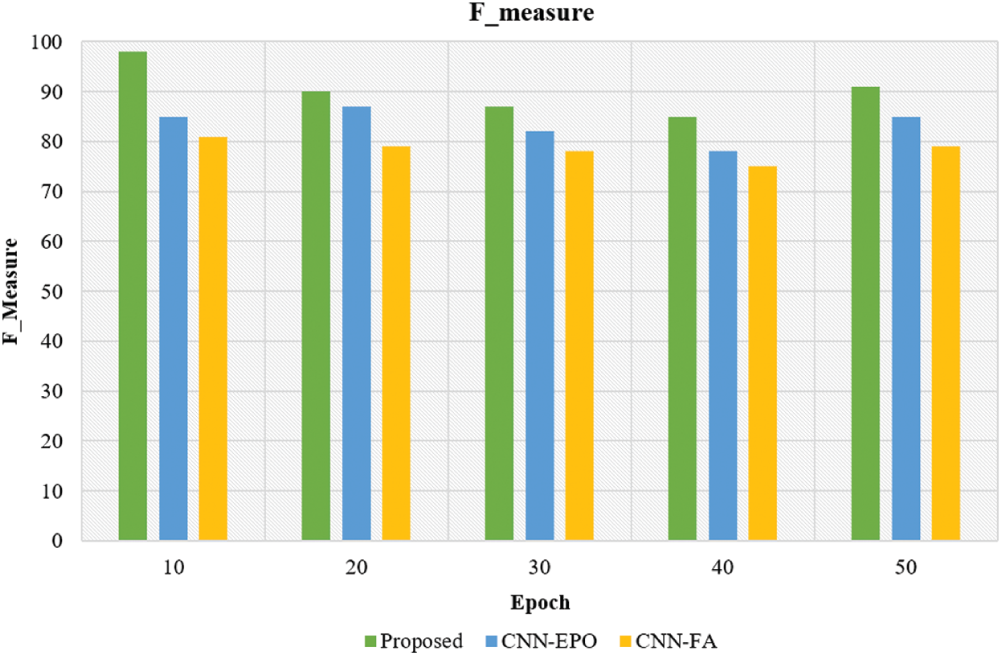
Figure 8: Analysis of F_Measure
The current research article presented a COVID-19 prediction and classification model based on input CT scan images in IoT environment. The study developed OCOA-based DDCNN model to predict and classify COVID-19 from CT scan images in an effective manner. DCNN hyperparameters were selected optimally with the help of OCOA algorithm. Initially, the CT images were collected from databases and then sent to pre-processing phase. During pre-processing phase, noise was removed through Gaussian filter. Then the images were classified to detect the presence of COVID-19 from CT images. DCNN classifier has two phases such as training phase and testing phase. The proposed COVID-19 prediction model was implemented in MATLAB and its performance was evaluated. Few measures were chosen to evaluate the performance of the proposed method such as accuracy, sensitivity, recall, precision, and F_Measure. The proposed method was validated using comparison analysis in which the existing methods such as CNN-FA and CNN-EPO were used. The comparison analysis confirmed the effectiveness of the proposed method since it achieved the best results under different statistical parameters especially accuracy (0.99%). Thus, the proposed model was validated and its supremacy was established. Future researchers can implement the proposed model using huge databases and using other classifiers.
Acknowledgement: Authors of this research thanks the database contributors of CVC-ClinicDB, ETIS-Larib, EndoCV2020 and Kvasir for providing the open access to the dataset for research purpose. This research work was partially supported by Chiang Mai University.
Funding Statement: The authors received no specific funding for this study.
Conflicts of Interest: The authors declare that they have no conflicts of interest to report regarding the present study.
1. M. A. Khan, S. Kadry, Y. D. Zhang, T. Akram, M. Sharif et al., “Prediction of COVID-19-pneumonia based on selected deep features and one class kernel extreme learning machine,” Computers & Electrical Engineering, vol. 90, pp. 106960, 2021. [Google Scholar]
2. S. R. Nayak, D. R. Nayak, U. Sinha, V. Arora and R. B. Pachori, “Application of deep learning techniques for detection of COVID-19 cases using chest X-ray images: A comprehensive study,” Biomedical Signal Processing and Control, vol. 64, pp. 102365, 2021. [Google Scholar]
3. Z. Wang, L. Li, M. Song, J. Yan, J. Shi et al., “Evaluating the traditional Chinese medicine (TCM) officially recommended in China for COVID-19 using ontology-based side-effect prediction framework (OSPF) and deep learning,” Journal of Ethnopharmacology, vol. 272, pp. 113957, 2021. [Google Scholar]
4. S. Bhattacharya, P. K. R. Maddikunta, Q. V. Pham, T. R. Gadekallu, C. L. Chowdhary et al., “Deep learning and medical image processing for coronavirus (COVID-19) pandemic: A survey,” Sustainable Cities and Society, vol. 65, pp. 102589, 2021. [Google Scholar]
5. H. Abbasimehr and R. Paki, “Prediction of COVID-19 confirmed cases combining deep learning methods and Bayesian optimization,” Chaos, Solitons & Fractals, vol. 142, pp. 110511, 2021. [Google Scholar]
6. I. Shiri, A. Akhavanallaf, A. Sanaat, Y. Salimi, D. Askari et al., “Ultra-low-dose chest CT imaging of COVID-19 patients using a deep residual neural network,” European Radiology, vol. 31, no. 3, pp. 1420–1431, 2021. [Google Scholar]
7. C. Shorten, T. M. Khoshgoftaar and B. Furht, “Deep learning applications for COVID-19,” Journal of Big Data, vol. 8, no. 1, pp. 1–54, 2021. [Google Scholar]
8. K. E. ArunKumar, D. V. Kalaga, C. M. S. Kumar, M. Kawaji and T. M. Brenza, “Forecasting of COVID-19 using deep layer recurrent neural networks (RNNs) with gated recurrent units (GRUs) and long short-term memory (LSTM) cells,” Chaos, Solitons & Fractals, vol. 146, pp. 110861, 2021. [Google Scholar]
9. N. Shatnawi and H. A. Qdais, “Assessing and predicting air quality in northern Jordan during the lockdown due to the COVID-19 virus pandemic using artificial neural network,” Air Quality, Atmosphere & Health, vol. 14, no. 5, pp. 1–10, 2021. [Google Scholar]
10. M. Turkoglu, “COVIDetectionet: COVID-19 diagnosis system based on X-ray images using features selected from pre-learned deep features ensemble,” Applied Intelligence, vol. 51, no. 3, pp. 1213–1226, 2021. [Google Scholar]
11. W. M. Shaban, A. H. Rabie, A. I. Saleh and M. A. A. Elsoud, “Detecting COVID-19 patients based on fuzzy inference engine and deep neural network,” Applied Soft Computing, vol. 99, pp. 106906, 2021. [Google Scholar]
12. D. N. Le, V. S. Parvathy, D. Gupta, A. Khanna, J. J. P. C. Rodrigues et al., “Iot enabled depthwise separable convolution neural network with deep support vector machine for COVID-19 diagnosis and classification,” International Journal of Machine Learning and Cybernetics, pp. 1–14, 2021. [Google Scholar]
13. E. H. Houssein, Z. Abohashima, M. Elhoseny and W. M. Mohamed, “Hybrid quantum convolutional neural networks model for COVID-19 prediction using chest X-ray images,” Image and Video Processing, pp. 1–22, 2021. [Google Scholar]
14. S. Sharma and A. Jain, “An algorithm to identify the positive COVID-19 cases using genetic algorithm (GABFCov 19),” Journal of Interdisciplinary Mathematics, vol. 24, no. 1, pp. 109–124, 2021. [Google Scholar]
15. R. S. M. L. Patibandla and V. L. Narayana, “Computational intelligence approach for prediction of COVID-19 using particle swarm optimization,” in Computational Intelligence Methods in COVID-19: Surveillance, Prevention, Prediction and Diagnosis, Proceedings: Studies in Computational Intelligence book series (SCI, volume 923Springer, Singapore, pp. 175–189, 2021. [Google Scholar]
16. P. Gifani, A. Shalbaf and M. Vafaeezadeh, “Automated detection of COVID-19 using ensemble of transfer learning with deep convolutional neural network based on CT scans,” International Journal of Computer Assisted Radiology and Surgery, vol. 16, no. 1, pp. 115–123, 2021. [Google Scholar]
17. D. Singh, V. Kumar and M. Kaur, “Densely connected convolutional networks-based COVID-19 screening model,” Applied Intelligence, vol. 51, pp. 1–8, 2021. [Google Scholar]
18. R. Jain, M. Gupta, S. Taneja and D. J. Hemanth, “Deep learning based detection and analysis of COVID-19 on chest X-ray images,” Applied Intelligence, vol. 51, no. 3, pp. 1690–1700, 2021. [Google Scholar]
19. M. Z. C. Azemin, R. Hassan, M. I. M. Tamrin and M. A. M. Ali, “COVID-19 deep learning prediction model using publicly available radiologist-adjudicated chest X-ray images as training data: Preliminary findings,” International Journal of Biomedical Imaging, vol. 2020, pp. 1–7, 2020. [Google Scholar]
20. A. Narin, C. Kaya and Z. Pamuk, “Automatic detection of coronavirus disease (covid-19) using x-ray images and deep convolutional neural networks,” Image and Video Processing, pp. 1–31, 2020. [Google Scholar]
21. Z. Chen, Z. Zhou and S. Adnan, “Joint low-rank prior and difference of Gaussian filter for magnetic resonance image denoising,” Medical & Biological Engineering & Computing, vol. 59, pp. 607–620, 2021. [Google Scholar]
22. M. Heidari, S. Mirniaharikandehei, A. Z. Khuzani, G. Danala, Y. Qiu et al., “Improving the performance of CNN to predict the likelihood of COVID-19 using chest X-ray images with preprocessing algorithms,” International Journal of Medical Informatics, vol. 144, pp. 104284, 2020. [Google Scholar]
23. M. Kaur, R. Kaur, N. Singh and G. Dhiman, “SChoa: A newly fusion of sine and cosine with chimp optimization algorithm for HLS of datapaths in digital filters and engineering applications,” Engineering with Computers, pp. 1–29, 2021. [Google Scholar]
24. M. Khishe and M. R. Mosavi, “Chimp optimization algorithm,” Expert Systems with Applications, vol. 149, pp. 113338, 2020. [Google Scholar]
25. https://www.kaggle.com/plameneduardo/sarscov2-ctscan-dataset. [Google Scholar]
26. D. A. Pustokhin, I. V. Pustokhina, P. N. Dinh, S. V. Phan, G. N. Nguyen et al., “An effective deep residual network based class attention layer with bidirectional LSTM for diagnosis and classification of COVID-19,” Journal of Applied Statistics, pp. 1–18, 2020. [Google Scholar]
27. K. Shankar and E. Perumal, “A novel hand-crafted with deep learning features based fusion model for COVID-19 diagnosis and classification using chest X-ray images,” Complex & Intelligent Systems, vol. 7, pp. 1–14, 2020. [Google Scholar]
 | This work is licensed under a Creative Commons Attribution 4.0 International License, which permits unrestricted use, distribution, and reproduction in any medium, provided the original work is properly cited. |