DOI:10.32604/cmc.2022.019626
| Computers, Materials & Continua DOI:10.32604/cmc.2022.019626 | |
| Article |
Analysis and Assessment of Wind Energy Potential of Socotra Archipelago in Yemen
1Department of Electrical Engineering – Communication Engineering, Sana’a University, Yemen
2Department of Computer Science, King Khalid University, Muhayel Aseer, Kingdom of Saudi Arabia
3Faculty of Computer and IT, Sana’a University, Sana’a, Yemen
4Department of Electrical Engineering, University of Engineering and Technology, Peshawar, P. O. B 814, Pakistan
5Department of Information Systems, King Khalid University, Mayahel Aseer, KSA
6Computer Science Department, King Khaled University, KSA & Faculty of Computers and Information, Computer Science Department, Menoufia University, Egypt
7Computer Science Department, King Khaled University, KSA & Faculty of Science, Department of Mathematics and Computer Science, Menoufia University, Egypt
8Electronics Department, Faculty of Engineering, UST, Sana’a, Yemen
9Faculty of Computer and IT, Sana’a University, Yemen
*Corresponding Author: Fahd N. Al-Wesabi. Email: falwesabi@kku.edu.sa
Received: 20 April 2021; Accepted: 23 May 2021
Abstract: The increasing use of fossil fuels has a significant impact on the environment and ecosystem, which increases the rate of pollution. Given the high potential of renewable energy sources in Yemen and the absence of similar studies in the region, this study aims to examine the potential of wind energy in Socotra Island. This was done by analyzing and evaluating wind properties, determining available energy density, calculating wind energy extracted at different altitudes, and then computing the capacity factor for a number of wind turbines and determining the best. The average wind speed in Socotra Island was obtained from the Civil Aviation and Meteorology Authority data, only for the five-year data currently available. The results showed high wind speeds from June to September (9.85–14.88 m/s) while the wind speed decreased for the rest of the year. The average wind speed in the five years was 7.95 m/s. The average annual wind speed, wind energy density, and annual energy density were calculated at different altitudes (10, 30, and 50 m). According to the International Wind Energy Rating criteria, the region of Socotra Island falls under Category 7 and is classified as ‘Superb’ for most of the year. This study provides useful information for developing wind energy and an efficient wind approach.
Keywords: Energy potential; wind characteristics; Weibull distribution; wind power density; Socotra island
The increase in population and rate of industrialization has led to a rise in energy demand. Fossil fuels cannot meet this demand because they negatively affect the environment and ecosystem, causing a significant increase in pollution. In other words, the energy industry and the environment are in significant crises today. Today in modern societies, energy is the most important indicator of economic growth and many countries worldwide are taking steps toward achieving a renewable energy model to solve this crisis [1,2]. Renewable energy sources such as solar, thermal, geothermal, bioenergy, hydropower, and ocean have gained popularity all over the world due to their distinct characteristics. Simultaneously, the increasing use of fossil fuels and the resulting environmental pollution has motivated researchers to find other sustainable, clean, efficient, and economical energy sources. Wind power systems are known to operate on a wind speed system. In 2800 BC, wind energy was used to pump water and generate power in rural areas. Wind energy is used today as an alternative source of energy [3,4].
As seen in literature [5–9] and in various places around the world, great emphasis has been placed on the Weibull function because it is suitable for wind speed data analysis. It is also useful for distributing large statistical data and is presented as a continuous distribution for further analysis. Some literature [10–18] are related to renewable energy in the Republic of Yemen, despite the scarcity of that literature due to a similar study for this region. Geographically, Yemen is located between latitude 13 north and 16 norths and longitude 43.2–53.2 in southwestern Asia. The Red Sea surrounds it from the west and the Indian Ocean (Arabian Sea) from the south. The total area of Yemen is 527.970 km2, and as of 2016, the population was about 26,687,000 people. Yemen has a high potential for renewable energy sources such as solar, wind, and geothermal energy [19].
In 2009, the Yemeni government approved the National Renewable Energy and Efficiency Strategy, which aims to increase 15% of energy efficiency (EE) in the energy sector by 2025, and target renewable energy (RE) capacity (Geothermal energy 160 megawatts, concentrated solar power 100 megawatts, solid biomass 6 megawatts, solar photovoltaic system 8.25, and wind power 400 megawatts) of total electricity by 2025. The Yemeni energy sector consists of oil, natural gas, and biofuel production. Energy production in 2012 was “15.109 kilotons of oil equivalent (ktoe), while consumption was 6,923 kilotons” [20].
Solar irradiance ranges between 5.2–6.8 kWh/m2/day, and the average annual sunshine is between 7.3 and 9.1 h/day, even in winter. The average daily solar hours are between 8 and 16 h per day [21]. Yemen is considered one of the countries that possess large coastal areas, with a coastal area of 2,500 km and a width of 30 to 60 km. It also owns several islands, most notably Socotra Island and other marine areas. The report of the Ministry of Planning and International Cooperation, Economic Studies, and Forecasts for the Oil Sector on May 14, 2016 stated that oil and gas revenues were the primary resources for the state budget and it contributed about 53.6% of the total public revenues between 2010 and 2014. Also, oil and gas revenues declined by about 77.1% in 2015 due to the repercussions of war, conflict, and low global oil prices [22].
This study investigates the potential of wind energy in Socotra Island by analyzing and evaluating the wind characteristics, determining the available energy density, and calculating the wind energy extracted at different altitudes (10, 30, 50 m). This study also discussed one of the methods of selecting the suitable wind turbine for the studied site, which is the calculation of the capacity factor. The current study provides useful information for government departments concerned with developing wind energy in Yemen.
The rest of the paper has five more sections. Section 2 provides the background. Section 3 provides the system model. Section 4 presents the basics calculations of the proposed system model. Section 5 describes the simulation, results and discussion, and Section 6 offers conclusions.
This section provides a brief concise background on renewable energy, the reality, and the statement of the energy and power system problem in the Republic of Yemen.
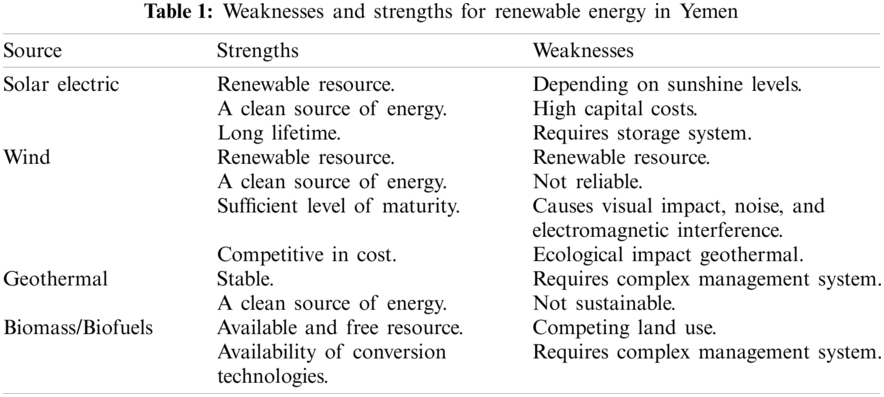
Yemen has a very good potential for using renewable energy. Still, the problem is the state of the energy sector in Yemen because it relies heavily on conventional energy (fossil fuels, petroleum, and its derivatives). We will note that one of the practical solutions and alternative sources of electricity and the economy in the country is the use of renewable energy [23].
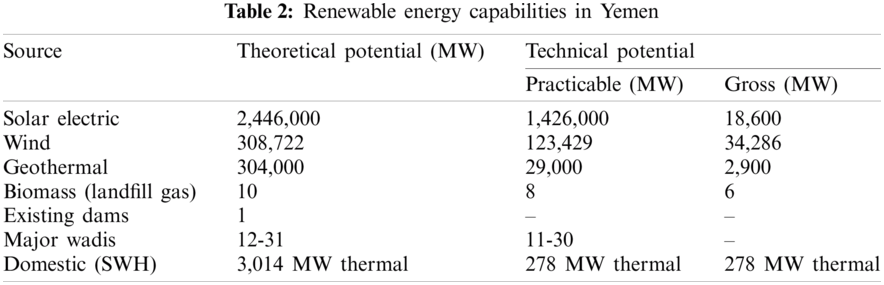
Weaknesses and Strengths of Renewable energy in Yemen in Tab. 1 [24] and the renewable energy capabilities in Yemen in Tab. 2 [25].
In 2009, the Government of Yemen approved the national strategy for RE and energy efficiency, aiming to increase 15% of energy efficiency (EE) in the power sector by 2025 [20]. The targeted capacity of RE in total electricity (in MW) by 2025 is shown in Fig. 1.
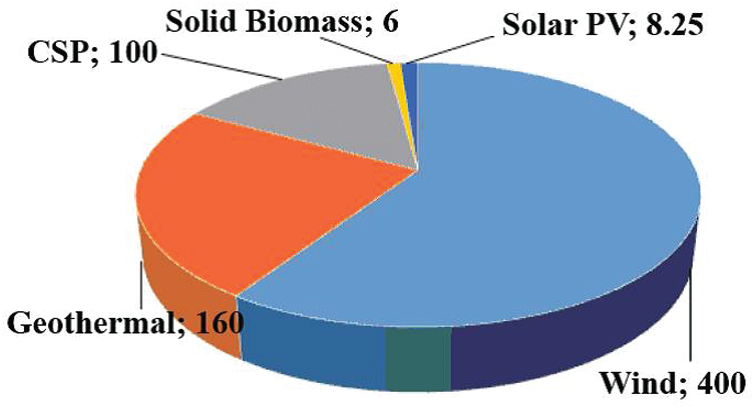
Figure 1: Targeted capacity of RE in total electricity (in MW) by 2025
(Geothermal 160 MW, Concentrated Solar Power (CSP) 100 MW, Solid Biomass 6 MW, Solar PV 8.25, Wind 400 MW).
2.2 Energy and Power System in Yemen
The Yemeni energy sector consists of oil, natural gas, and biofuels. Energy production in 2012 was “15,109 kiloton of oil equivalent (ktoe) while the consumption was 6,923 ktoe” [25].
The main components of the proposed system model are shown in Fig. 2, assuming that the assessment analysis of the wind speed data, average wind parameters and standard deviation for five years (2005–2009) by determining the parameters of the distribution functions.
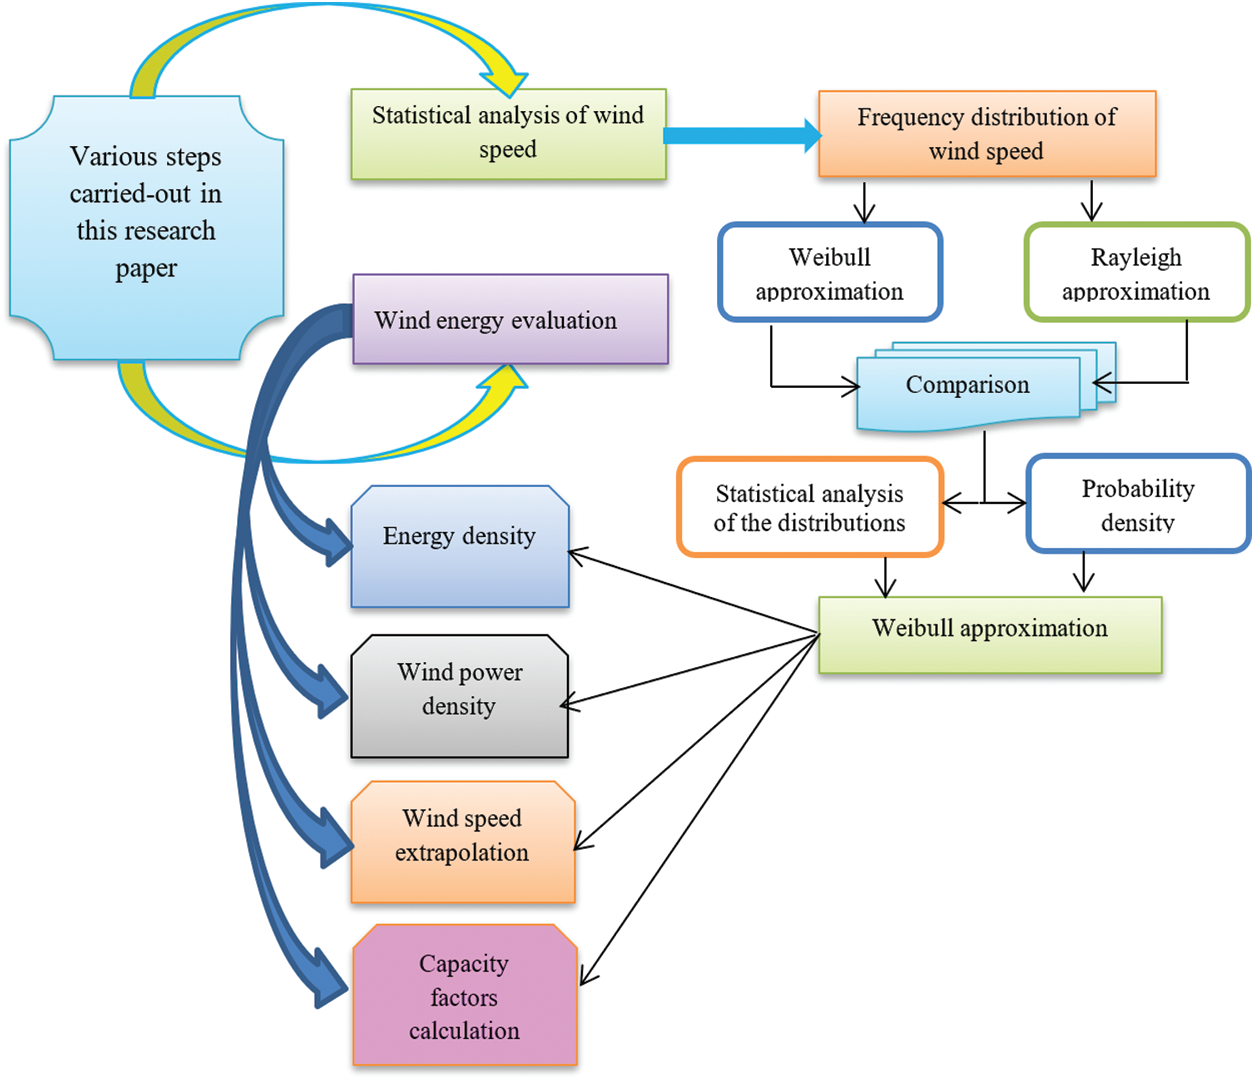
Figure 2: Flowchart of the proposed system model
Statistical analysis of wind velocity data and average wind parameters of the two commonly used functions are also provided to fit the probability distribution of wind velocity measured at a given location over a given period in this section. The functions are the Weibull and Rayleigh distributions. In this section, the capacity factors of several famous wind turbines are also calculated based on Weibull parameters and the speed characteristics of each of these turbines. The second section analyzes wind energy evaluation and finds the wind speed extrapolation, wind power density, and energy density for three heights (10, 30, and 50 m).
4 Basic Calculations of The Proposed System Model
4.1 Study the Location of Socotra Island
Socotra Island, situated in the northwestern Indian Ocean, is located near the equator (which makes its climate generally tropical) between latitudes, 53.19 and 54.33 east of the Greenwich International Line and between spaces 128 and 42.12 north of the equator. Socotra Island has a total land area of 3625 km2, a coastline of 300 km, and a population of nearly half a million people. The island has a hot marine climate with the maximum temperature ranging from 26–28°C and the lowest temperature between 19°C and 23°C. The annual mean temperature is between 27 and 29°C. It was named “the world’s strangest region” and was classified by the New York times as the world’s most beautiful island in 2010 [19].
4.2 Frequency Distribution of Wind Speed
The main aspects of literature regarding wind are on wind speed density and functional variations, and they have a wide range of known applications. Some of the functions commonly used to distribute the probability of measured wind velocity at a given location over a given time are the Weibull and Rayleigh distributions. The probability density function for the Weibull distribution is given by Eq. (1) below [23].
where f(v) is the probability of observing wind speed; v and k are the dimensionless Weibull shape parameter (k helps in finding how frequently wind speeds are close to some measured speed); c is the Weibull scale parameter with a unit equal to the wind speed unit (k and c characterize the wind potential of the sites under study).
The corresponding cumulative probability function of the Weibull distribution is given by Eq. (2).
The Rayleigh distribution is a special case of the Weibull distribution in which the shape parameter k takes the value 2.0. From Eq. (1) the probability density function for the Rayleigh distribution can be simplified as shown in Eq. (3).
The two parameters of the Weibull distribution are probability functions, k and c, which can be related to the mean wind speed Vm and standard deviation σ as shown in Eqs. (4) and (5) below [23].
The Rayleigh distribution shape parameter k takes the value 2.0. From Eq. (1) the probability density function of the Rayleigh distribution can be simplified as shown in Eq. (6).
The mean value Vm and standard deviation σ of the Weibull distribution can then be computed as shown in Eqs. (7) and (8) [24].
where Γ is the gamma function (standard formula) and using the stirling approximation the gamma function of (x) can be given by Eq. (9) below.
4.3 Statistical Analysis of The Distributions
The square of the correlation coefficient (R2), chi-square (x2), and root mean square error analysis (RMSE) were used to evaluate the performance of the Weibull and Rayleigh distributions [25]. These parameters can be calculated by Eqs. (10)–(12) below.
where yi is the first measured data, zi is the mean value, xi is the first predicted data with the Weibull or Rayleigh distribution, N is the number of observations, and n is the number of constants.
4.4 Wind Speed Variation with Height
The most common equation used for the variation of wind speed with height is the power law expressed as shown in Eq. (13) [9].
where v1 is the actual wind speed recorded at height h1 (m), (m/s) and v2 is the wind speed at the required or extrapolated height h2 (m), (m/s).
The exponent
4.5 Wind Power Density Function
It is well known that the power of the wind at speed v (m/s) through a blade sweep area A (m2) increases as the cube of its velocity and is given by Eq. (14) below [26].
where ρ (kg/m3) is the mean air density with value of 1.220 kg/m3. This depends on the altitude, air pressure, and temperature. The expected monthly or annual wind power density per unit area of a site based on the Weibull probability density function can be expressed as shown in Eq. (15).
The total wind power density P/A is the total available power per unit area given by Eq. (16).
where n is the number of days in a month.
Before calculating the average wind power density, vi3 of each day for the extrapolated height at 50 m was calculated
The electrical energy produced by a turbine over the year is given by the following relationship as shown in Eq. (17) [8]:
where Cp is the power coefficient. For practical wind turbines, its value is usually in the range of 0 ≤ Cp ≤ 0.4 and T is the time (For the annual wind energy estimation, T = 8,760 h was used).
The available mean wind power density Pd, and the overall wind energy density Ed, of a wind turbine for a period of time T will be calculated as shown in Eqs. (18), and (19) [9].
Most wind turbines have power curves in their technical notes. This makes it easier to estimate the energy production of any wind turbine when a series of measurements are made at the studied site.
However, sometimes only a probability distribution function may be available. In this case, the wind turbine power output can be expressed as shown in Eq. (20) [27].
where f(v) is the Weibull distribution given by Eq. (1), Pw is the electrical power output of the turbine.
where the curve increases semi-linearly, starting from the cut-in speed
The curve can be divided into two areas, the first is confined between
Substituting Eqs. (1) and (21) into Eq. (20) yields Eq. (22) below [27,28].
4.8 Capacity Factor of Turbine (CF)
Capacity factor that was used to choose a suitable wind turbine, is defined as the ratio of average power output
From Eq. (22), we can calculate the capacity factor as given by Eq. (24) below.
The capacity factor is proportional to C and inversely to k and when fixing the values of C and k, we notice that CF is affected inversely by the difference between the
The average wind speed of Socotra was obtained from the recorded data of the Civil Aviation and Meteorological Authority (CAMA), only for the data available within five years from 2005–2009 (due to the current war and the political situation in Yemen). The wind rose is a primary source for assessing wind energy due to its brief view of how wind velocity is distributed and how it remains distributed in the desired location according to the area’s topographical influences. The island is exposed to strong southwesterly winds peaking in early June until late August and then gradually declines until it reaches average speed in the beginning of October. When the speed decreases to 10 knots. The southwest winds in June, July, and August have an actual speed of about 40 to 50 knots, and in some parts of the island may reach more than 55 knots, accompanied by severe disturbance of the sea. Tab. 3 shows the monthly wind speeds in Socotra Island and the standard deviations calculated from data available for five years.
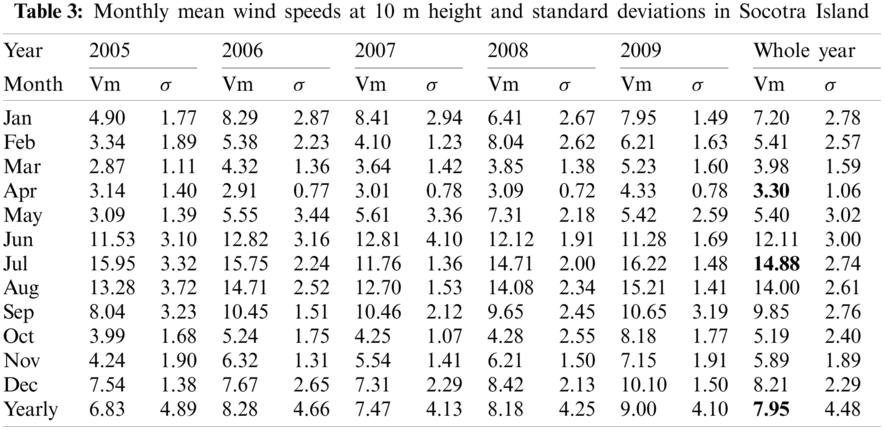
As shown above, in five years the average wind speed was 7.95 m/s. For the entire period, the maximum monthly wind speed was 14.88 m/s in July, while the minimum value was 3.3 m/s in April. It was observed that the smaller the standard deviation, the less regular the speed samples became. This indicates that the current region in our study is very suitable for wind energy. Fig. 3 shows the average wind speed for different months in different years. The maximum wind speed occurs in June, July, and August, while the minimum wind speed occurs in October, November, May, April, March, and February.
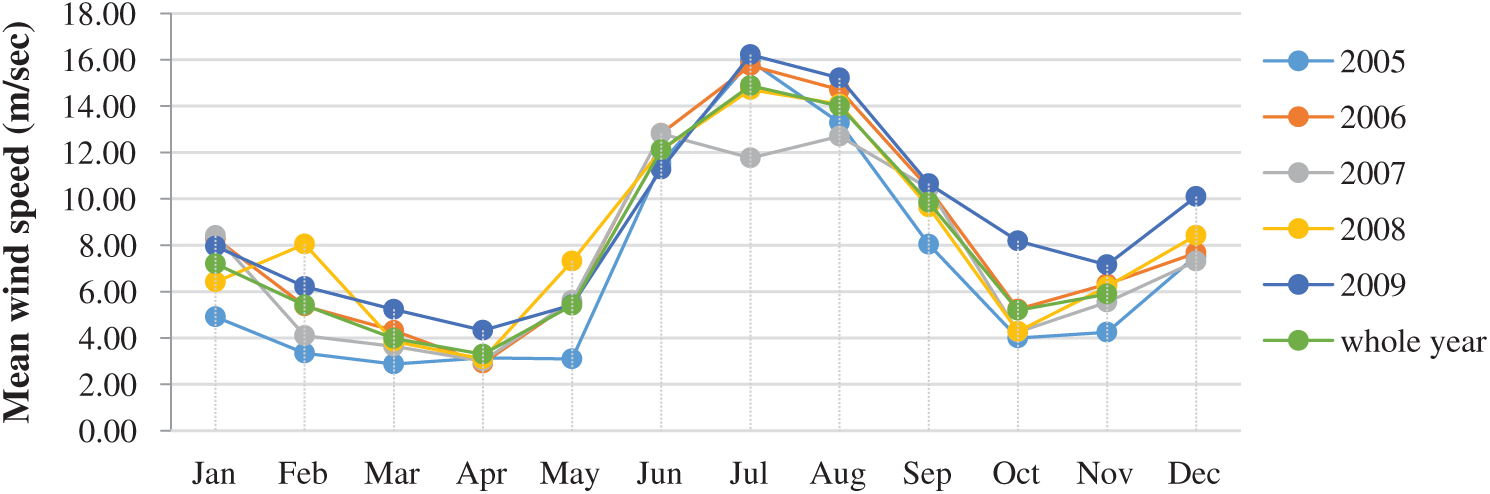
Figure 3: Monthly mean wind speed in Socotra Island
5.2 Probability Density and Cumulative Distributions
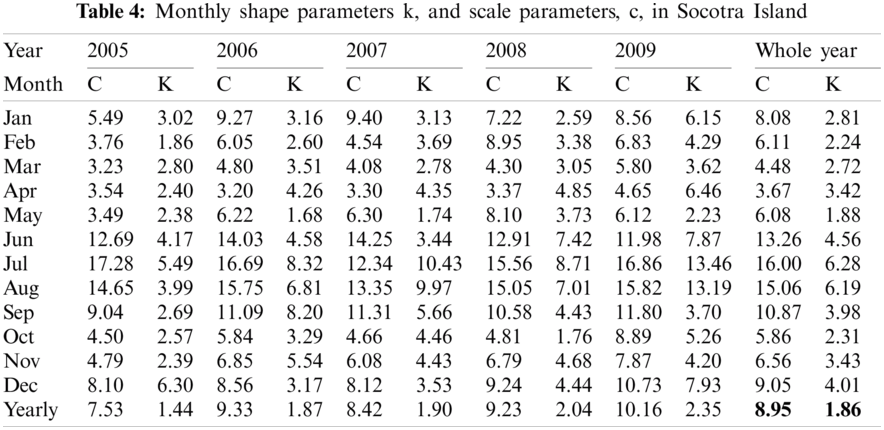
The variation of wind speed is often described using the Weibull density function. It is a widely accepted statistical tool for evaluating local wind probabilities and is considered a standard approach. Eqs. (4) and (5) were used to calculate the Weibull parameters for the available data, and the results are presented in Tab. 4. As shown in the yearly and average Weibull parameter for the five year period, it can be seen from the table that while the scale parameters varied between 7.53 (2005) and 10.15 (2009), the shape parameters ranged from 1.44 (2005) to 2.35 (2009). The five years’ average value of the scale and shape parameters were 8.95 and 1.86, respectively.
It is known that there are many distribution functions used to describe the wind speed frequency curve, but for this study, the Weibull function, which is the most widely used and accepted in specialized research journal, was used. The yearly wind speed probability density and cumulative probability distributions derived from Socotra Island’s measured data for the study period are shown in Fig. 4. The Weibull approximation of the probability density distribution of the wind speed for five years is shown in Fig. 5. RMSE provides a rapid method for calculating minimum values and is considered the most accurate observation method compared to the others. Therefore, it was chosen for the following section.
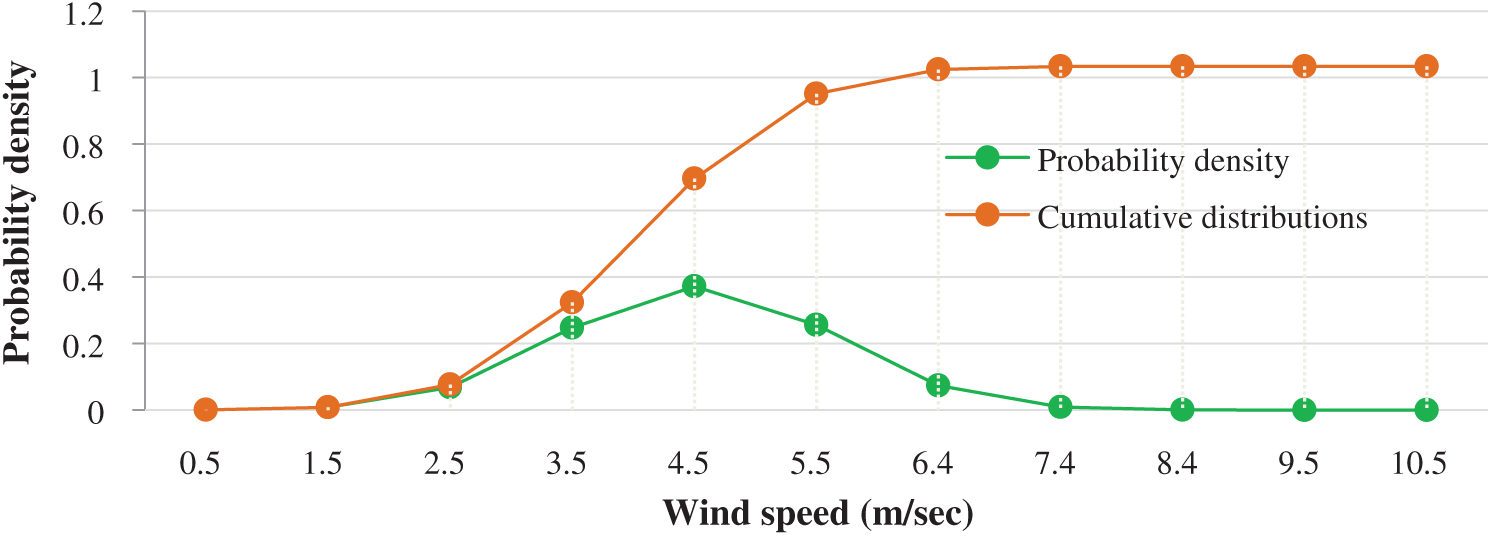
Figure 4: The yearly measured data of Socotra Island for five years
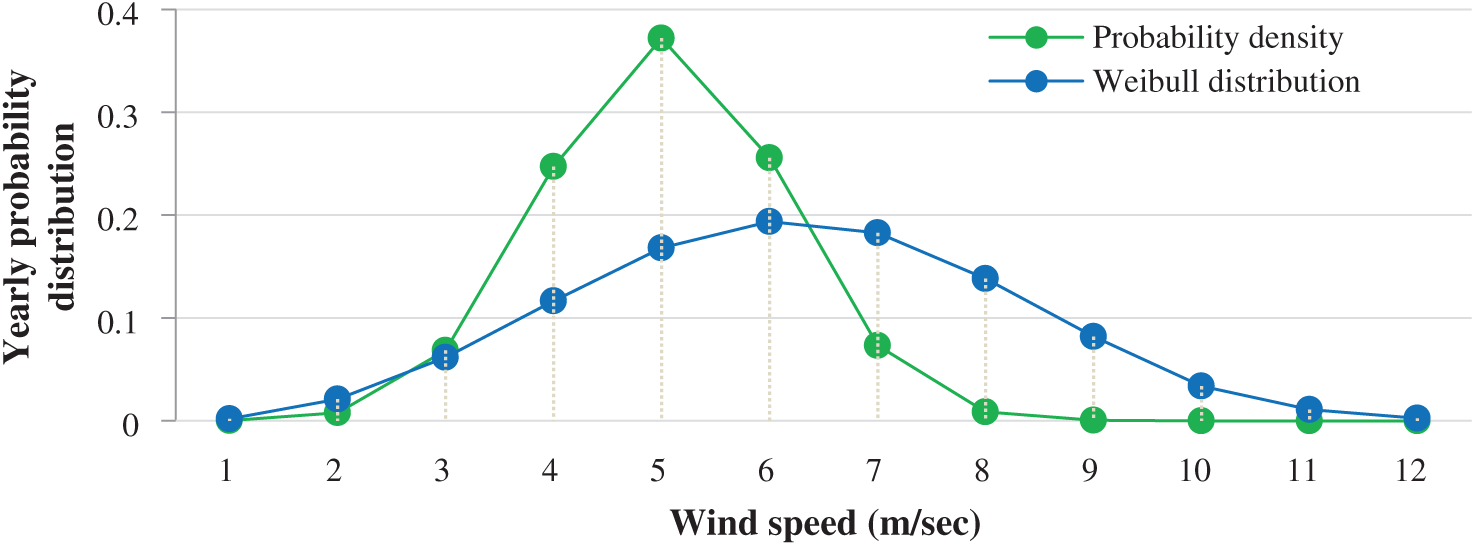
Figure 5: Yearly Weibull probability density distributions for the period (2005–2009) in Socotra Island
Most distribution functions can be determined according to the highest value of R2 and the lowest values of RMSE and x2. It was noted from previous analysis that the Weibull distribution fits the domain data better than the five-year Rayleigh distribution. The Weibull distribution gives a good approximation for estimating wind energy density in Yemen. In addition, the monthly distribution of wind velocity probability density derived from the data measured from Socotra Island for five years is shown in Fig. 6. Likewise, Fig. 7 illustrate the probability distributions in the case of Cumulative.

Figure 6: Probability density distribution derived from the measured data of Socotra for five years

Figure 7: Cumulative probability distribution derived from the measured data of Socotra for five years
The probability density and Weibull probability density distributions for each of the five years were analyzed. The distributions obtained are illustrated in Fig. 8.

Figure 8: Yearly Weibull probability density distributions for the period (2005–2009) in Socotra
The results shown in Figs. 6–8 show that all the curves have a similar tendency to wind speed for cumulative density and probability density. The annual probability density distributions obtained from the Weibull model were compared with field data distributions to study their suitability. The annual comparison of the study location shows that the Weibull model corresponds to the probability density of the measured data.
Since the wind speed changes with altitude and actual wind turbines are placed at different altitudes more than 10 m from the earth surface, the average monthly and annual wind speeds were calculated at different heights (10, 30 and 50 m) to simulate the appropriate height for wind turbines using Eq. (13). This was the first step used to calculate and evaluate wind power within the specified location using the measured data. The annual average wind speed was 8 m/s at 10 m, 12.3 m/s at 30 m, and 15.2 m/s at 50 m, respectively, as shown in Fig. 9. This demonstrates, once again, that the region is suitable for wind energy development.

Figure 9: Monthly average mean wind speeds (m/s) at 10, 30 and 50 m
5.4 Selecting of Wind Turbine Generators
In this section, ten types of wind turbines will be compared, whose power ranges between 200 and 250 kw, as shown in Tab. 3 above, they have the same height as the tower approximately 30 m, and the cutting speed for each of them is less than the average annual speed measured.
The selected turbines are typical from the point of view of their current characteristics and performance at various locations around the world.
The ten turbines are evaluated by calculating the capacity factor CF for each of them according to Eq. (24) and the wind turbine generator with the highest CF is the best turbine corresponding to Socotra from the point of view of energy capture as illustrated in Fig. 10. However, the best turbine from the point of view of utility will depend on the relative timing of the wind power output and utility load.

Figure 10: Yearly capacity factor for 10 types of turbine wind
To calculate the average monthly wind power per unit of the turbine cross-section with an air density of 1.225 kg/m3, the energy density was calculated at different heights (10, 30, and 50 m), as shown in Tab. 5. Since it is known that a slight difference in wind speed will result in a massive difference in the density of wind energy because the wind power density is proportional to the wind speed cube, the wind energy was estimated for different wind categories based on the international wind energy classification, as shown in Tab. 6.
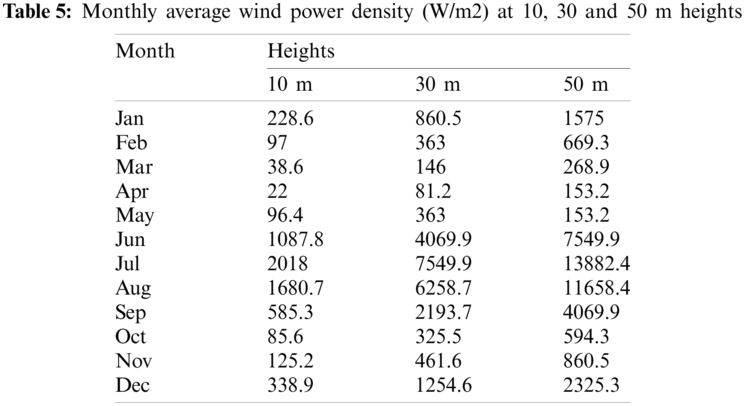
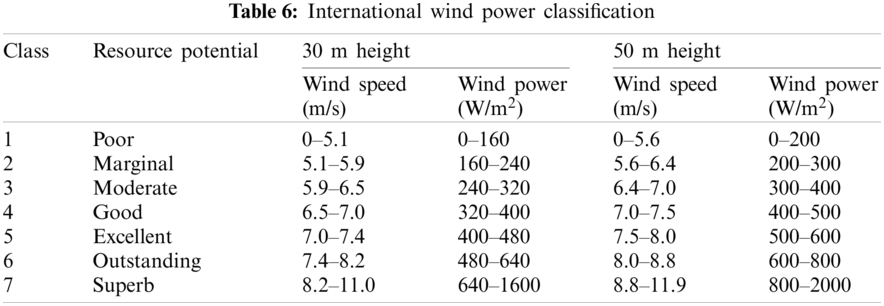
According to the international wind power classification standard, Socotra Island area falls under class 7 and is classified as ‘Superb’ for most of the year because it has an average wind power density of 3689.7 W/m2 at 50 m height and an average wind speed of 15.2 m/s at 50 m height.
Using Eqs. (17) and (18), the average monthly and annual wind energy per unit of the turbine cross-section can be calculated. Thus, Socotra Island’s wind energy was estimated at different heights as shown in Tab. 7 below.
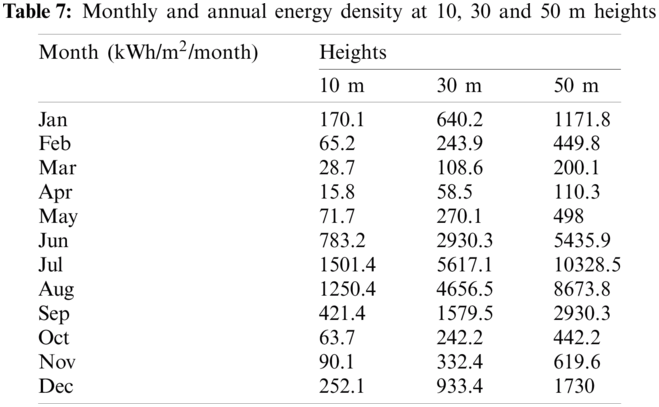
Since wind power is proportional to the axis height, the average annual wind energy density was 4675.2 KWh/m2/year at 10 m, 17467.4 KWh/m2/year at 30 m, and 32321.8 KWh/m2/year at 50 m, respectively. It can be seen that the variation of the wind energy intensity pattern follows the average wind velocity.
In this research, wind speed data were collected for five years on Socotra Island-Yemen and the wind energy potential of the site was studied based on the Weibull model. Monthly and annual wind data analysis was performed to verify wind characteristics on Socotra Island, such as monthly and annual wind speeds, probability density distributions, and cumulative distributions.
The capacity factor of 10 selected turbines from several international companies was also calculated from a Weibull model resulting from analyzing the annual wind speed data for the site on Socotra Island.
The most important results obtained are as follows:
• The analysis showed that the Weibull distribution fits the field data better than the Rayleigh distribution for five years.
• The five-year average value of the scale and shape parameters were 6.37 and 3.18, respectively.
• The average yearly wind speed was calculated at different heights, and the results were 8 m/s at 10 m, 12.3 m/s at 30 m, and 15.2 m/s at 50 m.
• Capacity factor analysis showed that the turbine with the highest capacity factor value CF = 0.6366 was the one manufactured by the German b.ventus company.
• The average yearly wind power density was calculated at different heights, and the results were 533.7 W/m2 at 10 m, 1994 W/m2 at 30 m, and 3689.7 W/m2 at 50 m.
• The average yearly energy density was calculated at different heights, and the results were 4675.2 KWh/m2/year at 10 m, 17467.4 KWh/m2/year at 30 m, and 32321.8 KWh/m2/year at 50 m.
Socotra Island area falls under ‘Class 7’ and is classified as ‘Superb’ for most of the year according to the international wind power classification. The current work is a preliminary study that only assessed the potential of Socotra Island’s wind energy to give useful insights to engineers and experts dealing with wind energy.
Funding Statement: The author extends his appreciation to the Deanship of Scientific Research at King Khalid University for funding this work under Grant Number (R.G.P.2/25/42), Received by Fahd N. Al-Wesabi. https://www.kku.edu.sa.
Conflicts of Interest: The authors declares that they have no conflicts of interest to report regarding the present study.
1. S. Kutty, M. Khan and M. Ahmed, “Wind energy resource assessment for Suva, Fiji, with accurate Weibull parameters,” Energy Exploration & Exploitation, vol. 37, no. 3, pp. 1009–1038, 2019. [Google Scholar]
2. L. Paraschiv, S. Paraschiv and I. Ion, “Investigation of wind power density distribution using Rayleigh probability density function,” Energy Procedia, vol. 157, no. 2, pp. 1546–1552, 2019. [Google Scholar]
3. A. Liu, Y. Ma, J. Gunawardena, P. Egodawatta, G. Ayoko et al., “Heavy metals transport pathways: The importance of atmospheric pollution contributing to stormwater pollution,” Ecotoxicology and Environmental Safety, vol. 164, pp. 696–703, 2018. [Google Scholar]
4. A. Alkholidi, “Renewable energy solution for electrical power sector in Yemen,” International Journal of Renewable Energy Research, vol. 3, pp. 803–811, 2013. [Google Scholar]
5. Y. Li, W. Xiao-Peng, L. Qiu-Sheng and K. Fah, “Assessment of onshore wind energy potential under different geographical climate conditions in China,” Energy, vol. 152, pp. 498–511, 2018. [Google Scholar]
6. M. Salah, I. Supérieur and S. Ben, “Assessment of wind energy potential and optimal electricity generation in Borj–Cedria,” Renewable and Sustainable Energy Reviews, vol. 15, pp. 815–820, 2017. [Google Scholar]
7. I. Fyrippis, P. Axaopoulos and G. Panayiotou, “Wind energy potential assessment in Naxos Island,” Greece Applied Energy, vol. 87, no. 2, pp. 577–586, 2017. [Google Scholar]
8. S. Haralambos, G. Mihalakakou and L. Al-Hadhrami, “Wind power potential assessment for seven buoys data collection stations in Aegean Sea using Weibull distribution function,” Journal of Renewable and Sustainable Energy, vol. 4, pp. 1–17, 2012. [Google Scholar]
9. M. Baseer, J. Meyer, S. Rehman and M. Alam, “Wind power characteristics of seven data collection sites in Jubail, Saudi Arabia using Weibull parameters,” Renewable Energy, vol. 102, no. 6, pp. 35–49, 2017. [Google Scholar]
10. M. Almekhlafi, “Justification of the advisability of using solar energy for the example of the Yemen Republic,” Scientific and Technical Journal, vol. 4, pp. 51–50, 2018. [Google Scholar]
11. A. Rawea and S. Urooj, “Strategies, current status, problems of energy and perspectives of Yemen’s renewable energy solutions,” Renewable and Sustainable Energy Reviews, vol. 82, no. 4, pp. 1655–1663, 2018. [Google Scholar]
12. M. Al-Buhairi and A. Al-Haydari, “Monthly and seasonal investigation of wind characteristics and assessment of wind energy potential in Al-Mokha,” Yemen Energy and Power Engineering, vol. 4, no. 3, pp. 125–131, 2012. [Google Scholar]
13. M. Al-Buhairi, “Analysis of monthly, seasonal and annual air temperature variability and trends in Taiz city-Republic of Yemen,” Journal of Environmental Protection, vol. 1, no. 4, pp. 401–409, 2010. [Google Scholar]
14. M. Al-Buhairi, “A statistical analysis of wind speed data and an assessment of wind energy potential in Taiz-Yemen,” Assiut University Bulletin for Environmental Researches, vol. 9, pp. 21–33, 2006. [Google Scholar]
15. A. AL-Ashwal, “All renewable energy applications in Yemen are best practice,” ISECO Science and Technology Vision, vol. 1, pp. 45–50, 2005. [Google Scholar]
16. A. Almakaleh, “Monthly design values for solar energy collectors and concentrators systems in Yemen,” Journal of Science & Technology, vol. 4, pp. 27– 44, 1999. [Google Scholar]
17. B. Gadhi and M. Mukbel, “A review of renewable energy activities in Yemen,” Renewable Energy, vol. 14, no. 1–4, pp. 459–465, 1998. [Google Scholar]
18. A. Algifri, “Wind energy potential in Aden–Yemen,” Renewable Energy, vol. 13, no. 2, pp. 255–260, 1998. [Google Scholar]
19. T. Chang, “Estimation of wind energy potential using different probability density functions,” Applied Energy, vol. 88, no. 5, pp. 1848–1856, 2011. [Google Scholar]
20. UNDP, “Policy note 2014” in Prospects of Solar Energy in Yemen, Yemen, Sana’a: UNDP, 2014. [Google Scholar]
21. M. Hadwan and A. Alkholidi, “Solar power energy solutions for Yemeni rural villages and desert communities,” Renewable and Sustainable Energy Reviews, vol. 57, no. 4, pp. 838–849, 2016. [Google Scholar]
22. International energy agency statistics, shaping a secure and sustainable energy future, IEA, 2015. [Online]. Available. https://www.iea.org/. [Google Scholar]
23. M. Almekhlafi, “Justification of the advisability of using solar energy for the example of the Yemen Republic,” Scientific and Technical Journal-Technogenic and Ecological Safety, vol. 4, no. 2, pp. 41–50, 2018. [Google Scholar]
24. Recreee, Arab region renewable energy and energy efficiency guide, 2013. [Online]. Available. https://www.rcreee.org/project/arab-region-renewable-energy-and-energy-efficiency-guide-daleel/4321. [Google Scholar]
25. N. Arreyndip, E. Joseph and A. David, “Wind energy potential assessment of Cameroon’s coastal regions for the installation of an onshore wind farm,” Heliyon, vol. 2, no. 11, pp. 1–19, 2016. [Google Scholar]
26. A. Al Shamma’a, K. Addoweesh and A. Eltamaly, “Optimum wind turbine site matching for three locations in Saudi Arabia,” Advanced Materials Research, vol. 347, pp. 2130–2139, 2011. [Google Scholar]
27. L. Gabriela, C. Balaceanu and S. Stefan, “Annual air pollution level of major primary pollutants in greater area of Zucharest,” Atmospheric Pollution Research, vol. 6, no. 5, pp. 824–834, 2015. [Google Scholar]
28. T. Arslan, Y. Murat Bulut and A. Yavuz, “Comparative study of numerical methods for determining Weibull parameters for wind energy potential,” Renewable and Sustainable Energy Reviews, vol. 40, no. 3, pp. 820–825, 2014. [Google Scholar]
 | This work is licensed under a Creative Commons Attribution 4.0 International License, which permits unrestricted use, distribution, and reproduction in any medium, provided the original work is properly cited. |