DOI:10.32604/cmc.2022.019496
| Computers, Materials & Continua DOI:10.32604/cmc.2022.019496 | |
| Article |
Covid-19 Detection from Chest X-Ray Images Using Advanced Deep Learning Techniques
1School of Electronics & Communication Engineering, Shri Mata Vaishno Devi University, Katra, 182320, India
2School of Electrical Engineering, Shri Mata Vaishno Devi University, Katra, 182320, India
3Department of Mathematics, Faculty of Science, Mansoura University, Mansoura, 35516, Egypt
4Department of Computational Mathematics, Science, and Engineering (CMSE), Michigan State University, East Lansing, 48824, MI, USA
5School of Computing, University of Eastern Finland, Kuopio, 70210, Finland
*Corresponding Author: Shubham Mahajan. Email: mahajanshubham2232579@gmail.com
Received: 15 April 2021; Accepted: 18 May 2021
Abstract: Like the Covid-19 pandemic, smallpox virus infection broke out in the last century, wherein 500 million deaths were reported along with enormous economic loss. But unlike smallpox, the Covid-19 recorded a low exponential infection rate and mortality rate due to advancement in medical aid and diagnostics. Data analytics, machine learning, and automation techniques can help in early diagnostics and supporting treatments of many reported patients. This paper proposes a robust and efficient methodology for the early detection of COVID-19 from Chest X-Ray scans utilizing enhanced deep learning techniques. Our study suggests that using the Prediction and Deconvolutional Modules in combination with the SSD architecture can improve the performance of the model trained at this task. We used a publicly open CXR image dataset and implemented the detection model with task-specific pre-processing and near 80:20 split. This achieved a competitive specificity of 0.9474 and a sensibility/accuracy of 0.9597, which shall help better decision-making for various aspects of identification and treat the infection.
Keywords: Machine learning; deep learning; object detection; chest X-ray; medical images; Covid-19
The novel Covid-19 infection pandemic recorded a rapid spread on the community level in different parts of the globe. As of 4th May 2021, 152,875,054 COVID-19 infection cases were reported along with 3,202,762 deaths indicating a mortality rate of near 2.1%. The
The need to develop swift diagnostic tools to investigate cases of potential COVID-19 with competitive sensitivity and specificity measures is urgent. Polymerase Chain Reaction (PCR) and Reverse Transcription PCR (RT-PCR) are drug-based standards sample collection techniques. In the initial phase of the epidemic, RT-PCR exhibited 30%–70% sensitive, whereas chest CT was reported appreciably more sensitive. However, additional testing results from different labs and studies show that the 2nd generation COVID RT-PCR studies have greater sensitivity, so more than 90%. The RT-PCR has been preferred over the chest scan since it was faster with an acceptable accuracy level. To diagnose the extent of the infection, medical personnel have to rely on CT (computerized tomography)/X-Rays Scans that happen to be accurate but slow and costly. This leads to the need for real-time, fast, efficient and accurate diagnostic techniques. Until recently, many major U.S. radiology companies have released statements that clarified the sparring use of CT (computerized tomography) images to impact the management positively. There is an urgent requirement in the present scenario that healthcare providers and AI, ML researchers should work together to develop an imaging-based real-time cheaper but effective and acceptable diagnostic of the infection.
As reported in [2,3], the trademark of COVID-19 is the two-sided distribution of patchy shadows and conspicuous ground-glass opacity (GGO) lesions in peripheral and posterior lungs, with the GGO being the most common finding. In the GGO, certain parts of the lung appear like a hazy shade of gray, as seen in Figs. 1a and 1b instead of black with fine white lung outlines for blood vessels. It appears like a frosted window in winters that suggest a partial filling of air spaces or alveoli in the lungs by fluids. In severe or more advanced infections, more fluid buildup in the lungs and the appearance of GGO becomes “Solid White Consolidation” (SWC), as shown in Figs. 1e and 1f. In the same context, there is a finding called “Crazy Paving Pattern” (CPP), as reflected in Figs. 1c and 1d, which occurs because of the swelling of interstitial space on lung lobules’ walls while making walls look denser like white lines contrary to hazy GGO background. The design is identical to an odd-shaped stone used to pave the driveway.
The 3 CT findings GGO, SWC and CPP, can be seen in isolation or combination. The first symbol is normally GGO, followed by one or more (SWC, CPP). Although the COVID-19 detection. The Chest CT is very sensitive, but the basic findings like GGO could be related to other causes of viral pneumonia such as influenza and adenovirus. The same is observed in numerous non-infectious interstitial lung diseases, which implies that routine COVID-19 chest CT for diagnosis is sensitive but not very specific.
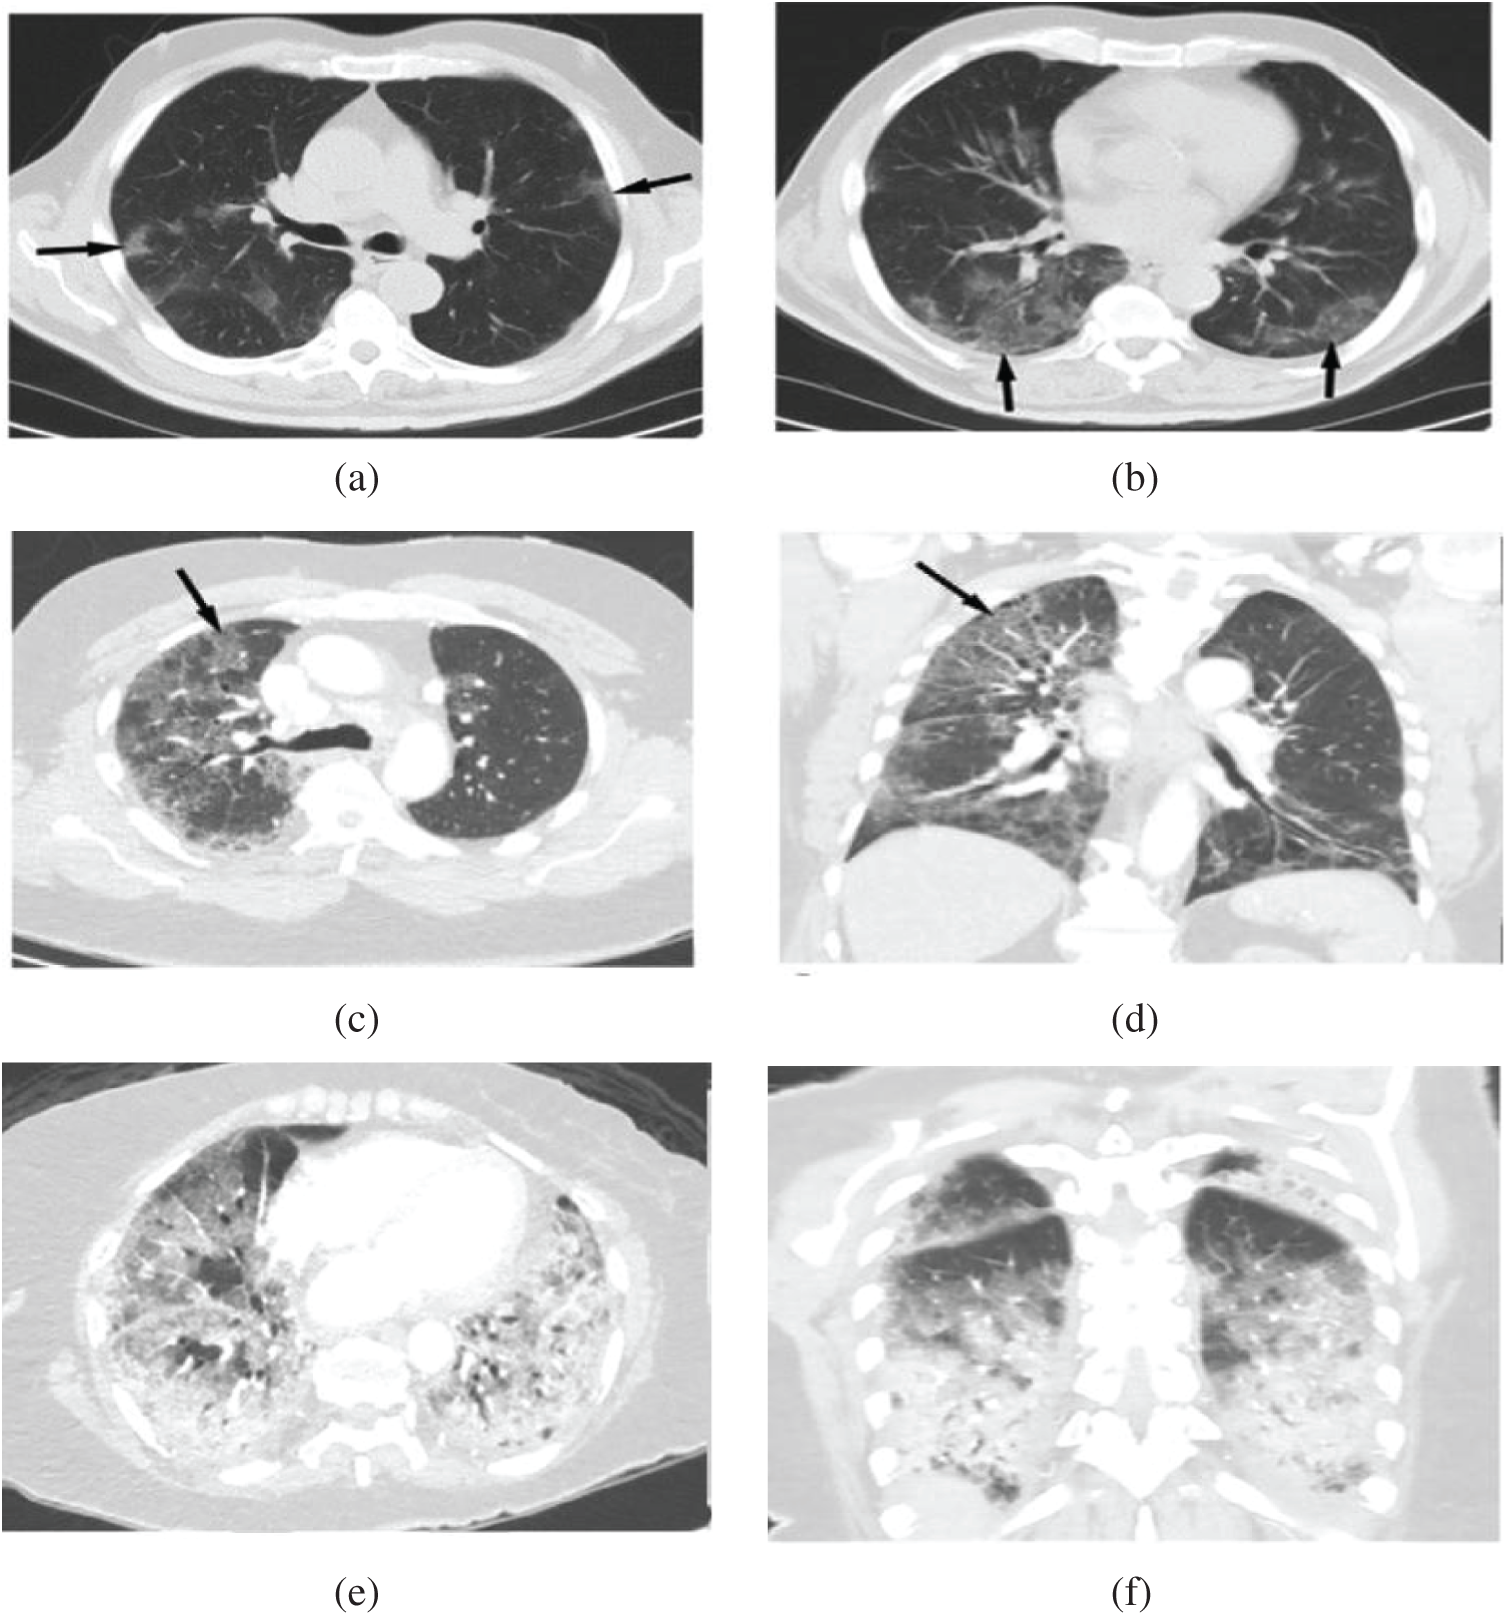
Figure 1: Shows chest CT scan: (a, b) Hazy opacities in both lungs (arrows), (c, d) The crazy paving pattern (arrow), (e, f) Widespread solid consolidations [5]
As per Cellina et al. [4] in their research on Chest X-Ray Scans of COVID-19 patients and the discussion above made that the lung abnormalities in both types of infections are visually very similar to human perception, which made it difficult for radiologists to differentiate COVID-19 from other viral pneumonia without any drug examination. These difficulties and errors in diagnosis motivate the development of an AI/ML-based tool for auto-detection in real-time with increased specificity.
The AI-based detection models can help tremendously conduct major highly performing screening programs in various regions worldwide. Many attempts on deep learning-based techniques for the diagnosis of diseases using images have been made previously. Many of them utilize the Convolutional Neural Networks (CNN) based classification and detection models. One such study conducted by Kang et al. [6] utilizes the Inception migration-learning model to train 217 Computed Tomography (CT) scans. The random selection of the Regions of Interest (ROIs) was followed, and they achieved a specificity of 0.805 and a sensitivity of 0.84 for validation with an accuracy of 83%.
Wang et al. [7] proposed a CNN-based architecture, COVID-Net, which resulted in a sensitivity of 0.80, specificity of 0.889 and accuracy of 92.4%. This is also one of the first open-source networks to discover COVID-19. Shouman et al. [8] obtained
In a similar context, Bhattacharya et al. [9] presented a detailed survey, summarized the state-of-the-art research works related to deep learning applications for COVID-19 medical image processing and provided an overview of deep learning and its applications to healthcare found in the last decade. Oztoprak et al. [10] collected 717 CT images of 350 patients from a medical research facility and used a CNN-based network that suppresses noise to remove interference from low-dose CT images. They provided lung segmentation from CT images and applied quantum Fourier transform while preprocessing stage, and achieved 99.5%, 99.2%, 99.0%, 99.7%, and 99.1% in the context of performance criteria viz., accuracy, precision, sensitivity, specificity, and f1 score, respectively. In similar interest, Ismail et al. [11] used techniques like deep feature extraction using pre-trained CNN models like ResNet (18, 50, 101), VGG (16, 19), fine-tuning the pre-trained CNNs, and the Support Vector Machine (SVM) as the classification head with varying kernel functions like Linear, Quadratic, Cubic and the Gaussian over a dataset of 180 COVID-19 and 200 healthy chest X-Ray images. The highest all accuracy score of 94.7% was achieved with a sensitivity of 91% and a specificity of 98.89%. Alshazly et al. [12] experimented with Explainable COVID-19 detection upon two different CT image datasets, namely the SARS-Cov-2 CT scan and the COVID19-CT and achieved average accuracy, precision, sensitivity, specificity, and F1-score values of 92.9%, 91.3%, 93.7%, 92.2%, and 92.5% on the COVID19-CT dataset. The authors explored and visualized the learned features using the t-SNE algorithm, where the resulting visualizations showed well-separated clusters for COVID-19 and non-COVID-19 cases. Aslan et al. [13] explored deep learning architectures for COVID-19 infection detection with ANN-based segmentation onto chest scan images in the first stage, data augmentation to improve generalization ability. With 85% of images as training data, the authors implemented pretrained modified AlexNet and one with BiLSTM layer, thus considering the temporal features into the image and achieved a classification accuracy of 98.14% and 98.7% for both architectures, respectively.
Saiz et al. [14] used the VGG16 with the SSD300 and some pre-processing techniques on the images and got to the specificity of 0.92 and a sensibility of 0.9492. The work suggested a need to experiment with the other variants of SSD for such image-based diagnostics. We also experimented with this proposal using the SSD512, replacing the conventional VGG16 with the Residual Network101, while introducing the prediction modules. With a bigger dataset but the same pre-processing methods, we achieved a specificity of 0.926267 and a sensibility of 0.949485. Although this was an improvement, it required further improvisations for a practical possibility, as discussed in the following sections.
This study uses a robust detection network aimed particularly for the COVID-19 detection. The model proposed implements the Deconvolutional Single Shot Detector (DSSD) [15] in which SSD [16] along with Residual-101 [17] is augmented with deconvolution layers. In object detection for small objects, the accuracy was observed to improve when the additional large-scale context was introduced. The training data images were also pre-processed using the Contrast Limited Adaptive Histogram Equalization (CLAHE) [18], and extensive augmentation techniques like Random Cropping, Random Flipping and photometric distortion were also applied before training for effective and acceptable results.
In this section, we will first confer about the choices made like the choice of DSSD over SSD as detector network, drawbacks of conventional SSD and how modifications can help. The detailed methodology and pre-processing steps have been discussed in Section 3. Section 4 will analyze the structure of the dataset used, the model’s training, hyper-parameter selection, and the results obtained. Lastly, we will estate the concluding remarks and further possibilities for the model.
The SSD is constructed on top of a base network and is docked with some convolution layers at the end and a series of increasingly smaller Conv layers to make multiple-scale detection predictions, as added in blue in Fig. 2. For every feature map cell, several priors or default boxes of variable scales and aspect ratios are generated by the input map’s regular tiling. These boxes are equivalent to the “Anchors” in the study of Faster R-CNN [19]. These priors are matched with the Ground Truth Boxes using the Jaccard Index threshold and classified as negative or positive samples.
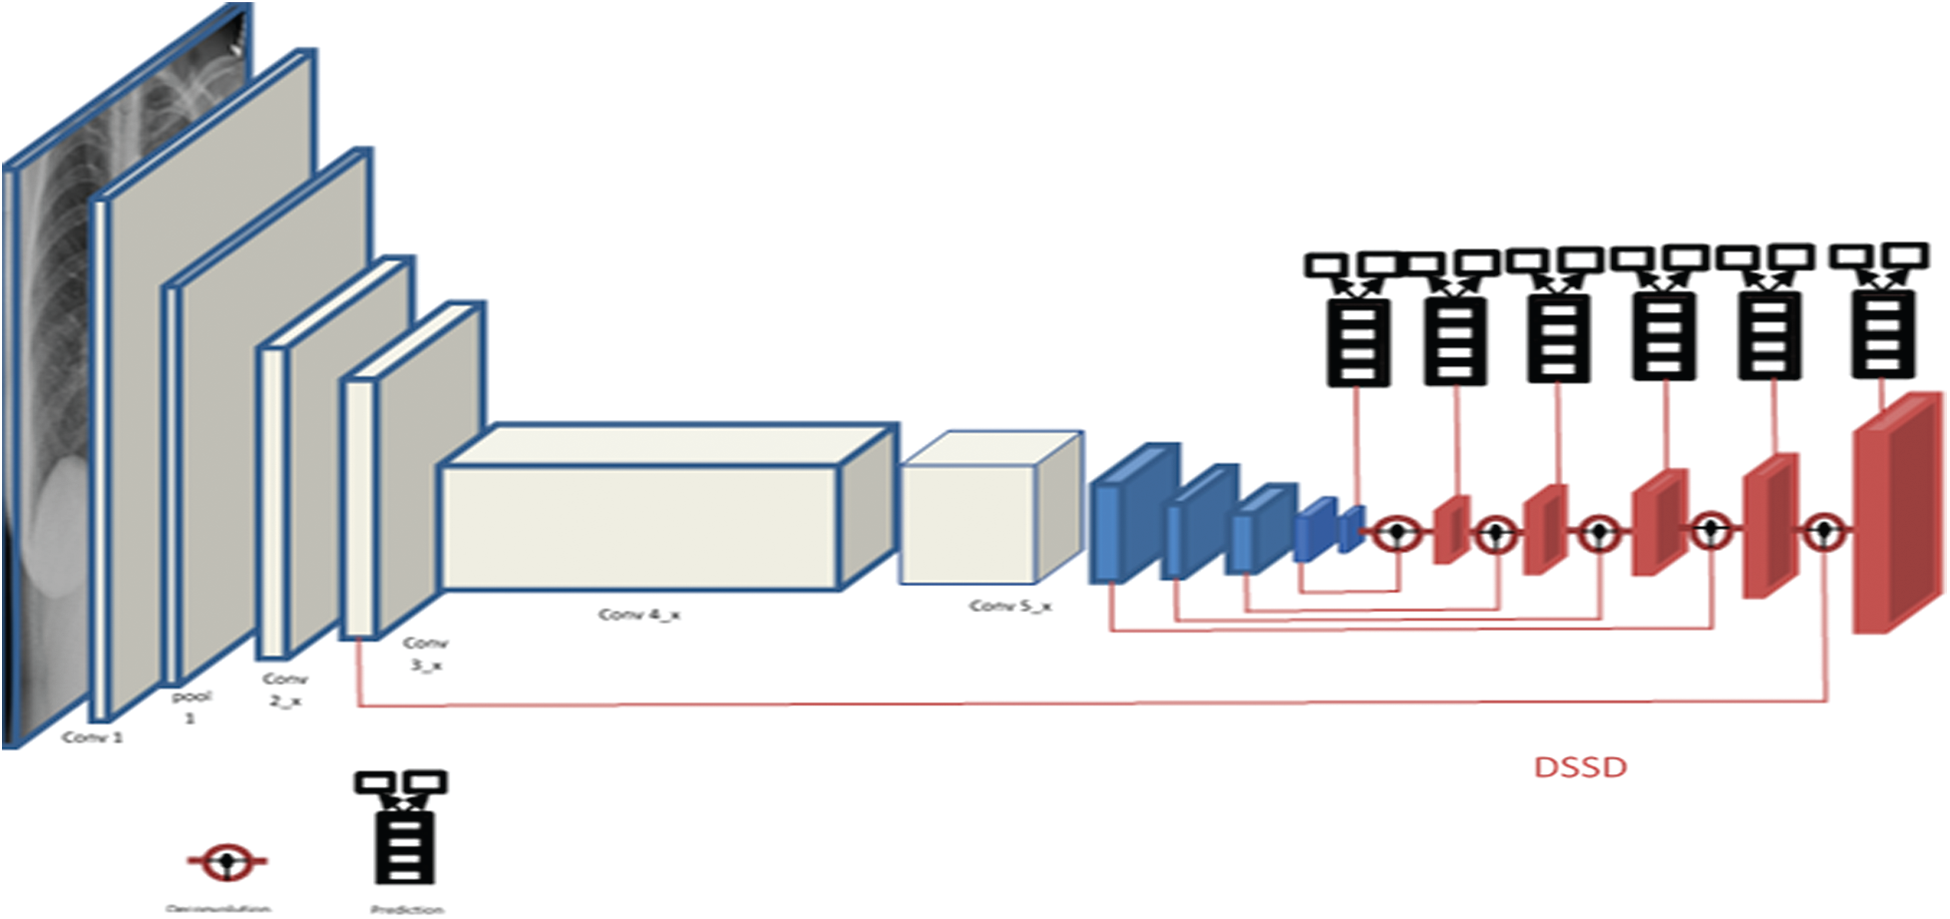
Figure 2: Shows DSSD layers and convolutional layers
The model incorporates multi-scale function maps and default boundary boxes to classify objects on various scales. At each function map cell, offsets are calculated relative to default box shapes in the cell and per-unit ratings, which signify the location of the class instance in each of these boxes. Non-Maximum Suppression (NMS) is used for post-prediction analysis, and final identification tests are obtained.
For the detection of COVID-19 from Chest X-Ray (CXR) Images, as per discussion done in Section 1.2, it can be concluded that the prime focus of the proposed model should be to learn to differentiate between CXR scans of common pneumonia and the COVID-19 pneumonia. Since the visuals are similar to a large extent, it’s difficult for humans to diagnose. Since the pixel values in the regions with these indications (GGO, SWC, CPP) can never be exactly similar in CXR scans of both the infections.
Expecting differences in both types of scans at smaller levels, which is the ‘worth focusing part of a model, we propose a Deconvolutional SSD with some tasks-specific pre-processing model for the detection. It should be well noted that the size of the ground truth boxes won’t shrink much; instead, the model will be able to learn the differences with higher precision with the help of DSSD as it is chosen primarily so to ‘not dilate’ the features' information in the image that is essential to learn the said difference.
In a CNN, the receptive fields are different for nodes in different layers. Also, the smaller regions of an input map (image/feature map) would shrink tremendously after passing through multiple pooling layers. Hence, the layers with larger receptive fields, also called higher/later layers, should predict larger objects and vice-versa for small objects. The SSD architecture distributes multi-scale (MS) default boxes to multiple layers, thereby compelling predictions for a certain scale to each layer in the ConvNet. Hence SSD doesn’t make relatively good predictions for small objects.
Their study on MS-CNN [20] applied deconvolution over multiple layers before region proposals and feature pooling to scale up the feature’s map resolution. It is concluded that layers with small receptive fields (shallow layers) and dense feature maps need to be used as information sources for better detection of small objects. Since the shallow layers don’t incorporate much semantic information about objects, just using these can result in low performance.
A possible solution to above-mentioned issues is using the same deconvolution operations onto dense feature maps and injecting more semantic information into them. The proposed solution will solve the shrunken-resolution-of-feature maps-problem (by deconvolution), and the shallow layers will contain rich context information (by Deconvolution Modules). This approach is also implemented in the Multi-Region CNN study [21]. The authors tried to pool features from pre-defined regions such as half-parts, center, border and context area, and the region proposal.
The model proposed for better COVID-19 diagnosis utilizes the DSSD and an unbalanced encoder-decoder hourglass structure to pass context information before any predictions. The base network chosen is the ResNet101 which is also an optimal choice as the skip networks between convolutional blocks help diminish the effects of disappearing gradient, allowing the network to go deeper.
The primary structure over which the DSSD is developed, i.e., SSD + ResNet101, isn’t a major improvement in itself. The study on DSSD has shown that adding a Prediction Module increases the performance significantly and verified this from an ablation study as in Tab. 1. While studying MS-CNN, the accuracy can be improved by modifying the subnetwork for each task. The SSD feature extraction layers have to learn to generate maps representing spatial, semantic information and the right transformations. Also, it has to undo previous transformations before selecting the best for a scale.
But adding Prediction Modules (PMs) to the network would now require feature extraction layers to learn representing information from an image, and PMs are now able to learn the transformations. In their study on DSSD, the researchers have also convinced well in Tab. 1 that the Prediction Module 3c as in Fig. 3c outperforms the other three, i.e., conventional SSD approach shown by block in Fig. 3a, version of the residual block with skip connection as in Fig. 3b and two sequential residual blocks are shown in Fig. 3d. Following this and DSSD, we use one residual block, as shown in Fig. 3c, for the individual prediction layer.
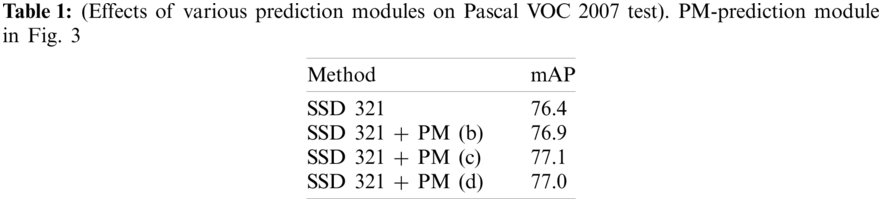
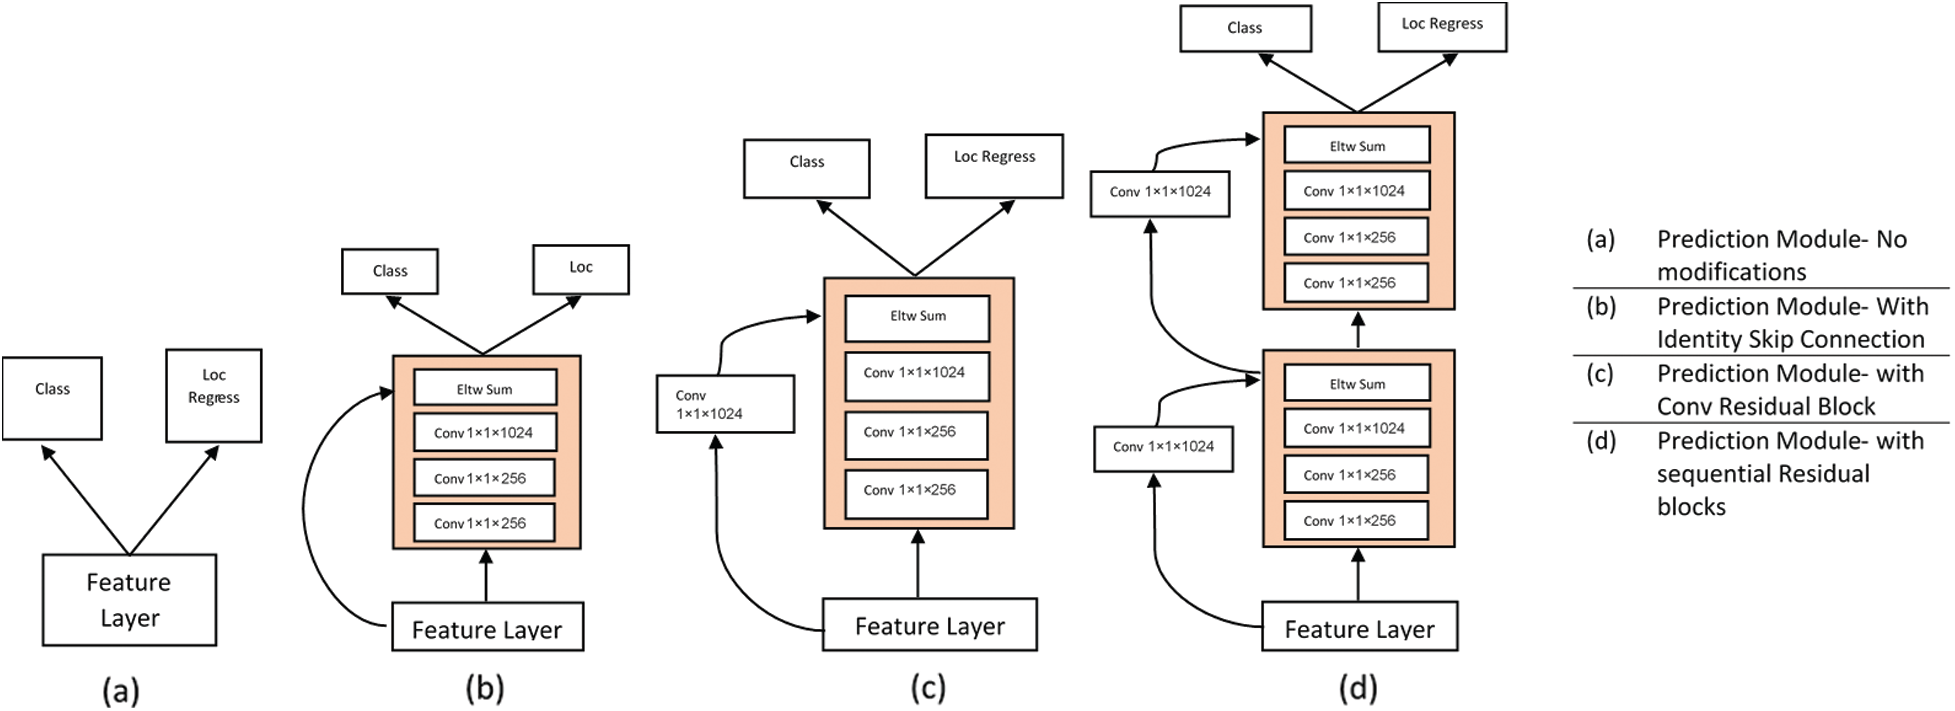
Figure 3: Shows different variants of prediction modules (PM)
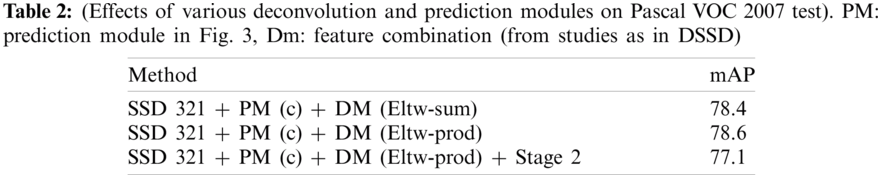
The Deconvolution Modules (DMs) are used to integrate information from earlier deconvolution layers and feature maps to solve the problem, as discussed in Section 2.3. Solid circles in Fig. 2 show the DM module. Learned transposed convolution (or deconvolution) layers are used for optimum results instead of just a deconvolution operation by convolution layer before sampling. As shown in Fig. 4, other than implementing learned deconvolution, the DMs’ modifications add batch-normalization layer after every convolution layer and use the element-wise product (Eltw: p) instead of the sum experimentally claimed using Tab. 2.
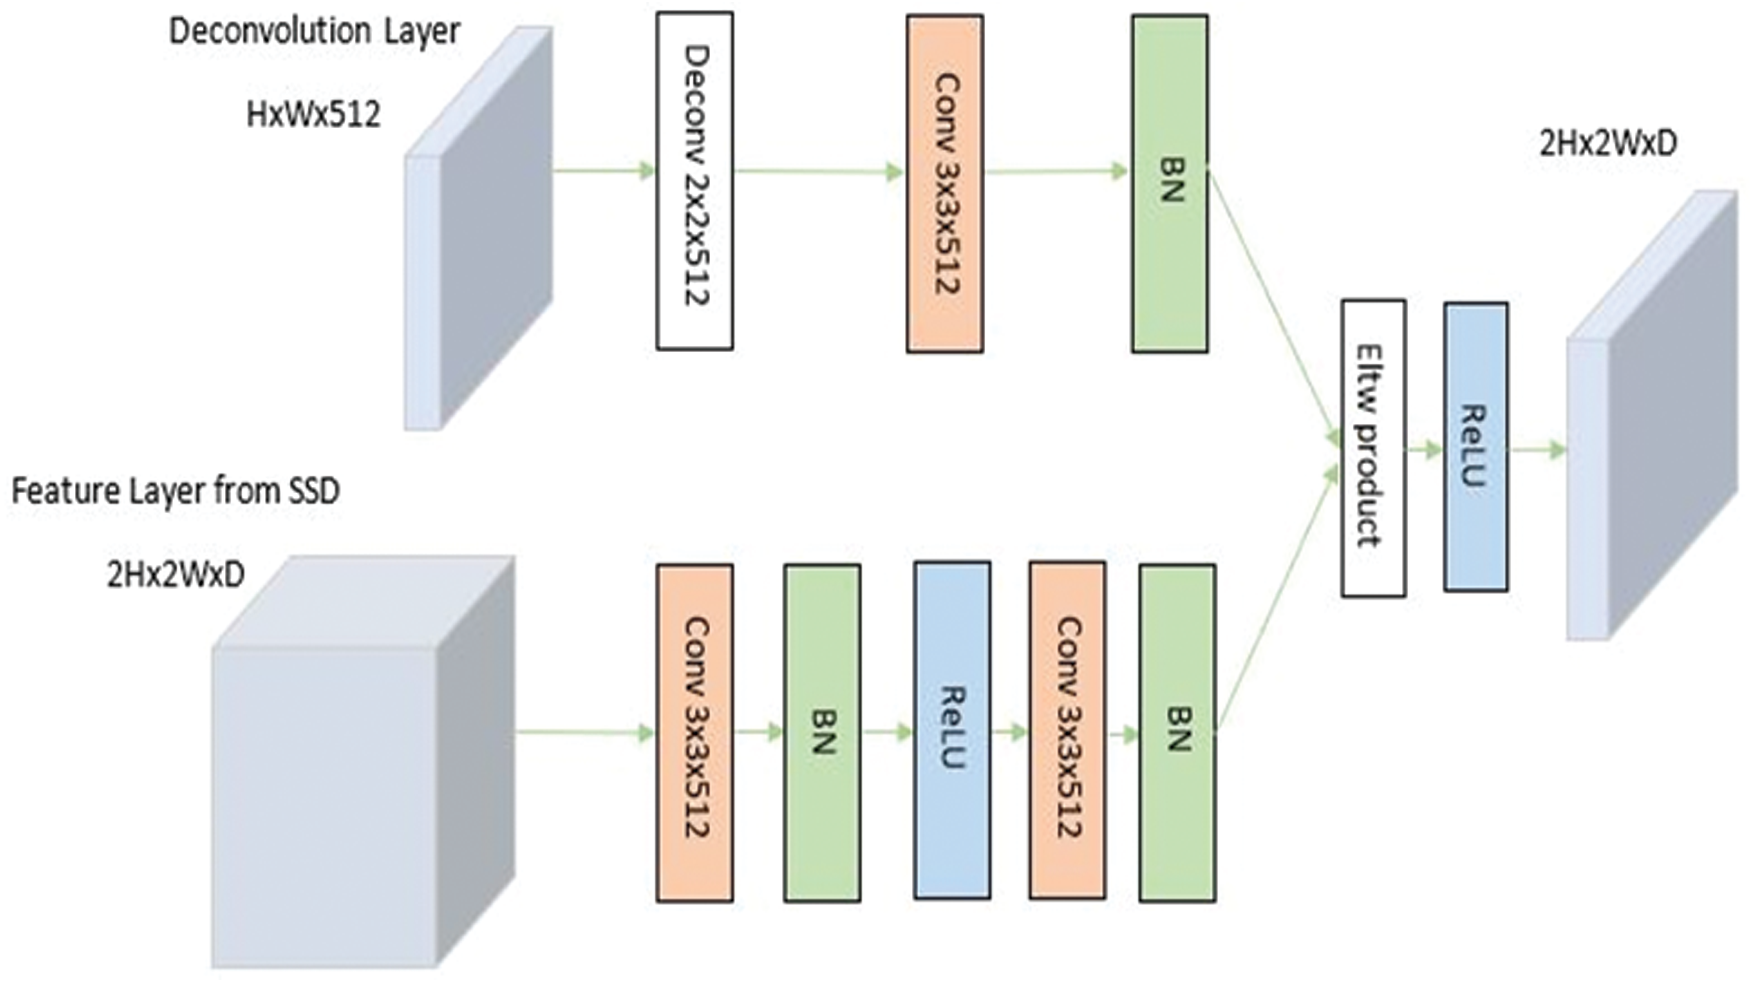
Figure 4: Shows deconvolution module
In research done by Basha et al. [22], some liberated electrons, due to thermionic emission, get electrically attracted towards the anode. This collision onto the target (tungsten) results in photons’ emission in X-Ray Spectrum, thereby forming the basis of X-Ray Image formation. The important point is that the filament gets heated (resulting in thermionic emission) due to current flow. That means the visual measures of an X-Ray Image are directly affected by the Voltage Spikes. Hence, all of the X-Ray Scans worldwide can’t be synchronized in terms of these parameters. Another factor affecting the contrast of these images is the Exposure Time which refers to the time interval through which the X-Rays are produced.
In work done on improving contrast for images in X-ray imaging, low-level exposure is maintained until the scanning process for the region of interest (ROI) is completed. Hence, the images so-obtained are often with a low signal-to-noise ratio. It is now clear that all the X-Ray images are needed to be combined in contrast. Therefore, the Contrast Limited Adaptive Histogram Equalization (CLAHE) is used before training over the dataset's input images. In Contrast Limited Adaptive Histogram Equalization, contrast amplification is limited due to the adaptive histogram equalization. This algorithm is applied to an X-Ray image by dividing the image into equal size as in Fig. 5.
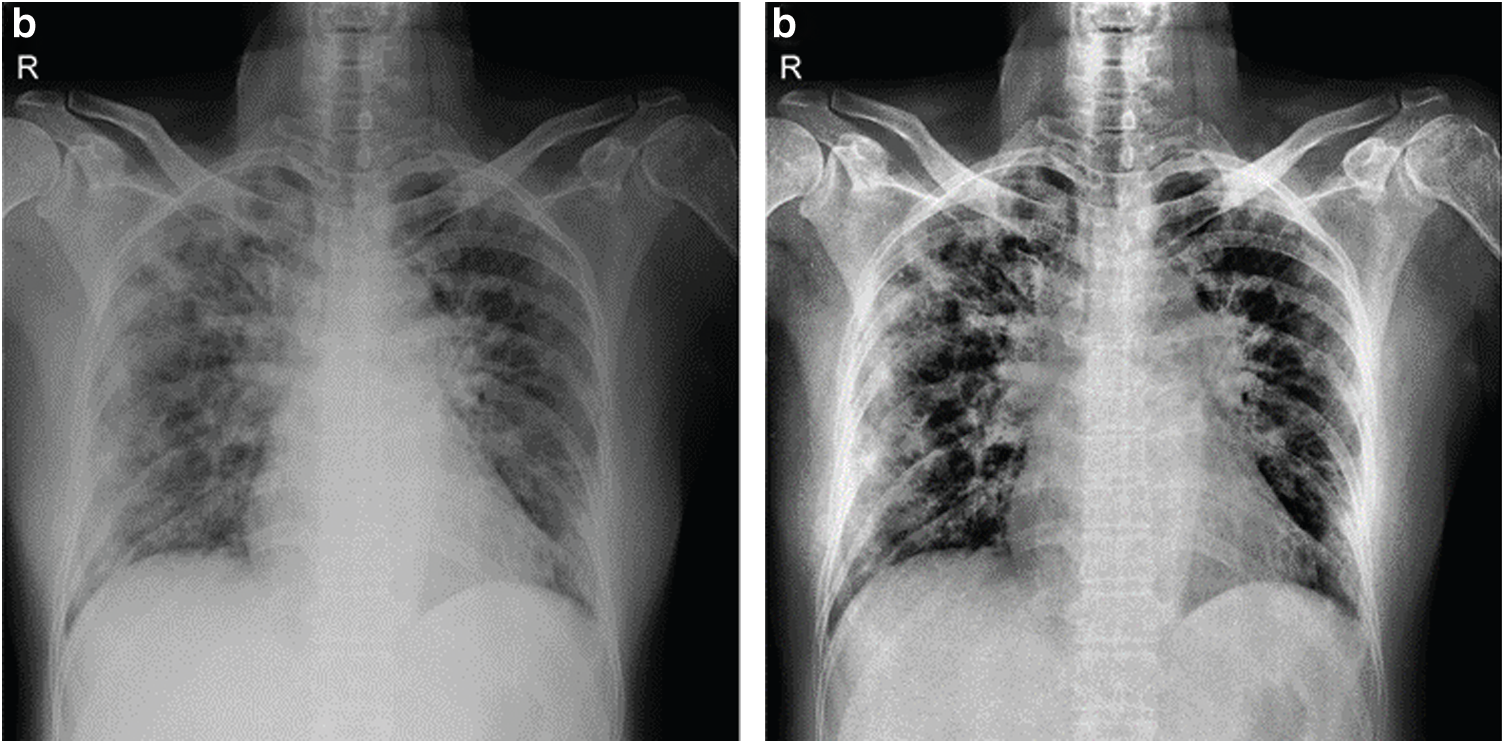
Figure 5: Shows original x-ray image on left and CLAHE processed image on right
It has been observed that applying CLAHE to images before training improves the model-performance measurements (accuracy, sensibility, specificity) by a considerable amount. This can be realized from Tab. 3. Also, since ResNet101, a much deeper network than the VGG-Net, is used, the image size was set to be larger, i.e., [512, 512]. This model was implemented on MATLAB; a part of the code for reference can be read in Fig. 6. Extensive data augmentation techniques like randomly flipping, cropping, and photo-metric distortion, are also used.
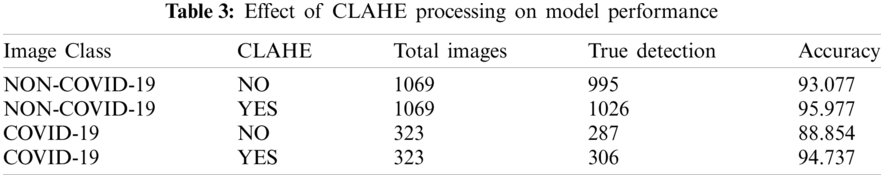
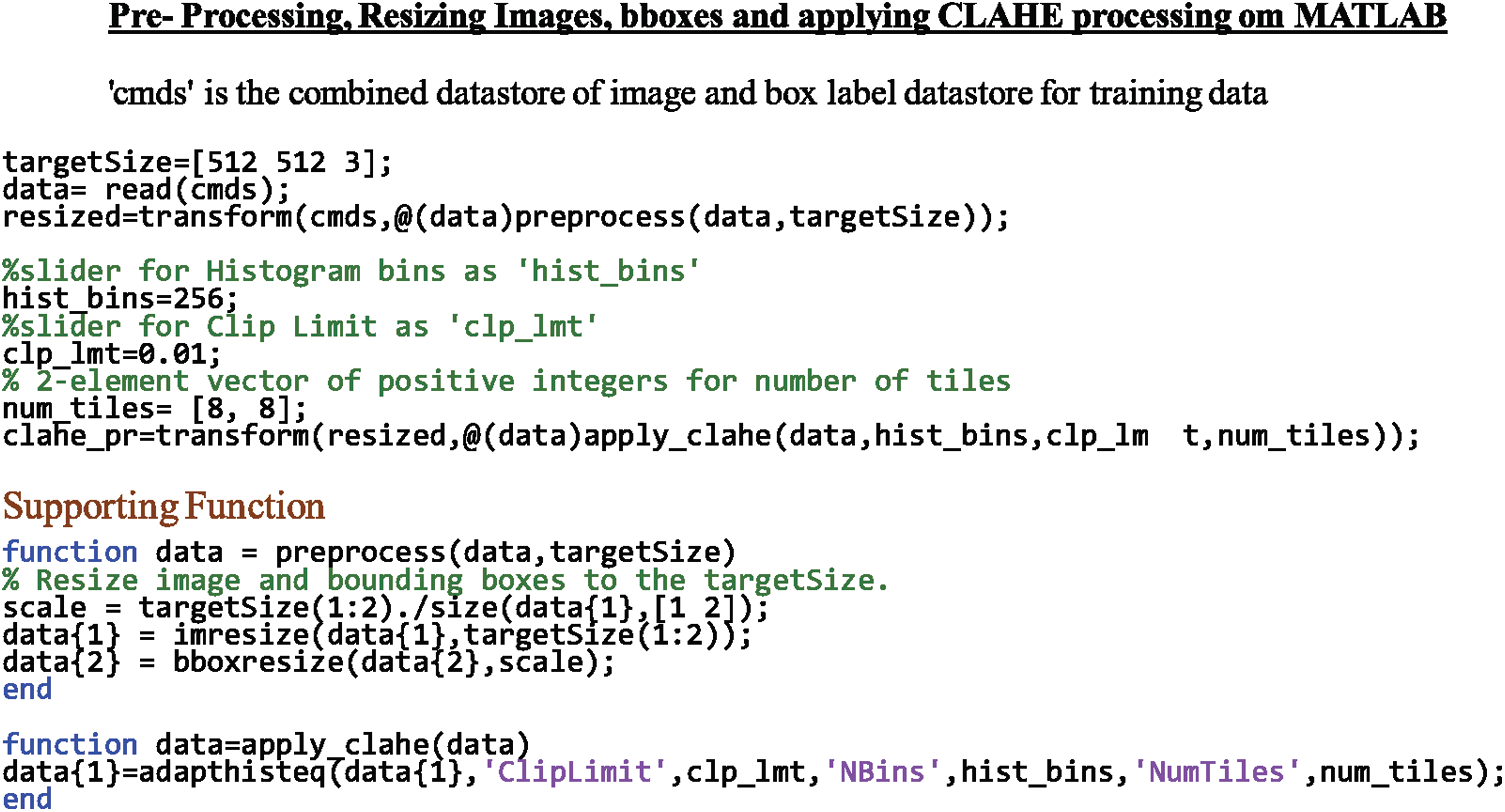
Figure 6: Shows the code-snippet implementing resizing and CLAHE pre-processing on MATLAB for reference
As explained in previous sections, the proposed model uses ideas from numerous previous studies. We used the Deconvolution Modules (DM) and the Prediction Modules (PM) as a potentially good modification, but not for detecting small-sized images like in its study on DSSD itself. Instead, we use their concept of Transposed Convolution and feature injection to address the problem of similarity in visual findings, as explained in Section 1.2. Secondly, we increased the image input size to help various factors, including deep base-network. The Pre-processing methods are also very particular to the problem-in hand. Lastly, the decision to select hyper-parameters, as discussed in the next section, was done after insights from studies like DSSD and similar. None of the models proposed previously, one of them being the conventional SSD300 + VGG16, combine these modifications and implementations, proving the validity of the idea proposed.
4 Training, Results and Discussion
As already discussed in Sections 1.2 and 2.2, a COVID-19 detection model needs to learn the differences in imaging features for both types of infections. Hence, the image dataset to be used has to constitute images of both classes. This way, the model will result in fewer false positives while inference.
The COVIDx Dataset [23] has been set to be the direct source. There are five different open-source chest radiography datasets [24–28] as this source’s constituents. There are about 473 C: X-Ray Images of COVID-19 cases. The number of images of Pneumonia cases is higher than ‘required.’ These images of class Pneumonia need to be shuffled randomly and select several images for our model to maintain a balance between images in both categories. We merged this dataset with [29] for enlarging the dataset.
The split of the dataset was done as follows-
(a) Balancing the image dataset for both categories with a difference in several image instances is roughly not more than 10%.
(b) For the training and validation dataset, roughly (78
(c) For the testing dataset, roughly 20% of available COVID-19 X-Ray Images and (25
This should be certainly observable that there are more images of class Pneumonia in the test dataset. This is for getting better insights into the model’s performance, as it should distinguish between both classes by giving fewer false positives. The training steps followed are-
(a) Implement the conventional SSD training approach, i.e., match a set of anchors to target ground truth boxes using Jaccard index, selecting non-matched samples. Their ratio with matched is 3:1 and finally minimizes the joint localization and confidence losses.
(b) Next, use this trained SSD as a pre-trained model for DSSD, as in the original work. Freeze the SSD side, and train the deconvolution side only for this stage.
(c) Finally, fine-tune the entire network.
(d) The batch size is 16/32, preferably.
(e) All of the training is done in two steps, with a decrease in the learning rate.
(f) Choose the anchor boxes based on the specific training data as discussed below.
We estimated the anchor boxes from the training data using the IoU distance metric. The number of anchor boxes was chosen empirically, i.e., using the measure of mean IoU of boxes in each cluster via k-means clustering with IoU. The trade-off between the mean IoU and the number of anchors is shown in Fig. 7. Empirically, we determined the optimal number of anchor boxes be 9.
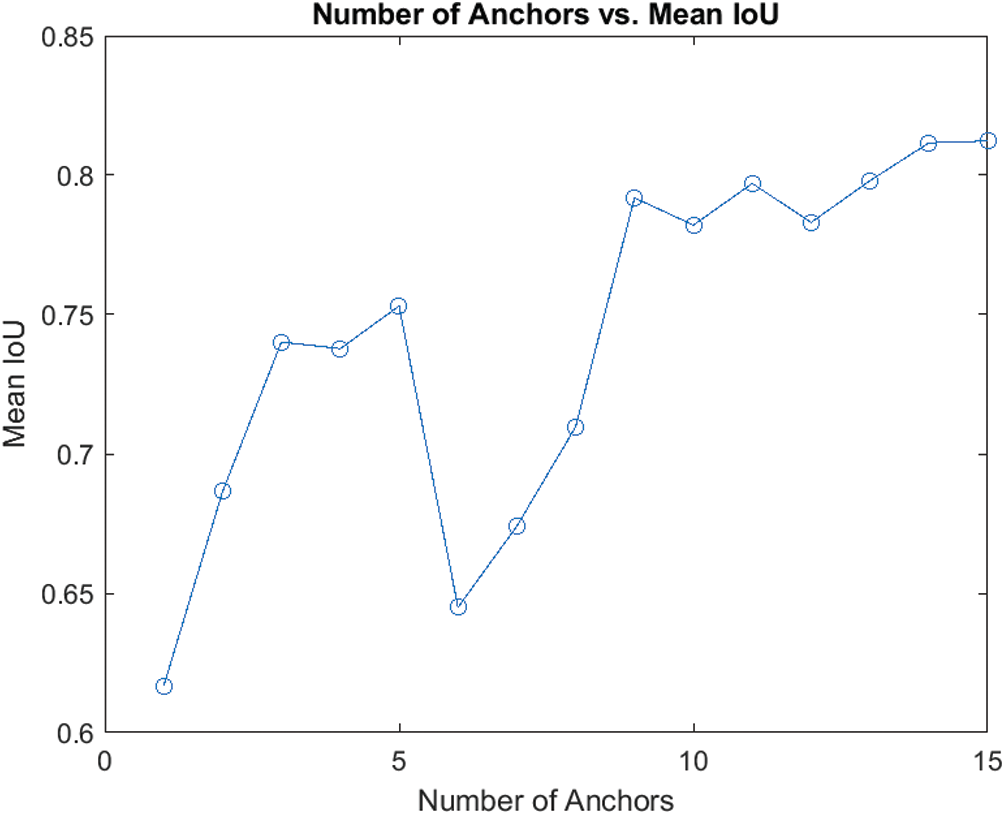
Figure 7: Trade-off between mean IoU and no. of anchors
The architecture of the proposal as a flow chart can be studied from Fig. 8 below.
As also represented in Fig. 8, the images are augmented for the training part and preprocessed for both the training and testing portions after splitting the images with ground truth data. Then, after allowing the SSD-Conv layers to learn, pass the training stage to the DSSD-layers while subsequently freezing the SSD-layers. Finally, after fine-tuning this entire network, it is ready to be fed by the augmented testing images’ dataset, producing the detection output.
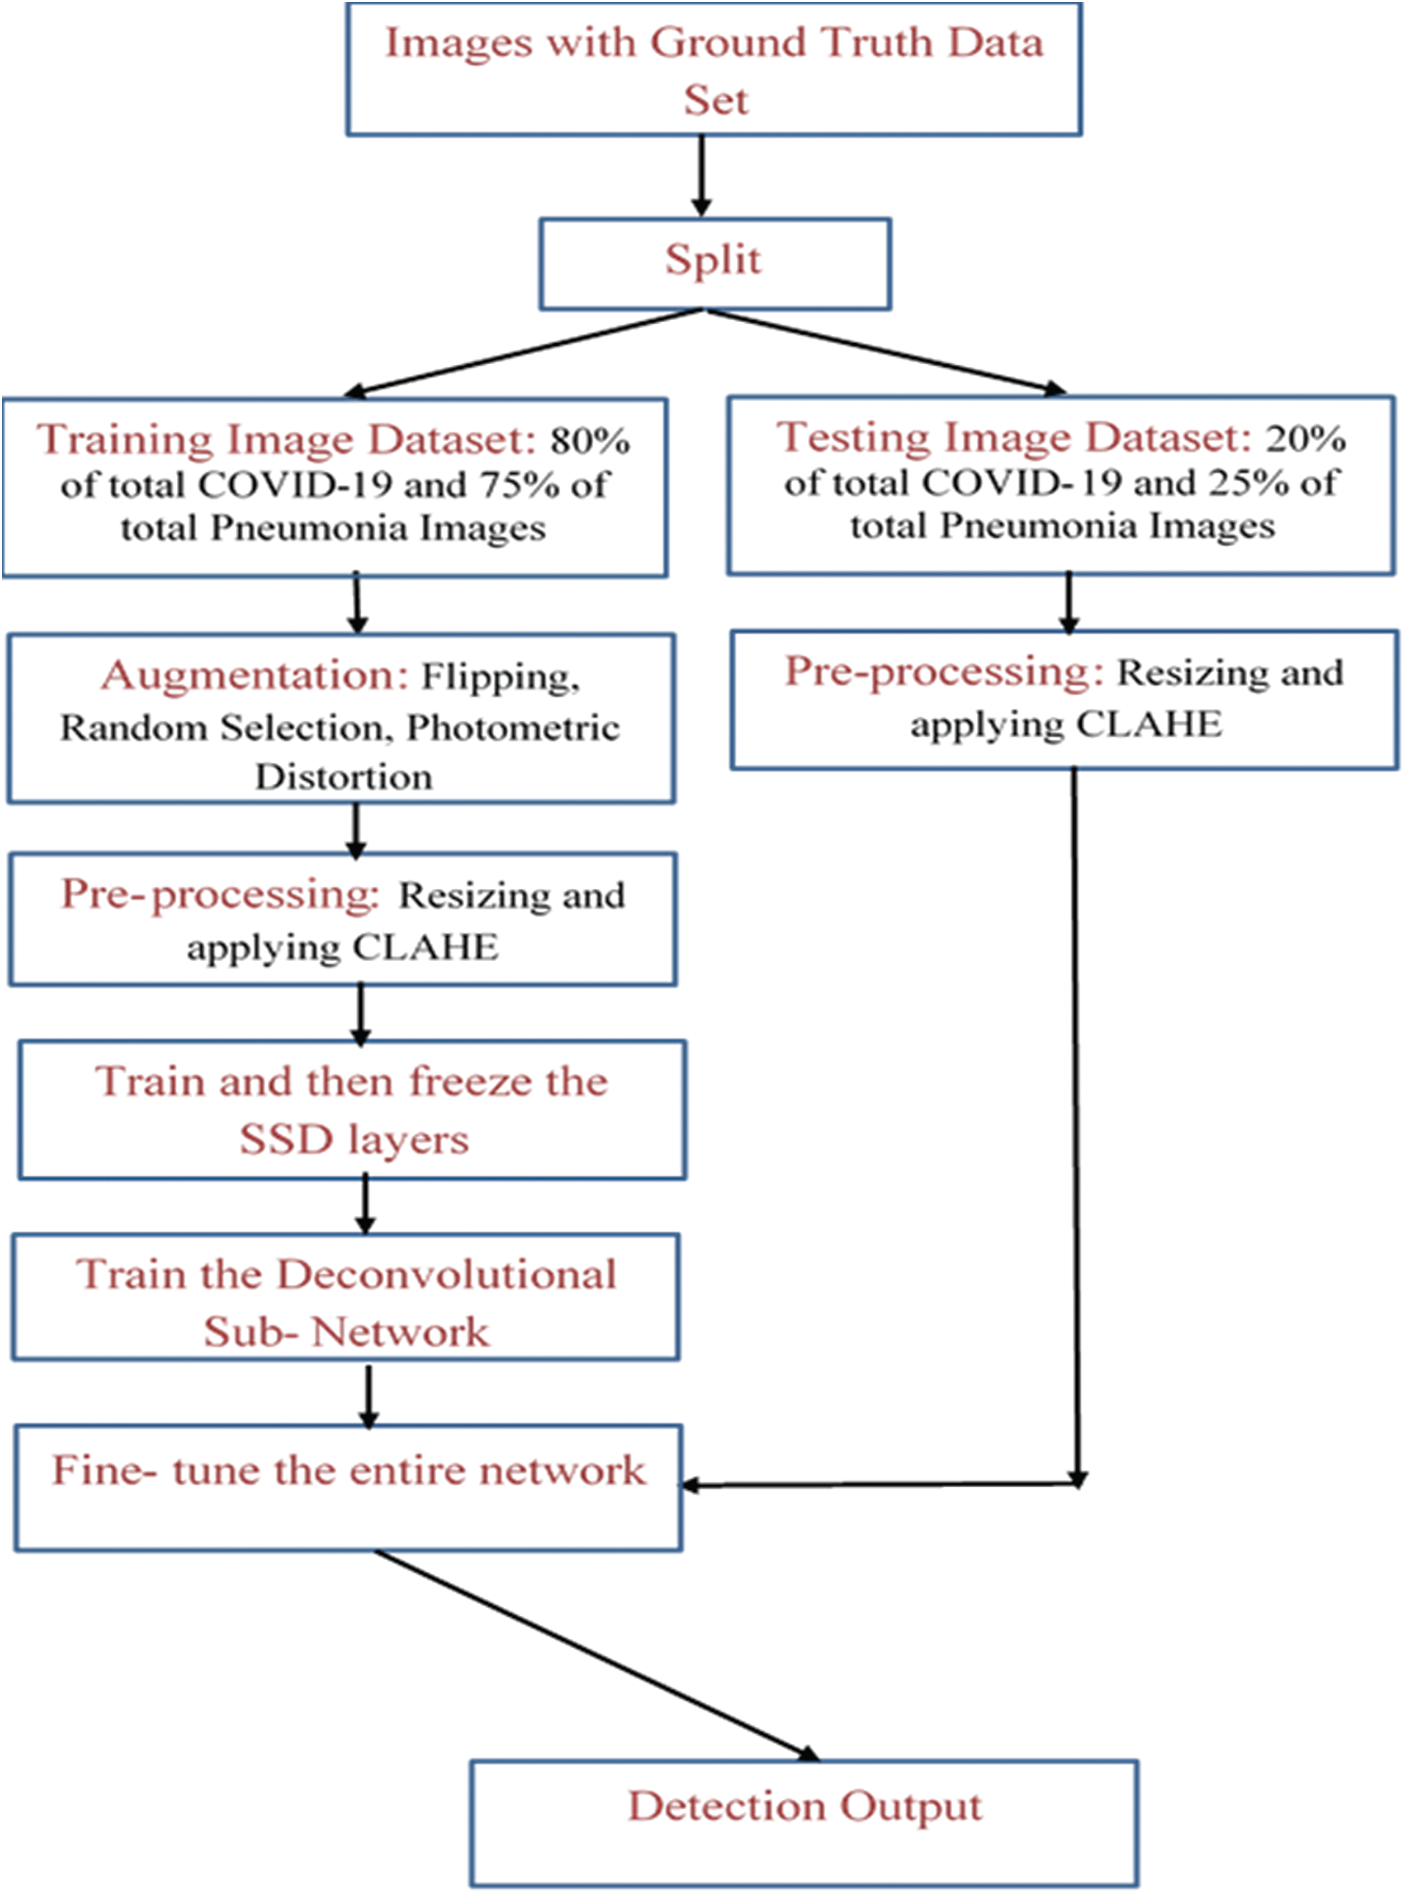
Figure 8: Shows flow chart of the proposed architecture
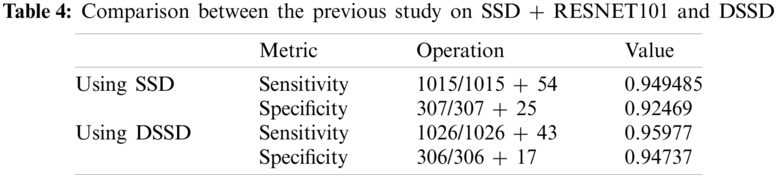
We also did a similar study with SSD512 + ResNet101 and prediction modules earlier and achieved a sensitivity of 94.95% and a specificity of 92.47% with considerable accuracy relative to previous works in the domain. With the proposed methodology in this study, with the said-hyperparameters, we achieve 95.97% of sensitivity and 94.74% specificity, clearly claiming improvement over the previous model. The comparison in both and the result of this study are displayed in Tab. 4. It can be analyzed from this data that the inclusion of methodology elements like the Deconvolution modules helps enhance the model’s performance; hence, it is the right choice combined with the technical proof of necessity in previous sections. Particularly, the specificity measure jumps with a considerable margin, making the model a potential candidate for a solution to the problem of similarity in Viral Pneumonia and CoVID-19 on images as discussed in previous sections.
With near 95% of sensitivity and specificity, our study suggests that this model will not only predict the COVID-19 cases correctly with high precision but also be performing comparatively well in case of detecting a Non-COVID-19 case, which highlights that our model performs comparatively better at recognizing the difference between COVID-19 and other viral infections like the Pneumonia, which as discussed in the previous sections, was a major problem. The simulation results as inflow of True Positive Rate vs. False Negative Rate to analyze the robustness of the proposed model can be studied from the plot in Fig. 9 below.
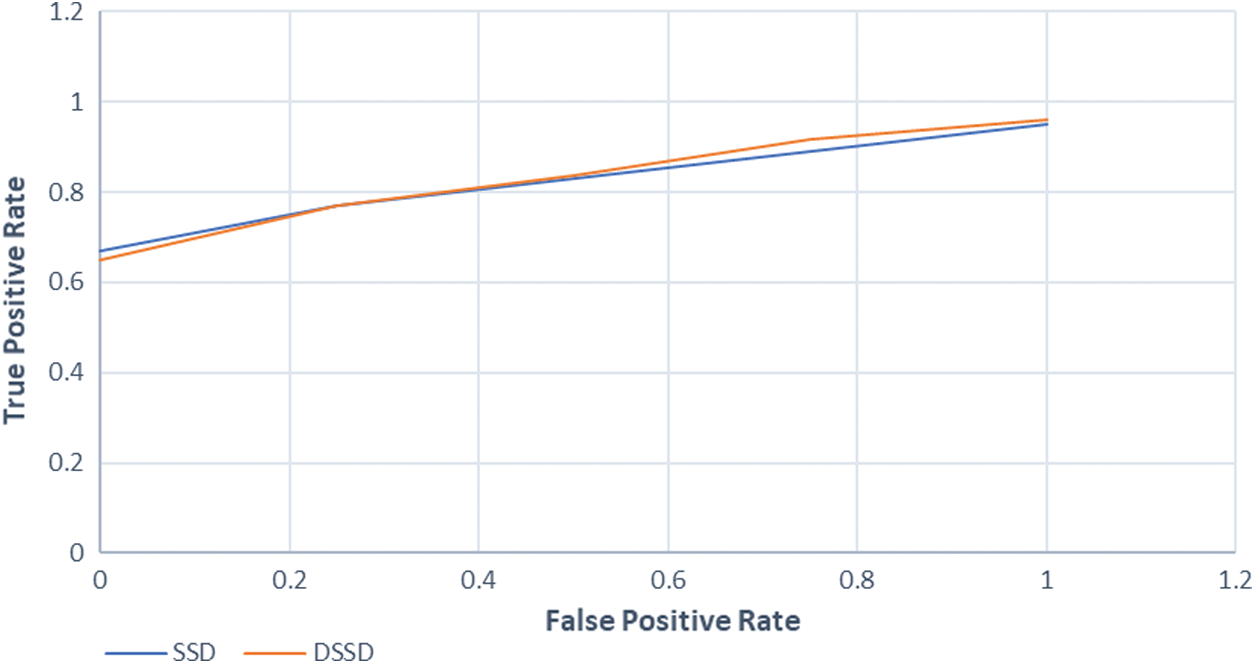
Figure 9: Shows relation between true positive and false positive rate
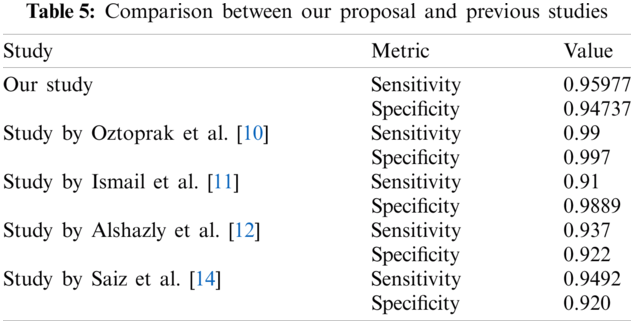
We also tabulated prediction results from two previous studies using Deep-Learning based methods at the same task in Tab. 5 below. Undoubtedly, the four other studies compared in Tab. 5 used distinct and varying techniques in their methodology. As clear from the metric values, our study almost outperforms competitively, thereby further improving the study’s credibility for the task.
As already discussed above, this model utilizes the DSSD approach extensively while addressing the should-be focus of any detection models for COVID-19, unlike previous works. Also, it results in competitive model performance metrics concerning previous studies. We implemented various preprocessing techniques like CLAHE, augmentation, etc. and chose hyperparameters of the model, particularly focusing on Deep Learning-based models at this task. Furthermore, we utilized the idea of transposed convolution, prediction modules and information injection into the DSSD network with the ResNet101 as its base network. The competitive results demonstrate the highly potent use of Deep-Learning techniques in Computer Vision/Medical Imaging.
The proposed methodology certainly performs better than most of the existing ones at this task. Yet, there are margins of further development, in the sense that mere COVID-19 detection models like these won’t be able to interpret the severity of a positively infected patient. Surely, diagnosis of any infection, by its definition, includes both the disease detection as well as analysis of its severity, in case it is present. Also, as discussed previously and as proved by various medical studies, the severity of these types of infections depends upon the intensity of the lesion/markings on the Chest X-Ray/Chest CT images. Hence, Machine Learning/Deep Learning entirely can simultaneously also predict the severity of a patient. This can also help medical professionals prioritize the patients complaining about the infection. Secondly, there are several variants/extensions to DSSD, like the Multi-Scale DSSD [30]. These can also experiment with the increasing number in the image dataset. Another important aspect of being developed is the potential use of the technology for tasks like a prediction of some other infection/disease from visual data, particularly in cases where a similar problem arises, i.e., its ideally harsh for any model to distinguish between two classes which differ only at smaller-level. Clearly, with the uprising of Deep Learning based methods in the Medical Diagnosis Industry, such methodologies might prove to be meeting the criteria for practical implementation.
Funding Statement: The authors received no specific funding for this study.
Conflicts of Interest: The authors declare that they have no conflicts of interest to report regarding the present study.
1. W. Organization, “Use of chest imaging in COVID-19: A rapid advice guide, 11 June 2020,” World Health Organization, vol. 12, no. 1, pp. 1–25, 2020. [Google Scholar]
2. F. Song, N. Shi, F. Shan, Z. Zhang, J. Shen et al., “Emerging 2019 novel coronavirus (2019-nCoV) pneumonia,” Radiology, vol. 295, no. 2, pp. 210–217, 2020. [Google Scholar]
3. D. Wang, B. Hu, C. Hu, F. Zhu, X. Liu et al., “Clinical characteristics of 138 hospitalized patients with 2019 novel coronavirus-infected pneumonia in Wuhan, China,” JAMA, vol. 323, no. 2, pp. 1061–1069, 2020. [Google Scholar]
4. M. Cellina, M. Orsi, M. Panzeri, G. Byl and G. Oliva, “Chest X-ray findings and visual quantitative assessment of COVID-19 pneumonia,” Research Square Preprint, vol. 20, no. 2, pp. 12–34, 2020. [Google Scholar]
5. M. Parekh, A. Donuru, R. Balasubramanya and S. Kapur, “Review of the chest CT differential diagnosis of ground-glass opacities in the COVID era,” Radiology, vol. 297, no. 1, pp. 289–302, 2020. [Google Scholar]
6. S. Wang, B. Kang, J. Ma, X. Zeng, M. Xiao et al., “A deep learning algorithm using CT images to screen for corona virus disease (COVID-19),” MedRxiv, vol. 23, no. 1, pp. 1–27, 2020. [Google Scholar]
7. L. Wang, Z. Lin and A. Wong, “Covid-net: A tailored deep convolutional neural network design for detection of Covid-19 cases from chest X-ray images,” Scientific Reports, vol. 10, no. 3, pp. 1–12, 2020. [Google Scholar]
8. E. Hemdan, M. Shouman and M. Karar, “Covidx-net: A framework of deep learning classifiers to diagnose covid-19 in X-ray images,” arXiv preprint arXiv: 2003.11055, vol. 20, no. 2, pp. 1–14, 2003. [Google Scholar]
9. S. Bhattacharya, P. Maddikunta, Q. Pham, T. Gadekallu, C. Chowdhary et al., “Deep learning and medical image processing for coronavirus (COVID-19) pandemic: A survey,” Sustainable Cities and Society, vol. 65, no. 3, pp. 102589, 2021. [Google Scholar]
10. E. Acar, B. Oztoprak, M. Resorlu, M. Das, I. Yilmaz et al., “Efficiency of artificial intelligence in detecting COVID-19 pneumonia and other pneumonia causes by quantum fourier transform method,” MedRxiv, vol. 12, no. 3, pp. 13–34, 2021. [Google Scholar]
11. A. Ismail and A. Şengür, “Deep learning approaches for COVID-19 detection based on chest X-ray images,” Expert Systems with Applications, vol. 164, no. 2, pp. 114054, 2021. [Google Scholar]
12. H. Alshazly, C. Linse, E. Barth and T. Martinetz, “Explainable COVID-19 detection using chest CT scans and deep learning,” Sensors, vol. 21, no. 2, pp. 455–463, 2021. [Google Scholar]
13. M. Aslan, M. Unlersen, K. Sabanci and A. Durdu, “CNN-based transfer learning-BiLSTM network: A novel approach for COVID-19 infection detection,” Applied Soft Computing, vol. 98, no. 2, pp. 106912, 2021. [Google Scholar]
14. F. Saiz and I. Barandiaran, “COVID-19 detection in chest X-ray images using a deep learning approach,” International Journal of Interactive Multimedia and Artificial Intelligence, vol. 1, no. 1, pp. 1–4, 2020. [Google Scholar]
15. C. Fu, W. Liu, A. Ranga, A. Tyagi and A. Berg, “DSSD: Deconvolutional single shot detector,” arXiv preprint arXiv: 1701.06659, vol. 13, no. 4, pp. 12–23, 2017. [Google Scholar]
16. W. Liu, D. Anguelov, D. Erhan, C. Szegedy, S. Reed et al., “SSD: Single shot multibox detector,” in European Conf. on Computer Vision, Riva del Garda, Italy, pp. 21–37, 2016. [Google Scholar]
17. K. He, X. Zhang, S. Ren and J. Sun, “Deep residual learning for image recognition,” in IEEE Conf. on Computer Vision and Pattern Recognition, Las Vegas, Nevada, USA, pp. 770–778, 2016. [Google Scholar]
18. A. Reza, “Realization of the contrast limited adaptive histogram equalization (CLAHE) for real-time image enhancement,” Journal of VLSI Signal Processing Systems for Signal, Image and Video Technology, vol. 38, no. 2, pp. 35–44, 2004. [Google Scholar]
19. S. Ren, K. He, R. Girshick and J. Sun, “Faster R-CNN: Towards real-time object detection with region proposal networks,” IEEE Transactions on Pattern Analysis and Machine Intelligence, vol. 39, no. 2, pp. 1137–1149, 2016. [Google Scholar]
20. Z. Cai, Q. Fan, R. Feris and N. Vasconcelos, “A unified multi-scale deep convolutional neural network for fast object detection,” in European Conf. on Computer Vision, Amsterdam, Netherlands, pp. 354–370, 2016. [Google Scholar]
21. S. Gidaris and N. Komodakis, “Object detection via a multi-region and semantic segmentation-aware cnn model,” in IEEE Int. Conf. on Computer Vision, Convention Center, Santiago, Chile, pp. 1134–1142, 2015. [Google Scholar]
22. S. Basha, D. Rajput, N. Iyengar and R. Caytiles, “A novel approach to perform analysis and prediction on breast cancer dataset using R,” International Journal of Grid and Distributed Computing, vol. 11, no. 2, pp. 41–54, 2018. [Google Scholar]
23. S. Ahmed, M. Yap, M. Tan and M. Hasan, “Reconet: Multi-level pre-processing of chest X-rays for covid-19 detection using convolutional neural networks,” medRxiv, vol. 13, no. 1, pp. 1–9, 2020. [Google Scholar]
24. R. Kalkreuth and P. Kaufmann, “COVID-19: A survey on public medical imaging data resources,” arXiv preprint arXiv: 2004.04569, vol. 11, no. 2, pp. 1–4, 2004. [Google Scholar]
25. D. Haritha, C. Praneeth and M. Pranathi, “Covid prediction from X-ray images,” in 5th Int. Conf. on Computing, Communication and Security, IIT, Patna, Bihar, India, pp. 1–5, 2020. [Google Scholar]
26. P. Afshar, S. Heidarian, F. Naderkhani, A. Oikonomou, K. Plataniotis et al., “Covid-caps: A capsule network-based framework for identification of covid-19 cases from X-ray images,” arXiv preprint arXiv: 2004.02696, vol. 12, no. 3, pp. 1–6, 2004. [Google Scholar]
27. S. Rajpal, N. Kumar and A. Rajpal, “Cov-elm classifier: An extreme learning machine based identification of COVID-19 using chest X-ray images,” arXiv preprint arXiv: 2007.08637, vol. 22, no. 3, pp. 1–8, 2007. [Google Scholar]
28. B. Cruz, J. Sölter, M. Bossa and A. Husch, “On the composition and limitations of publicly available COVID-19 X-ray imaging datasets,” arXiv preprint arXiv: 2008.11572, vol. 23, no. 2, pp. 1–9, 2008. [Google Scholar]
29. S. Gazzah and O. Bencharef, “A Survey on how computer vision can response to urgent need to contribute in COVID-19 pandemics,” in Int. Conf. on Intelligent Systems and Computer Vision, Fez, Morroco, pp. 1–5, 2020. [Google Scholar]
30. L. Cui, R. Ma, P. Lv, X. Jiang, Z. Gao et al., “MDSSD: Multi-scale deconvolutional single shot detector for small objects,” arXiv preprint arXiv: 1805.07009, vol. 14, no. 2, pp. 1–4, 2018. [Google Scholar]
 | This work is licensed under a Creative Commons Attribution 4.0 International License, which permits unrestricted use, distribution, and reproduction in any medium, provided the original work is properly cited. |