DOI:10.32604/cmc.2022.019381
| Computers, Materials & Continua DOI:10.32604/cmc.2022.019381 | |
| Article |
A Robust MPPT Control Based on Double Ended Forward Converter Architecture
1University of Engineering & Technology, Lahore, 54000, Pakistan
2University of Central Punjab, Lahore, 54000, Pakistan
3Ghulam Ishaq Khan Institute of Engineering Sciences and Technology, Swabi, 23430, Pakistan
*Corresponding Author: M. Usman Khan. Email: engrmusman.khan@gmail.com
Received: 10 April 2021; Accepted: 11 May 2021
Abstract: In this paper, a stand-alone photovoltaic (PV) system based on a Double Ended Forward Converter (DEFC) is presented. The proposed converter is specified for 48 V, 100 W applications as most of the equipment used in telecommunication and aircraft fall in this range. The literature has limited potential application of DEFC in PV systems. The research work deals with an in-depth study of DEFC and proposes an improved DEFC for PV applications with battery backup. Besides, a bi-directional dc-dc converter for the battery is integrated to track the Maximum Power Point (MPP) of the PV generator. The converter is examined under variable irradiance and load conditions, and the analytical analysis of boundary conditions are implemented. The converter’s architecture also ensures built-in I-V curve tracing for the identification of MPP of PV generator. It offers low voltage stresses across switches and avoids sinking power supply and core resetting circuits. The topology’s behavior is analyzed based on MPP achievement and maintaining output under different conditions of battery backup availability, environmental, and load conditions. The PV system architecture is designed and analyzed theoretically and verified with simulations on the PSIM software.
Keywords: Photovoltaic; power converter; forward converter; double ended forward converter; bi-directional dc-dc converter; MPP; I-V curve tracing
Energy demands are multiplying as the technology evolves without any boundary limits in the modern era. The demand in the energy sector is forecasted to rise by 56% from 2010 to 2050, which certainly will increase the pollution factor due to carbon dioxide emissions [1]. PV energy is a type of renewable energy that has several advantages compared to other renewable energy sources. These systems are easy to install and do not demand any kind of topological studies, as in the case of wind and hydro energy. PV systems have more applications than any other renewable source such as more electric aircraft, solar vehicles, parking stations, telecommunication, and building integrated PV systems [2]. Stand-alone PV systems are vital in remote and agriculture areas where infrastructure is less developed. This paper is primarily related to stand-alone PV systems.
A typical stand-alone PV system integrated with battery backup is presented in Fig. 1. The major problem related to a stand-alone PV system is dynamic weather, as its output depends on solar irradiance. Passing clouds and unavailability of solar irradiance during the night time are significant concerns that emphasize the use of energy storage elements like a battery. A stand-alone PV system with battery backup ensures an uninterruptable power supply to the load. Furthermore, in stand-alone PV systems, Maximum Power Point Tracking (MPPT) is attainable only in the case of battery backup [3]. In the literature, a number of researches have been carried out to extract maximum power under dynamic weather conditions. The basic algorithm of MPPT is Perturb and Observe (P&O), which tracks the MPP by simply measuring voltage and current from the PV array [4]. This method works pretty well under uniform weather conditions but collapses in changing weather. Another well-known MPP algorithm is Incremental Conductance (IC), which has the same disadvantages as P&O [5]. These two basic algorithms also suffer in terms of tracking efficiency. The concept of variable step size is instigated to increase the tracking efficiency [6]. Some other renowned algorithms are Open Circuit Voltage (OCV) and Short Circuit Current (SCC) algorithms [7]. The disadvantage with these algorithms is the complexity of the hardware. These methods are used in common with other algorithms like an artificial neural network [8], evolutionary algorithm [9], fuzzy logic based [10], and genetic algorithm [11] to increase efficiency and performance.

Figure 1: Typical stand-alone PV system
A stand-alone PV system with battery backup, having the ability to track MPP is proposed [12]. It has the disadvantage of using dump loads to dissipate excess energy. A stand-alone PV system having high voltage gain and high efficiency is presented [13]. The drawback of this architecture is the absence of battery backup hence resulting in no electrical MPPT. A {dc-dc} boost converter for stepping up the PV voltage and a bi-directional dc-dc converter for battery backup is introduced [14]. This topology is unable to extract MPP from the PV generator under dynamic weather and load conditions. An upgraded MPPT based PV system architecture involves dc-dc converter, and H-bridge inverter is discussed [15]. This architecture offers improved performance; however, it collapses under severe irradiance conditions due to the absence of the Battery Energy Storage System (BESS). Hybrid control of MPPT and Desired Power Control (DPC) for retaining the State of Charge (SOC) of the battery is analyzed in [16]. The drawback of this architecture is the complexity of the controlling algorithm and hardware components.
The dc-dc converters are categorized as isolated and non-isolated converters depending on isolation. In isolated converters, inductors and transformers are used to offer galvanic isolation between input and output, whereas, in non-isolated converters, both sides have common ground [17]. Isolated converters employ high-frequency transformers for high voltage gain and offer more safety and can provide multiple outputs compared to the coupled inductor of non-isolated converters. A fly-back converter is the most commonly used isolated converter. Its subtypes are active clamp fly-back converter, an inverted fly-back converter, a fly-back converter with RCD snubber, two switches fly-back converter, and dual ac-dc fly-back converter [18]. A hybrid converter consists of a push-pull circuit on the output side, and a full-bridge circuit on the input side is proposed [19]. It has the disadvantage of circuit complexity and current ripples.
Coupled inductor converters have low rating components, low current stresses, and uncomplicated winding [20]. Interleaved type of dc-dc converters is utilized in the applications requiring high power. These inductor based dc-dc converters offer low efficiency because of high leakage inductance during off time causing high voltage spikes and during off time causing current spikes across the switches. Passive and active clamp circuits are introduced to diminish the effects of leakage inductance. Active clamp circuits contain switches along with passive circuit elements compared to only passive components of passive clamp circuits. Passive clamp circuits offer greater efficiency as they are free of conduction losses across the switch [21]. To increase efficiency and voltage gain, a coupled inductor type dc-dc converter with a passive clamp circuit is proposed [22]. Coupled inductors are integrated with an intermediate capacitor and voltage multiplier to attain high voltage gain [23]. A variable inductance based buck converter is proposed for micro-grids having a wide range of voltage operation and higher efficiency [24]. The primary disadvantage of this converter is high voltage stresses across switching devices and high ripples.
From the preceding discussion, the following drawbacks of conventional dc-dc converters are concluded:
• Due to the high current flow at the transformer’s primary side, the inductor gets affected and results in severe losses.
• High voltage spikes start appearing across the switches. Consequently, not only the breakdown voltage rating of the switching devices becomes stringent, but the conduction losses also become higher.
• Snubber circuits and sinking supplies are essential to dissipate excess energy from magnetic components.
• Due to multiple switches and magnetic components, the staircase effect arises, resulting in flux imbalance.
• To trace the I-V curve for the identification of MPP, extra circuits are necessary, which results in the complexity of the control and system architecture.
• In stand-alone PV systems, dump loads are critical components to avoid overcharging of the battery.
The proposed PV system architecture offers the following features:
• The proposed system architecture offers a built-in I-V curve tracing for the identification of MPP. Since the PV generator is predominantly a current source, an extra capacitor Cin, needs to be installed at the input. The proposed topology employs the same capacitor in the I-V curve tracing.
• Since the forward converter requires a sinking supply at the input side, the PV generator and the installment of Cin provide the mean of that sinking supply.
• The presented power conditioning circuit offers Required Power Tracking (RPT) depending on the load requirement, weather conditions, and state of the battery to avoid dump loads.
• The given converter has low voltage stresses across the switches and low inductive spikes because of the input capacitor and the converter architecture.
• The proposed converter topology eliminates the staircase effect and flux imbalance caused by magnetic components.
The paper is organized as follows, Section 2 presents the proposed converter topology and its working mode follows up by overall control operation with battery backup in Section 3. Sections 4 offers the mathematical designing of the components. Simulation results are presented in Sections 5 and 6 presents concluding remarks.
2 Converter Topology and Operation
Fig. 2 presents the proposed PV system architecture, which comprises a DEFC and a bi-directional dc-dc converter with battery backup.

Figure 2: Proposed PV system architecture
DEFC contains two switches (S1 & S2), a transformer with the ratio of Ns/Np, two input diodes (D1 & D2), two output diodes (D3 & D4), an inductor (L1), an output capacitor (Co) and the load (RL). Similarly, a bi-directional dc-dc converter consists of an inductor (L2), a battery (B), and the two switches (S3 & S4). An input capacitor (Cin) is employed with the PV source for curve tracing. The simultaneous switching of S1 and S2 results in on-mode and off-mode of the system as presented in Figs. 3a and 3b.
On-Mode: In on-mode, S1 and S2 are turned on simultaneously, resulting in the forwarding of power from the PV generator to the load. The diodes D1 and D2 are reverse biased, and the current directions are presented in Fig. 3a. The transformer’s Np winding gets charged from the PV source, and the same power is delivered at the secondary side. The D3 gets forward biased and provides the path to charge L1, at the same time, satisfies the load.

Figure 3: Different modes of the proposed topology (a) On-mode (b) Off-mode
In the given DEFC topology, the switches S1 and S2 are turned on simultaneously, and also the output side of DEFC is a buck topology, the following equation is valid.
where Vpv is the voltage across the PV generator, Ns/Np is the transformer ratio, and
The optimal value for the RL is designed by using impedance modeling.
Putting Eq. (1) in Eq. (2), RL is calculated as,
Off-Mode: In off-mode, S1 and S2 are turned off, result in reversing the polarity and the current direction in the Np winding of the transformer, as presented in Fig. 3b. The D1 and D2 provide a freewheeling path to the Np winding of the transformer, which discharges into Cin, thus avoiding any snubber circuit and sinking supply. At the secondary side, D4 provides freewheeling to L1, maintaining the output at the load side.
Bi-directional dc-dc converter: The bi-directional dc-dc converter also operates in two modes resulted by alternative switching of S3 and S4. The functioning of the bi-directional dc-dc converter depends on (1) state of the battery, (2) load conditions, and (3) weather conditions. The parameters mentioned above are strongly linked with each other. If the power required by the load is greater than the power generated by PV, then battery discharges depending on its discharge voltage (VD) and vice versa happens if the power required is less than the generated power.
I-V curve tracing: The proposed PV system architecture offers a built-in I-V curve tracing for the identification of MPPT, as shown in Fig. 4a. The curve is traced with the assist of Cin by isolating both the converters from the PV generator for a limited time interval. During this interval, power is delivered to the load by L1.

Figure 4: (a) I-V curve tracing using proposed topology (b) Scanning of PV with Cin
3 Control Operation and Overall Operating Modes of Architecture with the Battery Setup
As shown in the flow chart in Fig. 5, to initialize the tracing process, the duty cycle of the S1 and S2 is increased to a greater value, say 1, which assists in transferring the operating point at the start of the curve, as shown in Fig. 4b.
The required output power is estimated by calculating the value of RL using Eq. (3), where D1 = 1, Ipv and Vpv are instantaneous values from the PV generator. In the next step, both the converters are isolated from the PV generator by turning off S1–S3. At this instant, Cin starts charging from a value (near zero) to Voc, resulting in curve tracing. During the charging of the capacitor, the peak is identified by power subroutines returning MPP of the PV generator, as shown in Fig. 4b. The corresponding duty cycle for the identified MPP is calculated by modifying Eq. (3), and the operating point of the PV generator is shifted accordingly.
As shown in the flow chart in Fig. 5, the next step to I-V curve tracing is examining the output voltage status. When the output voltage is maintained at a level of 48 V means no change is essential in D1, the algorithm waits for a change in weather conditions.
Contrarily, if the output voltage drops from 48 V, the battery voltage (VB) status is investigated. Whenever VB is greater than VD, the battery discharges, and the load is maintained by battery and PV generator combine. On the other hand, if VB is less than VD, the system continues to operate only if Vo is in ±10% range; otherwise, the system shuts down. In case that Vo is not less than or equals to 48 V, battery status is checked. Suppose VB is less than VD, battery charges from the additional power extracted from the PV generator. Whereas, given VB greater than VD, the control shifts to RPT, which extracts only that much power required by the load. In this way, overcharging of the battery and the use of dump loads is avoided.

Figure 5: Flowchart of the control mechanism
Battery Stages: Every stand-alone PV system subjects to variable environmental and load conditions. To sustain the output and track the MPP, energy storage elements like batteries become the integrating part of the PV system. In this section, different stages according to the availability of battery, as presented in Fig. 6, are discussed.

Figure 6: Battery backup stages
Stage-1: Considering this stage when there is no battery for power backup; hence PV array is the only source to satisfy the load demand. The objective is to sustain the output voltage of 48 V and to attain MPP. Eqs. (1) and (3) are used to formulate the relation between Vo, Vmpp, and RL.
When the optimal value of RL is connected and has no battery backup provided, Vo and MPP are attained at designed D1.
Stage-2: In this stage, the battery is available for both charging and discharging. In the case of battery Eq. (6) can be modified to,
where
Due to variation in irradiance and load, the following scenarios can occur,
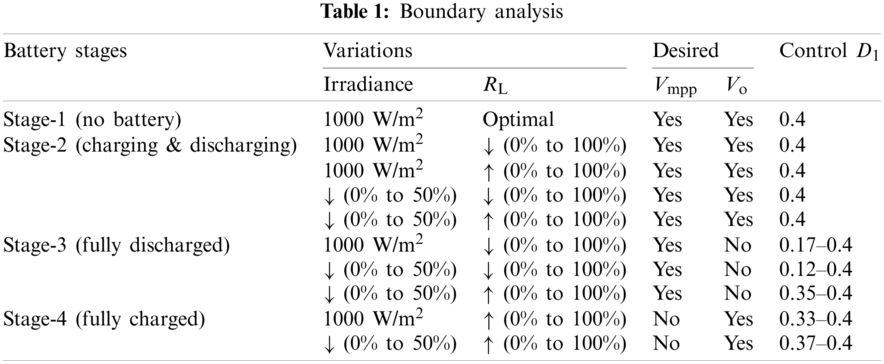
• Under standard testing conditions (STC), if the load resistance decreases or increases, to any value between 0 to 100%, the Eq. (6) states that the additional current is provided or stored in the battery to attain the output and MPP at the same time, as shown in Tab. 1.
• If the irradiance drops to any value between 0% to 50% and the load resistance decreases or increases to any value between 0% and 100%, the Eq. (6) states that the battery will provide or store the extra power to maintain output and MPP, as shown in Tab. 1.
Stage-3: In this stage, the battery is available for charging, which means
• Under STC, when the load resistance drops to any value between 0% to 100%, the battery is not available to meet the power demand. So, in this case, it is impossible to maintain the output; however, MPP is attained, as shown in Tab. 1.
• When irradiance drops to any value between 0% to 50% and the load resistance increases or decreases, to any value between 0% to 100%, in this case, only MPP is attainable, as shown in Tab. 1.
Stage-4: In this stage, the battery is available only for discharging, which means output is maintained in all the cases; however, MPP is impossible to attain.
• At STC or in case of irradiance drop to any value between 0% to 50%, along with the increase in load resistance to any value between 0% to 100%, the output is always maintainable by varying the duty cycle; however, MPP is not attainable as shown in Tab. 1.
Boundary Analysis: Considering battery stages, variation in irradiance, and load conditions, all the scenarios that can happen practically are presented in Tab. 1. The boundary conditions are defined as the irradiance level can increase or decrease by 50%, whereas RL can increase or decrease by 100%. Depending on these conditions, the control mechanism generates a respective D1 based on MPPT and RPT algorithms to attain the MPP output. The results prove that MPP and Vo are maintained when the battery is available for both charging and discharging; nevertheless, load and irradiance vary within boundary conditions. Whenever the battery is fully discharged, the proposed control ensures MPP but trade-off Vo. Similarly, when the battery is fully charged, Vo is always achievable regardless of MPP achievement.
This section presents the design of the proposed PV system architecture. All the components used are assumed to be ideal. The optimal value for the RL is designed in Eq. (3).
The value for
Using Eqs. (9) and (10), the value of the output capacitor is defined as,
where
where VB is the battery voltage, D2 is the duty cycle of the converter. The bi-directional dc-dc converter is a buck-boost converter having a relation,
This section presents the simulation results on PSIM software; the solar panel specification is shown in Tab. 2. The simulation parameters are calculated using equations derived in Section 4 and are shown in Tab. 3.


All the scenarios that can happen practically considering the weather, load, and battery conditions are simulated on PSIM, and the results are presented in Tab. 1. From all the scenarios, simulation results of 5 cases are presented in this section.

Figure 7: Simulation results when irradiance drops by 50% & the battery is available
Fig. 7 presents the scenario when the battery is available, and irradiance falls from the standard condition of 1000 W/m2. Initially, the proposed system architecture operates under the standard irradiance level and the optimal value of RL. During this period, Vo and MPP both are maintained as substantiated in Fig. 7. At t = 0.03 s, the cloud appears on the sky, and irradiance drops by 50%. In the meantime, I-V curve tracing initiates, and the novel MPP is tracked by applying the procedure described in the flowchart of Fig. 5. At t = 0.06 s, the status of the battery is inspected; in this case, the battery is available for both charging and discharging. As the power produced by the PV generator is insufficient to fulfill the load demand, therefore the battery is activated by modulating the batter duty cycle at t = 0.06 s to attain Vo and MPP. The need of 100 W by the load is satisfied by the PV generator and the battery together. Due to activation of the battery, Vo and MPP are achieved during this interval, as presented in Fig. 7.
Fig. 8 exhibits the case when the battery is available, and the RL drops from the designed value. At the start, the presented topology is functioning under the standard irradiance level and the designed value of RL. At t = 0.03 s, the value of RL at the user end rises by 100%, thus decreases the power demand at the output side. Meanwhile, I-V curve tracing instigates, and the new MPP is traced, as presented in Fig. 8. At t = 0.06 s, the status of the battery is examined; in this case, the battery is available for both charging and discharging. As the power generated by the PV array is surplus, the battery is activated to store surplus power by modulating its duty cycle at t = 0.06 s. PV array produces 100 W of power, from which 50 W is stored in the battery, and 50 W is delivered to the load. Due to activation of the battery, Vo and MPP are attained during this interval, as shown in Fig. 8.

Figure 8: Simulation results when RL increases by 100% & the battery is available
Fig. 9 shows the scenario when the battery is fully discharged, and the RL falls from the proposed value. At t = 0.03 s, the value of RL at the user end drops by 50%, thus increases the power demand at the output side. In the meantime, I-V curve tracing initiates, and the new MPP is found by employing the procedure described in the flowchart of Fig. 5. At t = 0.06 s, the status of the battery is reviewed; in this case, the battery is in a fully discharged state. As the power demanded by the load is greater than the power generated by the PV array, and the battery is fully discharged; consequently, it is impossible to maintain the Vo at the output side. Nonetheless, the MPP is tracked effectively by modulating the converter’s duty cycle, as presented in Fig. 9.

Figure 9: Simulation results when RL decreases by 50% & the battery is fully discharged
Fig. 10 presents the scenario when the battery is in a fully charged state, and the value of RL increases, whereas irradiance reduces from the standard value. In the beginning, the proposed converter architecture is operative under the standard irradiance level and the proposed value of RL. During this interval, Vo and MPP both are retained, as shown in Fig. 10. At t = 0.03 s, the value of RL rises by 100%, and at the same time, the irradiance level drops by 50%. Meanwhile, I-V curve tracing begins, and the new MPP is traced, as substantiated in Fig. 10. In the described scenario, the PV generator’s power decreases, and the load demand decreases simultaneously. At t = 0.06 s, the status of the battery is inspected, and the battery is in a fully charged state. The duty cycle of the converter is modulated to attain the required output voltage. However, it is impossible to achieve MPP as the battery is unavailable to store excess power, as presented in Fig. 10.

Figure 10: Simulation results when RL increases by 50%, irradiance decreases by 100%, and the battery is fully charged

Figure 11: Simulation results when RL increases by 100% & the battery is fully charged
Fig. 11 shows the scenario when the battery is fully charged, and the value of RL rises from the designed value. At the start, the proposed power conversion architecture is significant under the standard irradiance level and the designed value of RL. During this interlude, Vo and MPP both are retained, as shown in Fig. 11. At t = 0.03 s, the value of RL increases by 100%, thus reduces the power demand by the load. In the meantime, I-V curve tracing instigates, and the new MPP is hunted as presented in Fig. 11. At t = 0.06 s, the status of the battery is inspected, and the battery is in a fully charged state. In the described scenario, the power produced by the PV generator is greater than the load demand; therefore, RPT works by extracting the only required power to avoid overcharging of the battery. The duty cycle of the converter is modulated to attain the required output voltage; however, it is impossible to achieve MPP as the battery is unavailable to store surplus power as substantiated in Fig. 11.
This paper describes a stand-alone PV system based on DEFC having built-in I-V curve tracing to identify MPP with the assist of battery backup. The proposed architecture ensures MPPT without using any external hardware and complex control strategy. A comprehensive study is carried out to design the proposed topology parameters, and the boundary conditions are defined depending on irradiance, load, and battery availability. The proposed architecture offers low voltage stresses across switches and avoids sinking power supply and core resetting circuits. To prolong battery life, overcharging and deep discharging are eluded by replacing conventional MPPT by RPT, which extracts only required power. RPT prevents the extraction of excessive power from the PV generator and the use of dump loads. All the scenarios that can happen practically considering the weather, load, and battery conditions are simulated. The results prove that MPP and Vo are maintained when the battery is available for both charging and discharging; nevertheless, load and irradiance vary within boundary conditions. Whenever the battery is fully discharged, the proposed control ensures MPP but trade-off Vo. Likewise, when the battery is fully charged, Vo is always achievable regardless of MPP achievement.
Funding Statement: The authors received no specific funding for this study.
Conflicts of Interest: The authors declare that they have no conflicts of interest to report regarding the present study.
1. M. Vasiliev, Mikhail and K. Alameh, “Recent developments in solar energy-harvesting technologies for building integration and distributed energy generation,” Energies, vol. 12, no. 6, pp. 1080, 2019. [Google Scholar]
2. C. S. Lai, Y. Jia, L. L. Lai, Z. Xu, M. D. McCulloch et al., “A comprehensive review on large-scale photovoltaic system with applications of electrical energy storage,” Renewable and Sustainable Energy Reviews, vol. 78, pp. 439–451, 2017. [Google Scholar]
3. C. Lupangu and R. Bansal, “A review of technical issues on the development of solar photovoltaic systems,” Renewable and Sustainable Energy Reviews, vol. 73, no. 3, pp. 950–965, 2017. [Google Scholar]
4. R. Alik and A. Jusoh, “Modified perturb and observe (P&O) with checking algorithm under various solar irradiation,” Solar Energy, vol. 148, no. 3, pp. 128–139, 2017. [Google Scholar]
5. P. Singh, N. Shukla and P. Gaur, “Modified variable step incremental-conductance mppt technique for photovoltaic system,” International Journal of Information Technology, vol. 4, no. 1, pp. 1–8, 2020. [Google Scholar]
6. E. Heydari and A. Y. Varjani, “A new variable step-size P&O algorithm with power output and sensorless dpc method for grid-connected pv system,” in 10th Int. Power Electronics, Drive Systems and Technologies Conf., College Station, TX, USA, IEEE, pp. 545–550, 2019. [Google Scholar]
7. C. Basha and C. Rani, “Different conventional and soft computing MPPT techniques for solar PV systems with high step-up boost converters: A comprehensive analysis,” Energies, vol. 13, no. 2, pp. 371, 2020. [Google Scholar]
8. M. Arjun and J. Zubin, “Artificial neural network based hybrid MPPT for photovoltaic modules,” in Int. CET Conf. on Control, Communication, and Computing, Thiruvananthapuram, India, IEEE, pp. 140–145, 2018. [Google Scholar]
9. H. Wang and J. Shen, “An improved model combining evolutionary algorithm and neural networks for PV maximum power point tracking,” IEEE Access, vol. 7, pp. 2823–2827, 2018. [Google Scholar]
10. H. Rezk, M. Aly, M. Al-Dhaifallah and M. Shoyama, “Design and hardware implementation of new adaptive fuzzy logic-based MPPT control method for photovoltaic applications,” IEEE Access, vol. 7, pp. 106427–106438, 2019. [Google Scholar]
11. L. Zaghba, M. Khennane, A. Borni, A. Fezzani, A. Bouchakour et al., “A genetic algorithm based improve P&O-pi mppt controller for stationary and tracking grid-connected photovoltaic system,” in 7th Int. Renewable and Sustainable Energy Conf., Agadir, Morocco, IEEE, pp. 1–6, 2019. [Google Scholar]
12. M. Dezhbord, M. Babalou, V. Marzang, P. Alavi, S. H. Hosseini et al., “A new high step-up three-port DC-DC structure for hybrid pv/battery energy systems,” in 10th Int. Power Electronics, Drive Systems and Technologies Conf., Shiraz, Iran, IEEE, pp. 509–514, 2019. [Google Scholar]
13. E. T. Maddalena, C. G. da Silva Moraes, G. Bragan_ca, L. G. Junior, R. B. Godoy et al., “A battery-less photovoltaic water-pumping system with low decoupling capacitance,” IEEE Transactions on Industry Applications, vol. 55, no. 3, pp. 2263–2271, 2019. [Google Scholar]
14. A. Aktas and Y. Krcicek, “A novel optimal energy management strategy for offshore wind/marine current/battery/ultracapacitor hybrid renewable energy system,” Energy, vol. 199, pp. 117425, 2020. [Google Scholar]
15. M. M. Ismail and A. F. Bendary, “Smart battery controller using anfis for three phase grid connected PV array system,” Mathematics and Computers in Simulation, vol. 167, no. 6, pp. 104–118, 2020. [Google Scholar]
16. S. H. Metwally, X. Zhang, S. Ali and H. S. Krishnamoorthy, “Solar PV and bess based home energy system,” in IEEE Texas Power and Energy Conf., College Station, TX, USA, IEEE, pp. 1–6, 2019. [Google Scholar]
17. A. Amir, A. Amir, H. S. Che, A. Elkhateb and N. A. Rahim, “Comparative analysis of high voltage gain DC-DC converter topologies for photovoltaic systems,” Renewable Energy, vol. 136, pp. 1147–1163, 2019. [Google Scholar]
18. C. Pesce, J. Riedemann, R. Pena, W. Jara, C. Maury et al., “A modified step-up DC-DC fly-back converter with active snubber for improved efficiency,” Energies, vol. 12, no. 11, pp. 2066, 2019. [Google Scholar]
19. B. Liu, X. Zhang, L. Sun, H. Yang, Y. Wang et al., “Full-bridge/push-pull bi-directional DC-DC converter with integrated magnetism and synchronous rectification technology,” in 22nd Int. Conf. on Electrical Machines and Systems, Harbin, China, IEEE, pp. 1–5, 2019. [Google Scholar]
20. K. R. Babu, M. Ramteke, H. Suryawanshi and K. R. Kothapalli, “A novel high gain soft switched step-up DC-DC converter with coupled inductors,” in IEEE Texas Power and Energy Conf., College Station, TX, USA, IEEE, pp. 1–6, 2020. [Google Scholar]
21. J. Baek and H.-S. Youn, “Full-bridge active-clamp forward-flyback converter with an integrated transformer for high-performance and low cost low-voltage DC converter of vehicle applications,” Energies, vol. 13, no. 4, pp. 863, 2020. [Google Scholar]
22. A. Nasiri and A. S. S. Abadi, “A new driving method for a magnetron using a soft switching active clamp fly-back converter,” in 10th Int. Power Electronics Drive Systems and Technologies Conf., Shiraz, Iran, IEEE, pp. 361–366, 2019. [Google Scholar]
23. Q. Pan, H. Liu, P. Wheeler and F. Wu, “High step-up cascaded DC-DC converter integrating coupled inductor and passive snubber,” IET Power Electronics, vol. 12, no. 9, pp. 2414–2423, 2019. [Google Scholar]
24. K. Bhatt, R. A. Gupta and N. Gupta, “Design and development of isolated snubber based bidirectional DC-DC converter for electric vehicle applications,” IET Power Electronics, vol. 12, no. 13, pp. 3378–3388, 2019. [Google Scholar]
 | This work is licensed under a Creative Commons Attribution 4.0 International License, which permits unrestricted use, distribution, and reproduction in any medium, provided the original work is properly cited. |