DOI:10.32604/cmc.2022.019337
| Computers, Materials & Continua DOI:10.32604/cmc.2022.019337 | |
| Article |
Customer Prioritization for Medical Supply Chain During COVID-19 Pandemic
1Department of Management Sciences, Sir Syed CASE Institute of Technology, 45230, Islamabad, Pakistan
2Department of Operation & Supply Chain Management, NUST Business School, National University of Sciences & Technology, 45200, Islamabad, Pakistan
3Department of Computer Science, HITEC University Taxila, Taxila, Pakistan
4Department of Computer Engineering, College of Computer and Information Sciences, King Saud University, Riyadh, Saudi Arabia
5Department of Computer Science, College of Computers and Information Technology, Taif University, Taif, 21944, Saudi Arabia
*Corresponding Author: Ghulam Muhammad. Email: ghulam@ksu.edu.sa
Received: 09 April 2021; Accepted: 10 May 2021
Abstract: During COVID-19, the escalated demand for various pharmaceutical products with the existing production capacity of pharmaceutical companies has stirred the need to prioritize its customers in order to fulfill their demand. This study considers a two-echelon pharmaceutical supply chain considering various pharma-distributors as its suppliers and hospitals, pharmacies, and retail stores as its customers. Previous studies have generally considered a balanced situation in terms of supply and demand whereas this study considers a special situation of COVID-19 pandemic where demand exceeds supply Various criteria have been identified from the literature that influences the selection of customers. A questionnaire has been developed to collect primary data from pharmaceutical suppliers pertaining to customer-selection criteria. These criteria have been prioritized with respect to eigenvalues obtained from Principal Component Analysis and also validated with the experts’ domain-related knowledge using Analytical Hierarchy Process. Profit potential appeared to be the most important criteria of customer selection followed by trust and service convenience brand loyalty, commitment, brand awareness, brand image, sustainable behavior, and risk. Subsequently, Multi Criteria Decision Analysis has been performed to prioritize the customer-selection criteria and customers with respect to selection criteria. Three experts with seven and three and ten years of experience have participated in the study. Findings of the study suggest large hospitals, large pharmacies, and small retail stores are the highly preferred customers. Moreover, findings of prioritization of customer-selection criteria from both Principal Component Analysis and Analytical Hierarchy Process are consistent. Furthermore, this study considers the experience of three experts to calculate an aggregate score of priorities to reach an effective decision. Unlike traditional supply chain problems of supplier selection, this study considers a selection of customers and is useful for procurement and supply chain managers to prioritize customers while considering multiple selection criteria.
Keywords: Pandemic; customer prioritization; pharmaceutical supply chain; principal component analysis; multi-criteria decision-making
A disaster or pandemic has an everlasting impact on society, causing disruptions in its normal functioning resulting in the loss of health, economy, and environment [1]. COVID-19 is a global pandemic that started in December 2019 affecting 222 countries, impacting more than 76 M people, and claimed the lives of an estimated 1.7 M people by the end of December 2020 (https://www.who.int/emergencies/diseases/novel-coronavirus-2019). One of the problems facing communities is the lack of health and sanitation products to encounter the virus. The sudden increase in the demand for these products created a capacity constraint for the pharma-distributors. Due to increased demand, pharma-distributors started to explore alternative ways to gain more profit. Therefore, an effective way to manage healthcare delivery is to identify and classify customers based on various quantitative and qualitative factors. The traditional supply chain of life-saving products focuses on selecting suitable suppliers because of the availability of more capacity than market demand. However, COVID-19 changed the supply chain dynamics through increased demand for products from the market and limited storage capacities of pharma-distributors. This study investigated the limited capacities of pharmaceutical industries to meet the market demand by prioritizing potential customers in its supply chain. Pharma-distributors are the major supplier of healthcare products to their customers such as hospitals, pharmacies, and retail stores. Keeping in view the supply shortage and excess demand, pharma-distributors prefer to rank their customers as compared to traditional supply chains where supplier selection or evaluation is done.
This research addresses a novel approach in which the Principal Component Analysis (PCA) has been integrated with the Analytical Hierarchy Process (AHP) to prioritize and rank customers in a systematic way. The demand for many critical pharmaceutical products escalated during the COVID-19 outbreak. Pharma-distributors with the existing storage capacity were unable to fulfill the demand of all customers. Increased demand for products has pushed pharma-distributors to choose customers based on some pre-defined criteria. Such situations created the need to identify the factors influencing the customer-selection in the pharmaceutical supply chain and develop a methodology to rank customer-selection criteria and subsequently prioritize the customers. Hence the objective of the study is first to identify the factor that influences the customer-selection process in the pharmaceutical supply chain; second to prioritize the importance of identified customer-selection criteria, and to rank the customers based on experts’ domain-related knowledge with respect to customer-selection criteria.
COVID-19 has a significant effect on all countries and has triggered numerous supply chain disruptions around the world [2–4]. The unavailability of various links in the supply chain such as demand distribution, production, supply, and logistics caused disruptions [4]. Henceforth, during the COVID-19 pandemic, firms must address the ever-increasing demand for healthcare-related goods that are facing both demand and supply disorders. To alleviate the impacts of the supply chain-related problems related to current global shortages of healthcare products during COVID-19, Zhu, et al. [5] proposed to increase safety stock. It required an augmented storage capacity of pharma-distributors to raise the safety stock. Keeping in view the supply chain disruptions caused by the COVID-19 pandemic, it was difficult to increase the existing storage capacity. To fulfill the demand of customers with limited storage capacity, there was a need to prioritize the customers.
Most previous studies, considered supplier-selection as a major research objective, have been reviewed while considering criteria for their selection along with underlying methodology. Akcan et al. [6] proposed a mixed multi-criteria decision-making (MCDM) technique for the valuation and selection of suppliers in hospitals and considered cost, quality, logistics flexibility, and reliability as selection criteria for suppliers. Wang et al. [7] considered flexibility, green abilities, performance, capacity, and R&D and proposed a composite supplier-selection framework for construction supply chains using a combined methodology consisting of AHP along with grey relational analysis (GRA). To select an appropriate supplier in the automotive industry, Suraraksa et al. [8] proposed a selection methodology by integrating a quantitative and qualitative approach. AHP has been used to evaluate the criteria for supplier-selection. They have considered quality, service, cost, finance, capacity, sustainability, and ICT as supplier-selection parameters. To select the supplier of oil gas and oil industry, Wang et al. [9] proposed a new hybrid MCDM method using the technique for order of preference by similarity to ideal solution (TOPSIS), the AHP, and supply chain operations reference metrics (SCOR metrics) approach. They considered cost, reliability, asset management efficiency, agility, and supplier-selection criteria.
A supplier-selection methodology has been proposed by Jia et al. [10] for fashion business by using fuzzy sets and fuzzy numbers for supplier evaluation and TOPSIS for supplier-selection while considering economic, social, and environmental factors. Luthra et al. [11] considered social, environmental, and economic as supplier-selection criteria in the automotive industry while using and ViseKriterijumska Optimizacija I Kompromisno Resenje (VIKOR) and AHP to prioritize and rank the supplier evaluation criteria and subsequently rank suppliers. For supplier-selection in the hospital waste management Ishtiaq et al. [12] conducted a study for supplier-selection using AHP and considered supplier details, waste management cost, waste treatment to select the supplier, and waste handling procedure as selection criteria for suppliers. For supplier-selection and evaluation in the garment industry, Karami et al. [13] used PCA to reduce the criteria and VIKOR to rank efficient suppliers. The authors considered Economic, environmental, social as supplier-selection evaluation and selection.
Alinezad et al. [14] proposed a methodology for the supplier-selection in the pharmaceutical company where they used quality function deployment (QFD) for selecting and fuzzy AHP (FAHP) for ranking suppliers by taking into account the following selection criteria; cost, quality, delivery time, and supplier standing. To select a supplier in the textile sector, Guarnieri et al. [15] examined environmental, social, and ethical issues using an organized MCDM methodology comprised of Copeland/AHP/ELECTRE-TRI. The study emphasized that to make sustainable decisions in various companies’ customers’ perceptions are essential considerations. Asadabadi [16] introduced a customer-focused selection approach as the authors considered the potential of customer needs in finding the best supplier. To integrate customer and supplier relationship management Choy et al. [17] conducted a study where customers evaluated the suppliers based on some factors such as product quality customer service, product installation and technical support, product price, and customer satisfaction.
The suppliers always strive to properly match the demand to the supply chain's manufacturing capabilities. A key element of this issue is customer choice where the provider is committed to serving. There is a gap in the literature about customer selection based on suppliers’ preferences. Heikkilä [18] also advocated that the supply chain should start from the end of the customer, and the concept of supply chain management must be changed to demand chain management. The decisions about which customers to serve mostly depend on customer-related revenue and the type of product, e.g., low-demand items or high-demand products. Hence the firms have experienced a rapid increase in demand and at the same time shortage in supply of various products during the pandemic.
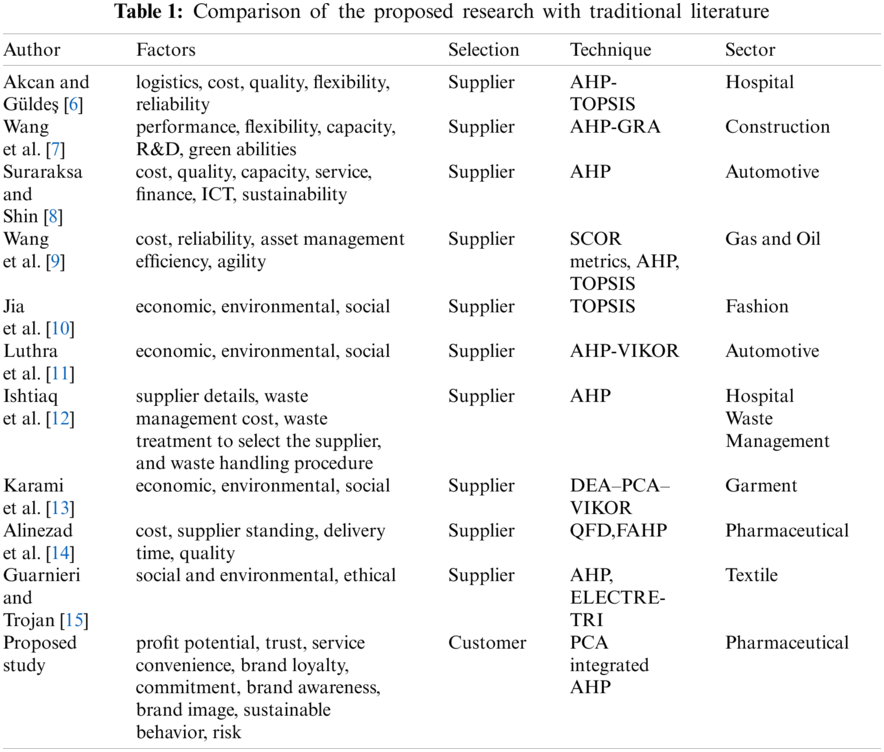
Tab. 1 shows the comparison of the proposed model with traditional literature. It is evident from the literature review that previous studies have generally considered a balanced situation in terms of supply and demand whereas this study considered a special situation of COVID-19 pandemic where demand exceeds supply. While considering pharma-distributors as their suppliers and hospitals, pharmacies, and retail stores as their customers; this research has provided a practical solution to deal with situations like the COVID-19 pandemic where the effects of high-demand items that are essential for survival are more visible [19]. Pharmaceutical manufacturers are currently facing an increase in demand and shortage in supply of a high-demand item like hand sanitizers therefore, it is vital to rank customers based on some criteria to curtail the effect of the supply chain disorders during the COVID-19 pandemic. There is a very severe need to propose a solution for customer-selection to make the best use of the supply of scarce products. Moreover, previous studies have considered monetary criteria for supplier selection whereas this research considered primary data for the identification of customer-selection factors. In contrast with previous studies, a questionnaire survey was conducted to collect responses from various pharmaceutical suppliers pertaining to customer-selection factors. PCA has been used to check the appropriateness of these factors for the process of customer-selection and subsequently, prioritization of these factors has been made based on their eigenvalues. AHP has been used for the validation of results of PCA and subsequently for customer prioritization concerning these customer-selection criteria.
3 Proposed Work and Numeric Results
This research is about selecting the best customer among the set of hospitals, pharmacies, and retail stores. A detailed literature review has been conducted to identify various criteria for customer-selection. A questionnaire has been prepared to collect data from various suppliers. PCA is utilized to examine the factor structure of the questionnaire and to prioritize the factors based on their eigenvalues. These factors have been further used as selection criteria to rank customers using AHP. Fig. 1 represents the research process.
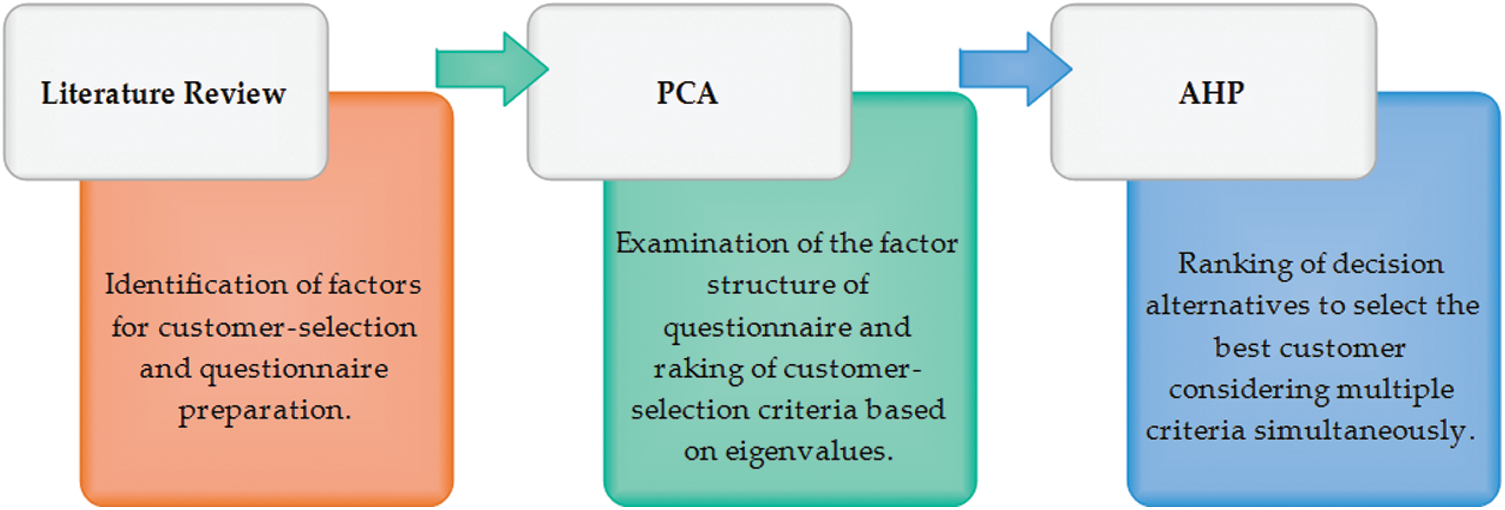
Figure 1: Proposed research methodology
3.1 Phase i: Principal Component Analysis (PCA)
In this study PCA, first introduced by Pearson [20], has been used to identify factors that a supplier should consider important while selecting its customers. The factors have been ranked with respect to the eigenvalues. Pharmaceuticals companies have been considered for data collection across Pakistan. A survey method was employed and questionnaires were distributed to collect the data with a total return of 387 out of 600. Yamane's Formula for Sampling was used for determining the sample size [21]. Out of 387 respondents, 6% were females and 94% were males. Respondents included Product Managers, Marketing Managers, Sales Managers, and Sales executives with varying experience.
The Seven-Point Likert scale is used by respondents to measure the extent to which they agree or disagree with the statement [21]. In the development of the questionnaire, various experts from multiple pharma-distributors were consulted. The first part of the questionnaire included detailed personal information whereas the second part comprised of questions that paying attention to the identified factors for customer selection. In questionnaire items to measure Brand Loyalty of customers are partly adapted from [22]. Likewise scale to measure brand awareness adopted from [23], commitment from [24]; trust from [24,25]; sustainable behavior from [26]; brand image from [22,27]; service convenience from [28]; Risk from [29] and profit potential from [30]. PCA is a large sample process. To obtain reliable results, the minimum number of participants providing usable analysis data should be at least 100 participants or 5 times the value of the analysis variables [31]. The sample considered in the study fulfilled the requirement.
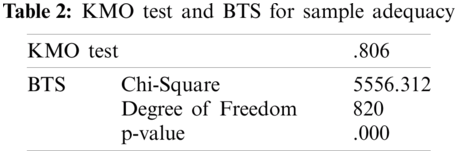
For measuring sample adequacy Kaiser-Meyer Olkin (KMO) test is performed. KMO statistics varies between 0 and 1; value greater than 0.5 is recommended [32]. The result of the KMO is 0.806 that is greater than 0.50 which indicates that there are sufficient items for each factor. To assess the suitability of the sample for PCA Bartlett's test of sphericity (BTS) is carried out at p < 0.001 is significant [33]. The level of significance is at p = 0.000 meaning that the correlations between variables are significantly different from zero. The results as presented in Tab. 2 indicate that the data were appropriate for the PCA.
After 5 repetitions and deleting 4 items, the final factor solution extracted 41 components that accounted for 61.328% of total variance [34]. Nine factors containing eigenvalue greater than one were retained [35]. Fig. 2 is representing the individual and cumulative variance explained of all these nine components. In the primary axis, values of individual variance and cumulative variance are in percentages. Whereas in the secondary axis, blue dots are representing eigenvalues for principal components. Varimax with Kaiser Normalization rotation is used for transforming the component into a factor [32]. The value of Cronbach's alpha coefficient was calculated to measure the internal reliability of the questionnaire [36]; the standard threshold of the adequacy of Cronbach's α ≥ 0.7 was achieved [37]. It is evident from eigenvalues and variance explained presented in Fig. 2 that the most important factor suppliers consider is profit potential followed by trust, service convenience, brand loyalty, commitment, brand awareness, brand image, sustainable behavior, and risk. These findings also provided an insight into the suppliers’ mindset in the process of the customer-selection and how naively it is embedded within the organizations.
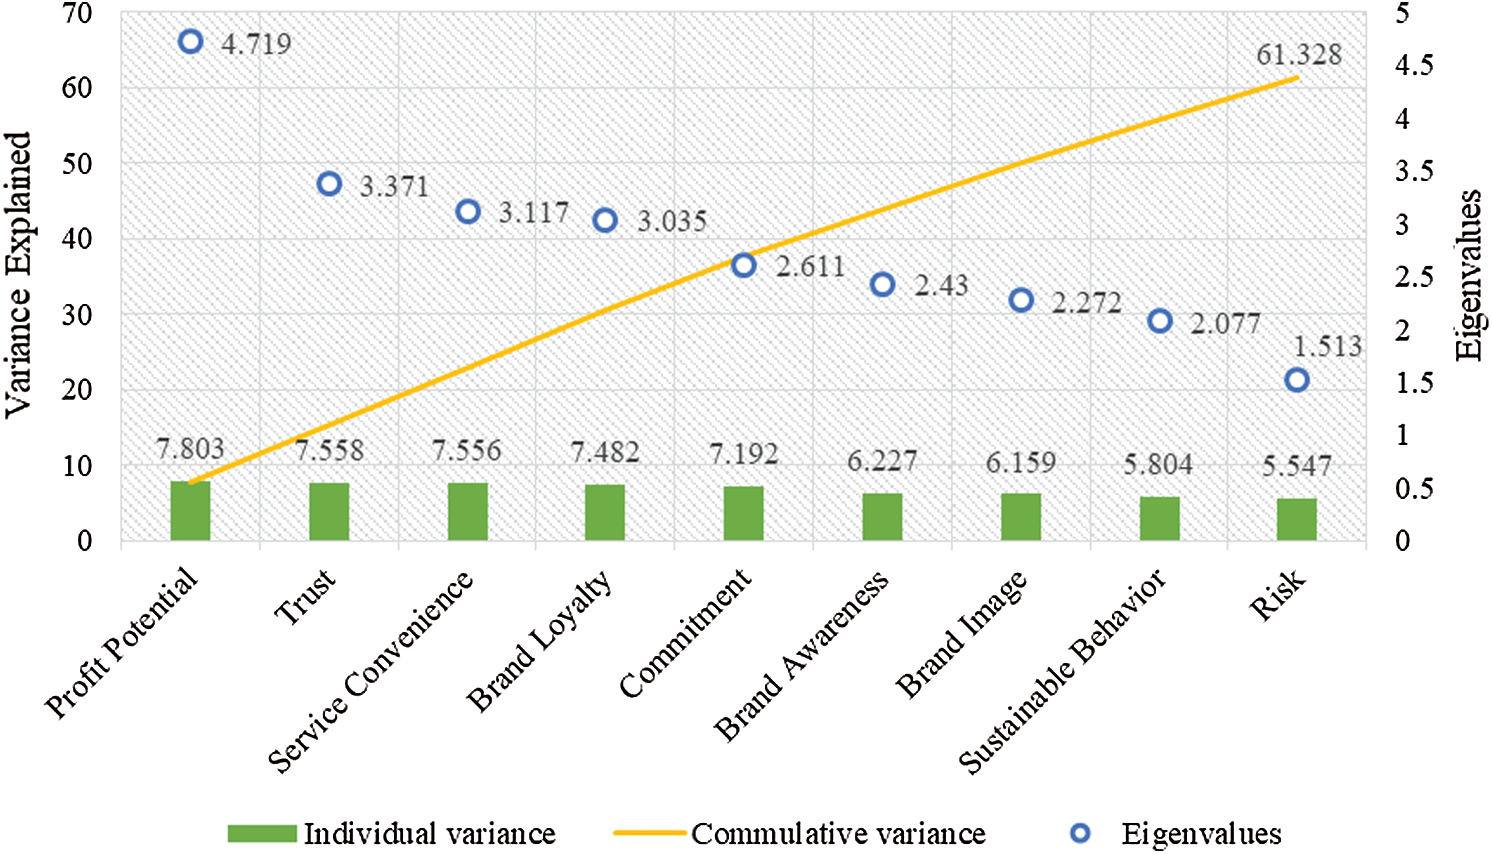
Figure 2: Variance explained and eigenvalues of principal components
3.2 Phase II: The Analytical Hierarchy Process Approach (AHP)
The AHP approach, developed by Thomas Saaty [38], is a way to rank alternatives and choose the best one where the decision-maker has multiple criteria on which the decision has to be based. In this study, we are considering a two-echelon supply chain consisting of three producers and three sets of customers. The hierarchical structure of the AHP problem is given in Fig. 3. The goal is to prioritize the customer with respect to nine criteria identified from PCA analysis.
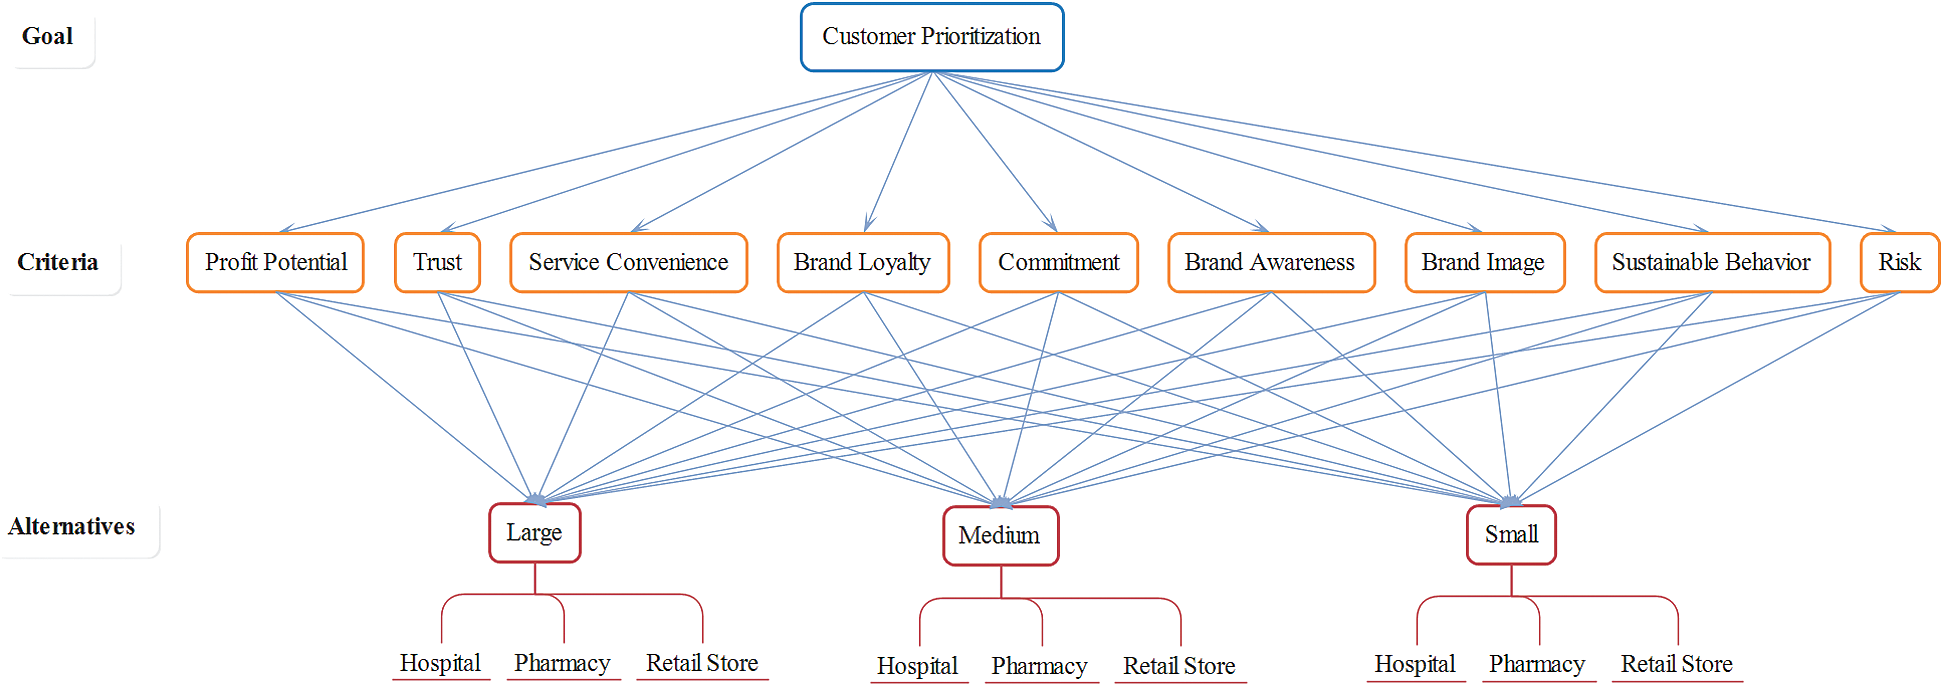
Figure 3: Hierarchical structure of AHP Problem
In AHP, we mathematically determine the preference for each customer for each criterion. To compare two alternatives the standard preference scale of Saaty [38] is used. In the pairwise comparison matrix A, the pairwise comparison result is placed in the upper triangle, the main diagonal with a value of 1, and the lower triangle is the reciprocal of the upper triangle, as shown Eq. (1).
The eigenvalues that comprise preference vector are calculated using Eq. (2);
Fig. 4 representing the summary of mathematical steps that are used to arrive at the AHP-recommended decision [38].
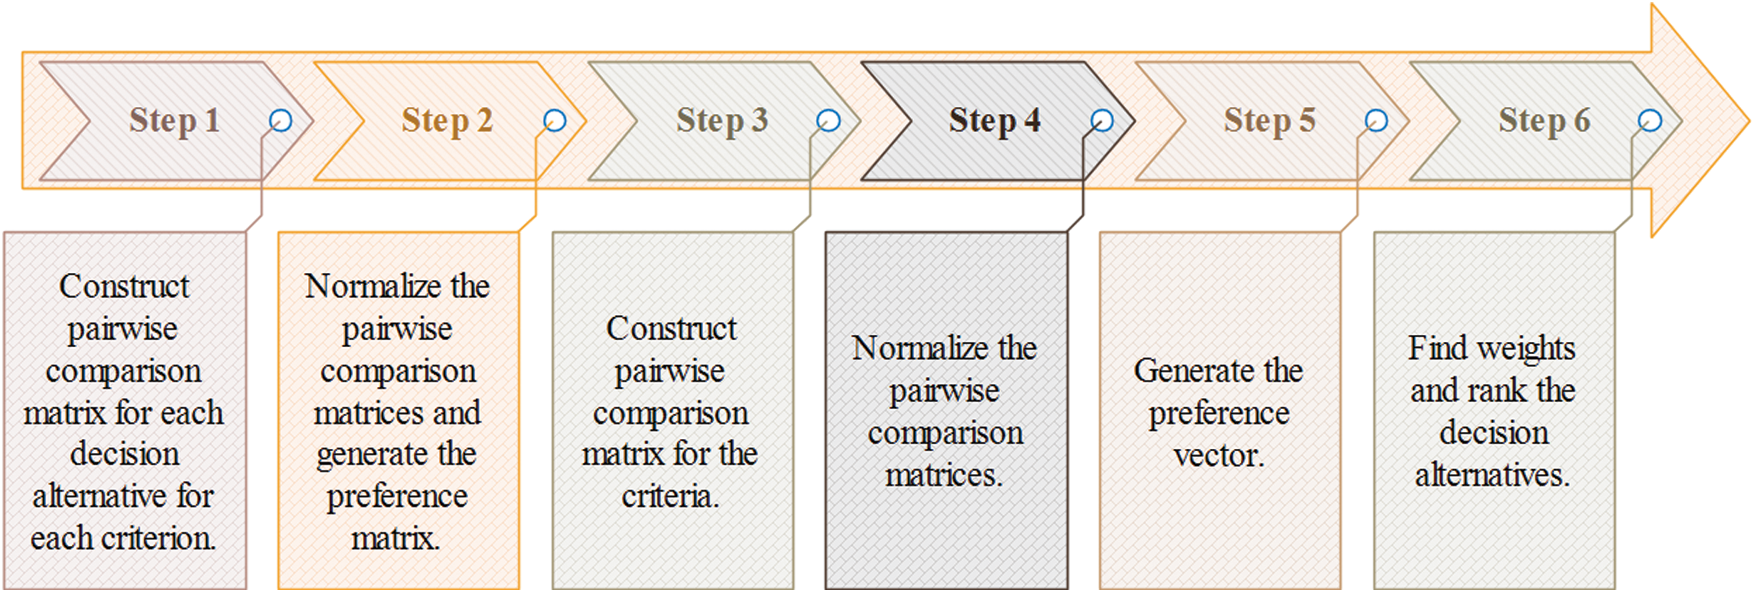
Figure 4: Steps to arrive at the AHP-recommended decision
Several experts from working in various pharma-distributors were interviewed to ascertain their views on the selection of customers in the organization. Based on the relevant experience, the experts have been selected with ten, seven, and three years of experience in the respective pharmaceutical company. An interview-administrated questionnaire in AHP format has been prepared to obtain the opinion regarding customer-selection criteria in order to prioritize customers. Several rounds of the questionnaire were sent to experts to achieve consistency in their responses. The Consistency ratio (CR) is calculated using Eq. (3) where CI is representing consistency index and RI is representing the index for the corresponding random matrix taken from Saaty [38].
CI is computed using the Saaty [38] formula given in Eq. (4) where
To calculate
After obtaining
Analysis of only one expert having ten years of experience has been presented here.
Step 1 & 2. Pairwise comparison and normalization matrices for hospitals, pharmacies, and retail stores with respect to criteria have been developed and findings are as follows;
Pairwise comparison and normalization matrices for the hospitals: Large hospital was ranked highest and considered the best customer when brand loyalty, brand awareness, commitment, risk, sustainable behavior, brand image, service convenience, trust, and profit potential were considered as criteria for selection. Whereas when the selection criterion is service convenience, a small hospital was ranked as the highest and considered the best customers.
Pairwise comparison and normalization matrices for the pharmacies: Considering commitment, risk, sustainable behavior, brand image, service convenience, and profit potential as selection criteria, large pharmacies were ranked as the highest priority and considered as the best customers. Whereas, small pharmacies were given the highest priority when brand loyalty, brand awareness, and trust are considered as selection criteria.
Pairwise comparison and normalization matrices for the retail stores: Large retail stores were ranked as the highest priority when sustainable behavior and brand image are considered as selection criteria. Whereas, small retail stores are given the highest priority when brand loyalty, brand awareness, commitment, risk, service convenience, trust, and profit potential are considered as selection criteria.
To check the consistency of expert's judgment in pairwise matrices for hospitals, pharmacies, and retail stores with respect to all customer selection criteria, the CR has been also been checked.
Step 3, 4 & 5. A pairwise comparison and normalization matrix for the nine criteria of customer selection was developed and the findings are; preference vector depicting profit potential with the highest value of 0.2823; trust with the second highest value of 0.2359, and service convenience as third highest value of 0.1588. Similarly, brand loyalty, commitment, brand awareness, brand image, sustainable behavior, and risk are at fourth, fifth, sixth, seventh, eighth, and ninth positions respectively. CR for pairwise comparison of alternative has been calculated i.e., 0.0670 < 0.1 hence he evaluations for the criteria for pairwise comparisons are consistent.
Step 6. The overall score
3.3 Group Decision Making: Experience-Based Weight Determination Method
Traditionally two methods have been found for AHP to achieve a conclusion, the first method is the aggregate of individual judgments (AIJ) and the second is the aggregate of individual priorities (AIP) [39]. The relative importance of each individual is assumed to be equal in AIP but experts may have different skills and experience, so to give them the same amount may not apply to decision-making on important issues [40]. Therefore, this study considered the experience of three experts to calculate the aggregate score of priorities to reach an effective decision.
Considering
Considering
The experience weight has been calculated using the formulas given in Eq. (1) and the aggregate scores for hospitals, pharmacies, and retail stores are calculated with Eq. (2). Subsequently, the ranking of customers has been computed and presented in Fig. 5.
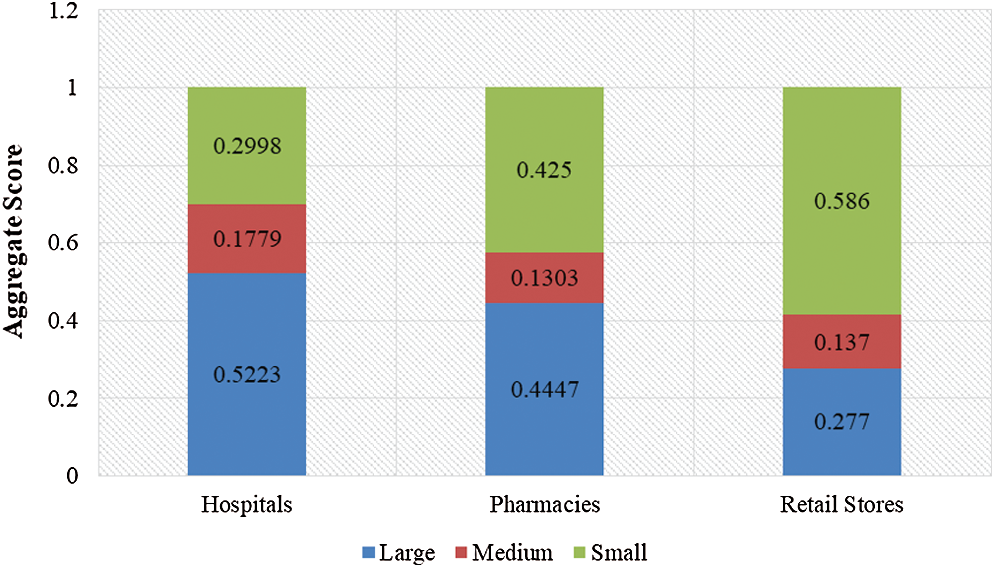
Figure 5: Aggregate score for customers based on the experience of three experts
Fig. 5 representing the priorities of customers based on the expert's aggregated score. The highest priority is given to large hospitals, large pharmacies, and small retail stores which depicts that supplier will give first preference to these customers. The second highest priority is given to small hospitals, small pharmacies, and large retail stores which is representing that after fulfilling the requirements of the highest priority customers, suppliers will fulfill the needs of these customers. Whereas, medium hospitals, medium pharmacies, and medium retail stores are given the lowest preferences.
Moreover, a comparison has also been presented for the prioritization of customer-selection criteria achieved by pair-wise comparisons from three experts. A consistent trend has been observed as shown in Fig. 6. Profit potential has been ranked as the most important factor followed by trust, service convenience, brand loyalty, commitment, brand awareness, brand image, sustainable behavior, and risk. These findings from AHP analysis were also consistent with the PCA results. Hence approving the objective opinion obtained from PCA and the subjective opinion obtained from AHP analysis.
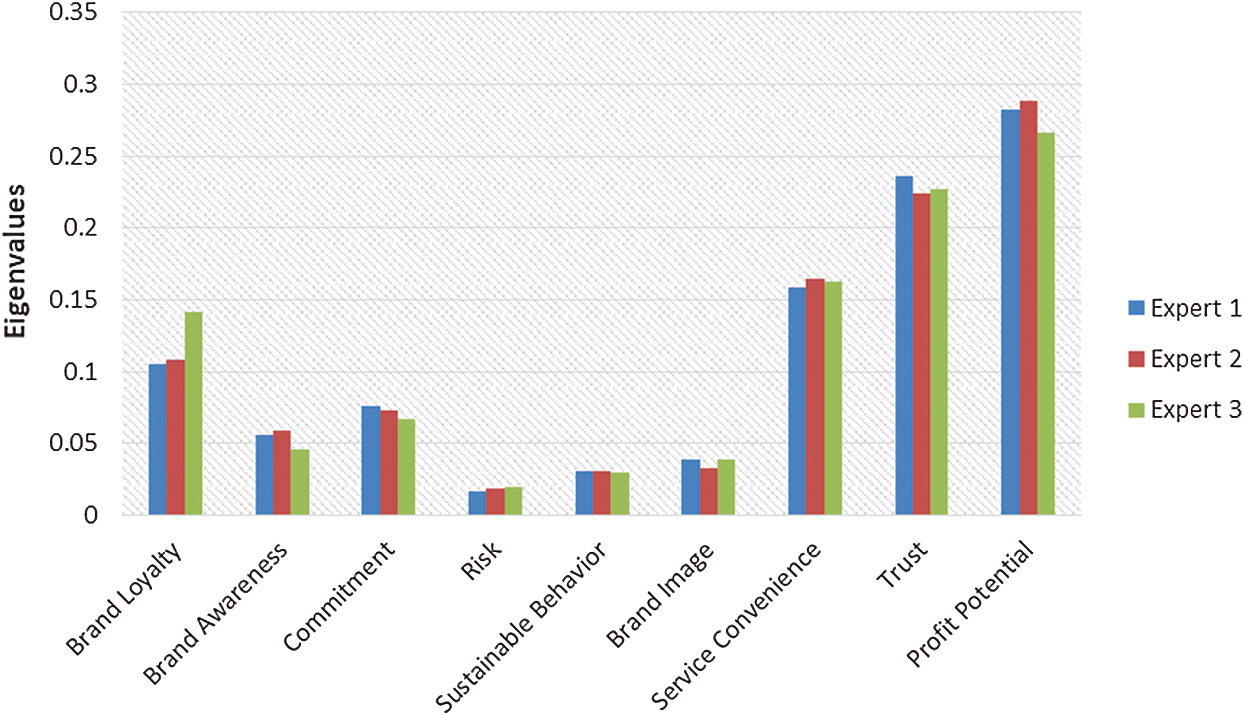
Figure 6: Prioritization of customer-selection criteria by three experts
This study presented a framework for customer-selection in the special situation of the COVID-19 pandemic when the demand for healthcare-related products has remarkably increased. As a result, the suppliers were unable to fulfill the requirements of all of their customers without prioritization. Various factors have been identified from literature where these criteria were used for customer selection in various organizations like hotels and banks etc. To check the applicability of these factors in the particular situation of the pharmaceutical sector, there is a need to ask suppliers about the importance of these customer-selection criteria. PCA has been used to examine the overall factor structure of the questionnaire. The findings of PCA are the declaration from suppliers that this study has identified appropriate customer-selection factors that are applicable in the current situation. PCA also prioritizes the customer-selection criteria based on their eigenvalues. One more advantage of using PCA in this study is that it has simplified the analysis by compressing the data into composite factors known as principal components. This convergence helped in reducing the complexity of AHP analysis by keeping it to only consider major nine criteria and not all sub-criteria. Customers have been ranked based on the score calculated from the responses of three experts having ten, seven, and three years of experience in the area of customer-selection. It is evident from eigenvalues obtained from PCA and experts’ pairwise comparison about criteria that profit potential is ranked as the most important criteria while selecting customers by the pharmaceutical supplier. Trust is the second most important, and service convenience is the third important followed by brand loyalty, commitment, brand awareness, brand image, sustainable behavior, and risk respectively. Moreover, the findings also revealed that large hospitals, large pharmacies, and small retail stores were given the first preference; small hospitals, small pharmacies, and large retail stores were given second preference; medium hospitals, medium pharmacies, and medium retail stores were given third preferences.
This study has combined all the non-monetary factors that are important for customer-selection process in the pharmaceutical sector which has theoretical implications as this model can be used for future research. Moreover, PCA was used to reduce the dimensions in the original data set which subsequently reduced the computational expenses and time required to evaluate the customer-selection criteria. The integration of PCA and AHP is a methodological contribution because unlike previous studies where experts have directly asked for their opinion this research has first validated the factors through primary data and then AHP has been applied to prioritize the customer-selection criteria as well as the customer. Furthermore, this study has considered an unbiased approach of customers-selection irrespective of their sizes. This approach can be used by procurement and supply chain managers with the autonomy of giving equal importance to all customers. Besides, this study considered three experts from different pharma-distributors, and their aggregate score is used to rank the customers by considering the average experience of all experts. This has great implications in situations where different personals with varying experience are involved in a decision making process and high experience can be given the highest priority.
Future research will seek to utilize the customer-selection framework for strategic decision making considering the entire supply chain. At the same time, this proposed framework can also be used to prioritize customers in other sectors.
Funding Statement: The research of Yunyoung Nam is supported by the Korea Institute for Advancement of Technology (KIAT) grant funded by the Korea Government (MOTIE) (P0012724, The Competency Development Program for Industry Specialist) and the Soonchunhyang University Research Fund. This work was supported by the Taif University Researchers Supporting Project number (TURSP-2020/79), Taif University, Taif, Saudi Arabia.
Conflicts of Interest: The authors declare that they have no conflicts of interest to report regarding the present study.
1. G. Muhammad and M. S. Hossain, “Deep learning-based edge-centric COVID-19 like pandemic screening and diagnosis system within B5G framework using blockchain,” IEEE Network, vol. 35, no. 2, pp. 74–81, 2021. [Google Scholar]
2. K. Govindan, H. Mina and B. Alavi, “A decision support system for demand management in healthcare supply chains considering the epidemic outbreaks: A case study of coronavirus disease 2019 (COVID-19),” Transportation Research Part E: Logistics and Transportation Review, vol. 138, pp. 101967, 2020. [Google Scholar]
3. T. M. Choi, “Innovative bring-service-near-your-home operations under corona-virus (COVID-19/SARS-coV-2) outbreak: Can logistics become the messiah?,” Transportation Research Part E: Logistics and Transportation Review, vol. 140, pp. 101961, 2020. [Google Scholar]
4. D. Ivanov, “Predicting the impacts of epidemic outbreaks on global supply chains: A simulation-based analysis on the coronavirus outbreak (COVID-19/SARS-coV-2) case,” Transportation Research Part E: Logistics and Transportation Review, vol. 136, pp. 101922, 2020. [Google Scholar]
5. G. Zhu, M. C. Chou and C. W. Tsai, “Lessons learned from the COVID-19 pandemic exposing the shortcomings of current supply chain operations: A long-term prescriptive offering,” Sustainability, vol. 12, pp. 5858, 2020. [Google Scholar]
6. S. Akcan and M. Güldeş, “Integrated multicriteria decision-making methods to solve supplier selection problem: A case study in a hospital,” Journal of Healthcare Engineering, vol. 2019, pp. 1–10, 2019. [Google Scholar]
7. T. K. Wang, Q. Zhang, H. Y. Chong and X. Wang, “Integrated supplier selection framework in a resilient construction supply chain: An approach via analytic hierarchy process (AHP) and grey relational analysis (GRA),” Sustainability, vol. 9, pp. 289, 2017. [Google Scholar]
8. J. Suraraksa and K. S. Shin, “Comparative analysis of factors for supplier selection and monitoring: The case of the automotive industry in Thailand,” Sustainability, vol. 11, pp. 981, 2019. [Google Scholar]
9. C. N. Wang, Y. F. Huang, I. Cheng and V. T. Nguyen, “A multi-criteria decision-making (MCDM) approach using hybrid SCOR metrics, AHP, and TOPSIS for supplier evaluation and selection in the gas and oil industry,” Processes, vol. 6, pp. 252, 2018. [Google Scholar]
10. P. Jia, K. Govindan, T. M. Choi and S. Rajendran, “Supplier selection problems in fashion business operations with sustainability considerations,” Sustainability, vol. 7, pp. 1603–1619, 2015. [Google Scholar]
11. S. Luthra, K. Govindan, D. Kannan, S. K. Mangla and C. P. Garg, “An integrated framework for sustainable supplier selection and evaluation in supply chains,” Journal of Cleaner Production, vol. 140, pp. 1686–1698, 2017. [Google Scholar]
12. P. Ishtiaq, S. A. Khan and M. U. Haq, “A multi-criteria decision-making approach to rank supplier selection criteria for hospital waste management: A case from Pakistan,” Waste Management & Research, vol. 36, pp. 386–394, 2018. [Google Scholar]
13. S. Karami, R. Ghasemy Yaghin and F. Mousazadegan, “Supplier selection and evaluation in the garment supply chain: An integrated DEA–PCA–VIKOR approach,” Journal of the Textile Institute, vol. 1, pp. 1–18, 2020. [Google Scholar]
14. A. Alinezad, A. Seif and N. Esfandiari, “Supplier evaluation and selection with QFD and FAHP in a pharmaceutical company,” International Journal of Advanced Manufacturing Technology, vol. 68, pp. 355–364, 2013. [Google Scholar]
15. P. Guarnieri and F. Trojan, “Decision making on supplier selection based on social, ethical, and environmental criteria: A study in the textile industry,” Resources, Conservation and Recycling, vol. 141, pp. 347–361, 2019. [Google Scholar]
16. M. R. Asadabadi, “A customer based supplier selection process that combines quality function deployment, the analytic network process and a markov chain,” European Journal of Operational Research, vol. 263, pp. 1049–1062, 2017. [Google Scholar]
17. K. L. Choy, K. K. Fan and V. Lo, “Development of an intelligent customer-supplier relationship management system: The application of case-based reasoning,” Industrial Management & Data Systems, vol. 1, pp. 1–15, 2003. [Google Scholar]
18. J. Heikkila, “From supply to demand chain management: Efficiency and customer satisfaction,” Journal of Operations Management, vol. 20, pp. 747–767, 2002. [Google Scholar]
19. D. Ivanov, “Viable supply chain model: Integrating agility, resilience and sustainability perspectives—lessons from and thinking beyond the COVID-19 pandemic,” Annals of Operations Research, vol. 2, pp. 1, 2020. [Google Scholar]
20. K. Pearson, “LIII. on lines and planes of closest fit to systems of points in space,” The London, Edinburgh, and Dublin Philosophical Magazine and Journal of Science, vol. 2, pp. 559–572, 1901. [Google Scholar]
21. T. Yamane, “Statistics: An Introductory Analysis-3,” New York, N.Y. (USA) Harper and Row, pp. 1–21, 1973. [Google Scholar]
22. H. b. Kim and W. G. Kim, “The relationship between brand equity and firms’ performance in luxury hotels and chain restaurants,” Tourism Management, vol. 26, pp. 549–560, 2005. [Google Scholar]
23. J. Suki and J. Sasmita, “Young consumers’ insights on brand equity: Effects of brand association, brand loyalty, brand awareness, and brand image,” International Journal of Retail & Distribution Management, vol. 43, pp. 276–292, 2015. [Google Scholar]
24. E. Garbarino and M. S. Johnson, “The different roles of satisfaction, trust, and commitment in customer relationships,” Journal of Marketing, vol. 63, pp. 70–87, 1999. [Google Scholar]
25. E. Delgado-Ballester, J. L. Munuera-Aleman and M. J. Yague-Guillen, “Development and validation of a brand trust scale,” International Journal of Market Research, vol. 45, pp. 35–54, 2003. [Google Scholar]
26. H. Zeng, “Green packaging design,” Taiwan Packaging Industry Magazine, vol. 11, pp. 82–90, 2001. [Google Scholar]
27. L. Suhaily and S. Darmoyo, “Effect of product quality, perceived price and brand image on purchase decision mediated by customer trust,” Jurnal Manajemen, vol. 21, pp. 179–194, 2017. [Google Scholar]
28. M. C. Chen, K. C. Chang, C. L. Hsu and I. C. Yang, “Understanding the relationship between service convenience and customer satisfaction in home delivery by kano model,” Asia Pacific Journal of Marketing and Logistics, vol. 3, pp. 1–21, 2011. [Google Scholar]
29. H. H. Chang and S. W. Chen, “The impact of online store environment cues on purchase intention,” Online Information Review, vol. 3, pp. 1–15, 2008. [Google Scholar]
30. D. Gefen and P. Devine, “Customer loyalty to an online store: the meaning of online service quality,” in Int. Conf. of Information Security 2001 Proc., NY, USA, pp. 80, 2001. [Google Scholar]
31. D. L. Streiner, “Figuring out factors: The use and misuse of factor analysis,” Canadian Journal of Psychiatry, vol. 39, pp. 135–140, 1994. [Google Scholar]
32. H. F. Kaiser, “An index of factorial simplicity,” Psychometrika, vol. 39, pp. 31–36, 1974. [Google Scholar]
33. I. M. Nasir, A. Bibi, J. H. Shah, M. Sharif, K. Iqbal et al., “Deep learning-based classification of fruit diseases: An application for precision agriculture,” Computers, Materials and Continua, vol. 66, pp. 1949–1962, 2021. [Google Scholar]
34. F. Alshehri and G. Muhammad, “A comprehensive survey of the internet of things (IoT) and AI-based smart healthcare,” IEEE Access, vol. 9, pp. 3660–3678, 2021. [Google Scholar]
35. J. Deng, W. Dong, R. Socher, L. J. Li and L. Fei-Fei, “Imagenet: A large-scale hierarchical image database,” in 2009 IEEE Conf. on Computer Vision and Pattern Recognition, Miami, FL, USA, pp. 248–255, 2009. [Google Scholar]
36. L. J. Cronbach, “Coefficient alpha and the internal structure of tests,” Psychometrika, vol. 16, pp. 297–334, 1951. [Google Scholar]
37. J. C. Nunnally, “Psychometric theory—25 years ago and now,” Educational Researcher, vol. 4, pp. 7–21, 1975. [Google Scholar]
38. T. Saaty, “The analytic hierarchy process mcgraw hill, New York,” Agricultural Economics Review, vol. 70, pp. 1–21, 1980. [Google Scholar]
39. E. Forman and K. Peniwati, “Aggregating individual judgments and priorities with the analytic hierarchy process,” European Journal of Operational Research, vol. 108, pp. 165–169, 1998. [Google Scholar]
40. M. Imran, C. Kang and M. B. Ramzan, “Medicine supply chain model for an integrated healthcare system with uncertain product complaints,” Journal of Manufacturing Systems, vol. 46, pp. 13–28, 2018. [Google Scholar]
 | This work is licensed under a Creative Commons Attribution 4.0 International License, which permits unrestricted use, distribution, and reproduction in any medium, provided the original work is properly cited. |