DOI:10.32604/cmc.2022.019331
| Computers, Materials & Continua DOI:10.32604/cmc.2022.019331 | |
| Article |
Deep Optimal VGG16 Based COVID-19 Diagnosis Model
1Department of Computer Science and Engineering, PSNA College of Engineering and Technology, Dindigul, 624622, India
2Department of Information Technology, PSNA College of Engineering and Technology, Dindigul, 624622, India
3Department of Electrical and Electronics Engineering, New Prince Shri Bhavani College of Engineering and Technology, Chennai, 600073, India
4Prince Sattam Bin Abdulaziz University, College of Computer Engineering and Sciences, Alkharj, 11942, Saudi Arabia
5Department of Information Technology, College of Computer and Information Technology, Taif University, Taif, 21944, Saudi Arabia
6Department of Computer System and Technology, Faculty of Computer Science and Information Technology, University of Malaya, Kuala Lumpur, 50603, Malaysia
*Corresponding Author: Ihsan Ali. Email: ihsanali@ieee.org
Received: 09 April 2021; Accepted: 10 May 2021
Abstract: Coronavirus (COVID-19) outbreak was first identified in Wuhan, China in December 2019. It was tagged as a pandemic soon by the WHO being a serious public medical condition worldwide. In spite of the fact that the virus can be diagnosed by qRT-PCR, COVID-19 patients who are affected with pneumonia and other severe complications can only be diagnosed with the help of Chest X-Ray (CXR) and Computed Tomography (CT) images. In this paper, the researchers propose to detect the presence of COVID-19 through images using Best deep learning model with various features. Impressive features like Speeded-Up Robust Features (SURF), Features from Accelerated Segment Test (FAST) and Scale-Invariant Feature Transform (SIFT) are used in the test images to detect the presence of virus. The optimal features are extracted from the images utilizing DeVGGCovNet (Deep optimal VGG16) model through optimal learning rate. This task is accomplished by exceptional mating conduct of Black Widow spiders. In this strategy, cannibalism is incorporated. During this phase, fitness outcomes are rejected and are not satisfied by the proposed model. The results acquired from real case analysis demonstrate the viability of DeVGGCovNet technique in settling true issues using obscure and testing spaces. VGG 16 model identifies the image which has a place with which it is dependent on the distinctions in images. The impact of the distinctions on labels during training stage is studied and predicted for test images. The proposed model was compared with existing state-of-the-art models and the results from the proposed model for disarray grid estimates like Sen, Spec, Accuracy and F1 score were promising.
Keywords: COVID 19; multi-feature extraction; vgg16; optimal learning rate
A novel corona virus Ctorment was identified in Wuhan, China by December 2019 and the virus was named after COVID-19 (Coronavirus Disease-2019) officially after it was declared as pandemic by WHO [1]. But within a short span of time, the virus spread across the planet and the Covid scourge was announced as a pandemic by World Health Organization on March 12, 2020. COVID-19 is a new overwhelming respirational disease that infects people and causes Severe Acute Respiratory Syndrome [2]. A large number of diagnostic experts proposed different procedures for COVID-19 diagnosis from Chest Radiography Image (CRIs). These methods are mainly relied upon Deep Learning (DL) model to perceive COVID-19 by means of CRI [3]. Few of these models suggested to go for COVID disclosure from non-COVID cases (coordinated with demand). COVID-19 disease is normally diagnosed using qRT-PCR test kits while the samples are collected through nose swabs from the individual [4,5]. The diagnostic results may be expected from a period of one hour to two days. However, this process is a time-consuming process that demands skilled healthcare professionals and high-end medical equipments to diagnose the disease. Further, there are reports that qRT-PCR provide false positive and false negative too [6]. Thus, a rapid, reliable and effective diagnostic mechanism should be in place to achieve outstanding results. In medical assessments, it is reported that a large number of COVID-19 patients experiences the harmful effects of pneumonial infection. It is perceived that chest CT scan or X-rays can be productive imaging procedures for the confirmation of lung-related infections [7,8]. These assessments are subjected to machine learning and DL techniques to confirm the diagnosis of COVID-19 disease using scan or X-ray images [9].
It is an established fact that understanding different images can only be performed by a specialist in radiology [10]. In the study conducted earlier, the images are trained with DL models which produced excellent results for assisting clinical specialists in diagnosing COVID-19 affected persons [11]. DL models helps the developing countries where X-ray facility is available yet lacks a professional healthcare specialist. To achieve this advantage, a significant neural network model was developed that can investigate the X-ray images of lungs and recognize if the individual is positive for COVID-19 [12,13]. DL has a reasonable output in image blueprint. Various DL models have been developed in image detection techniques, for example, GoogleNet [14], AlexNet, VGGNet and InceptionNet [15].
Among different deep learning classifiers, VGG16 has been found to be an excellent classifer in PC vision and clinical image investigation requirements [16]. The accuracy of VGG16 can be improved by optimal learning rate [17]. This optimal performance is accomplished by optimization algorithm called BWO. The aftereffects of deep optimal VGG16 have demonstrated its strength to map the image details to the exact and anticipated outcome. Since the virus inhabits the lungs and infects it the most [18], if diagnosed earlier, one can prevent severe consequences of the deadly virus.
The primary aim of the study is to introduce a VGG16-enabled model that trains the model with COVID-19 infected patient’s lung images and compares the same with that of the normal lungs. The presented technique can quickly diagnose COVID-19 patients by perceiving the characteristics of infected patients as dim or shadowy patches in CXR.
Rest of the paper is structured as given herewith. Second section details about the recent research papers and strategies utilized in work comprising DL methods whereas existing problems and motivation of the proposed study are discussed in Section 3. A short overview of the presented model is provided in Section 4. The results of the proposed work are discussed in Section 5 and the last section draws the conclusion.
Wang and Wong utilized [19] a pre-trained ResNet50 plan for COVID-19 disease diagnosis using CRIs in 2020. In their assessment, the researchers used COVIDx database containing information from strong pneumonia COVID-19 patients. The study achieved an accuracy of 93.4% in diagnosing the disease.
Santa Clause Cruz et al. [20] proposed a model in which the authors used an ensemble approach for multi-stage transfer learning model under 2-stage with which the study diagnosed COVID-19 patients subject to CT scan pictures. This study had a clear design to accomplish a genuine display. The presented technique achieved accuracy, F-score and an AUC of promising qualities and deemed to be fit for assisting radiologists in the investigation of COVID-19.
In 2020, Li et al. [21] familiarized a DL model in which the highlights are eliminated from volumetric chest CT pictures for COVID-19. During evaluation, the database fused 4356 chest CT pictures captured from a total of 3,322 persons. The study used a standard dataset and conducted exploratory assessments. The researchers achieved 90% accuracy using the presented neural affiliation (COVNet) model which coordinated ResNet-50 planning to perceive COVID-19 hardship.
In 2020, Pathak et al. [22] proposed a deep transfer learning model to diagnose COVID-19 in individuals. The study used top-2 smooth loss function in addition to attributes that are cost-sensitive. This function was used to manage noisy and inequivalent COVID-19 dataset related challenges. From the study results, it was understood that the proposed model provided excellent results in comparison with other supervised learning models.
In 2020, Panwar et al. [23] proposed nCOVnet, a DL neural network-based method to detect the presence of COVID-19. This rapid screening method helps in the analysis of X-ray images of the patients and chest radiography imaging for visual indicators that can confirm the presence of COVID-19.
In 2021, Sheykhivand et al. [24] proposed a novel method to identify the presence of pneumonia caused by COVID-19 automatically. This novel method, being a deep neural network method, is used to segregate the chest x-ray images into 2–4 separate classes under 7 different functional scenarios on the basis of healthy, viral, bacterial and COVID-19 groups. The study achieved 90∧ accuracy in all the scenarios mentioned above whereas 99% accuracy was achieved when it comes to distinguishing COVID-19 from healthy group. The researchers contrasted the proposed model with that of other DL networks predominantly used in the detection of pneumonia [25].
In the literature [26], Black Widow Optimization Algorithm (BWO) was proposed through exceptional mating performance of 8-legged black widow spiders. In the proposed study, cannibalism concept formed the crux of the paper. This concept helps in the elimination of species with undesirable fitness, due to which convergence can easily be achieved. BWO algorithm was extensively evaluated on 51 benchmark capacities to validate its ability in achieving the optimum solution. The obtained results show that the proposed algorithm holds numerous advantages in various perspectives such as early convergence and streamlined optimized fitness value in contrast to other existing algorithms.
In 2020, Narin et al. [9] developed a framework in which X-ray images are used and applied with Deep CNN to diagnose and segregate COVID-19. CNN-enabled approaches (InceptionResNetV2, ResNet50, and InceptionV3,) were utilized to diagnose the patients infected with COVID pneumonia with the help of chest X-ray radiograph. The results achieved (accuracy: 98%) by the study established the supremacy of the proposed approach i.e., ResNet50 approach. Some other methods are also exist in the literature [27–29].
3 Motivation of the Proposed Work
A number of researchers examined COVID detection models and presented different methods to overcome the challenges. In any case, most of them did not give the necessary accurac, particularly for four classes. Along these lines, the study aims at improving the identification and classification accuracy of COVID-19 with the help of a DL model, DeVGGCovNet. COVID19 CXR images are additionally investigated by DeVGGCovNet and the results were compared with different state-of-the-art methods. The assessment of optimal learning rate in DeVGGCovNet can be utilized accurately to segregate COVID19 positive cases from related pneumonia infection. Henceforth, the presented technique is useful for specialists in the identification and classification during emergency and follow up for COVID-19 positive patients. The study additionally limited the number of patients that prerequisite rapid tests.
4 The Proposed COVID-19 Diagnosis Model
The proposed Deep Optimal VGG16-based COVID-19 Detection (DeVGGCovNet) Multi Feature model is shown in Fig. 1. As shown in the image, CXR image is utilized as input into COVID-19 detection. The input CXR image is first resized to 224 × 224 pixels for similarity with deep learning-based VGG-16 model. Since CXR images are collected from different sources, they are resized and changed from RGB to grayscale in order to guarantee the consistency across different datasets. From the outset, the collected images are then made to undergo multi-feature extraction where the matching features are extracted based on key point scale. With the help of the proposed VGG-16 model, COVID-19 and standard images are detected by extracting a multi-feature set (SIFT, SURF and FAST). Those features are extricated and accurate outcomes are achieved by selecting optimal learning rate in VGG-16, which is otherwise termed as deep optimal VGG-16 network. Then, the resultant images are exposed to min-max standardization so as to accelerate the intermingling interaction.
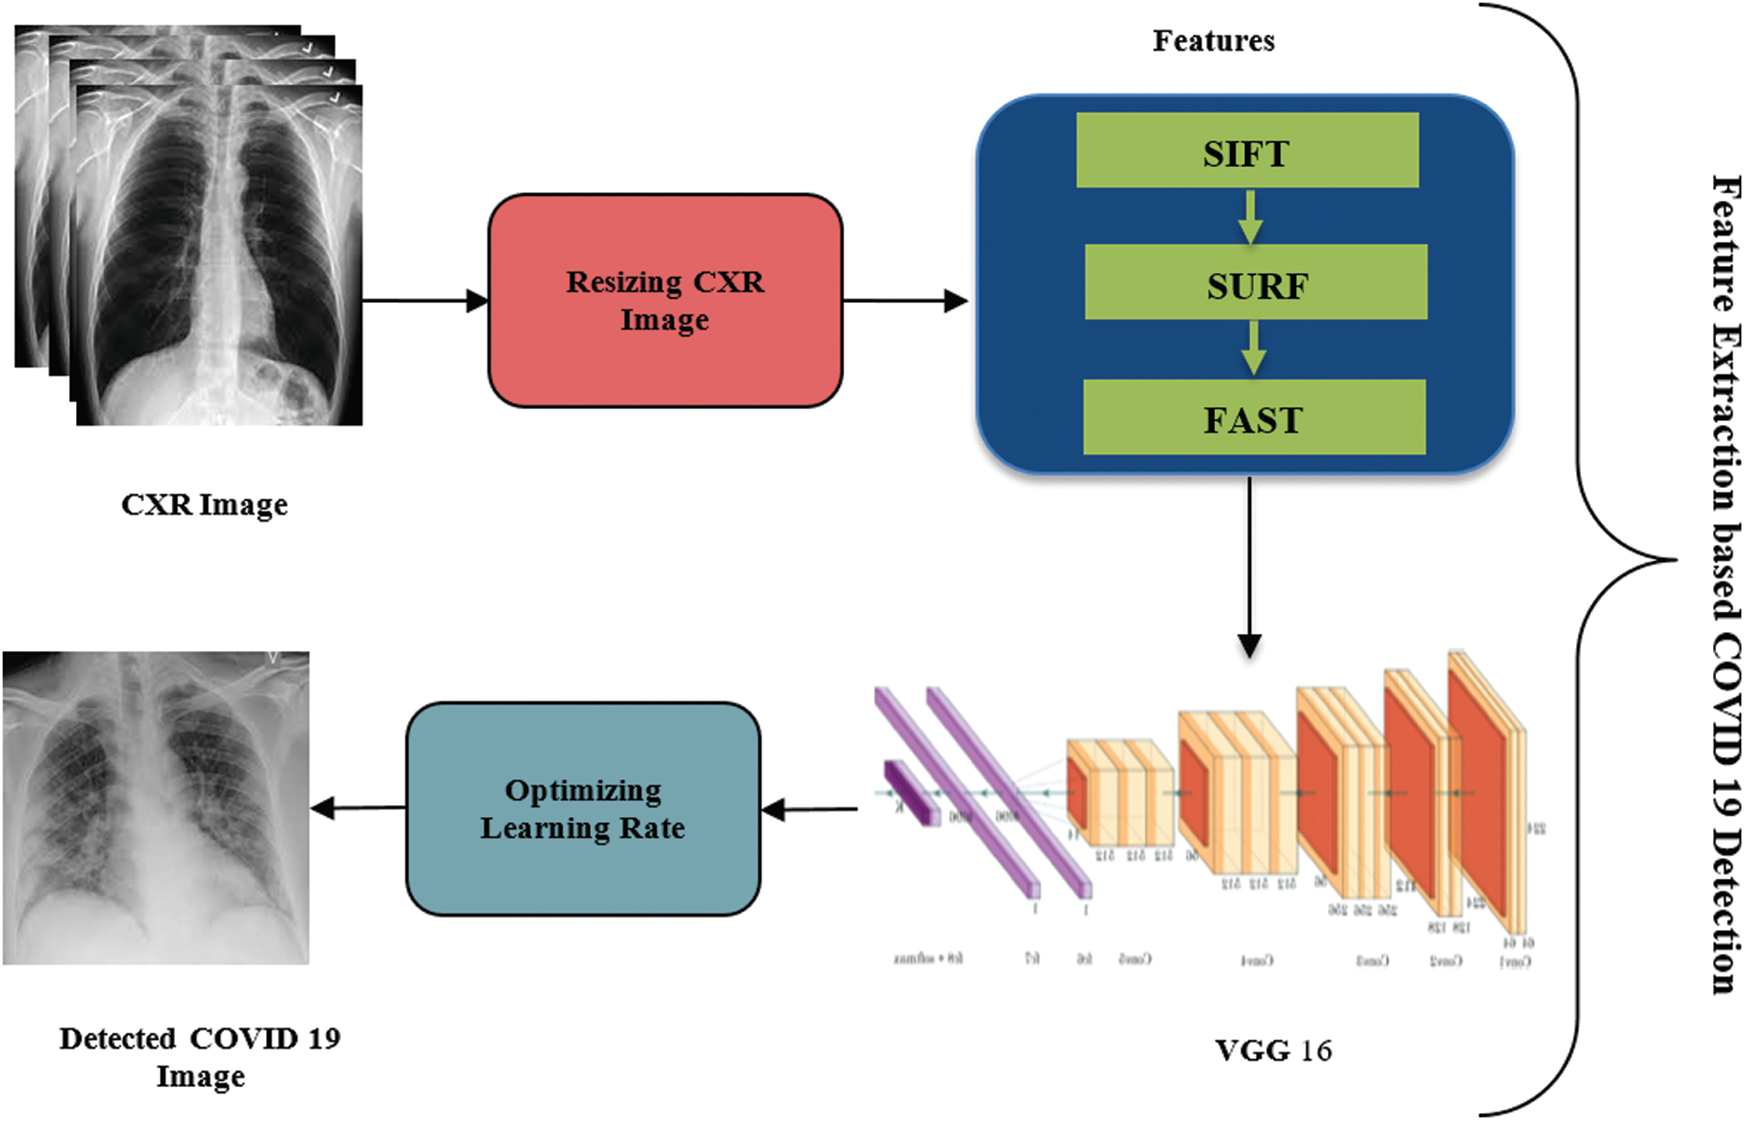
Figure 1: The block diagram of deep optimal VGG-16 based COVID-19 detection
For image analysis, two clinical datasets were considered from open Github archives [30–32]. This archive contains patients’ CXR images of COVID-19 and 15 different illness types. The entire dataset is primarily divided in to training and testing datasets in in the order of 80% and 20% respectively. The collection of training and testing databases holds two subgroups: ‘healthy’ and ‘Coronavirus’, comprising of separate kinds of CXR images.
4.2 Multi-Feature Extraction from CXR Images
From the collected CXR images, the researchers collected considerable features such as Speeded-Up Robust Features (SURF), Features from Accelerated Segment Test (FAST), Scale Invariant Feature Transform (SIFT) for COVID-19 detection process.
SIFT has four stages and incorporates picture revolution, relative changes, force, and perspective change in coordination with highlights. The first stage is to evaluate scale-space extrema using Difference of Gaussian (DoG). Then, a central issue restriction is available, where the central issue competitors are bound and refined by removing the low distinction centres or low differentiation features. The third stage has a central issue direction task which is subjected to neighborhood picture slant. At the end, a keypoint descriptor generator is calculated nearby the image descriptor for each central issue which relies on picture slope degree and bearing.
FAST works in an alternate way to deal with different algorithms. It distinguishes a bunch of points within the scope of interest and exclude the points that have no advantage. The steps include in FAST are given herewith.
• Choose any one pixel in CXR image referred to as an interesting point along with its threshold value.
• Next to that, a sphere of 16 pixels is considered over the pixel under test.
• Now, the pixel p is a corner if there exists a bunch of ‘n’ bordering pixels in the circle. For most of the parts, it is brilliant or mediocre than its power and edge esteem.
• In the next step, see the force of pixels primarily i.e., 1, 5, 9 and 13 of the circle to starting intensity. On the off chance, the threshold condition is fulfilled in any three events in these pixels. At that point, the interesting point exists.
• If, in any event, three of the four pixels are not higher or lower than the threshold value, p value is not an interesting point. At this point, pixel p is rejected as a potential interest point. Otherwise, if at any rate, three of the pixels are above or below the threshold, at that point, check each of the 16 pixels and verify if 12 adjoining pixels exist in the standard.
• Reiterate these steps for all the pixels in the image.
4.2.3 Speeded-Up Robust Features (SURF)
SURF approximates the DoG with a box channel. On the contrary to Gaussian filter for the picture, the squares are utilized by the gauge, since the convolution with the square is significantly faster when essential image is used. Likewise, this should be possible for different scales. It also uses an identifier depending upon the Hessian framework to track down the central focuses. For course task, it utilizes wavelet reactions in both level by applying sufficient Gaussian weights. In view of these wavelet reactions, we can extract the features. The qualities identified with chosen key points are disengaged into various subregions. From there on, the wavelet reactions are taken from every subregion and then directed to get a SURF descriptor. The indication of Laplacian, which takes a crack at the acknowledgement, is utilized for pivotal interest centres. The indication of Laplacian observes astonishing masses on dull establishments from the contrary case. In case of any occurrence of coordination with features, then they must have a similar sort of differentiation (in view of sign) which permits quicker matching with promising outcomes.
DL procedures are utilized in identifying the features of data index. For example, images and videos are covered in first data index. VGG16 is essentially employed to extract the feature and the extraordinary feature is mainly employed for clinical image investigation. This feature offers an incredible help in the healthcare research development. VGG-16 is a DCNN that consists of 16 layers conjoined by numerous 3 * 3 convolutions and 2 * 2 pooling layers consistently.
VGG-16 performs the extraction of outstanding components. Therefore, it offers a practical impact on image identification process. VGG-16 has the best component learning limit over AlexNet considering the fact that it is profound than AlexNet and offers highlights compared to AlexNet. VGG-16 uses 3 * 3 convolution and 2 * 2 pooling layers. It is reasonably less troublesome than the Inception Net. It has an unrivalled theory’s capability, and could conform to a grouping of information groups including COVID19 images.
4.4 Proposed Deep Optimal VGG-16 Model
VGG-16 uses 13 convolution and 3 FC layers in the proposed method. The convolution layer in VGG-16 is generally composed of 3 * 3 convolution layers with a stage size of 1 and comparable padding. The pooling layer is generally 2 * 2 pooling layer with a stage size of 2. Next to every individual pooling layer, the feature map size gets considerably reduced. The final feature map prior to related layers is 7 * 7 with 512 channels and wandered to a vector of 25,088 (7 * 7 * 512) channels.
The first and second convolutional layers are 64 element bit channels whereas its filter size is 3 * 3. The input image is fed into two initial convolution layers and the measurements change accordingly i.e., 224 * 224 * x64 pixels. At that point, the subsequent yield is conceded in alignment with the max-pooling layer at a step of 2. The 3rd and 4th convolution layers are of 124 element bit channels while the size of the channel is 3 * 3. They are trailed through a maximum pooling layer with Step 2, and the subsequent yield gets decreased to 56 × 56 × 128. The 5th, 6th and 7th layers are convolution layers with part size of 3 * 3. Each of the three layers utilizes 256 element maps. These layers are trailed by a maximum pooling layer with Step 2. Every one of the arrangements of convolution layers has 512 kernel filters. A maximum pooling layer trails these layers with the step of 1. The 14th and 15th layers are completely associated with covered up layers of 4096 units, trailed by a softmax layer (16th layer) of 1000 units. VGG 16 model figures out that the images belong to the label based on differences in images and accordingly in the matrix. It graps the influence of differences on labels at the time of the training stage and predicts for test images.
4.5 Optimal Learning Rate by Metaheuristic Algorithm
In order to improve the learning rate in VGG-16 DL organization, BWO algorithm is utilized. It emulates the abnormal mating conduct of BW spiders. It can investigate an enormous territory to get the optimum solution; consequently, BWO acts as an effective technique to achieve optimal learning rate within a few nearby optima. Fig. 2 shows the life cycle of black widow spiders.
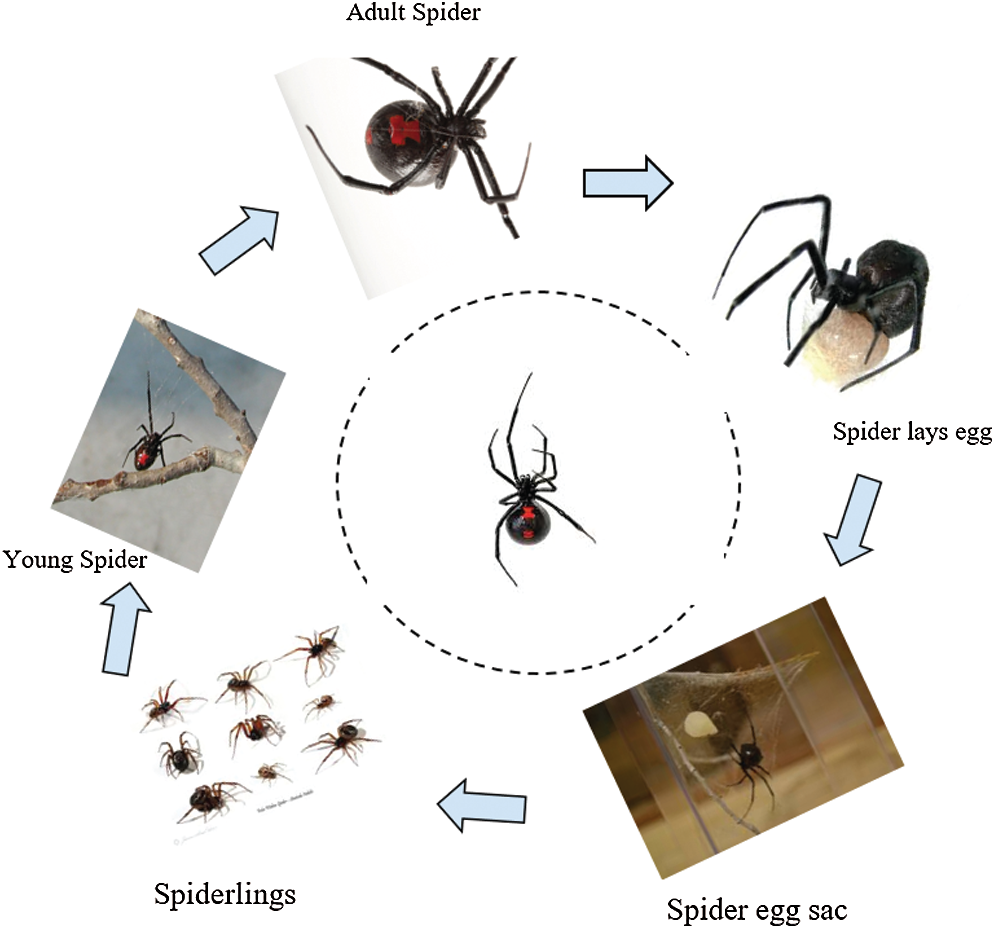
Figure 2: BWO life cycle
Every widow spider describes the problem variable values (here, VGG-16 learning rates are initialized as BWO population whereas the iteration is repeated, until the optimal learning rate is achieved). Here, the solutions are declared as an array. The number of optimization problems is declared as widow, which represents the solution of initialized problem. The array is declared as
where w1 and w2 denote the initialized population and
COVID 19 images are detected in the proposed work by feature extraction-based VGG-16 network, where its optimal learning rate improves the detection accuracy. Hence, the fitness of BWO is as follows.
For initialization,
The sets are free from one another and begin to mate so as to create the offsprings. In real-time, around 1000 eggs are delivered during every individual mating. However, in the long run, only a portion of strong spider lings survive. In BWO, an array called alpha is be made as a widow which exhibits arbitrary amounts. Then, the offspring is generated through
At last, both spider lings as well as parent spider are appended to a cluster and are arranged using the fitness value. Based on cannibalism rating, the optimal ones are included most likely as the late created people. These methods apply to all sets.
The initial one is sexual cannibalism, where the female black widow eats the male counterpart after mating. Based on the fitness value, we can identify female and male spiders. The next one is sibling cannibalism, here the stronger one eats the weaker one and based on cannibalism rating (CR), the number of survivors is calculated. Then, in third one, the baby spiders eat their mother.
During this process, the mutepop number of people from the population is arbitrarily selected. Each one of the selected solution arbitrarily trades two components in the cluster. Mutepop is determined using the mutation rate.
Three stopping criteria can be considered such as number of iteration, optimal fitness evaluation, and maximum accuracy.
4.6 Pseudo Code of BWO Algorithm
Input: Maximum number of iteration, 3 rates (procreating, cannibalism and mutation)
Output: Optimal learning rate.
Step 1: Initialize the population p for a D-dimensional problem
Step 2: Depending upon the procreating rate, find the number of reproduction
Step 3: Procreation and Cannibalism
For iteration =1 to
(i) Arbitrarily choose two solutions as a parent from p1
(ii) Produce child using the Eqs. (3), (4) and terminate the father
(iii) Using cannibalism rate, the weak spiderlings are omitted and the remaining solutions are saved as p2.
End for
Step 4: Mutation: Find the mutated spiderling count based on this rate
For iteration = 1 to
(i) Randomly select one solution from p1
(ii) Mutate and generate new one and save it into p3.
End for
Step 5: Updating the solution
Step 6: Return the best solution from population p
The proposed deep optimal VGG-16 based COVID-19 detection model was implemented in MATLAB 2016a with system configuration given herewith; i5 processor and 4 GB RAM. The current study considered two CXR datasets with different symptoms. COVID-19 images were detected from two datasets by the proposed algorithm and their performances were analyzed by the confusion matrix measures. Then, the results were compared with other Deep Learning networks.
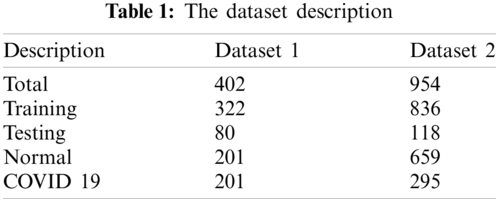
Tab. 1 tabulates the data of CXR images for both the datasets. During preparation, the COVID-19 positive X-ray are considered while the patients’ ages was in the range of 12–93. Likewise, the researcher also considered the COVID-19 and non-COVID-19 chest X-ray images. In any case, a total of 402 images was considered (same as COVID-19 chest X-ray images) whereas the researcher also considered ordinary chest X-ray images for preparation and testing purposes. In dataset 2, the study considered 954 images for training as well as testing purposes. Fig. 3 portrays the CXR images collected from GitHub storehouse.
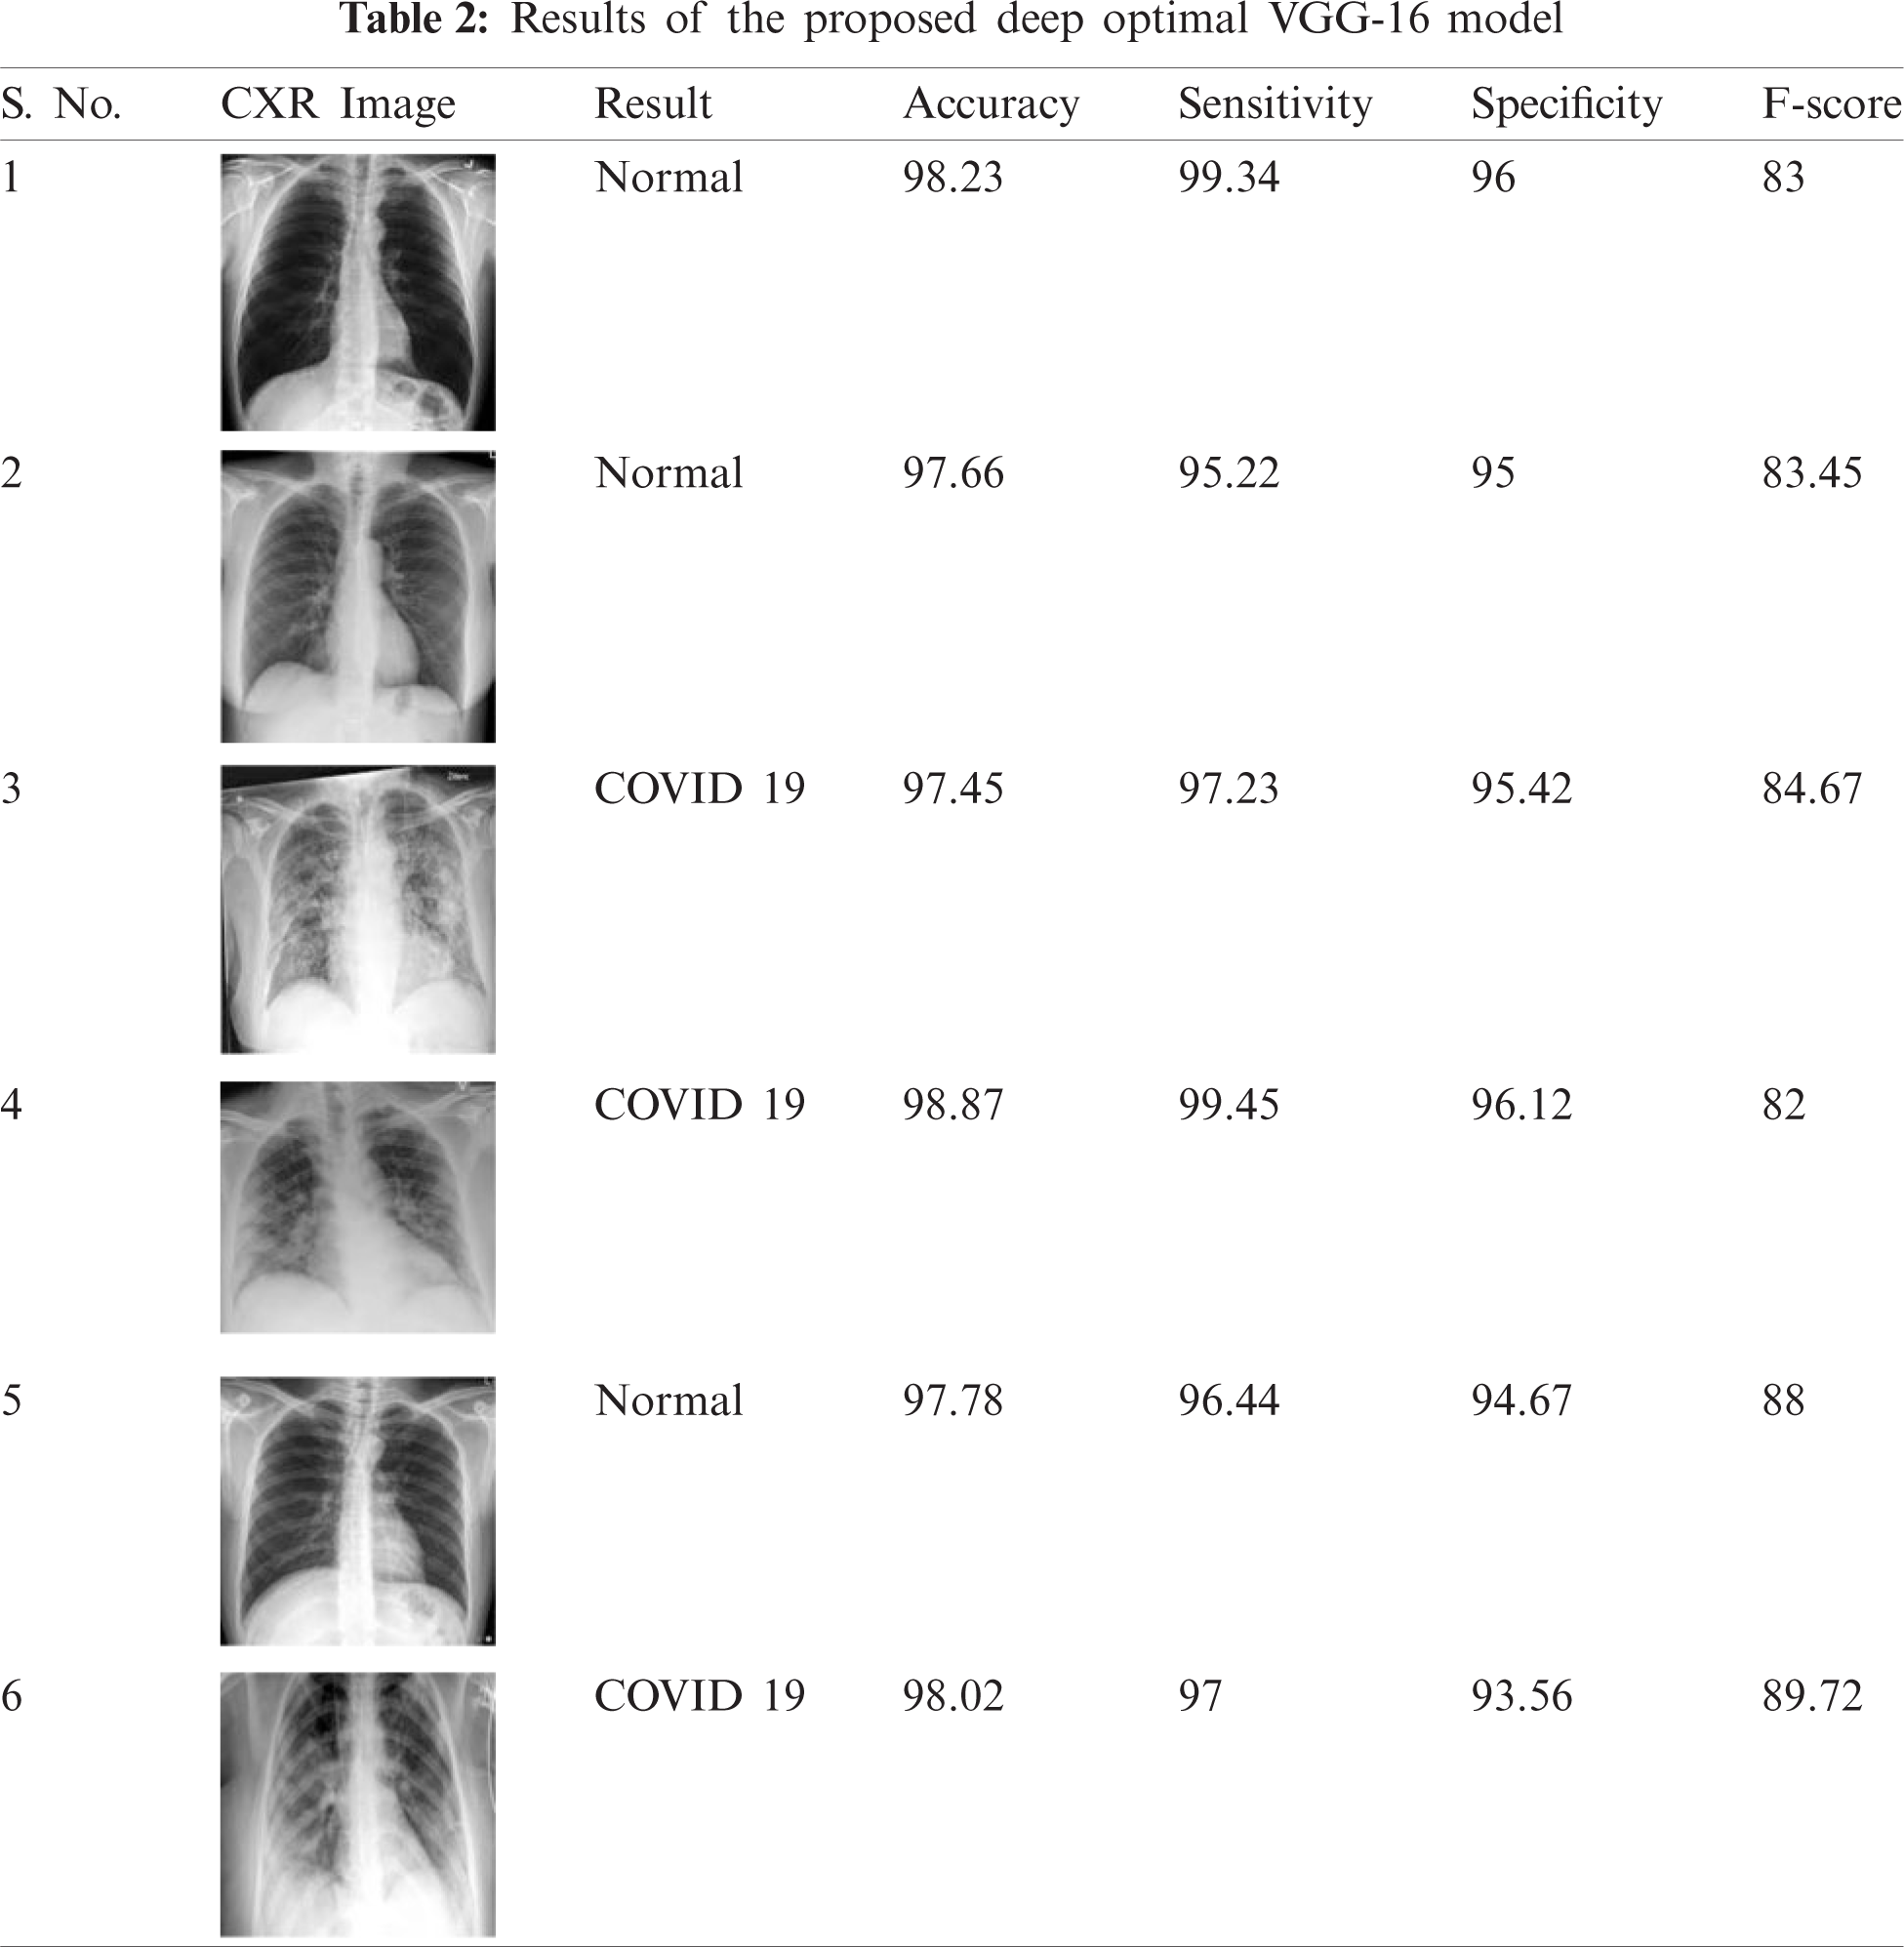
Tab. 2 describes the evaluation factors namely, accuracy, sensitivity and specificity of the proposed VGG16-BWO. Then, it is compared with existing Deep Learning networks like VGG16, AlexNet, GoogleNet and Resnet18. For CXR image dataset, the attained accuracy was high, i.e., 98.87 in VGG16-BWO, because the learning rate of VGG16 model got optimized by BWO algorithm. This model achieved good results compared to other Deep Learning networks like VGG16, AlexNet, GoogleNet and Resnet18. The table shows the results of six CXR images. The study achieved highest values for the measures considered in the detection of COVID-19 i.e., 98.87% accuracy, 96.12% sepcificity, 99.45% sensitivity and F-score being 82. Similarly, the performance measures for other CXR images are depicted in the table.
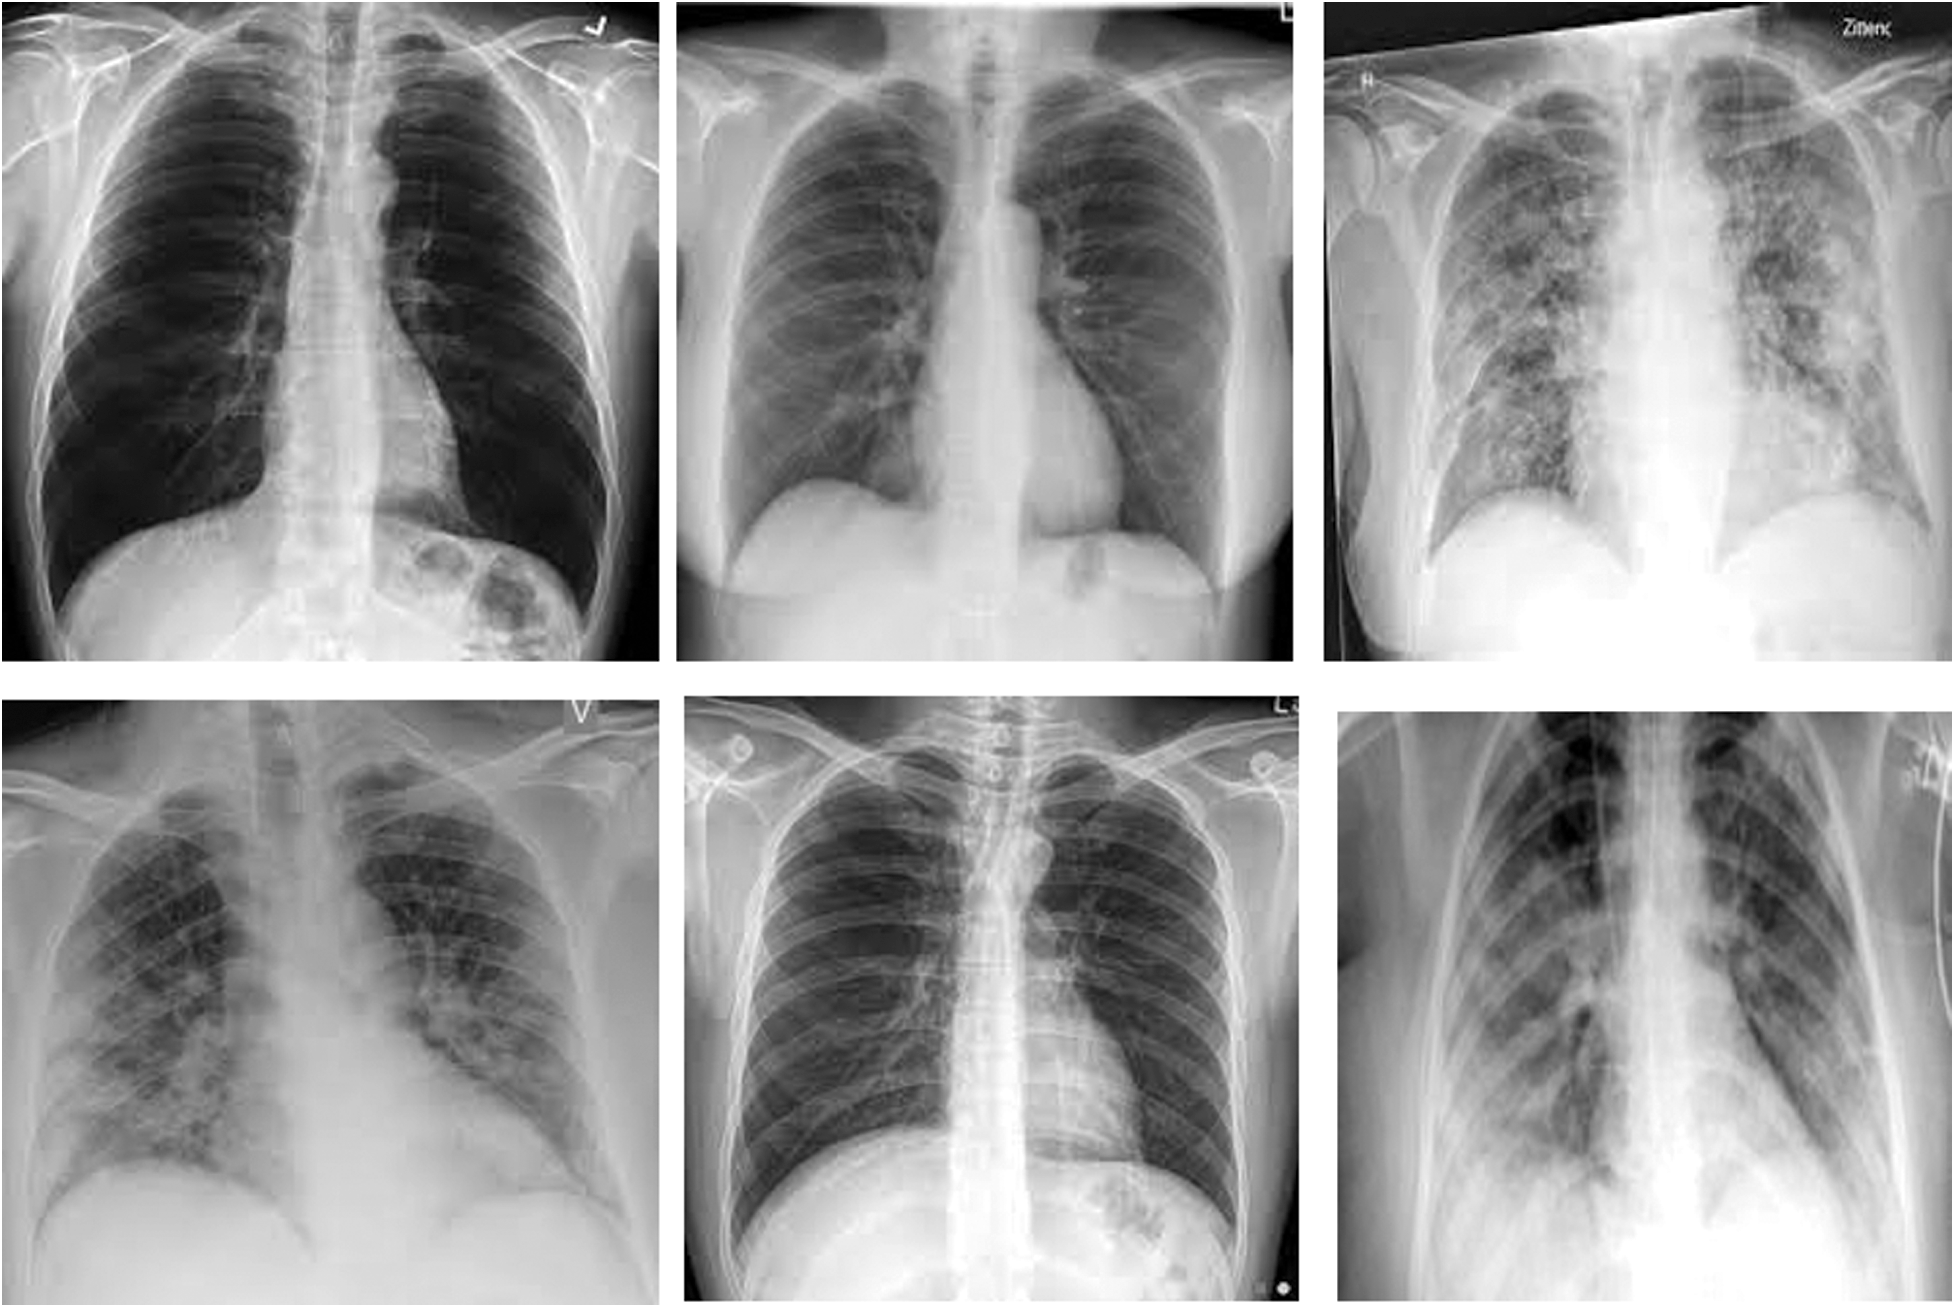
Figure 3: CXR images from github repository
5.1 Comparison of Deep Learning Networks with Proposed Model
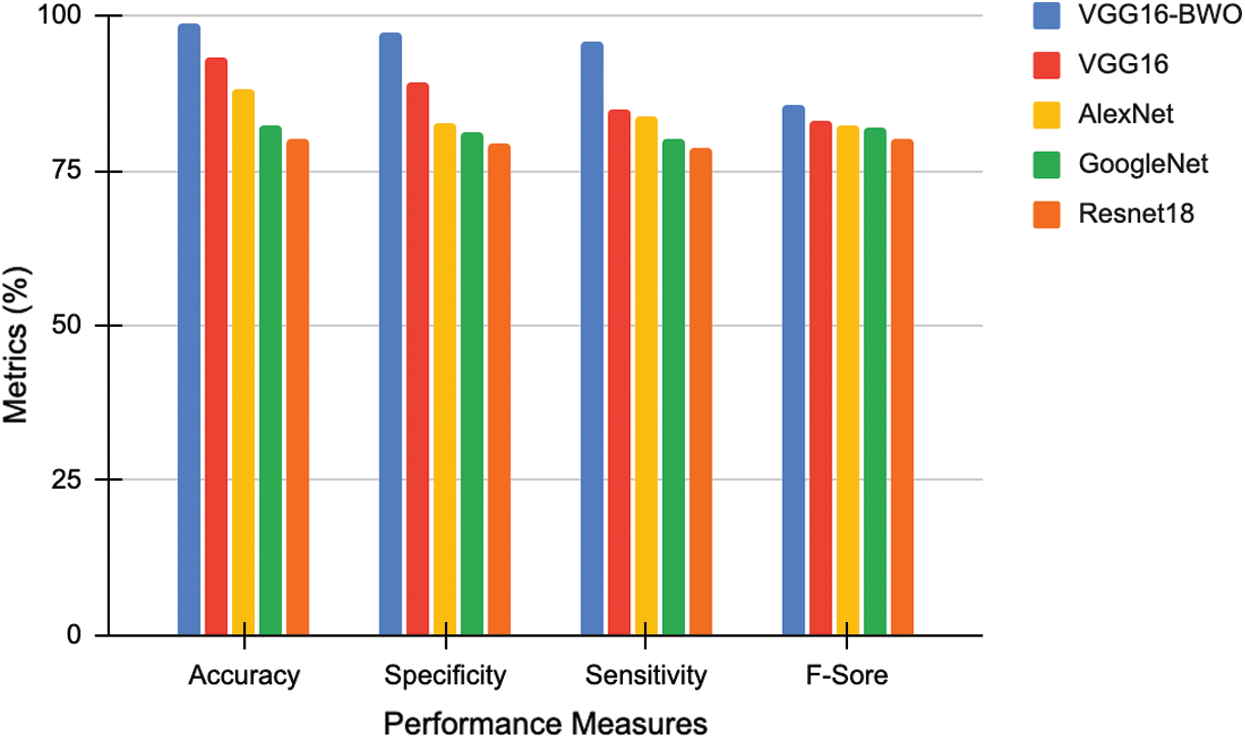
Figure 4: The comparative analysis of deep networks with proposed model for dataset 1
Figs. 4 and 5 show the comparative analysis of DL networks with the proposed model for the datasets, 1 and 2. For dataset 1, the general accuracy values achieved were 98.89%, 93.5%, 89.75%, 88.34% and 86% for VGG16-BWO, VGG16, AlexNet, GoogleNet and Resnet18 respectively. The proposed model attained the maximum accuracy in comparison with other Deep Learning networks. The proposed method accomplished high performance in comparison with other models regarding distinct measures. These measurements were determined based on the potential results attained from dataset acquired from confusion matrix. Likewise, for dataset 2, VGG16-BWO, VGG16, AlexNet, GoogleNet and Resnet18 achieved accuracy values such as 98.3%, 89.8%, 94.9%, 86.34% and 80%, respectively. The projected technique achieved the highest F-score of 86.3, while Resnet18 achieved a lower F-score of 80.02%.
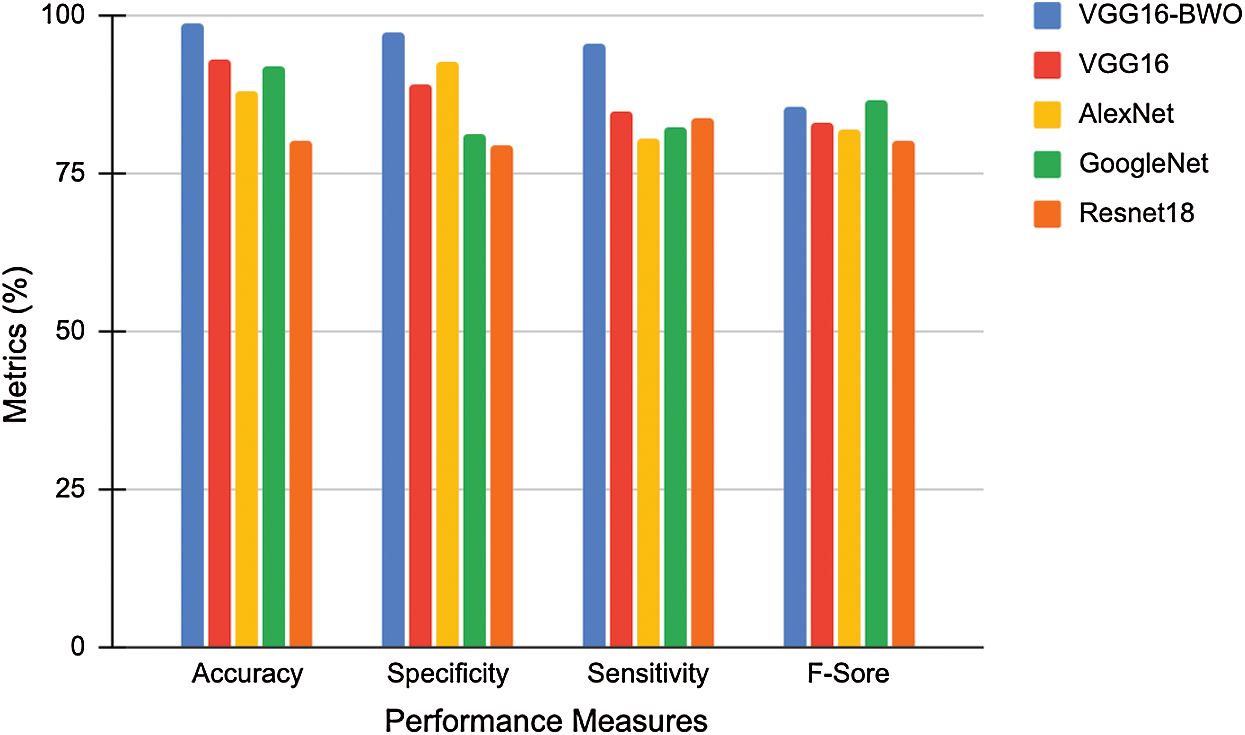
Figure 5: Comparative analysis of deep networks with the proposed model for dataset 2
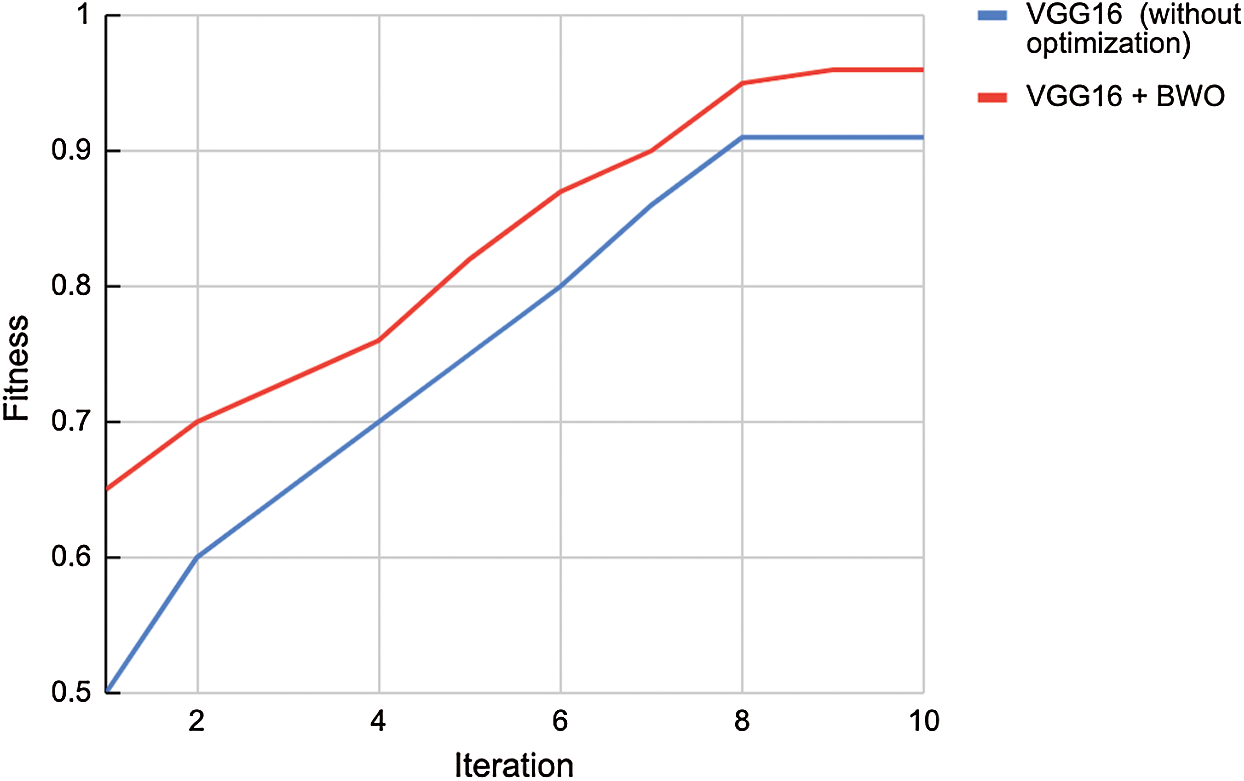
Figure 6: Convergence graph
Fig. 6 shows the intermingling graph for VGG16 and VGG16 + BWO by changing the number of cycles (for instance, 0 to 10). The fitness chart shows that the values got directly increased from 0.65 to 0.97 for the cycles, 0 to 10. In comparison with VGG-16 without enhancement strategy, the proposed method achieved better fitness score of 0.96 at the most extreme iteration.
Figs. 7 and 8 outline the accurate investigation of COVID-19 detection rate over CXR pictures and the execution time analysis separately. The figure shows that the proposed VGG16-BWO model distinguished the most number of images precisely multi-highlight extraction method. The basic VGG16, without enhancement, achieved moderate outcomes. Likewise, the handling season of the proposed metaheuristic calculations was investigated. It was inferred that BWO and VGG16 accomplished the least computational time in contrast to other existing deep learning methods.
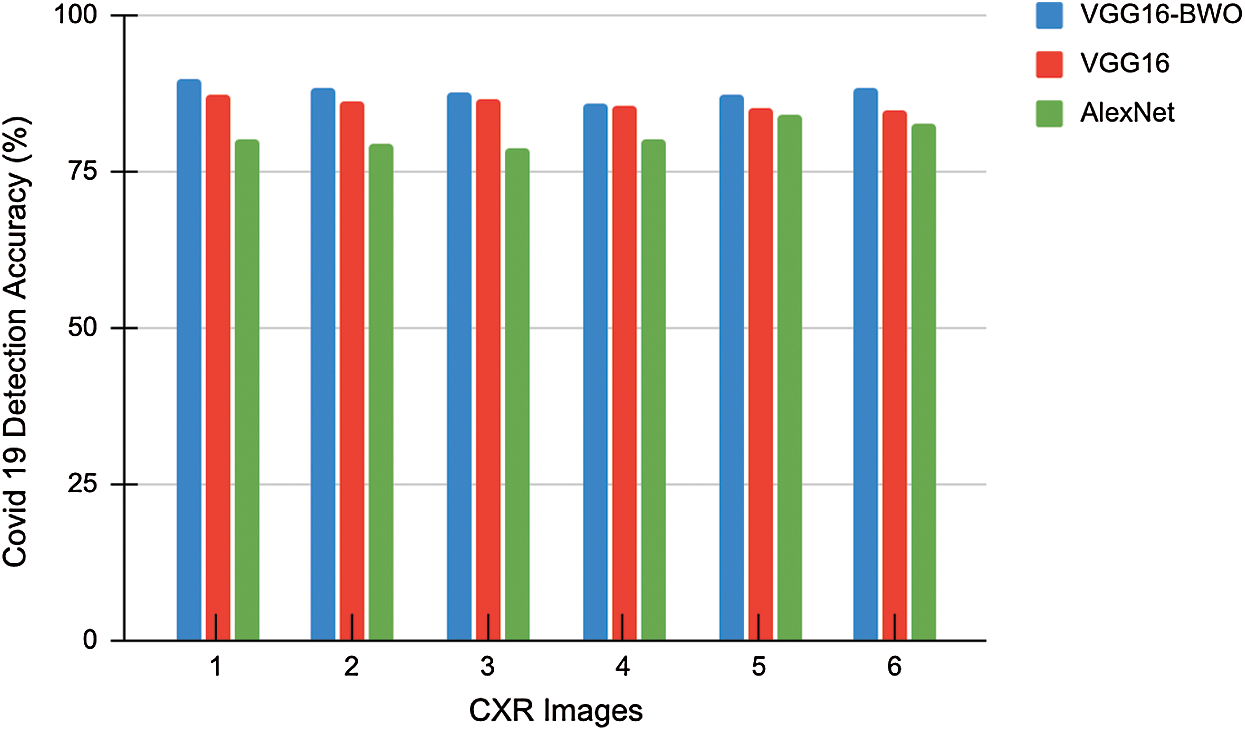
Figure 7: COVID-19 detection accuracy
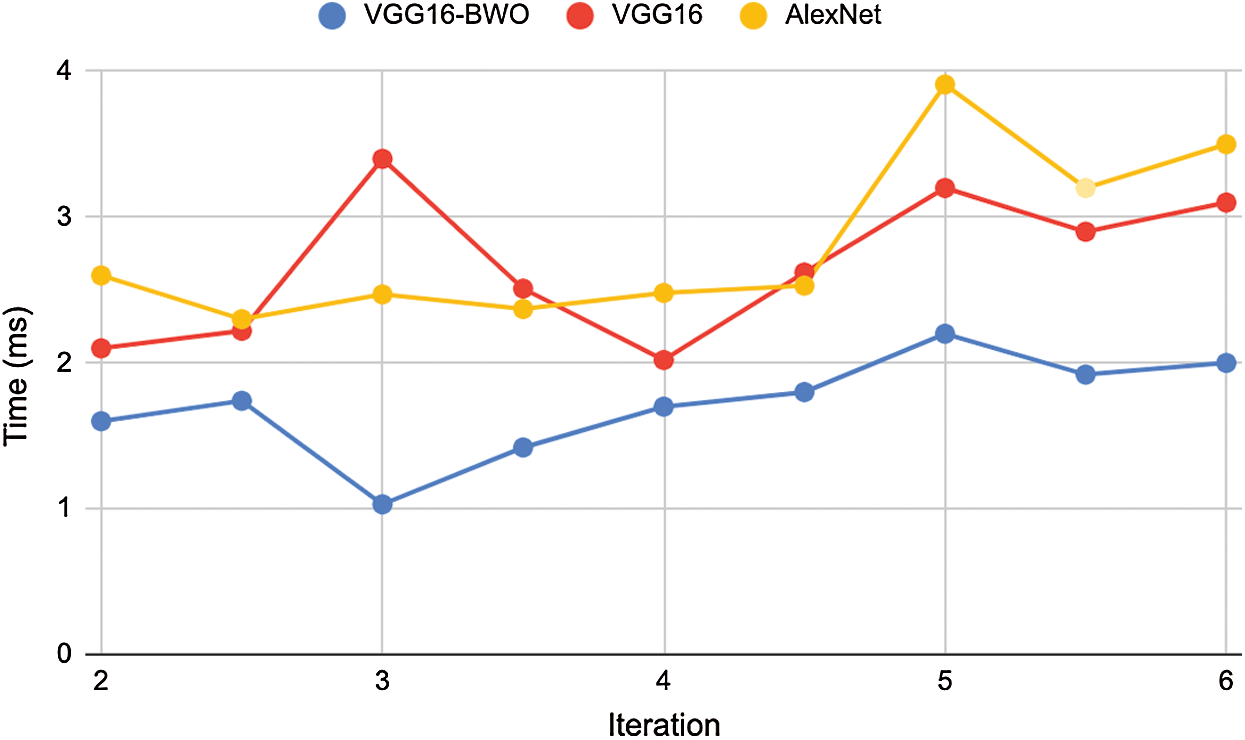
Figure 8: Execution time analysis
The paper focused on COVID-19 detection from CXRs in the field of medical application. A significant issue in image detection technique is to evaluate the optimal subsection of features from input images in the dataset considered. The image was resized further detection process. Here, multiple features such as SIFT, SURF and FAST were extracted for the study. Then, the optimal features were extracted and the images were segregated as COVID-19 and normal images by the proposed model (DeVGGCovNet). The BWO algorithm was implemented which achieved the optimal learning rate. Finally, COVID-19 influenced feature extraction and VGG16 recognized the images with learning rate advancement procedures. From the examination, the test result established that the proposed VGG16 with BWO model accomplished better outcomes in comparison with other methods (CNN, AlexNet, Resnet18). The method’s effectiveness was validated under different dimensions such as accuracy, F-score and specificity. Future investigations on COVID-19 detection technique can improve characterization accuracy by eliminating the remarkable highlights in CXR picture. Furthermore, future research works can focus on blending metaheuristic calculations for selecting the ideal element and powerful hierarchy.
Funding Statement: The authors are grateful to Taif University Researchers Supporting Project Number (TURSP-2020/215), Taif University, Taif, Saudi Arabia. This work is also supported by the Faculty of Computer Science and Information Technology, University of Malaya, under Postgraduate Research Grant (PG035-2016A).
Conflicts of Interest: The authors declare that they have no conflicts of interest to report regarding the present study.
1. L. B. Adair and E. J. Ledermann, “Chest CT findings of early and progressive phase COVID-19 infection from a US patient,” Radiology Case Reports, vol. 15, no. 7, pp. 819–824, 2020. [Google Scholar]
2. X. Xie, Z. Zhong, W. Zhao, C. Zheng, F. Wang et al., “Chest CT for typical coronavirus disease 2019 (COVID-19) pneumonia: Relationship to negative RT-PCR testing,” Radiology, vol. 296, no. 2, pp. E41–E45, 2020. [Google Scholar]
3. L. Brunese, F. Mercaldo, A. Reginelli and A. Santone, “Explainable deep learning for pulmonary disease and coronavirus COVID-19 detection from X-rays,” Computer Methods and Programs in Biomedicine, vol. 196, no. 20, pp. 105608, 2020. [Google Scholar]
4. D. Das, K. C. Santosh and U. Pal, “Truncated inception net: COVID-19 outbreak screening using chest X-rays,” Physical and Engineering Sciences in Medicine, vol. 43, no. 3, pp. 915–925, 2020. [Google Scholar]
5. D. Brinati, A. Campagner, D. Ferrari, M. Locatelli, G. Banfi et al., “Detection of COVID-19 infection from routine blood exams with machine learning: A feasibility study,” Journal of Medical Systems, vol. 44, no. 8, pp. 1–12, 2020. [Google Scholar]
6. P. K. Sethy, S. K. Behera, P. K. Ratha and P. Biswas, “Detection of coronavirus disease (COVID-19) based on deep features and support vector machine,” International Journal of Mathematical, Engineering and Management Sciences, vol. 5, no. 4, pp. 643–651, 2020. [Google Scholar]
7. I. D. Apostolopoulos and T. A. Mpesiana, “Covid-19: Automatic detection from X-ray images utilizing transfer learning with convolutional neural networks,” Physical and Engineering Sciences in Medicine, vol. 43, no. 2, pp. 635–640, 2020. [Google Scholar]
8. R. Kumar, R. Arora, V. Bansal, V. J. Sahayasheela, H. Buckchash et al., “Accurate prediction of COVID-19 using chest x-ray images through deep feature learning model with SMOTE and machine learning classifiers,” preprint: medRxiv, vol. 2020, pp. 1–10, 2020. [Google Scholar]
9. A. Narin, C. Kaya and Z. Pamuk, “Automatic detection of coronavirus disease (covid-19) using x-ray images and deep convolutional neural networks,” arXiv preprint arXiv:2003, pp. 1–31, 2020. [Google Scholar]
10. I. D. Apostolopoulos and T. A. Mpesiana, “Covid-19: Automatic detection from x-ray images utilizing transfer learning with convolutional neural networks,” Physical and Engineering Sciences in Medicine, vol. 43, no. 2, pp. 635–640, 2020. [Google Scholar]
11. I. Apostolopoulos, S. Aznaouridis and M. A. Tzani, “Extracting possibly representative COVID-19 biomarkers from X-Ray images with deep learning approach and image data related to pulmonary diseases,” Journal of Medical and Biological Engineering, vol. 40, no. 3, pp. 462–469, 2020. [Google Scholar]
12. P. K. Sethy, S. K. Behera, P. K. Ratha and P. Biswas, “Detection of coronavirus disease (covid-19) based on deep features,” Preprints, pp. 2020030300, 2020. [Google Scholar]
13. N. E. M. Khalifa, M. H. N. Taha, A. E. Hassanien and S. Elghamrawy, “Detection of coronavirus (COVID-19) associated pneumonia based on generative adversarial networks and a fine-tuned deep transfer learning model using chest x-ray dataset,” arXiv preprint arXiv:2004.01184, pp. 1–15, 2020. [Google Scholar]
14. V. Chouhan, S. K. Singh, A. Khamparia, D. Gupta, P. Tiwari et al., “A novel transfer learning based approach for pneumonia detection in chest x-ray images,” Applied Sciences, vol. 10, no. 2, pp. 559, 2020. [Google Scholar]
15. O. Stephen, M. Sain, U. J. Maduh and D. U. Jeong, “An efficient deep learning approach to pneumonia classification in healthcare,” Journal of Healthcare Engineering, vol. 2019, no. 107, pp. 1–7, 2019. [Google Scholar]
16. G. Liang and L. Zheng, “A transfer learning method with deep residual network for pediatric pneumonia diagnosis,” Computer Methods and Programs in Biomedicine, vol. 187, pp. 104964, 2020. [Google Scholar]
17. M. Nour, Z. Co¨mert and Kemal Polat, “A novel medical diagnosis model for COVID-19 infection detection based on deep features and bayesian optimization,” Applied Soft Computing, vol. 97, no. 5, pp. 106580, 2020. [Google Scholar]
18. A. M. Ismael and A. Şengür, “Deep learning approaches for covid-19 detection based on chest x-ray images,” Expert Systems with Applications, vol. 164, no. 4, pp. 114054, 2021. [Google Scholar]
19. L. Wang, Z. Q. Lin and A. Wong, “COVID-Net: A tailored deep convolutional neural network design for detection of COVID-19 cases from chest radiography images,” Scientific Reports, vol. 10, no. 1, pp. 1–12, 2020. [Google Scholar]
20. J. F. H. S. Cruz, “An ensemble approach for multi-stage transfer learning models for COVID-19 detection from chest CT scans,” Intelligence-Based Medicine, vol. 5, pp. 1–9, 2021. [Google Scholar]
21. L. Li, L. Qin, Z. Xu, Y. Yin, X. Wang et al., “Artificial intelligence distinguishes covid-19 from community acquired pneumonia on chest CT,” Radiology, vol. 296, no. 2, pp. E65–E71, 2020. [Google Scholar]
22. Y. Pathak, P. K. Shukla, A. Tiwari, S. Stalin, S. Singh et al., “Deep transfer learning based classification model for covid-19 disease,” IRBM, pp. 1–6, 2020. [Online]. Available: https://doi.org/10.1016/j.irbm.2020.05.003. [Google Scholar]
23. H. Panwar, P. K. Gupta, M. K. Siddiqui, R. M. Menendez and V. Singh, “Application of deep learning for fast detection of covid-19 in x-rays using ncovnet,” Chaos, Solitons & Fractals, vol. 138, no. 3, pp. 1–8, 2020. [Google Scholar]
24. S. Sheykhivand, Z. Mousavi, S. Mojtahedi, T. Y. Rezaii, A. Farzamnia et al., “Developing an efficient deep neural network for automatic detection of COVID-19 using chest X-ray images,” Alexandria Engineering Journal, vol. 60, no. 3, pp. 2885–2903, 2021. [Google Scholar]
25. K. Shankar and E. Perumal, “A novel hand-crafted with deep learning features based fusion model for COVID-19 diagnosis and classification using chest X-ray images,” Complex & Intelligent Systems, pp. 1–14, 2020. [Online]. Available: https://doi.org/10.1007/s40747-020-00216-6. [Google Scholar]
26. V. Hayyolalam and A. A. P. Kazem, “Black widow optimization algorithm: A novel meta-heuristic approach for solving engineering optimization problems,” Engineering Applications of Artificial Intelligence, vol. 87, no. 1, pp. 1–28, 2020. [Google Scholar]
27. S. Tabik, A. G. Ríos, J. L. M. Rodríguez, I. S. García, M. R. Area et al., “COVIDGR dataset and covid-sdnet methodology for predicting covid-19 based on chest x-ray images,” IEEE J. Biomed. Health Inform., vol. 24, no. 12, pp. 3595–3605, 2020. [Google Scholar]
28. Y. H. Wu, S. H. Gao, J. Mei, J. Xu, D. P. Fan et al., “JCS: An explainable covid-19 diagnosis system by joint classification and segmentation,” IEEE Transactions on Image Processing, vol. 30, pp. 3113–3126, 2021. [Google Scholar]
29. R. Sethi, M. Mehrotra and D. Sethi, “Deep learning based diagnosis recommendation for covid-19 using chest x-rays images,” in 2020 Second Int. Conf. on Inventive Research in Computing Applications, Coimbatore, India, pp. 1–4, 2020. [Google Scholar]
30. D. N. Le, V. S. Parvathy, D. Gupta, A. Khanna, J. J. P. C. Rodrigues et al., “IoT enabled depthwise separable convolution neural network with deep support vector machine for COVID-19 diagnosis and classification,” International Journal of Machine Learning and Cybernetics, pp. 1–14, 2021. [Online]. Available: https://doi.org/10.1007/s13042-020-01248-7. [Google Scholar]
31. D. A. Pustokhin, I. V. Pustokhina, P. N. Dinh, S. V. Phan, G. N. Nguyen et al., “An effective deep residual network based class attention layer with bidirectional LSTM for diagnosis and classification of COVID-19,” Journal of Applied Statistics, pp. 1–18, 2020. [Online]. Available: https://doi.org/10.1080/02664763.2020.1849057. [Google Scholar]
32. COVID-19 Chest X-ray dataset, 2020. [Online]. Available: https://github.com/agchung/Figure1-COVID-chestxray-dataset [Accessed on 7 September 2020]. [Google Scholar]
 | This work is licensed under a Creative Commons Attribution 4.0 International License, which permits unrestricted use, distribution, and reproduction in any medium, provided the original work is properly cited. |