DOI:10.32604/cmc.2022.019029
| Computers, Materials & Continua DOI:10.32604/cmc.2022.019029 | |
| Article |
An Eigenspace Method for Detecting Space-Time Disease Clusters with Unknown Population-Data
1Department of Fundamental & Applied Sciences, Universiti Teknologi PETRONAS, Seri Iskandar, 32610, Perak, Malaysia
2Center for Applied Intelligent Systems Research (CAISR), Halmstad University, Halmstad, SE-301 18, Sweden
3Department of Statistics, University of Peshawar, Pakistan
*Corresponding Author: Sami Ullah. Email: sami.khan3891@gmail.com
Received: 30 March 2021; Accepted: 01 May 2021
Abstract: Space-time disease cluster detection assists in conducting disease surveillance and implementing control strategies. The state-of-the-art method for this kind of problem is the Space-time Scan Statistics (SaTScan) which has limitations for non-traditional/non-clinical data sources due to its parametric model assumptions such as Poisson or Gaussian counts. Addressing this problem, an Eigenspace-based method called Multi-EigenSpot has recently been proposed as a nonparametric solution. However, it is based on the population counts data which are not always available in the least developed countries. In addition, the population counts are difficult to approximate for some surveillance data such as emergency department visits and over-the-counter drug sales, where the catchment area for each hospital/pharmacy is undefined. We extend the population-based Multi-EigenSpot method to approximate the potential disease clusters from the observed/reported disease counts only with no need for the population counts. The proposed adaptation uses an estimator of expected disease count that does not depend on the population counts. The proposed method was evaluated on the real-world dataset and the results were compared with the population-based methods: Multi-EigenSpot and SaTScan. The result shows that the proposed adaptation is effective in approximating the important outputs of the population-based methods.
Keywords: Space-time disease clusters; Eigenspace method; nontraditional data sources; nonparametric methods
With the advent of electronic medical records, syndromic data sources, and low-cost location sensors, data on disease occurrences or other health-related events are increasingly encoded with both spatial and temporal information. Based on this data, Health authorities conduct surveillance to search for the potential clusters of disease or other health-related events. In public health, cluster detection aims to identify those spatiotemporal regions that contain unexpected counts of disease cases or other health-related events. The detection of such potential clusters facilitates the health officials’ efforts to identify their targets of interest for possible interventions. Such clusters show the over-density anomalies in the spatiotemporal space which assist epidemiologists in finding the environmental factors responsible for a particular disease outbreak in the area.
A number of parametric methods have been developed for detecting space-time clusters in public health data. The examples are Space-time Scan Statistic (SaTScan) [1,2], Expectation-based Scan Statistic [3,4], Flexible Space-time Scan Statistic [5,6], Space-time Permutation Scan Statistic [7,8], and EvoGridStatistic [9,10]. All these methods are based on Maximum Likelihood Estimation (MLE) which put some constraints on the distribution and quality of data that are valid only for clinical data which are collected from the hospitals and are not necessarily valid for non-traditional/nonclinical data sources. For example, data collected from social media [11], pharmacy sales, and school health surveys are non-traditional or non-clinical data sources for public health surveillance [12], where the parametric model might be very restrictive i.e., difficult to be followed. For such data sources, MLE-based methods like SaTScan are not an ideal choice for disease cluster detection. Addressing this problem, the nonparametric methods called EigenSpot [13] and Multi-EigenSpot [14] have recently been developed that make no assumption about the distribution and quality of data. However, these nonparametric methods require that the population counts be available. This is a big limitation, because, in some least developed countries census population data are not available. In addition, the population counts are difficult to approximate for some surveillance data such as emergency department visits and over-the-counter drugs sales where the catchment area for each hospital/pharmacy is undefined. Even if the population counts are available, the catchment area population would not be a good denominator since there can be natural geographical disparity in health-care utilization data, due to disparities in disease prevalence, access to health care, and consumer behavior [15].
In order to address this problem, we adapt the Multi-EigenSpot algorithm to be applicable for disease surveillance in such a realistic scenario. Multi-EigenSpot uses a population-based estimator for expected disease occurrences that has been frequently used in prior arts [9,16]. We propose an adaptation by using a different estimator of the expected disease occurrences in the algorithm which does not depend on the population counts. The proposed adaptation infers the expected disease counts from the observed disease counts only. The experimental evaluation on real-world data shows that the proposed adaptation is effective in approximating the significant outputs of the population-based methods.
Some nonparametric alternatives to the MLE-based scan statistics have also been proposed such as [17–19]. However, these are purely spatial techniques that can detect purely spatial clusters while this research focuses on the space-time cluster detection problem. It is evident from the literature that the Eigenspace-based methods [13,14] are the latest nonparametric technique in the spatiotemporal class of methods for areal-count data.
The stepwise process of the proposed approach is given below:
Step 1: Given the observed disease counts, estimate the spatiotemporal matrices of expected disease cases, E and Risk measures, R according to Eqs. (1) and (2), respectively.
where Eij is the expected disease count for ith sub-region over the jth time-point;
where Eij is the expected disease count for the ith sub-region over the jth time-point;
Step 2: Calculate the principal-left and principal-right singular vectors of matrices C and E using one-rank singular value decomposition. For matrix C, the principal-left singular vector is denoted by
Step 3: Compute the difference vector of the left-singular vectors as
Step 4: Find the abnormally higher elements in each subtract vector DS and DT by applying the Z-control chart with the significance level alpha. The abnormally higher elements in the vector DS are associated with the spatial component of the cluster and in vector DT to the temporal component.
Step 5: If the abnormally higher elements are found in spatial as well as temporal dimension, upgrade matrix C by replacing the elements corresponding to the out-of-control components with the respective expected cases to remove the previous cluster. Simultaneously, matrix R is upgraded by replacing the elements corresponding to the out-of-control components by their average value.
Step 6: To approximate the additional clusters, if exist, reiterate Steps (2–5) until no out-of-control element is found in each difference vector.
Step 7: In the upgraded matrix R, replace the elements corresponding to the components that are not found to be abnormal by 1 to distinguish clearly between the normal and abnormal regions.
Step 8: Visualize the resultant matrix R as a heatmap to show multiple clusters with different colors.
What is novel with the proposed adaptation is the strategy used for estimating the expected disease counts. Population-based Multi-EigenSpot uses the historical temporal information for population-at-risk while our proposed method infers this indirectly from the geographical neighborhood. For each region and time point, we calculate the expected number of a particular disease counts conditioning on the observed marginal.

Figure 1: An example illustrating the proposed approach
Fig. 1 shows the detailed process that how our proposed method detects multiple clusters in a spatiotemporal space with no requirement for population counts. For instance, assume that two different hotspots exist in a 3 × 4 spatiotemporal space. The two shaded areas in matrix C (Fig. 1) are the two clusters of interest to be approximated by our proposed approach. The intersection of the third row with the first-second columns denotes the most likely hotspot and the second-third rows with the fourth column the secondary (additional) cluster. The input is only the spatiotemporal matrix of the observed disease counts denoted by C. Given the matrix C, the proposed method approximates these two clusters in two iterations. The most likely cluster is detected in the first iteration. The detected hotspot is then removed by replacing the observed counts with the corresponding expected counts, and the method is repeated for the secondary cluster. In the last upgraded matrix R, the cells containing the value M1 represent one cluster and that containing the value M2 represents the other cluster.

Figure 2: Heatmap
3.1 Experiment with the Real-World Dataset
In this section, the proposed approach is applied to the measles case data in Khyber–Pakhtunkhwa, Pakistan (Jan 2016–Dec 2016), assuming the population is unknown. This dataset has been described in detail elsewhere [14]. The proposed method is executed in MATLAB (version R2014a). Based on the spatiotemporal data on the observed measles cases, the proposed method with alpha = 0.10, results in a heatmap as shown in Fig. 2, showing the potential measles hotspots. The resulting heatmap shows three potential measles clusters in Khyber-Pakhtunkhwa in the period from January 2016 to December 2016. The most likely cluster is seen in the district of Bannu for May, October, and December with an average Relative Risk (RR) = 1.677, denoted with a dark red color on the heatmap. The secondary cluster is seen in the district Bannu for April with an average RR = 1.614, denoted by a light red color on the heatmap. The third cluster is seen in the two districts (Kohat and D. I. Khan) for March and April with an average RR = 1.58, represented with a yellow color on the heatmap. These hotspot regions have also been detected by the Multi-EigenSpot and Space-time Scan Statistics in the previous study on the same dataset [14] and hence confirm that the proposed approach is effective for surveillance data with unknown population-at-risk information.

Figure 3: Geographical map of the study area showing the locations of Measles clusters with red color
It is obvious from Fig. 3 that all the hotspots’ regions identified by the proposed approach are adjacent to Federally Administrative Tribal Areas (FATA). Indeed, due to military operations during the years 2014–2016, the Internally Displaced People (IDP) from FATA were settled in the neighboring districts which might have caused the measles outbreak in the hosting districts. Because FATA and IDP camps suffer from a low vaccination rate due to lack of awareness [20,21].
3.2 Performance Comparison with Population-Based Methods
In this section, we compare the outputs of our proposed method with Multi-EigenSpot and SaTScan which have already been applied to the same dataset [14]. The outputs of these three methods are presented in Tab. 1. It is obvious from Tab. 1 that the regions detected by our proposed method were also detected by Multi-EigenSpot and SaTScan. Our proposed method detects (Bannu, May, Oct, Dec,) as the most likely cluster and (Bannu, Apr) as the secondary cluster. It is very interesting to know that the most likely and secondary clusters of the proposed approach are the same as detected by the population-based Muti-EigenSpot. Moreover, our approach detects (Kohat, D. I. Khan, Mar, Apr) as the third cluster while Multi-EigenSpot detects (Bannu, Kohat, D. I. Khan, Mar) as the third cluster, showing the two districts and one month in common.
The outputs of the proposed approach are also included in the significant outputs of the SaTScan. The Space-time Scan Statistics detects (Bannu, Apr-May) as the most likely cluster. This cluster is covered by the first two clusters of the proposed method. The secondary cluster of the SaTScan (Kohat, Mar-Apr) is covered in the third cluster of our proposed method.
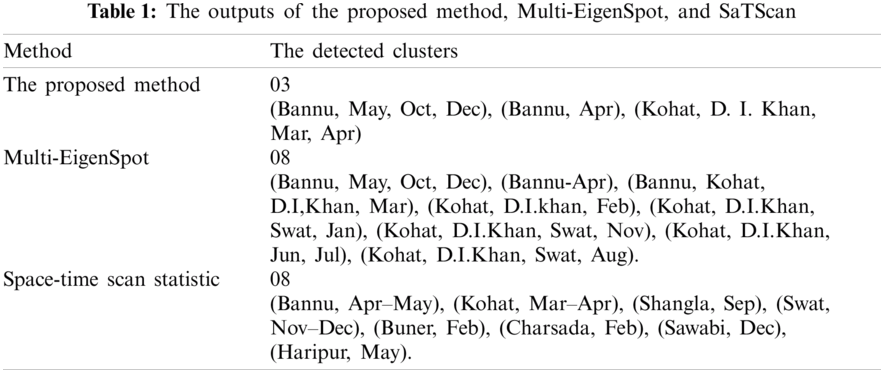
The proposed approach detects the first three high-risk clusters while using the population counts, the detection ratio can be increased up to 8 clusters. This suggests that if the population counts are is possible to be approximated, then using this extra information, Multi-EigenSpot performs better than our proposed approach.
We proposed the first Eigenspace-based method which allows the nonparametric practice to detect clusters in the scenarios where the population counts are unavailable or difficult to approximate. Our proposed method replaces the temporal inference in methods like EigenSpot [13] and Multi-EigenSpot [14] with geographical inference which ultimately results in a method that can be used for hotspots detection in the least developed countries where population data is not available or very expensive to obtain. The results indicate that the proposed approach can detect the significant clusters with no need for the population counts. The proposed adaptation can delineate the boundaries of a disease outbreak and its potential to guide the control efforts in many least developed countries where the population data are not available or difficult to access. In addition, the proposed method can be used as a nonparametric solution for cluster detection in many research fields such as criminology [22,23], network [24], and environment [25] where the population data is not relevant.
The proposed method does not account for the spatial and temporal covariates which would make it impractical to examine all ‘unusual’ events, implicitly diminishing the significance of the surveillance. Extending the proposed method to adjust the population-at-risk-data for spatial and temporal covariate is recommended for future work in this area.
Acknowledgement: The authors grateful to Universiti Teknologi PETRONAS for providing facilities for the research.
Funding Statement: This article was funded by a Fundamental Research Grant Scheme (FRGS) from the Ministry of Education, Malaysia (Ref: FRGS/1/2018/STG06/UTP/02/1) and a Yayasan Universiti Teknologi PETRONAS-Fundamental Research Grant (cost center of 015LC0-013) received by Hanita Daud, URLs: https://www.mohe.gov.my/en/initiatives-2/187-program-utama/pen-yelidikan/548-research-grants-information;https://www.utp.edu.my/yayasan/Pages/default.aspx.
Conflicts of Interest: The authors declare that they have no conflicts of interest to report regarding the present study.
1. M. Kulldorff, “Prospective time periodic geographical disease surveillance using a scan statistic,” Journal of the Royal Statistical Society: Series A (Statistics in Society), vol. 164, no. 1, pp. 61–72, 2001. [Google Scholar]
2. M. Kulldorff, W. F. Athas, E. J. Feuer, B. A. Miller and C. R. Key, “Evaluating cluster alarms: A space-time scan statistic and brain cancer in Los Alamos, New Mexico,” American Journal of Public Health, vol. 88, no. 9, pp. 1377–1380, 1998. [Google Scholar]
3. D. B. Neill, A. W. Moore, M. Sabhnani and K. Daniel, “Detection of emerging space-time clusters,” in Proc. of the Eleventh ACM SIGKDD Int. Conf. on Knowledge Discovery in Data Mining, Chicago Illinois, USA, pp. 218, 2005. [Google Scholar]
4. D. B. Neill, “Detection of spatial and spatio-temporal clusters,” Ph.D thesis, Carnegie Mellon University, 2006. [Google Scholar]
5. T. Tango, K. Takahashi and K. Kohriyama, “A space-time scan statistic for detecting emerging outbreaks,” Biometrics, vol. 67, no. 1, pp. 106–115, 2011. [Google Scholar]
6. K. Takahashi, M. Kulldorff, T. Tango and K. Yih, “A flexibly shaped space-time scan statistic for disease outbreak detection and monitoring,” International Journal of Health Geographics, vol. 7, no. 1, pp. 14, 2008. [Google Scholar]
7. M. Kulldorff, R. Heffernan, J. Hartman, R. Assunção and F. Mostashari, “A space-time permutation scan statistic for disease outbreak detection,” PLOS Medicine, vol. 2, no. 3, pp. 216–224, 2005. [Google Scholar]
8. M. A. Costa and M. Kulldorff, “Maximum linkage space-time permutation scan statistics for disease outbreak detection,” International Journal of Health Geographics, vol. 13, no. 1, pp. 1–14, 2014. [Google Scholar]
9. W. Dong, X. Zhang, L. Li, C. Sun, L. Shi et al., “Detecting irregularly shaped significant spatial and spatio-temporal clusters,” in Proc. of the 2012 SIAM Int. Conf. on Data Mining: Society for Industrial and Applied Mathematics, New York, USA, pp. 732–743, 2012. [Google Scholar]
10. W. Dong, X. Zhang, Z. Jiang, W. Sun, L. Xie et al., “Detect irregularly shaped spatio-temporal clusters for decision support,” in Proc. of 2011 IEEE Int. Conf. on Service Operations, Logistics and Informatics, USA, pp. 231–236, 2011. [Google Scholar]
11. J. S. P. Tulloch, R. Vivancos, R. M. Christley, A. D. Radford and J. C. Warner, “Mapping tweets to a known disease epidemiology; A case study of Lyme disease in the United Kingdom and Republic of Ireland,” Journal of Biomedical Informatics, vol. X, no. 4, pp. 100060, 2019. [Google Scholar]
12. M. Mancuso, X. Yao, D. Otchere, D. Rasali, E. Clark et al., “Proof of concept paper: Non-traditional data sources for public health surveillance,” in Proc. of the 6th Int. Conf. on Digital Health Conf.-DH’ 16, Montréal Québec, Canada, vol. 176, pp. 91–92, 2016. [Google Scholar]
13. H. Fanaee-T and J. Gama, “Eigenspace method for spatiotemporal hotspot detection,” Expert System, vol. 32, no. 3, pp. 454–464, 2015. [Google Scholar]
14. S. Ullah, H. Daud, S. C. Dass, H. Fanaee-T and A. Khalil, “An Eigenspace approach for detecting multiple space-time disease clusters: Application to measles hotspots detection in Khyber-Pakhtunkhwa, Pakistan,” PLOS One, vol. 13, no. 6, pp. e0199176, 2018. [Google Scholar]
15. K. Kleinman, R. Lazarus and R. Platt, “A generalized linear mixed models approach for detecting incident clusters of disease in small areas, with an application to biological terrorism,” American Journal of Epidemiology, vol. 159, no. 3, pp. 217–224, 2004. [Google Scholar]
16. M. Kulldorff, “A spatial scan statistic,” Communications in Statistics-Theory and Methods, vol. 26, no. 6, pp. 1481–1496, 1997. [Google Scholar]
17. E. Arias-Castro, R. M. Castro, E. Tánczos and M. Wang, “Distribution-free detection of structured anomalies: Permutation and rank-based scans,” Journal of the American Statistical Association, vol. 113, no. 522, pp. 789–801, 2018. [Google Scholar]
18. L. Cucala, M. Genin, F. Occelli and J. Soula, “A multivariate nonparametric scan statistic for spatial data,” Spatial Statistics, vol. 29, no. 6, pp. 1–14, 2019. [Google Scholar]
19. I. Jung and H. J. Cho, “A nonparametric spatial scan statistic for continuous data,” International Journal of Health Geographics, vol. 14, no. 1, pp. 30, 2015. [Google Scholar]
20. S. S. Ali, E. A. Khan, M. Mushtaq and M. U. Rahman, “Childhood immunization among internally displaced persons (IDPS) of under five-years from north Waziristan agency, Pakistan: A cross sectional study,” Pakistan Journal of Public Health, vol. 6, no. 4, pp. 36–40, 2016. [Google Scholar]
21. Sci-Dev-Net, “Pakistan boosts drive against measles,” 2012. [Online]. Available: https://www.scidev.net/global/health/news/pakistan-boosts-drive-against-measles.html. [Google Scholar]
22. T. Nakaya and K. Yano, “Visualising crime clusters in a space-time cube: An exploratory data-analysis approach using space-time kernel density estimation and scan statistics,” Transactions in GIS, vol. 14, no. 3, pp. 223–239, 2010. [Google Scholar]
23. R. Minamisava, S. S. Nouer, O. L. de Morais Neto, L. K. Melo and A. L. S. S. Andrade, “Spatial clusters of violent deaths in a newly urbanized region of Brazil: Highlighting the social disparities,” International Journal of Health Geographics, vol. 8, no. 1, pp. 66, 2009. [Google Scholar]
24. L. Duczmal, G. J. P. Moreira, S. J. Ferreira and R. H. C. Takahashi, “Dual graph spatial cluster detection for syndromic surveillance in networks,” Advances in Disease Surveillance, vol. 4, pp. 88, 2007. [Google Scholar]
25. M. Tonini, D. Tuia and F. Ratle, “Detection of clusters using space-time scan statistics,” International Journal of Wildland Fire, vol. 18, no. 7, pp. 830–836, 2009. [Google Scholar]
 | This work is licensed under a Creative Commons Attribution 4.0 International License, which permits unrestricted use, distribution, and reproduction in any medium, provided the original work is properly cited. |