DOI:10.32604/cmc.2022.018579
| Computers, Materials & Continua DOI:10.32604/cmc.2022.018579 | |
| Article |
Measuring End-to-End Delay in Low Energy SDN IoT Platform
1Department of Telecommunications, Lviv Polytechnic National University, 79013 Lviv, Ukraine
2Department of Information Systems, Faculty of Management, Comenius University in Bratislava, 82005 Bratislava, Slovakia
3Department of Information and Communication Engineering, Faculty of Information Engineering, Fukuoka Institute of Technology (FIT), 3-30-1 Wajiro-Higashi, Higashi-Ku, Fukuoka 811-0295, Japan
*Corresponding Author: Natalia Kryvinska. Email: natalia.kryvinska@uniba.sk
Received: 12 March 2021; Accepted: 17 April 2021
Abstract: In this paper, we developed a new customizable low energy Software Defined Networking (SDN) based Internet of Things (IoT) platform that can be reconfigured according to the requirements of the target IoT applications. Technically, the platform consists of a set of low cost and energy efficient single-board computers, which are interconnected within a network with the software defined configuration. The proposed SDN switch is deployed on Raspberry Pi 3 board using Open vSwitch (OvS) software, while the Floodlight controller is deployed on the Orange Pi Prime board. We firstly presented and implemented the method for measuring a delay introduced by each component of the IoT infrastructure, ranging from the sensor, the core of SDN, the IoT broker, to an IoT subscriber. Thus, we presented the approach for estimating energy efficiency for SDN based IoT platform proportional to the traffic. The experiments carried out on a real SDN topology based on single-board computers show that our approach not only saves up to 53.56% of energy at low traffic intensity, but also provides QoS guarantee for IoT applications.
Keywords: Internet of things; software defined networking; openflow; open vswitch; raspberry-pi
1.1 Background and Problem Statement
In modern world, the Internet has become everyone's basic need. The energy efficiency and green network infrastructure are in great demand because they reduce energy costs and thus save consumers’ money. Energy efficiency reduces environmental pollution, makes more energy available, and improves the economy. In papers [1–4] a hybrid Whale Optimization Algorithm-Moth Flame Optimization are proposed to select optimal Cluster Head, which in turn optimizes the energy consumption for IoT networks. This approach provides efficient load balancing, better residual energy, and shorter latency, resulting in longer network life. One of the most important challenges is maintaining battery life on devices used in all IoT networks. Since many IoT devices do not recharge, the authors in [5] proposed an approach to preserve IoT network battery life using early battery life prediction.
In paper [5], Anwaar proved that Raspberry Pi consumes less power and can save a significant amount of energy when performing routine computing tasks. In paper [6], the authors suggested a more cost-effective alternative of implementing SDN testbed with Open vSwitch (OvS), based on the low-energy Raspberry-Pi minicomputer with easy programmability. This testbed is proposed for a small-scale network. However, the authors did not carry out research on the quality of service provision. The authors in [7] developed a prototype of a cost-effective, scalable, and QoS provision capable SDN switch for IoT communications based on Raspberry Pi 3. However, the authors did not carry out research on the suitability of such a platform for mission-critical IoT applications in accordance with acceptable QoS requirements. They also did not consider approaches to SDN routing in conditions of high network load in presence of multiservice IoT traffic with different QoS requirements. Due to a high cost and complexity of the existing hardware SDN switches, the authors in [8] created a cost-effective SDN switch using Raspberry Pi to test their ideas. The authors in [9] suggested using cost-effective single board computers in combination with scalable containerized network services (e.g., VOIP, web services, etc.) using SDN to provide a centralized device management. The prototype configuration based on Raspberry Pi is described in detail and initial operational testing is presented as a means of confirming the technological viability of the concept in various topology configurations. The energy consumption of network equipment and channel utilization varies with respect to the load and structure of the network traffic. The integration of the control plane and data into individual devices in a traditional network system requires more processing, resulting in higher energy consumption than SDN devices. Consequently, traditional IP networks have more energy consumption problems due to their complexity in traffic management, control, and operation [10–13].
For the mission-critical IoT applications, the network infrastructure is a critical ecosystem component. To provide hard QoS for IoT applications, it is necessary to ensure suitable mechanisms at each layer of the IoT infrastructure, since some factors, such as E2E delay is very important [13–16]. A delay in any layer can lead to unacceptable QoS for safety critical applications, such as automated driving systems which have constant need for feedback to maintain the control. Such ultimate results are the main reason why strict compliance with QoS requirements is necessary in the mission-critical IoT. This is also partial reason why designing the mission-critical IoT platforms is so complex.
Nowadays, there are many well-known SDN solutions, controllers, and various protocols for network communications. However, most of these solutions are expensive and complex. In addition, they are not always available and appropriate for small and medium application tasks, particularly in business [17]. Recent studies [18–21] show that a decision to organize a network based on microcontroller platforms will take care of the energy efficiency, reliability, and security of the network, and in particular the integration with the Internet will not require much efforts. The, versatility of microcontrollers also lies in the White Box model, which indicates that the hardware solution is not tied to the software solution, and will allow one to easily move to one or another software solution with respect to the relevance and need. Each network element can change its purpose and role in the network at any time.
Having analyzed the scientific works, we have not found the approaches that allow estimating a delay introduced by each component of the IoT infrastructure, ranging from the sensor, the core of SDN, the IoT broker, and ending with a subscriber of IoT services. This approach will allow identifying infrastructure bottlenecks that lead to degradation of QoS parameters and to make decisions on how to address these bottlenecks. Since energy costs contribute significantly to overall network costs, energy efficiency is an important design requirement for modern network platforms. However, designing energy-efficient solutions is challenging because there is a trade-off between energy efficiency and network performance.
In order to address the abovementioned challenges, this paper focuses on creating a new cost-effective and low-energy customizable platform based on the SDN architecture that can adapt its configuration to meet the QoS requirements of target IoT applications. Our principal contributions in this paper are summarized as follows:
• We developed a prototype of low cost and flexible SDN switch and a controller based on single-board computers Raspberry Pi 3 and orange Pi Prime for IoT communications;
• We realized IoT broker and web client for the SDN based IoT platform;
• We developed the method for measuring E2E delay in the SDN based IoT platform and the monitoring system of quality of platform operation;
• We presented the proof of the concept for the SDN based IoT platform using energy efficient and cost competitive single board computers;
• We presented an energy efficiency approach for the SDN based IoT platform proportional to traffic.
The paper is organized as follows. Section 1 presents a background, problem statement and brief review of the related works. Section 2 describes the proposed SDN based IoT platform architecture. Section 3 describes the new method for measuring E2E delay in the SDN based IoT platform and the monitoring system. Section 4 describes the proposed proportional energy efficiency approach for the SDN Based IoT Platform. Finally, we draw the conclusions in Section 5.
2 Energy Efficient and Cost-Competitive SDN Based IoT Platform
2.1 SDN Based IoT Platform Architecture
In this part, we introduce an energy-efficient SDN based IoT platform for mission-critical applications. The platform architecture consists of an IoT and SDN section as shown in Fig. 1. These sections communicate via Bluetooth. Access to this platform is ensured via the Internet using a Web application.
IoT Section. We assume that the critical IoT service in this platform is temperature and humidity data transmission. For this purpose, a simple temperature sensor DHT11 is used [22]. The DHT11 provides an ambient temperature measurements from 0°C to +50°C with the accuracy of ±2°C. This sensor is wired to Raspberry Pi, which acts as a transmitter from the sensor via Bluetooth Low Energy (BLE). Together with the sensor, the Bluetooth component in the IoT section collects the data.
The IoT Hub is designed as Raspberry Pi. The IoT Hub aggregates the data from several IoT components, communicating via BLE. With the IoT Hub, the data can be received from sensors using efficient and adaptive algorithms, which makes the system productive and energy efficient [23].

Figure 1: The SDN based IoT platform architecture
SDN section. SDN networks should be able to configure network devices programmatically in their ideas. In turn, this network should consist of at least one switch, two hosts connected through this switch, and a controller that would allow the network to be managed. SDN section in this architecture consists of 3 main components: an Openflow switch, a WebSockets broker and an Openflow controller.
We developed a 5-port SDN switch with the Raspberry Pi 3 device and Open vSwitch (OvS) software. Since the single board computer Raspberry Pi in its board has only one Ethernet port, the use of USB to Ethernet adapter on this board can create up to 5 Ethernet ports.
Since the single board computer Raspberry Pi is not an SDN switch by nature, by using hardware-virtualized environments it is possible to install and configure a virtual switch. The most popular implementation with open source and OpenFlow support is OvS [24]. The OpenFlow switch based on Raspberry Pi acts as a virtual switch based on OvS. The OvS is a production quality, multilayer virtual switch licensed under the open source Apache 2.0 license. The main purpose of the OvS is to provide a switching stack for hardware-virtualized environments to support multiple protocols and standards, used in computer networks [25–27].
2.2 The Proof of Concept Testbed for SDN Based IoT Platform
The low cost and flexible SDN switch and controller based on single-board computers (Raspberry Pi 3 and Orange Pi Prime) are depicted in Fig.2.

Figure 2: The low cost and flexible SDN switch and controller based on single-board computers (Raspberry Pi 3 and orange Pi Prime)
The OvS is a software implementation of a virtual multi-layer network switch designed to provide effective network automation through software extensions.
The OvS provides the bridge concept. This means a single virtual switch can contain multiple bridges, which in turn can use different routing tables or different ports.
For convenience and fast real-time communication between services (not in request-response mode), the WebSocket protocol was chosen. The WebSocket is a protocol designed for real time information exchange between a browser and a web server. It provides a bidirectional full-duplex communication channel through a single TCP socket. The WebSocket is designed to be implemented in Web browsers and Web servers, but can also be used by any client-server application. The WebSocket application software interface has been standardized by W3C (World Wide Web Consortium) and WebSocket is also standardized by IETF as RFC 6455 [28].
Although the WebSocket is primarily designed for real-time communication between a Web client and a Web service, it is also useful for services. We plan to use this protocol for communication between a Web server and a broker.
Accordingly, we have implemented the following logic in the form of steps:
• Broker runs the WebSocket server.
• Interested services are connected as a client to the WebSocket server (the Web client and the IoT hub).
• After a successful connection, the web client sends a request to the WebSocket server.
• In turn, the broker (WebSocket server) sends the IoT hub a request.
• The IoT Hub, in turn, creates a request for an already connected Bluetooth component device.
• When the Bluetooth component receives the request, it requests data from the sensor and sends it back. Each device, in turn, forwards it further to the Web client.
After the data was switched by the routing table to the corresponding port, it arrives at the broker's Websocket. This broker uses the Websocket protocol of the same name and is its server, which provides real time communication between the end-sensors and the web client.
We used the Orange Pi Prime board that has four processor cores and two gigabytes of RAM, which should be enough for a simple SDN controller. To implement the SDN based IoT platform, the Floodlight controller was selected, because it has fewer components, and therefore the Orange Pi Prime board will better cope with the task. Floodlight indicates in its system requirements the need for Ubuntu or Debian operating systems. Ubuntu operating system for Orange Pi Prime was chosen for its popularity. The testbed of the SDN based IoT platform is given in Fig. 3.

Figure 3: The proof of the concept testbed for the SDN based IoT platform
In the proposed platform, the SDN controller is a control point for monitoring the network, controlling data flow, as well as load balancing, autoscaling, and other benefits of SDN. This controller is not a single point of failure, which means that the network can continue to operate in the normal mode. The floodlight controller in its interface has two convenient ways to manage networks-REST API and GUI. The GUI is made as a Web client.
3 An New Accurate Method for Measuring the End-to-End (E2E) Delay in the SDN Based IoT Platform
3.1 The Delay Measurement Method in the SDN Based IoT Platform
In this work, the system for monitoring the quality of operation of the SDN based IoT platform is developed. In order to correctly assess the efficiency of its operation, several system quality criteria were selected. One of them is the delay. To date, this is one of the key criteria of system quality for critical services. For this purpose, the method for the E2E delay measurement has been developed. The peculiarity of the method is that it allows determining the delay on each component of the proposed platform. The delay measurement method creates a certain data structure that contains metadata and useful data (payload) as an object. The format is JSON (JavaScript Object Notation), because in this format the data are readable by humans and convenient for computer processing.
Each component receives the packet and adds its own timestamp to the metadata, so that by comparing the two labels with each other, the delay time can be determined. Schematically, this delay measurement method is given in Fig. 4. To calculate the delay between the two modules, it is sufficient to subtract the time stamp of the last module from the previous one, and the difference will be exactly the delay.

Figure 4: Working principle of the proposed method
This method requires the clocks on all components to be as synchronized as possible for accurate calculations. For this we used the most common method to sync system time over a network in Linux desktops or servers is by executing the ntpdate command which can set system time from an NTP time server with the error of one microsecond [29]. Thus, when all components are within the internal network, including the broker, the error of delay measurements is one microsecond. If the broker is located in an external network, it is difficult to ensure high accuracy of the delay measurements, the error can vary within a few milliseconds.
This method makes it easy to measure the delay between specific components and the total E2E delay. It also allows the system to react correctly when the delay increases dramatically or reaches a set threshold.
• First n = 10 messages received with all timestamps
• The delay is calculated between all components of the network using the following equation
• The threshold value for each component delay is calculated by
• where 1.20 is the maximum offset of the average delay.
• The total threshold delay is calculated by
• Further, the messages are only sent with an initial timestamp to determine the total delay.
• If the total delay is exceeded, the following messages are sent with time stamps and the delay is monitored on each module. The system will automatically accept optimizations to remove the high delay for mission-critical applications.
• After completing the optimization we return to the first step.
The algorithm of delay measurements in the SDN based IoT platform is given in Fig.5.

Figure 5: The algorithm of delay measurements in the SDN based IoT platform
The platform has only one switch that connects two hosts and one SDN controller. The IoT devices are implemented as a simple sensor of temperature and humidity. These sensors send only two parameters, namely data of measurements of humidity and temperature via Bluetooth. The Web client is implemented in two options: the Web server and the Web client are on the internal network (localhost). The Web server is placed remotely on one of the free Web hosting services, and the client is connected via mobile network 4G (Heroku).
One of the tasks of the concept of the IoT is the transfer and storage of measurement data from various sensors with the possibility of their further processing and storage [30]. Measurements in combination with IoT concepts such as “smart house” and “smart city” are becoming especially important. Among the most frequently measured values are the environmental parameters and the indoor climatic parameters such as temperature [31] and humidity [32]. It should also be noted that the last two physical quantities are very important in industry [33–35]. There are even special conferences devoted to their measurements, such as “TEMPMEKO” and “Temperature: its measurement and control in science and industry”. Therefore, due to the importance of temperature and humidity measurements, the authors chose the temperature and humidity sensor to create a testbed in this work.
The example of delay monitoring system for the SDN based IoT platform when the web server and the web client are on the internal network-localhost is depicted in Fig.6. In this system only the results for 8 experiments of data transmission (measurements of temperature and humidity) are displayed for clarity.

Figure 6: The delay monitoring system for the SDN based IoT platform (the web server and the web client are on the internal network-localhost)
20 experiments of data transmission were carried out to better assess the average delay and platform behavior. One experiment is to create a request from the web client and get a response from the web client. There are delays such as: the sensor read delay, the Bluetooth delay, the SDN delay, the WebSocket delay, the Web delay, the total E2E delay.
The Sensor read delay is the delay in sending a request and receiving data from the sensor in milliseconds. In this model, it is DTH11, a temperature and humidity sensor. Raspberry Pi receives this data via the GPIO interface. The value of this delay for 20 experiments is shown in Fig.7. The average value for this delay is 1814.4 milliseconds. The standard deviation is 238 milliseconds. As can be seen from the graph, this value is fairly constant, except for the first request. The first value of the delay measurement differs significantly from the following ones due to the fact that in the beginning, before turning on the prototype, there is a method configuration and a time synchronization of all components. Therefore, an additional delay appears. During the second experiment all components were synchronized in time. After that, in subsequent experiments, there are no high fluctuations in the delay values. The Bluetooth delay is the delay in requesting and receiving data via the Bluetooth interface in milliseconds. Raspberry PI has a built-in Bluetooth module that supports Bluetooth Low Energy (BLE). This standard operates at 2.4 GHz and its maximum transfer rate is 1 Mbit/sec, however the average value in practice is 0.27 Mbit/sec. In this platform, one Raspberry Pi as a Bluetooth master sends a request to a Bluetooth slave with which a connection is already established. The amount of data from the sensor in the request is approximately 200 bytes. The value of this delay for the 20 experiments is shown in Fig. 9. The average value for this delay is 71.2 milliseconds. The standard deviation is 22.9 milliseconds. This value is not stable and varies greatly.

Figure 7: Delay measurements for the IoT section (the Sensor read and Bluetooth delays)
The SDN delay is the delay that occurs when passing through the virtual Open vSwitch. Raspberry Pi (the IoT Hub) is connected to another Raspberry Pi (Web broker) through an intermediate Raspberry Pi which is a virtual OvS. The switch connects two hosts over Ethernet ports. Raspberry Pi supports 100 Base Ethernet, that is, the transfer rate through this port is a maximum of 100 Mbps. This switch has only two values in its routing table. Two hosts communicate with each other via WebSockets, and the amount of data in one message is about 1 kilobyte. The value of this delay for 20 experiments is shown in Fig. 10. The average value for this delay is 4.5 milliseconds. The standard deviation is 2.1 milliseconds. This value is stable and does not vary much. Only at the first request, the delay is noticeably longer.
The WebSocket delay occurs when we send a request from a web server to a broker and receive a response. The broker and the web server communicate via the WebSocket protocol. The delay was measured already when the connection is established. It should be taken into account that in this experiment, the web server is in the local network. The data volume of the message is also about 1 kilobyte. The value of this delay for 20 experiments is shown in Fig. 10. The average value for this delay is 14.05 milliseconds. The standard deviation is 6.6 milliseconds. This value is fairly stable and varies slightly, but may sometimes be significantly longer for different reasons.
The Web delay is the delay (measured in milliseconds) that occurs when a web client creates a request and receives a response from a web server. The request is made using the HTTP protocol, and the response is 1 kilobyte in size. It should be noted that both the web client and the web server are on the same internal network. The value of this delay for 20 experiments is shown in Fig.8. The average value for this delay is 5.55 milliseconds. The standard deviation is 1.8 milliseconds. This value is not sustainable.

Figure 8: Delay measurements of the SDN section (the SDN, the WebSocket and the Web delays)
So if we sum up all of these delays, for previous experiments, we get the following plot in Fig. 9 of the total E2E delay, that is, the delay from the time the web client user clicks the data request button before receiving it in the table on the web client. The average total delay is 1909.6 milliseconds and the standard deviation is 251.4 milliseconds. However, as can be seen from the figure, after the first request, the delay value was quite stable.

Figure 9: The total E2E delay in the proposed SDN based IoT platform
As can be seen from the plot, the highest among all delays is the sensor read delay-delay in reading data from the sensor. The second highest is the Bluetooth delay—the delay in exchanging the message via the Bluetooth protocol. According to the IoT section, the delay is 71.2 + 1814.4 = 1885.6 milliseconds when the delay of the SDN section is only 1909.6–1885.6 = 24 milliseconds.
However, in this experiment the web client and the web server are on the internal network. The real client will access the remote server from the Internet. This will result in a higher delay. Therefore, to check this, the web server was deployed on a remote web hosting Heroku and the client is connected via the mobile network 4G. Fig.10 shows the delay monitoring system for the SDN based IoT platform. As can be seen from the figure, all the delays were approximately the same when compared to the internal network (localhost), except for the Web and WebSocket delay.

Figure 10: The delay monitoring system for the SDN based IoT platform (the web server was deployed on the remote web hosting Heroku and the client is connected via mobile 4G network)
A web delay comparison (Heroku vs. Localhost) is depicted in Fig. 11. In this case, the average delay value is 141.3 milliseconds and the standard deviation is 73.3 milliseconds.

Figure 11: Web delay comparison (Heroku vs. Localhost)
The WebSocket delay comparison (Heroku vs. Localhost) is depicted in Fig. 12.

Figure 12: WebSocket delay comparison (Heroku vs. Localhost)
As a result of the SDN based IoT platform testing, we found that the use of the SDN technology ensures the necessary requirements for the delay of critical data transmission. According to the proposed method, in order to reduce the delay in the IoT section, it is necessary to select a temperature and humidity sensor with the best technical parameters for fast reading and processing of information. This solution will significantly improve the service quality parameters.
In this work, SDN was implemented for Internet of things based on single-board computers. This platform is the proof of concept (PoC) and is focused on the implementation of performance, the possibility of the existence of ideas and analysis of the system. However, the final solution can be very diverse, respectively, under different requirements. When creating the final solution, it is necessary to take into account the most varying parameters that will allow better and smarter organization of the architecture as a whole and at the decision of concrete questions. When designing a software-defined network for the IoT, one should pay attention to the type of data, which are planned to be transmitted.
The classification of real-time and unreal-time data and their volume is very important. If the system provides real-time data transmission, it is necessary to take care of the QoS provided by the communication network. The IoT section is necessary to ensure the high-speed wired or wireless data transmission protocol. In our case, it is necessary to substitute the temperature sensor DHT11 by a faster sensor, which will reduce the E2E delay. The SDN offers an excellent and convenient solution to ensure QoS, precisely because of its ability to control the network programmatically. An administrator can dynamically and flexibly define network policies for allocating the network resources to different priority flows. For example, the administrator can choose the network throughput for priority flow, path delay time or other criteria as the optimal communication path for a specific data flow. That is why in the next section of the work, we offer an approach to the optimal routing of data flows of different IoT classes by the criterion of quality of service for large-scale networks (with a large number of SDN switches).
4 The Energy Efficiency Approach for SDN
4.1 The Proportional Energy Efficiency Approach for the SDN Based IoT Platform
Since energy costs contribute significantly to the total cost of the network, energy efficiency is an important requirement when designing modern network mechanisms, especially in the IoT infrastructure. However, developing energy efficient solutions is a complex task, as there is a trade-off between energy efficiency and network performance [36]. SDN ensures programmability of network elements by separating control and forwarding planes. Because the SDN devices are programmable and manageable, the proposed network switches based on a single board and links can enter the low power state in the sleep mode, and the architecture of the device can be designed to have actual load based on proportional energy consumption.
We propose an approach for designing an energy efficient SDN structure with respect to network load generated by IoT devices. This approach supports a compromise between energy efficiency and performance. Energy efficient SDN architecture for IoT communication is depicted in Fig.13.

Figure 13: The energy efficiency SDN architecture for IoT communication (the red dashed line is our proposed program blocks)
The principle of the proposed approach is as follows. With the support of the SDN controller, the network structure is monitored and managed centrally. The optimizer block is developed on the SDN controller to collect statistics from OvS switches about the network topology and the load of the switches. Based on the current statistics about the state of the network, an adaptive decision is made to build the optimal network topology with respect to the QoS and energy consumption criteria. Under low network load conditions supporting this approach, the SDN controller, according to the data received from the network optimizer block, will decide to create a graph (topology) with a smaller number of active links and switches, while the high load on the network will increase the number of active switches and links between them in the graph. Based on the routing model described above, it is possible to adjust the path cost using corrective weights to take into account how much delay or packet loss is important for a particular IoT flow. In this way, we can adjust these parameters to match the quality of service requirements of each flow. Accordingly, the load balancing between the links can be done so that fewer switches are involved and idle switches can be put into the sleep mode to improve overall network energy efficiency. As the load from IoT devices grows and QoS degrades, an automated decision is made to activate the sleeping switches and put them into the active mode. The loads are redistributed using the following mathematical model.
We present the SDN section of the IoT platform in the form of a weighted graph
The network traffic is represented by a set of flows
where
The multiobjective function (Eq. (1)) minimizes the sum of the energy consumption of switches and channels. The first mathematical expression of the objective function, the sum
In (Eq. (4)), it is stated that the total flow rate between the two switches must not exceed the throughput of the channel
Thus, our approach provides significant savings in the overall energy consumption of the network while achieving optimal performance to meet the necessary QoS requirements.
Raspberry Pi 3 can be powered with power supply of 5 Volts. For normal usage Raspberry Pi runs on just P = 2.25 W and energy consumption is E = 8.1 kilojoules per hour [kJ/h]. For example, if our network consists of 7 Raspberry Pi-based OvS switches, power consumption in sleep mode is negligible. The energy consumption in sleep mode is negligibly small.
The total network energy consumption per day is calculated by Eq. (12):
where n-number of active SDN switches based on Raspberry Pi, E–energy consumption of one SDN switch.
Energy saving is calculated by Eq. (13).
For our experimental tests, we consider a network topology based on single-board computers. This topology composed of 7 Open vSwitches, 1 the Floodlight SDN controller and 6 IoT traffic generators (G1, G2, G3, G4, G5, and G6). The experimental SDN testbed is depicted in Fig. 14.

Figure 14: The experimental SDN testbed based on single-board computers
We generated different loads during 24 h in the network. To achieve a low load on the network, we did not generate loads with some generators of G1, G2, G3, G4, G5 and G6. We estimated the energy consumption with and without our energy efficiency solution to service a particular load. So, the average network load per day is depicted in Fig.15. The number of active SDN switches based on Raspberry Pi per day is depicted in Fig.16. The energy consumption comparison in kilojoules per day is shown in Fig.17.
Experimental results show that the total energy network consumption without our solution is
Experiments conducted on the real SDN topology based on 7 single-board computers Raspberry Pi 3, switches and IoT traffic showed that our approach not only saves up to 53.56% of the energy at low traffic volume, but also ensures QoS for the IoT applications.
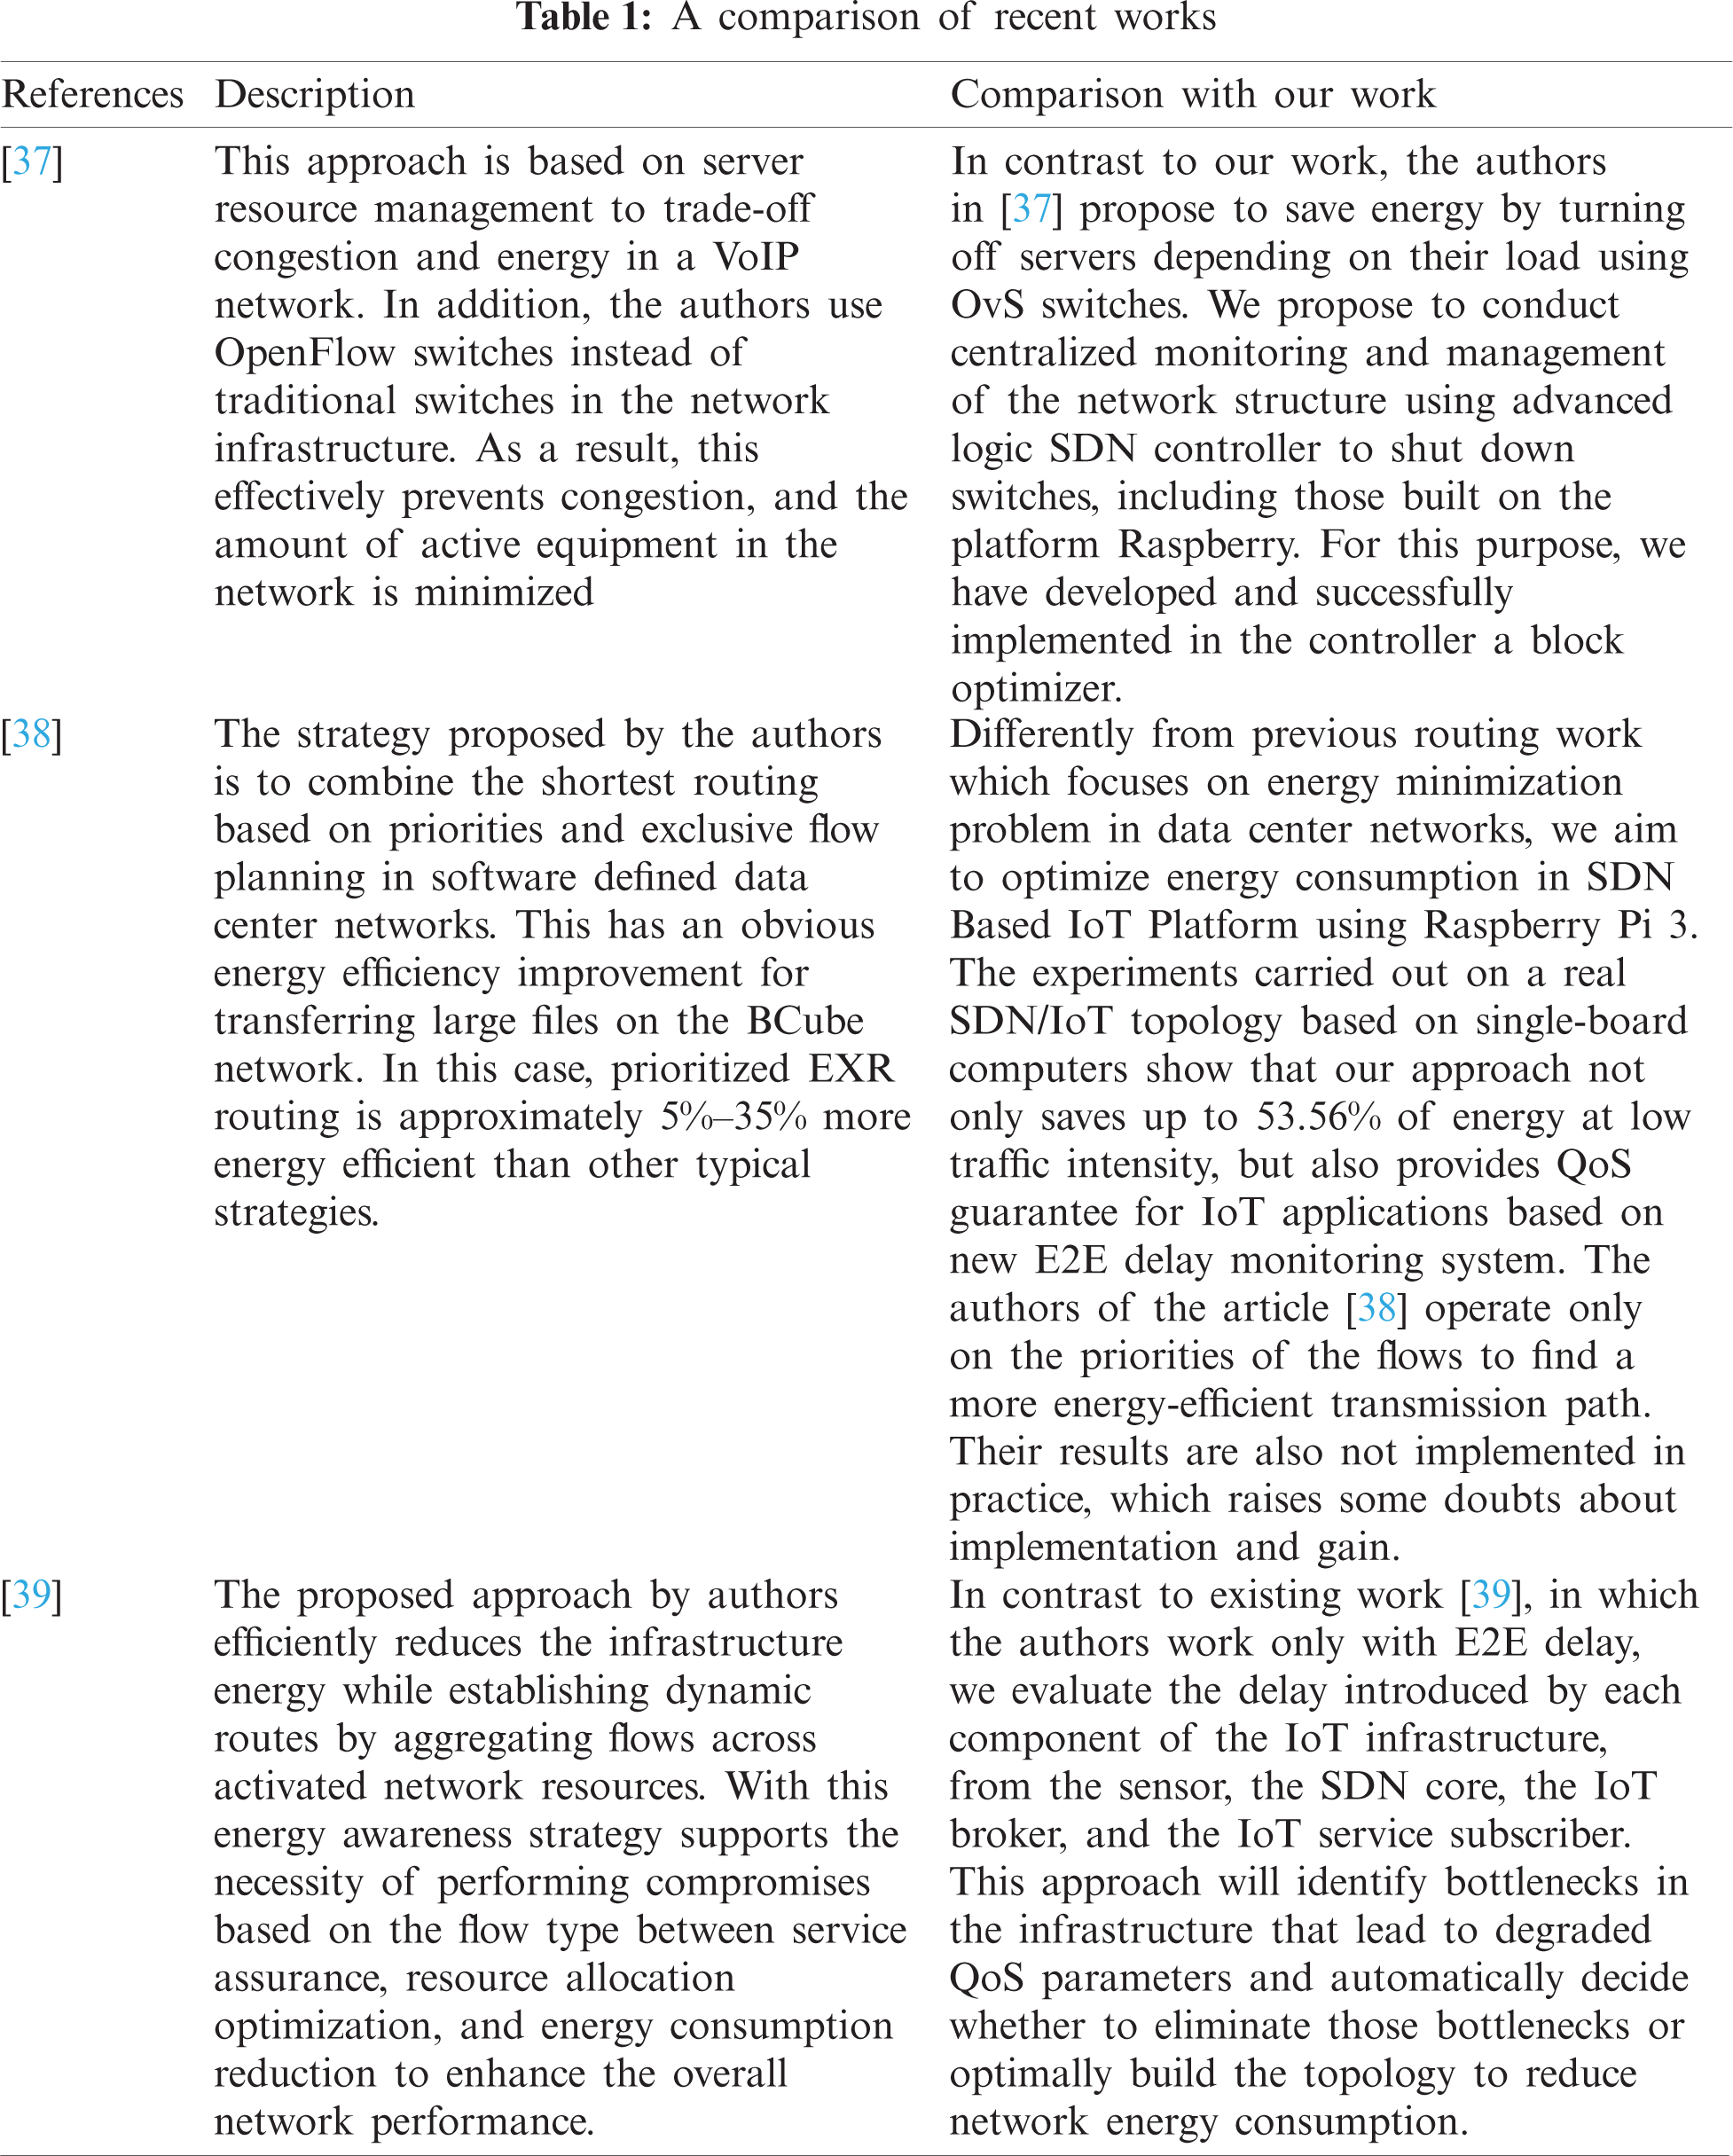
A summary of the approaches discussed to reduce the energy consumption and improve the quality of service in modern networks is demonstrated in Tab. 1. Our work differs from previous work in terms of delay measurement methods, resource allocation and the prototype implementation.

Figure 15: The average network load per day

Figure 16: Number of active SDN switches based on Raspberry Pi per day

Figure 17: Energy consumption comparison in kilojoules per hour during a day
Considerable price of deployment and high market competition lead to the situation where IoT service providers often cannot get adequate interest from their investments. To solve this problem, we offer a new solution for small and medium enterprises that allows them to enter the IoT market with much lower investments. The proposed solution allows deploying a programmable network on demand for various IoT applications, including mission-critical services. We developed a proof of concept platform that interconnects various IoT end devices and provides the flexible and scalable mechanisms for E2E QoS control for mission-critical applications. The proposed platform consists of a set of energy and cost efficient single board computers and uses the unique features of SDN, such as flow-based nature, and network flexibility in order to fulfill QoS requirements of each IoT flow in the network. The main advantage of the developed prototype of the SDN network is the low cost and availability of implementation, which is important for the training of specialists in the field of software-defined networks in the process of educational, training and research purposes.
In this paper, we firstly presented and implemented the method for measuring a delay introduced by each component of the IoT infrastructure, ranging from the sensor, the core of SDN, the IoT broker, to an IoT subscriber. We also presented the energy efficient approach for the SDN based IoT platform proportional to IoT traffic intensity. This approach saves energy by dynamically turning on a minimum number of network devices in order to transmit traffic with respect to network load instead of constantly keeping all the switches on, as in current networks.
The limitation of this work is that the throughput of communication channels at the level of designed switches is 100 Mbps, since the switch is designed based on Raspberry Pi 3 board using Open vSwitch (OvS). Raspberry Pi supports only 100 Base Ethernet. That's why in the future we will test for backbone IoT networks switch ZODIAC FX, which has a throughput of 1000 Mbps.
Our future work is to develop an energy-efficient QoE (Quality of Experience) routing model for future software-defined intent-based networks. The novelty of the model is that the adaptive QoE-oriented route metric will be used to select the optimal transmission path, based on the developed mathematical model of QoS/QoE correlation with regard to the functional parameters of the network nodes utilization. As a result of software implementation on the SDN/IBN controller, it will make possible to maintain a compromise between the desired intension-oriented quality of service users, the network utilization and energy efficiency by putting the idle nodes into the energy-saving mode. In particular, we will implement this approach on the real ZODIAC FX/GX SDN switch, which is open to upgrading the network management logic. We already have some successful achievements of these prototypes, which we will soon review in our future works.
Funding Statement: This research was supported by the Ukrainian Project No. 0120U102201 “Development the methods and unified software-hardware means for the deployment of the energy efficient intent-based multi-purpose information and communication networks”.
Conflicts of Interest: The authors declare that they have no conflicts of interest to report regarding the present study.
1. P. K. R. Maddikunta, T. R. Gadekallu, R. Kaluri, G. Srivastava, R. M. Parizi et al., “Green communication in IoT networks using a hybrid optimization algorithm,” Computer Communications, vol. 159, pp. 97–107, 2020. [Google Scholar]
2. P. K. R. Maddikunta, G. Srivastava, T. R. Gadekallu, N. Deepa and P. Boopathy, “Predictive model for battery life in IoT networks,” IET Intelligent Transport Systems, vol. 14, no. 11, pp. 1388–1395, 2020. [Google Scholar]
3. Q. Pham, S. Mirjalili, N. Kumar, M. Alazab and W. Hwang, “Whale optimization algorithm with applications to resource allocation in wireless networks,” IEEE Transactions on Vehicular Technology, vol. 69, no. 4, pp. 4285–4297, 2020. [Google Scholar]
4. P. K. R. Maddikunta, G. Srivastava, T. R. Gadekallu, N. Deepa and P. Boopathy, “Predictive model for battery life in IoT networks,” IET Intelligent Transport Systems, vol. 14, no. 11, pp. 1388–1395, 2020. [Google Scholar]
5. W. Anwaar and M. A. Shah, “Energy efficient computing: A comparison of raspberry pi with modern devices,” International Journal of Computer and Information Technology, vol. 4, no. 2, pp. 410–413, 2015. [Google Scholar]
6. H. Kim, J. Kim and Y. Ko, “Developing a cost-effective openflow testbed for small-scale software defined networking,” in Proc. ICACT, Pyeongchang, South Korea, pp. 758–761, 2014. [Google Scholar]
7. Q. H. Nguyen, N. Ha Do and H. Le, “Development of a QoS provisioning capable cost-effective SDN-based switch for IoT communication,” in Proc. ATC, Ho Chi Minh City, pp. 220–225, 2018. [Google Scholar]
8. V. Gupta, K. Kaur and S. Kaur, “Developing small size low-cost software-defined networking switch using raspberry pi,” in Next-Generation Networks, Singapore: Springer, pp. 147–152, 2018. [Google Scholar]
9. R. Bolla, C. Lombardo, R. Bruschi and S. Mangialardi, “dropv2: Energy efficiency through network function virtualization,” Network IEEE, vol. 28, no. 2, pp. 26–32, 2014. [Google Scholar]
10. B. R. Dawadi, D. B. Rawat, S. R. Joshi and M. M. Keitsch, “Towards energy efficiency and green network infrastructure deployment in Nepal using software defined IPv6 network paradigm,” The Electronic Journal of Information Systems in Developing Countries, vol. 86, no. 1, pp. e12114, 2020. [Google Scholar]
11. M. J. Piran, S. Verma, V. G. Menon and D. Y. Suh, “Energy-efficient transmission range optimization model for wsn-based internet of things,” Computers, Materials & Continua, vol. 67, no. 3, pp. 2989–3007, 2021. [Google Scholar]
12. S. Krishnamoorthy and K. Narayanaswamy, “SDN controller allocation and assignment based on multicriterion chaotic salp swarm algorithm,” Intelligent Automation & Soft Computing, vol. 27, no. 1, pp. 89–102, 2021. [Google Scholar]
13. I. Gravalos, P. Makris, K. Christodoulopoulos and E. A. Varvarigos, “Efficient network planning for internet of things with QoS constraints,” IEEE Internet of Things Journal, vol. 5, no. 5, pp. 3823–3836, 2018. [Google Scholar]
14. M. Beshley, N. Kryvinska, M. Seliuchenko, H. Beshley, E. M. Shakshuki et al., “End-to-end QoS “smart queue” management algorithms and traffic prioritization mechanisms for narrow-band internet of things services in 4G/5G networks,” Sensors, vol. 20, no. 8, pp. 2324–2354, 2020. [Google Scholar]
15. S. Math, P. Tam and S. Kim, “Intelligent real-time IoY traffic steering in 5G edge networks,” Computers, Materials & Continua, vol. 67, no. 3, pp. 3433–3450, 2021. [Google Scholar]
16. V. S. Naresh, S. S. Pericherla, P. Sita and S. Reddi, “Internet of things in healthcare: Architecture, applications, challenges, and solutions,” Computer Systems Science and Engineering, vol. 35, no. 6, pp. 411–421, 2020. [Google Scholar]
17. H. Geng, J. Yao and Y. Zhang, “Single failure routing protection algorithm in the hybrid SDN network,” Computers, Materials & Continua, vol. 64, no. 1, pp. 665–679, 2020. [Google Scholar]
18. O. Sadio, I. Ngom and C. Lishou, “Design and prototyping of a software defined vehicular networking,” IEEE Transactions on Vehicular Technology, vol. 69, no. 1, pp. 842–850, 2020. [Google Scholar]
19. D. B. Rawat and S. R. Reddy, “Software defined networking architecture, security and energy efficiency: A survey,” IEEE Communications Surveys & Tutorials, vol. 19, no. 1, pp. 325–346, 2017. [Google Scholar]
20. B. G. Assefa and Ö. Özkasap, “RESDN: A novel metric and method for energy efficient routing in software defined networks,” IEEE Transactions on Network and Service Management, vol. 17, no. 2, pp. 736–749, 2020. [Google Scholar]
21. A. Kannan, S. Vijayan, M. Narayanan and M. Reddiar, “Adaptive routing mechanism in SDN to limit congestion,” Information Systems Design and Intelligent Applications, vol. 862, pp. 245–253, 2019. https://doi.org/10.1007/978-981-13-3329-3. [Google Scholar]
22. J. Wang, O. Kochan, K. Przystupa and J. Su, “Information-measuring system to study the thermocouple with controlled temperature field,” Measurement Science Review, vol. 19, no. 4, pp. 161–169, 2019. [Google Scholar]
23. H. Beshley, M. Kyryk, M. Beshley and O. Panchenko, “Method of information flows engineering and resource distribution in 4G/5G heterogeneous network for M2M service provisioning,” in Proc. IDAACS-SWS, Lviv, Ukraine, pp. 229–233, 2018. [Google Scholar]
24. A. Pryslupskyi, O. Panchenko, M. Beshley and M. Seliuchenko, “Improvement of multiprotocol label switching network performance using software-defined controller,” in Proc. CADSM, Polyana, Ukraine, pp. 106–109, 2019. [Google Scholar]
25. M. Beshley, M. Seliuchenko, O. Panchenko, O. Zyuzko and I. Kahalo, “Experimental performance analysis of software-defined network switch and controller,” in Proc. TCSET, Lviv-Slavske, Ukraine, pp. 282–286, 2018. [Google Scholar]
26. M. Beshley, V. Romanchuk, M. Seliuchenko and A. Masiuk, “Investigation the modified priority queuing method based on virtualized network test bed,” in Proc.CADSM, Lviv, Ukraine, pp. 1–4, 2015. [Google Scholar]
27. S. Jun, K. Przystupa, M. Beshley, O. Kochan, H. Beshley et al., “A cost-efficient software based router and traffic generator for simulation and testing of IP network,” Electronics, vol. 9, no. 1, pp. 40–64, 2020. [Google Scholar]
28. B. Li and S. Yu, “Keyword mining for private protocols tunneled over websocket,” in IEEE Communications Letters, vol. 20, no. 7, pp. 1337–1340, 2016. [Google Scholar]
29. E. Mallada, X. Meng, M. Hack, L. Zhang and A. Tang, “Skewless network clock synchronization without discontinuity: Convergence and performance,” IEEE/ACM Transactions on Networking, vol. 23, no. 5, pp. 1619–1633, 2015. [Google Scholar]
30. J. Michałowska, A. Tofil, J. Józwik, J. Pytka, S. Legutko et al., “Monitoring the risk of the electric component imposed on a pilot during light aircraft operations in a high-frequency electromagnetic field,” Sensors, vol. 19, no. 24, pp. 5537, 2019. [Google Scholar]
31. R. Kochan, O. Kochan, M. Chyrka, S. Jun and P. Bykovyy, “Approaches of voltage divider development for metrology verification of ADC,” in Proc. IDAACS-2013, Berlin, Germany, vol. 1, pp. 70–75, 2013. [Google Scholar]
32. D. L. Presti, C. Massaroni and E. Schena, “Optical fiber gratings for humidity measurements: A review,” IEEE Sens. J., vol. 18, no. 22, pp. 9065–9074, 2018. [Google Scholar]
33. A. Glowacz, “Fault diagnosis of electric impact drills using thermal imaging,” Measurement, vol. 171, pp. 108815, 2021. [Google Scholar]
34. S. Jun, O. Kochan, W. Chunzhi and R. Kochan, “Theoretical and experimental research of error of method of thermocouple with controlled profile of temperature field,” Meas. Sci. Rev, vol. 15, no. 6, pp. 304–312, 2015. [Google Scholar]
35. A. K. Mallik, D. Liu, V. Kavungal, Q. Wu, G. Farrell et al., “Agarose coated spherical micro resonator for humidity measurements,” Opt. Express, vol. 24, no. 19, pp. 21216–21227, 2016. [Google Scholar]
36. I. Kahalo, H. Beshley, M. Beshley and O. Panchenko, “Enhancing qos and energy efficiency of lte/lte-u/wi-fi integrated network based on adaptive technique for radio structure formation,” in Proc. UKRCON, Lviv, Ukraine, pp. 1167–1170, 2019. [Google Scholar]
37. A. Montazerolghaem, M. H. Yaghmaee and A. Leon-Garcia, “Green cloud multimedia networking: NFV/SDN based energy-efficient resource allocation,” IEEE Transactions on Green Communications and Networking, vol. 4, no. 3, pp. 873–889, 2020. [Google Scholar]
38. H. Zhu, X. Liao, C. de Laat and P. Grosso, “Joint flow routing scheduling for energy efficient software defined data center networks: A prototype of energy-aware network management platform,” Journal of Network and Computer Applications, vol. 63, pp. 110–124, 2016. [Google Scholar]
39. Y. Njah and M. Cheriet, “Parallel route optimization and service assurance in energy-efficient software-defined industrial IoT networks,” IEEE Access, vol. 9, pp. 24682–24696, 2021. [Google Scholar]
 | This work is licensed under a Creative Commons Attribution 4.0 International License, which permits unrestricted use, distribution, and reproduction in any medium, provided the original work is properly cited. |