DOI:10.32604/cmc.2022.018396
| Computers, Materials & Continua DOI:10.32604/cmc.2022.018396 | |
| Article |
Deep Learning with Backtracking Search Optimization Based Skin Lesion Diagnosis Model
1Department of Electronics & Instrumentation Engineering, V. R. Siddhartha Engineering College, Vijayawada, 520007, India
2Department of Mechanical Engineering, Saveetha School of Engineering, SIMATS, Chennai, 602105, India
3Department of Computer Science and Engineering, Vignan's Institute of Information Technology, Visakhapatnam, 530049, India
4Department of Archives and Communication, King Faisal University, 31982, Kingdom of Saudi Arabia
5Electronic and Telecommunicacions Program, Universidad Autónoma del Caribe, Barranquilla, 08001, Colombia
6Department of Computational Science and Electronic, Universidad de la Costa, CUC, Barranquilla, 08001, Colombia
7Department of Mathematics, Faculty of Science, New Valley University, El-Kharga, 72511, Egypt
*Corresponding Author: Margarita Gamarra. Email: mrgamarra22@gmail.com
Received: 07 March 2021; Accepted: 01 May 2021
Abstract: Nowadays, quality improvement and increased accessibility to patient data, at a reasonable cost, are highly challenging tasks in healthcare sector. Internet of Things (IoT) and Cloud Computing (CC) architectures are utilized in the development of smart healthcare systems. These entities can support real-time applications by exploiting massive volumes of data, produced by wearable sensor devices. The advent of evolutionary computation algorithms and Deep Learning (DL) models has gained significant attention in healthcare diagnosis, especially in decision making process. Skin cancer is the deadliest disease which affects people across the globe. Automatic skin lesion classification model has a highly important application due to its fine-grained variability in the presence of skin lesions. The current research article presents a new skin lesion diagnosis model i.e., Deep Learning with Evolutionary Algorithm based Image Segmentation (DL-EAIS) for IoT and cloud-based smart healthcare environments. Primarily, the dermoscopic images are captured using IoT devices, which are then transmitted to cloud servers for further diagnosis. Besides, Backtracking Search optimization Algorithm (BSA) with Entropy-Based Thresholding (EBT) i.e., BSA-EBT technique is applied in image segmentation. Followed by, Shallow Convolutional Neural Network (SCNN) model is utilized as a feature extractor. In addition, Deep-Kernel Extreme Learning Machine (D-KELM) model is employed as a classification model to determine the class labels of dermoscopic images. An extensive set of simulations was conducted to validate the performance of the presented method using benchmark dataset. The experimental outcome infers that the proposed model demonstrated optimal performance over the compared techniques under diverse measures.
Keywords: Intelligent models; skin lesion; dermoscopic images; smart healthcare; internet of things
Smart healthcare includes Internet of Things (IoT), medical devices and applications that interlink healthcare Information Technologies (IT) using networking. It significantly reduces the number of unnecessary visits to the hospital and minimizes the burden on healthcare professional and organizations. Further, it enables the patients to connect with corresponding physician and allows them to share the medical data securely via private network. Skin cancer is one of the widely occurring lesions that affects individuals across the globe. Skin lesion is deemed to be a general disease and has gradually increased over the years. Generally, skin tissues comprise of cells, while every cell is rooted onto tissues. A person is said to be infected with cancer if they report abnormal cell growth in concerned tissues. Cancer is characterized by anonymous growth of cell structures and it can be broadly classified into malignant and benign. Benign cancer is a sort of tumor that is considered as a non-infective mole. Malignant cancer, on the other end, is a type of tumor that is extremely dangerous and results in death at times. Further, it also harms the other organs of the human body. Few causes of skin cancer are continuous exposure to Ultra violet (UV) rays, poor immunity, heredity, etc. Skin has three cell types such as melanocyte, squamous cell, and basal cell. Among these, Melanoma, a type of cancer which is highly malevolent and grows later when the lesion is detected. Both United States and Australia exhibit high prevalence of skin lesions.
Dermoscopy is a major component employed in the prediction of skin lesions. Dermoscopic image must be transparent and only a specialized dermatologist can help in managing the disease. However, this is a time-consuming process. Image segmentation is performed with the help of k-means clustering. Its efficiency is estimated through four classifiers out of which Neural Network (NN) has the highest accuracy in addition to identical feature sets. A three-dimensional reconstruction technique was proposed by the researchers in two-dimensional image [1]. In this study, three-dimensional images were predicted and its RGB was computed. These images underwent preprocessing and got converted into binary images in the form of 0/1. An adaptive snake technique was employed to segment the images. Based on the application of entire features, a three-dimensional depth estimation characteristic was employed to maximize the classification performance. When melanoma is diagnosed at the beginning stages, its mortality rate can be reduced.
A new skin lesion detection technique was introduced in the literature [2] in which Multi-class Support Vector Machine (MSVM) classifier was employed. Gray Level Cooccurrence Matrix (GLCM) was applied in the extraction of color and texture features like homogeneity, gradient and contrast. K-means clustering technique was utilized to segment the images. Cancer area was identified from five different types of the image. Classification and segmentation outcomes are portrayed through Graphical User Interface (GUI) applications. The study conducted earlier [3] proposed an idea for classifying melanoma using naïve Bayes (NB) and shearlet transform coefficient classification technique. The datasets were degraded first using shearlet transformation with existing shearlet coefficient values. Followed by, the needed coefficients were used by NB classification model. In literature [4], a fundamental concept of annotation instrument was proposed. In this concept, manual segmentation techniques were enhanced through the development of ground truth dataset. This is done so, in order to segment and classify the images automatically, using the skills of dermatologists. It is advantageous to reform the boundaries and to perform freehand drawing. It is utilized in the extraction of features from input image and denotes the collection of values.
The current research article presents a new skin lesion diagnosis model i.e., Deep Learning with Evolutionary Algorithm based Image Segmentation (DL-EAIS) model for IoT and cloud-based smart healthcare environments. In principal, the dermoscopic images are captured using IoT devices, which are then transferred to the cloud server for additional diagnosis. Also, Backtracking Search Optimization Algorithm (BSA) with Entropy-Based Thresholding (EBT) i.e., BSA-EBT technique is used in this study for image segmentation. Moreover, Shallow Convolutional Neural Nnetwork (SCNN) model is utilized as a feature extractor and Deep-Kernel Extreme Learning Machine (D-KELM) model is employed as a classifier to determine the class label of dermoscopic images. A detailed simulation study was performed to highlight the effectiveness of the proposed method upon benchmark dataset.
The paper is organized as follows. Section 2 details the review of literature and Section 3 discusses the presented model. Followed by, Section 4 provides the experimental validation whereas conclusions are drawn in Section 5.
The presence of important features in dermoscopic image plays an essential role in the classification of melanoma [5]. It is obtained through efficient segmentation of dermoscopic images captured from nearby tissues. Image segmentation of cancerous cells, from adjacent healthy tissues, followed by the extraction of essential features are vital processes for effective recognition. Distinct segmentation techniques are designed and are accessible in the literature. Histogram thresholding techniques try to detect the threshold values for lesion segmentation from adjacent cells. Unsupervised clustering techniques use color space features of dermoscopic images to attain similar parts [6]. Region- and edge-dependent techniques leverage the advantage of edge functions and several other techniques such as merging, region splitting, etc.,
Active contour technique makes use of metaheuristic techniques for the segmentation of cancerous regions [7]. Supervised models namely Random Forest (RF), SVM, etc. are used in the segmentation of skin lesions via training technique [8]. Therefore, classical segmentation processes cannot obtain efficient results and it fails in solving the problems such as poor contrast, hair, unclear borders, and artefacts. Recently, DL techniques, mainly Convolution Neural Networks (CNN), gained significant attention in distinct fields of object identification, image segmentation, classification, etc., [9]. An end-to-end deep neural network was presented with two phases such as classification and segmentation in the literature [10]. A Fully Convolutional Residual Network (FCRN) was proposed earlier using deep residual network [11]. A dermoscopic image segmentation technique was developed in the study conducted earlier [12] using Fully Convolutional Network (FCN) and by enhancing the usage of uncommon loss function called ‘Jaccard distance’. Now, class imbalance problem is solved between adjacent skin images and the cancer images. Bi et al. [13] proposed a multi-level FCN and Parallel Integration (PI) technique to segment the skin cancer images.
Several smartphone-enabled dermoscopic gadgets are available in the marketplace, namely HandyScope and DermLite. But it cannot be used by everybody, since it is costly and it needs extensive training to use such gadgets. Abuzaghleh et al. [14] presented a real-world warning component that supports clients to prevent skin burning through an automatic image examination component. But, this method used a total of two hundred images only. Similarly, it required preprocessing, segmentation of cancerous images to remove noise and grounding in the image. Do et al. [15] studied the classification of skin cancer images acquired through smartphones under poor lighting and focal situations. Sahu et al. [16] presented a portable assistant utilizing Raspberry Pi for the classification of skin lesion. While this technique does not require network connection, it is restricted with inbuilt battery lifetime. Several skin lesion recognition and classification models are available for the prediction of skin lesion and skin cancer in which computer aided techniques are applied. But automated skin cancer classification and segmentation are highly difficult processes to accomplish due to ambiguous boundaries, worst contrast, noise, and shape and size alterations of the dermoscopic image.
The working principle of the presented DL-EAIS model is illustrated in Fig. 1. The presented model has a series of processes such as image acquisition, image preprocessing, segmentation, feature extraction and classification. In the beginning, IoT devices are utilized to capture the skin images of the patient. Then, the images are forwarded to the cloud server. Followed by, image preprocessing occurs for the dermoscopic images to improve its quality in terms of noise removal, artifact removal, and contrast enhancement. Then, BSA-EBT technique is applied to identify the affected regions and segment the same in dermoscopic images. Subsequently, the features are extracted using SCNN model. Finally, D-KELM model is employed for classification purposes and to identify the class labels for the applied dermoscopic images.
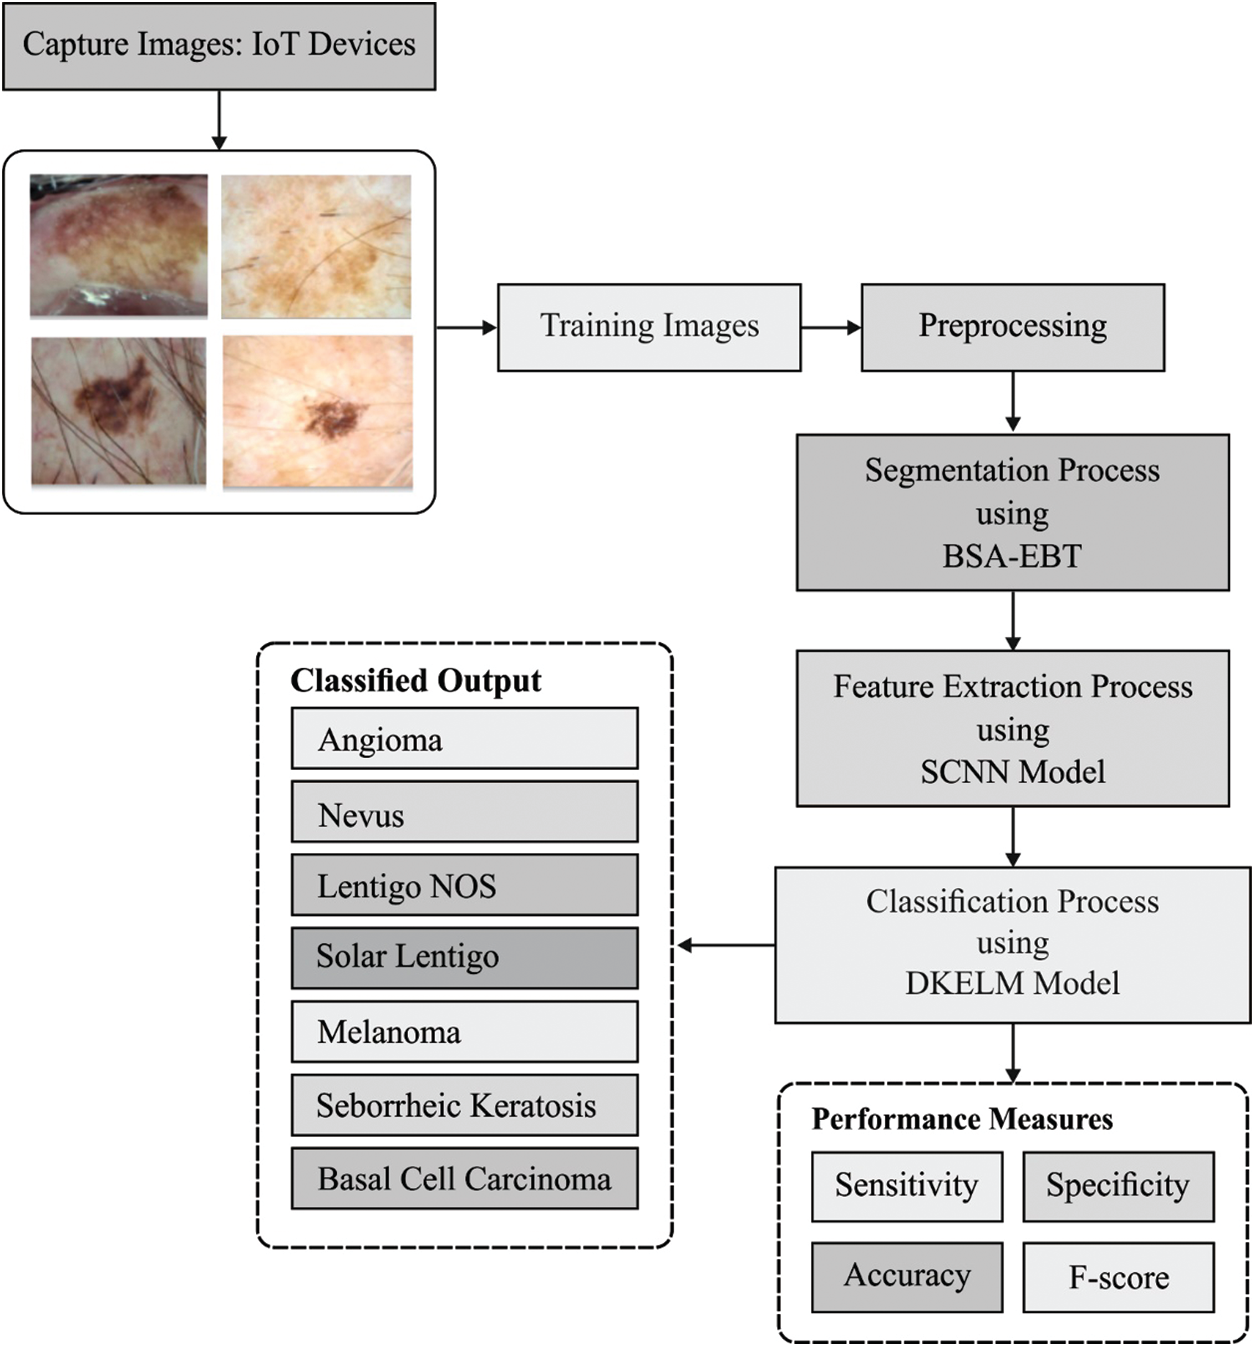
Figure 1: The overall process of the proposed DL-EAIS method
Once the IoT devices capture and transmit the skin lesion images to cloud, preprocessing takes place in different ways [17]. In this study, format transformation process is followed with the identification of interest regions like lesions. Then, hair removal process is executed as it plays an important role in the overall performance of the model. Initially, the color image is transformed into grayscale image. Afterwards, top hat filtering technique is employed to detect denser and darker hairs that exist in the lesion image [18]. The obtained results comprise of several variations amongst the input and output images, as defined in Eq. (1):
where
3.2 Image Segmentation Using BSA-EBT Technique
At this stage, the preprocessed images are segmented using BSA-EBT technique in order to identify the infected regions of skin lesion images. Generally, thresholding concepts are widely used in image segmentation process [19]. Bi-level thresholding method generates a threshold image
When objects become dark and backdrop becomes bright, the threshold image is attained through Eq. (3).
Kapur's entropy technique is commonly utilized in multilevel image thresholding and it depends on the idea of entropy. Assume I is an image which has L grey levels
In view of k threshold levels
where
To optimize the threshold values in Kapur's entropy, BSA is applied. BSA is a recently-developed population based-evolutionary algorithm. This algorithm is an inspiration of iterative procedure which attempts to minimize the objective function. BSA includes five major processes namely initialization, selection-I, mutation, crossover, and selection-II. These processes are defined in subsequent sections. Fig. 2 shows the flowchart of BSA algorithm [21].
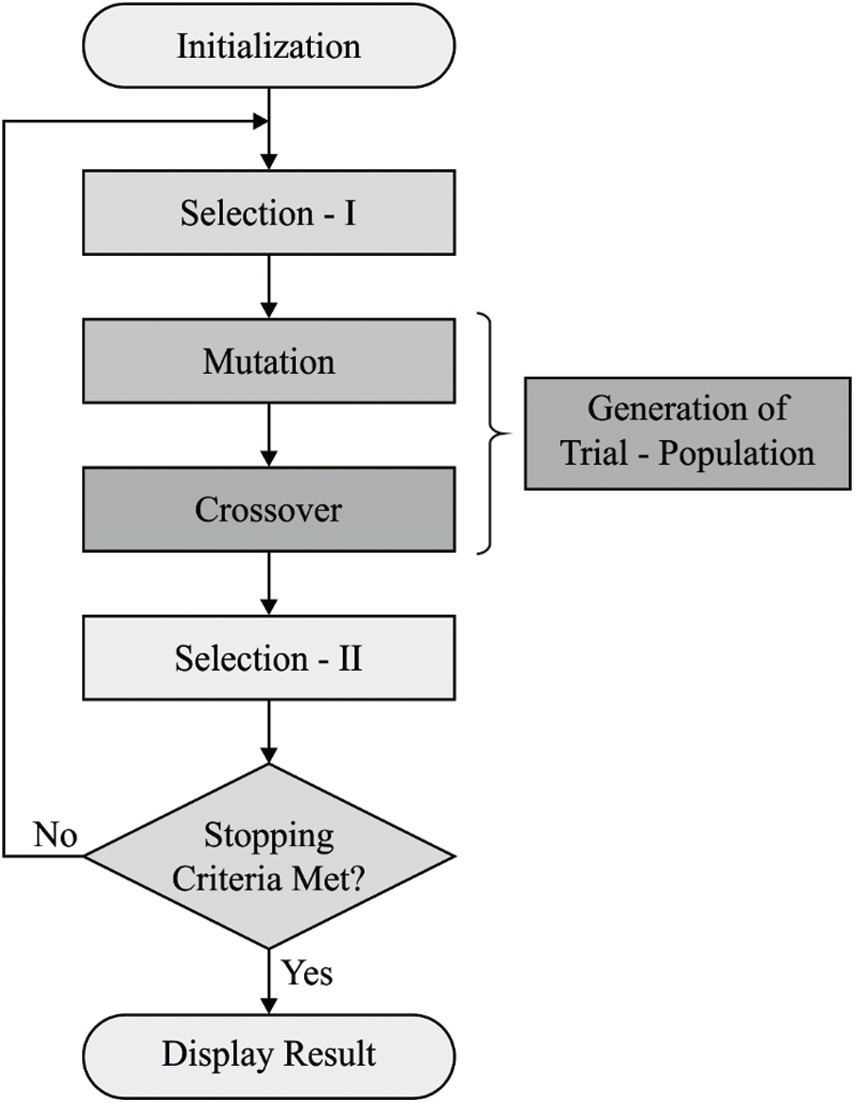
Figure 2: The flowchart of BSA
At first, BSA sprinkles the population members in solution space with the help of uniform random distribution function:
where N and D denote the population size as well as problem dimension correspondingly. U signifies the uniform distribution function and
During this phase, BSA creates the historical population and is employed for defining the search direction. Eq. (8) is utilized for initiating the historical population:
There is a possibility of providing an option to BSA which can redesign
where a and b are the uniform real numbers that lie in the interval of
where the permutation
The mutant members of the BSA are produced with the help of Eq. (11):
where F indicates a real number for step-size amplifications of search direction [22]. BSA makes use of past data to determine the searching direction of population members during when
The last method of the trial population T is produced using a crossover model of BSA which comprises of two stages. The initial one utilizes
At this stage, the
3.3 SCNN Based Feature Extraction
Next to image segmentation, SCNN model gets executed to generate a suitable group of feature vectors of the segmented image. CNN architecture is employed to detect and classify skin lesions. CNN models require massive volumes of training data due to which it is challenging to use a huge database of skin lesion images. So, transfer learning and finetuning concepts are used to leverage small-sized database. A deep CNN model commonly undergoes training using massive volumes of data. The trained system could be utilized as pretrained model. The parameters involved in pre-trained model are tuned with the help of a training dataset, while the fine-tuned model is employed in testing. The structure of SCNN model is shown in Fig. 3 [23]. It includes only two convolutions and two max-pooling layers. The RGB color image, sized 224 × 224 pixels, remains the input of SCNN. A set of 64 filters, sized 5 × 5, exists in primary convolution layer, and 128 filters of size 5 × 5 in subsequent convolution layer [23]. The size of the mask in max-pooling filter is 2 × 2. Rectified Linear Unit (ReLU) can be utilized for nonlinear activation. After the last max-pooling layer, the features are flattened and are given to Fully Connected (FC) layer. A pair of FC layers is presented next to a softmax (output) layer. Upon the completion of training process, training dataset is fine-tuned using minibatch Stochastic Gradient Descent (SGD) technique.
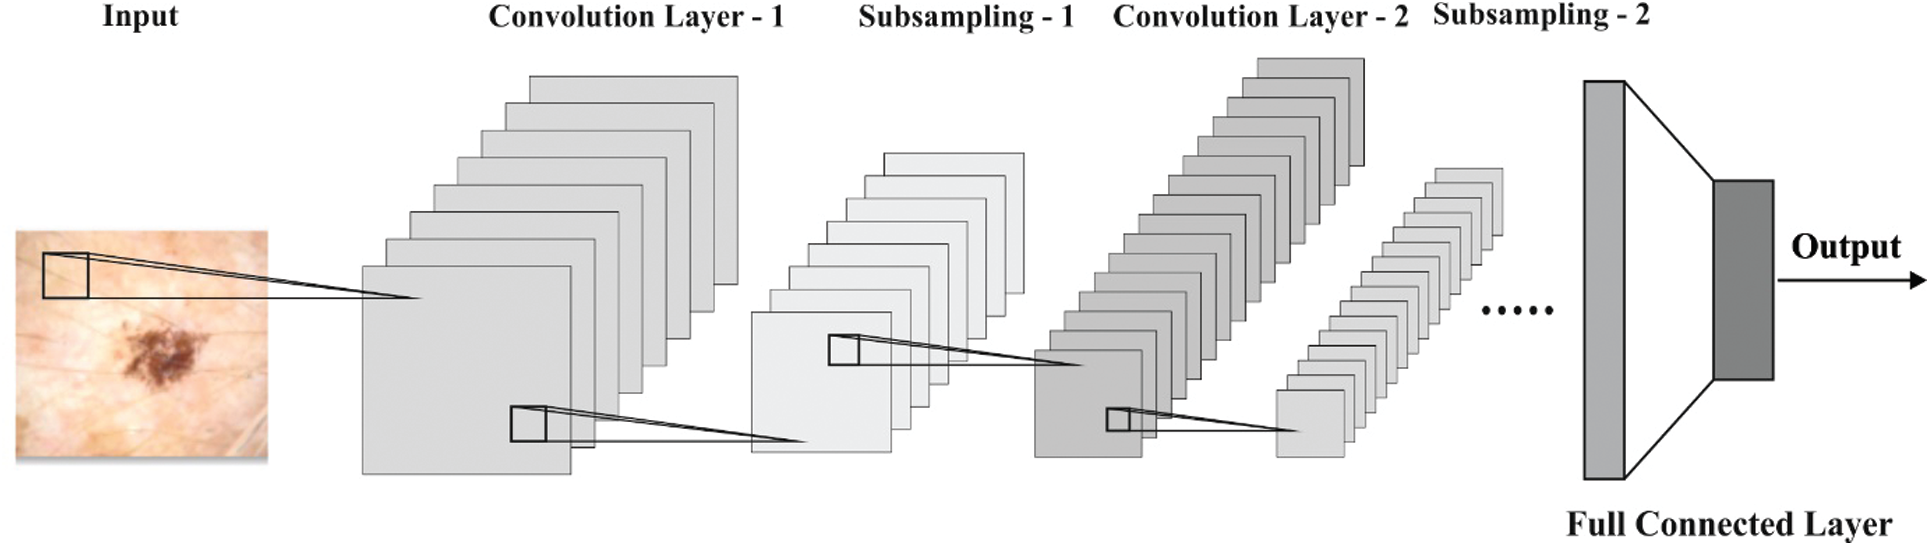
Figure 3: The structure of SCNN model
3.4 D-KELM Model Based Image Classification
At the end, D-KELM model is applied as a classifier to determine proper class labels of the applied dermoscopic images. DKELM includes a set of KELM autoencoders (AEs) in the deepest layer. The architecture of KELM-AE model is shown in Fig. 4 [24] which is highly related to ELM-AE model apart from the representation of kernels. Kernel function is defined as follows.
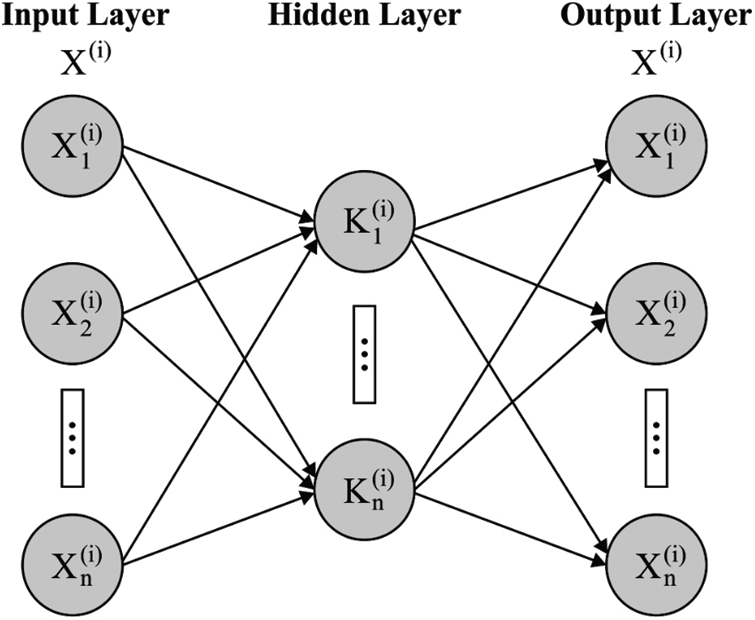
Figure 4: Structure of KELM-AE
Afterward,
The data is defined using end data conversion process as denoted by the following equation.
where g denotes the activation function. The hidden layer activation function is linear/non-linear. Here, non-linear activation function is used in DKELM. It is an established fact that different and massive number of features are learnt and gathered by defining the data through non-linear activation functions and are utilized amongst KELM-AEs [24]. A blend of denser and sparse representation is an effective understanding than linear learning process. In comparison with ELM-AE, it becomes unnecessary to determine the hidden layer count in advance owing to the fact that kernel trick is utilized in every individual hidden layer.
DKELM obtains a common approximation, because a pair of individual learning processes exists in
where
MELM applies the pseudo-inverse concept to calculate the transformation matrix in all the layers. In comparison with MELM, the exact inverse is utilized in the calculation of
The performance of the DL-EAIS model was validated using ISIC dataset. The presented DL-EAIS method was simulated using Python 3.6.5 tool. The dataset, considered for the study, is a collection of skin lesion images under seven distinct classes. The information related to dataset is provided in Tab. 1 and few sample test images are displayed in Fig. 5.
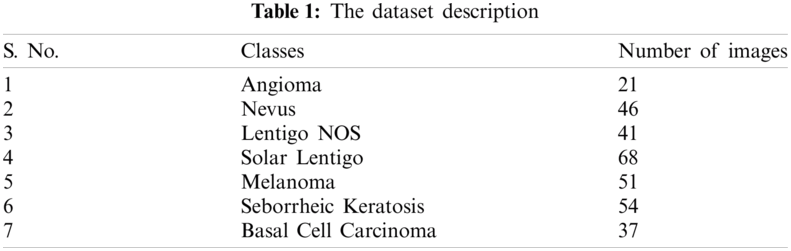
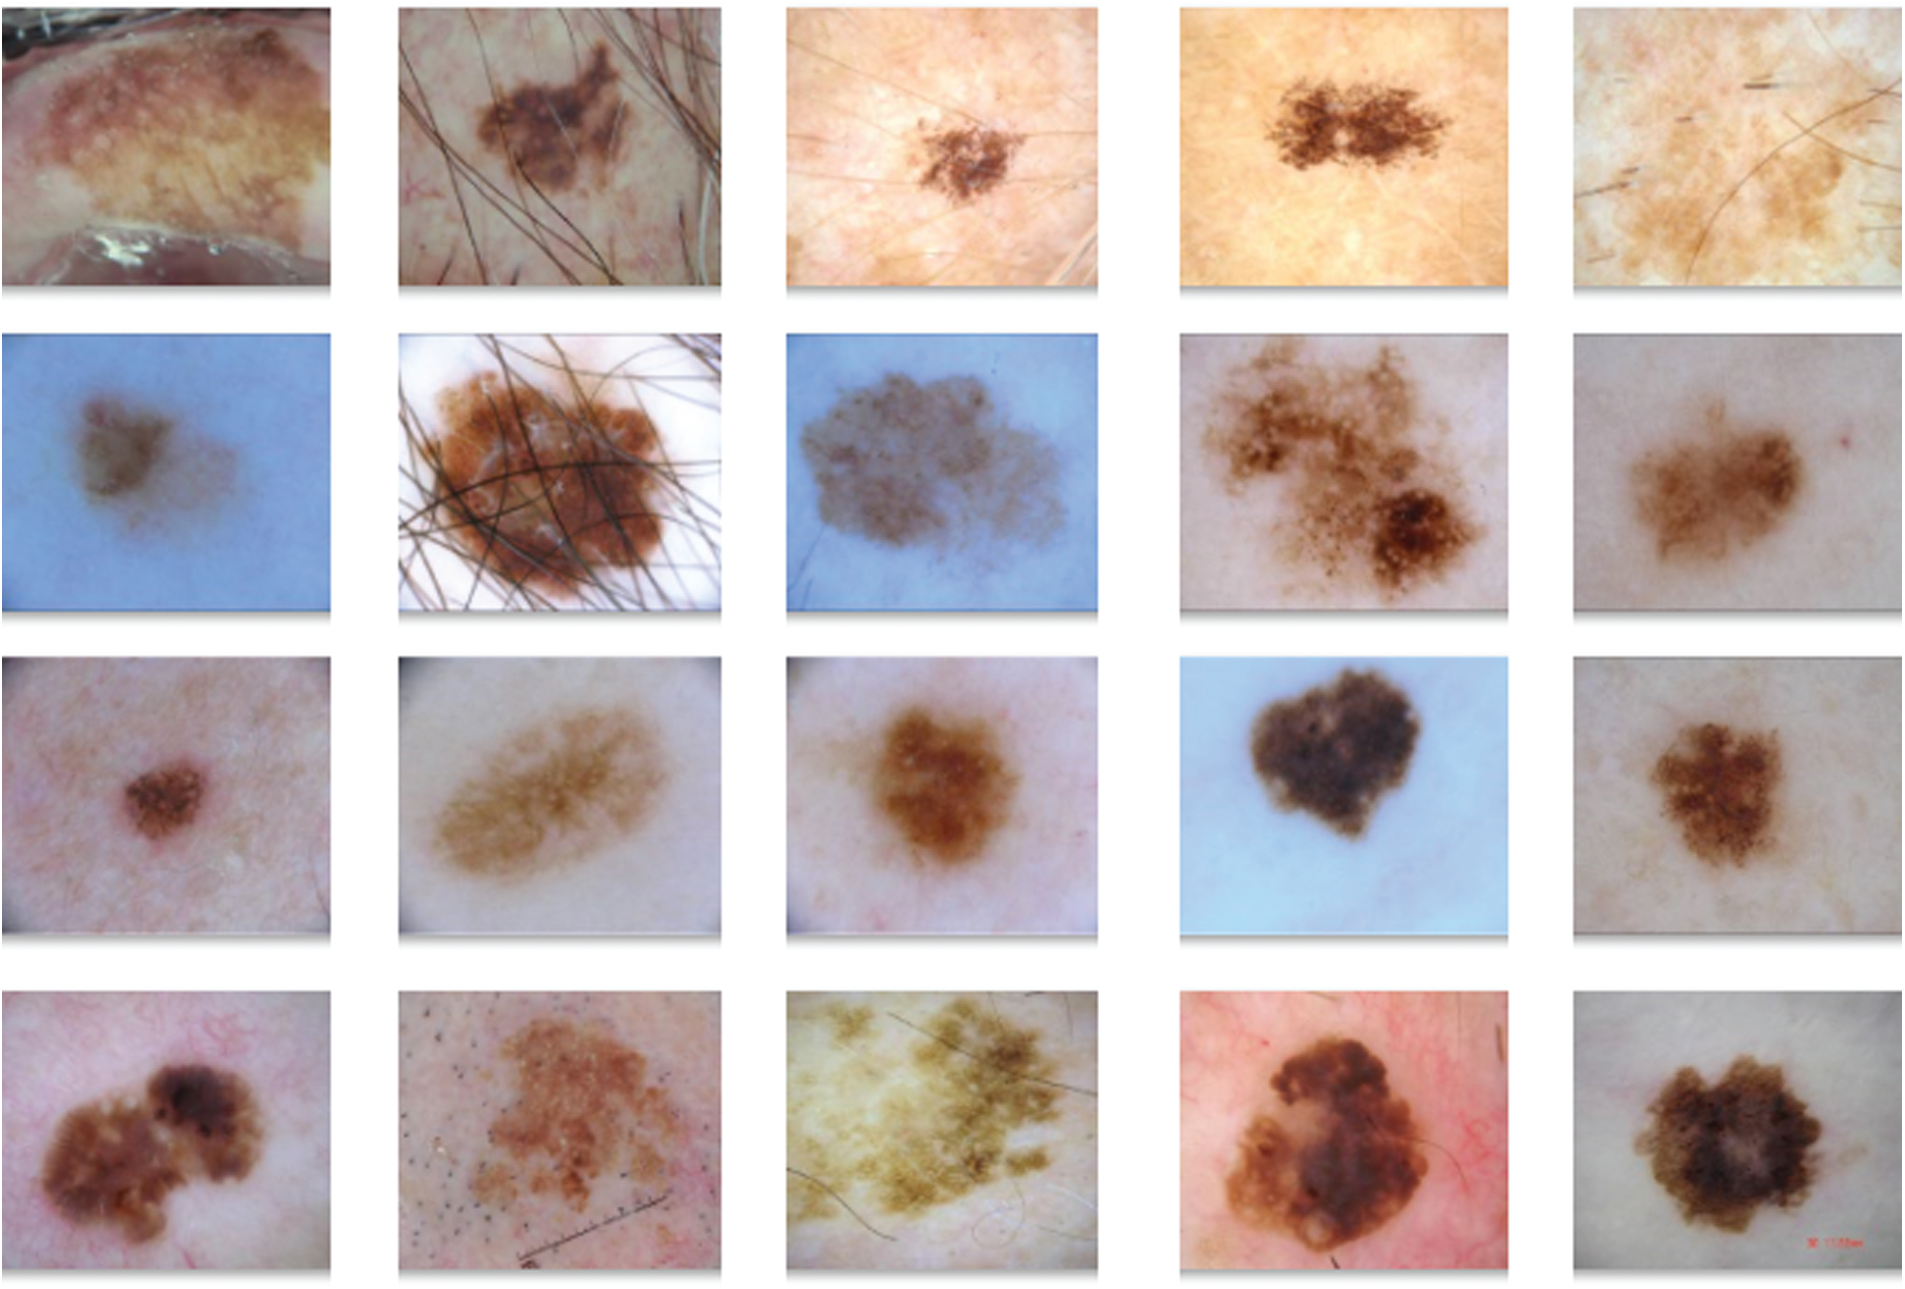
Figure 5: The sample images
Fig. 6 visualizes the results obtained during preprocessing stage of DL-EAIS model. Fig. 6a depicts the input image with hair whereas the masked, segmented, and hair-removed images are illustrated in Figs. 6b−6d. The figure clearly shows that the DL-EAIS model removed the artefacts from dermoscopic images effectively.
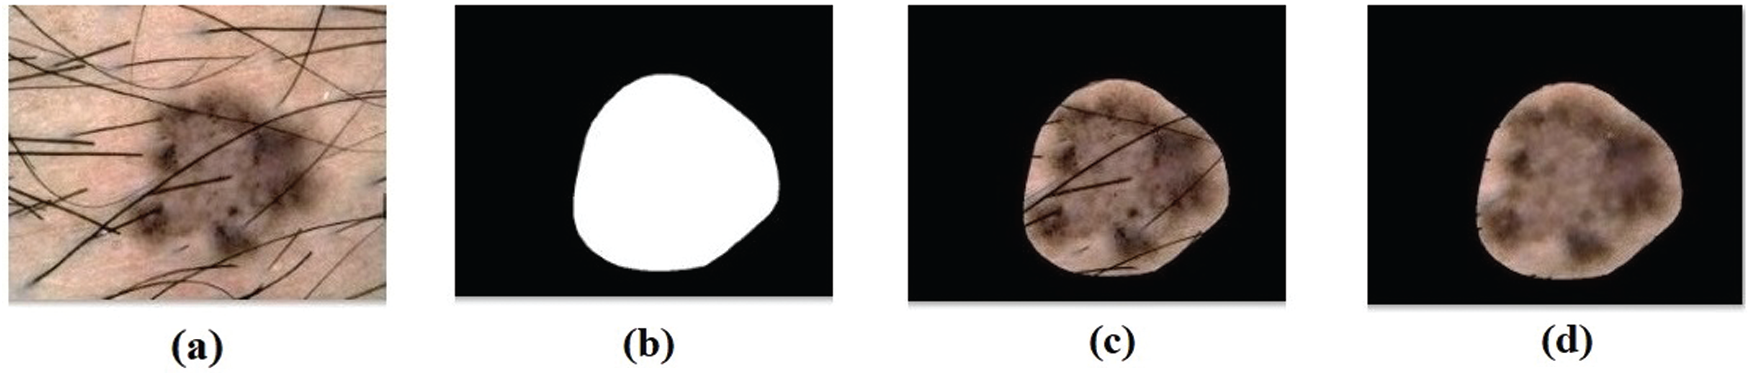
Figure 6: (a) Original image (b) masked image (c) segmented image (d) hair removed image
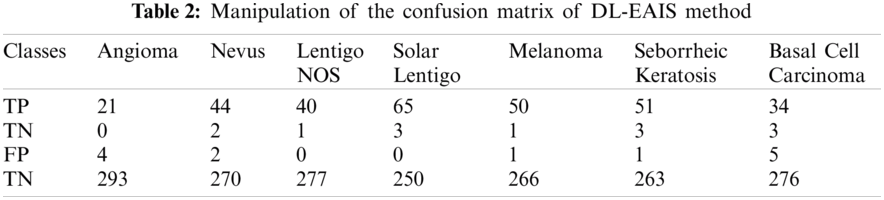
Fig. 7 depicts the confusion matrix generated by DL-EAIS method on the applied ISIC dataset. From the figure, it can be understood that the DL-EAIS technique effectually classified a set of 21 images under Angioma, 44 images under Nevus, 40 images under Lentigo NOS, 65 images under Solar Lentigo, 50 images under Melanoma, 51 images under Seborrheic Keratosis, and 34 images under Basal Cell Carcinoma (BCC). The values in the confusion matrix are manipulated under Tab. 2.
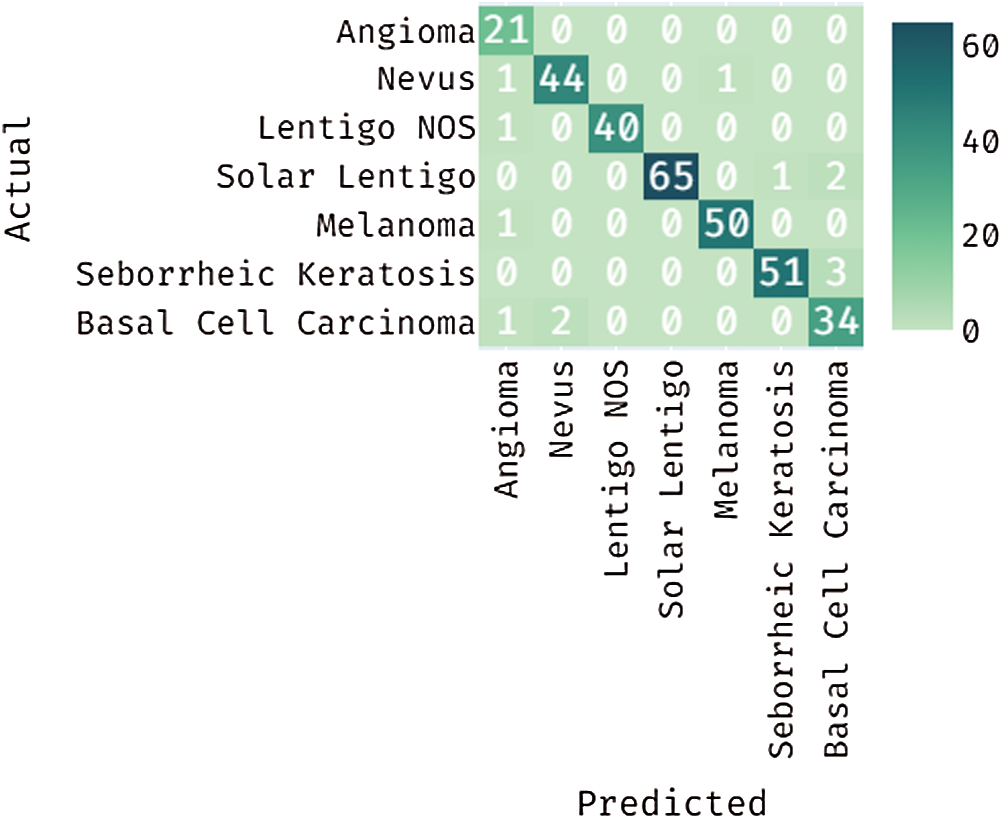
Figure 7: Confusion matrix for the proposed DL-EAIS method
Tab. 3 and Fig. 8 demonstrate the classification outcomes obtained by DL-EAIS model in terms of distinct measures. From the experimental values, it is evident that the DL-EAIS approach classified the dermoscopic images proficiently. For instance, when classifying Angioma class images, the DL-EAIS model achieved the following values for sensitivity, specificity, accuracy, and F-measure i.e., 100%, 98.65%, 98.74%, and 91.30% respectively. Moreover, in the classification of Nevus class images, the DL-EAIS model achieved the following values for sensitivity, specificity, accuracy, and F-measure such as 96.65%, 99.26%, 98.74%, and 95.65% respectively. Eventually, when classifying Lentigo NOS class images, the DL-EAIS model achieved 97.56% sensitivity, 100% specificity, 99.69% accuracy, and 98.77% F-measure. Likewise, when classifying Solar Lentigo class images, the DL-EAIS model achieved the values such as 95.59%, 100%, 99.06%, and 97.74% upon sensitivity, specificity, accuracy, and F-measure respectively. Concurrently, on the classification of Melanoma class images, the DL-EAIS model attained sensitivity (98.04%), specificity (99.63%), accuracy (99.37%), and F-measure (98.04%) respectively. Meanwhile, when classifying Seborrheic Keratosis class images, the DL-EAIS model accomplished the following values such as 94.44%, 99.62%, 98.74%, and 96.23% for sensitivity, specificity, accuracy, and F-measure respectively. At last, on the classification of Basal Cell Carcinoma class images, the DL-EAIS model produced a sensitivity of 91.89%, specificity of 98.22%, accuracy of 97.48%, and F-measure of 89.47% respectively.
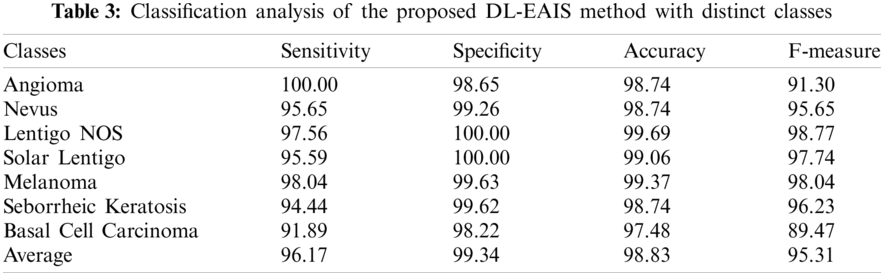
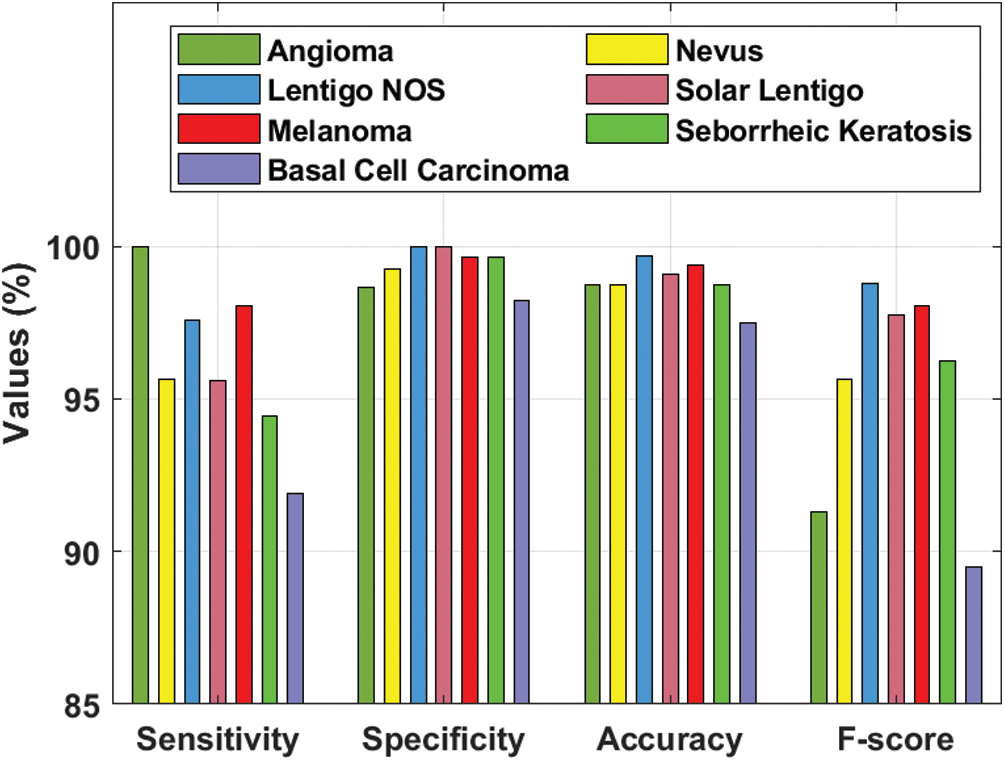
Figure 8: Results of the analysis of DL-EAIS model with different measures
Fig. 9 illustrates the results of average classification analysis of DL-EAIS model in terms of distinct measures. From the figure, it is understood that the DL-EAIS model yielded the highest values in terms of average sensitivity, specificity, accuracy, and F-measure i.e., 96.17%, 99.34%, 98.83%, and 95.31% respectively.
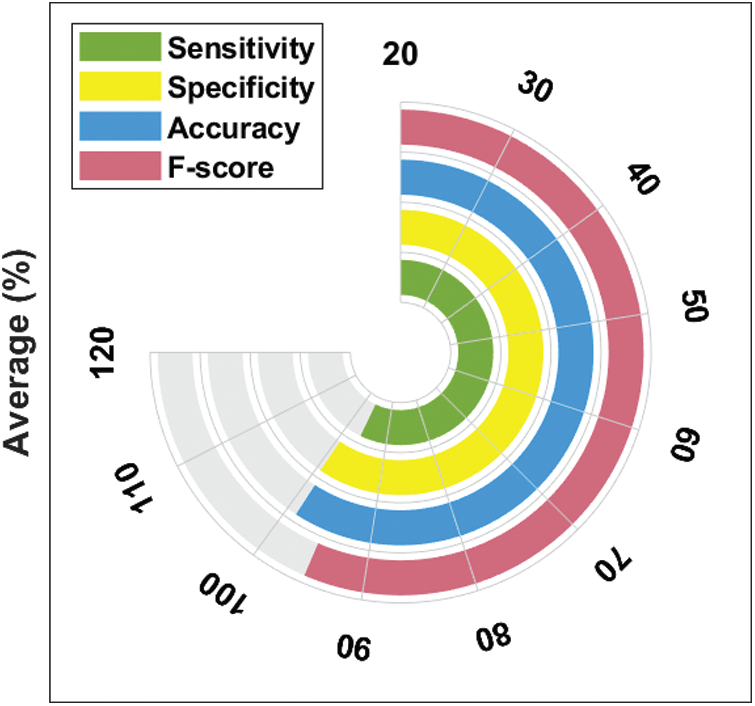
Figure 9: Average analysis of DL-EAIS model with different measures
Fig. 10 shows the results for ROC analysis of the presented DL-EAIS method on the applied ISIC dataset. The figure demonstrates that the DL-EAIS technique produced high ROC of 99.8996%. This value implies that the DL-EAIS model has proficiently identified the class labels of the applied dermoscopic test images.
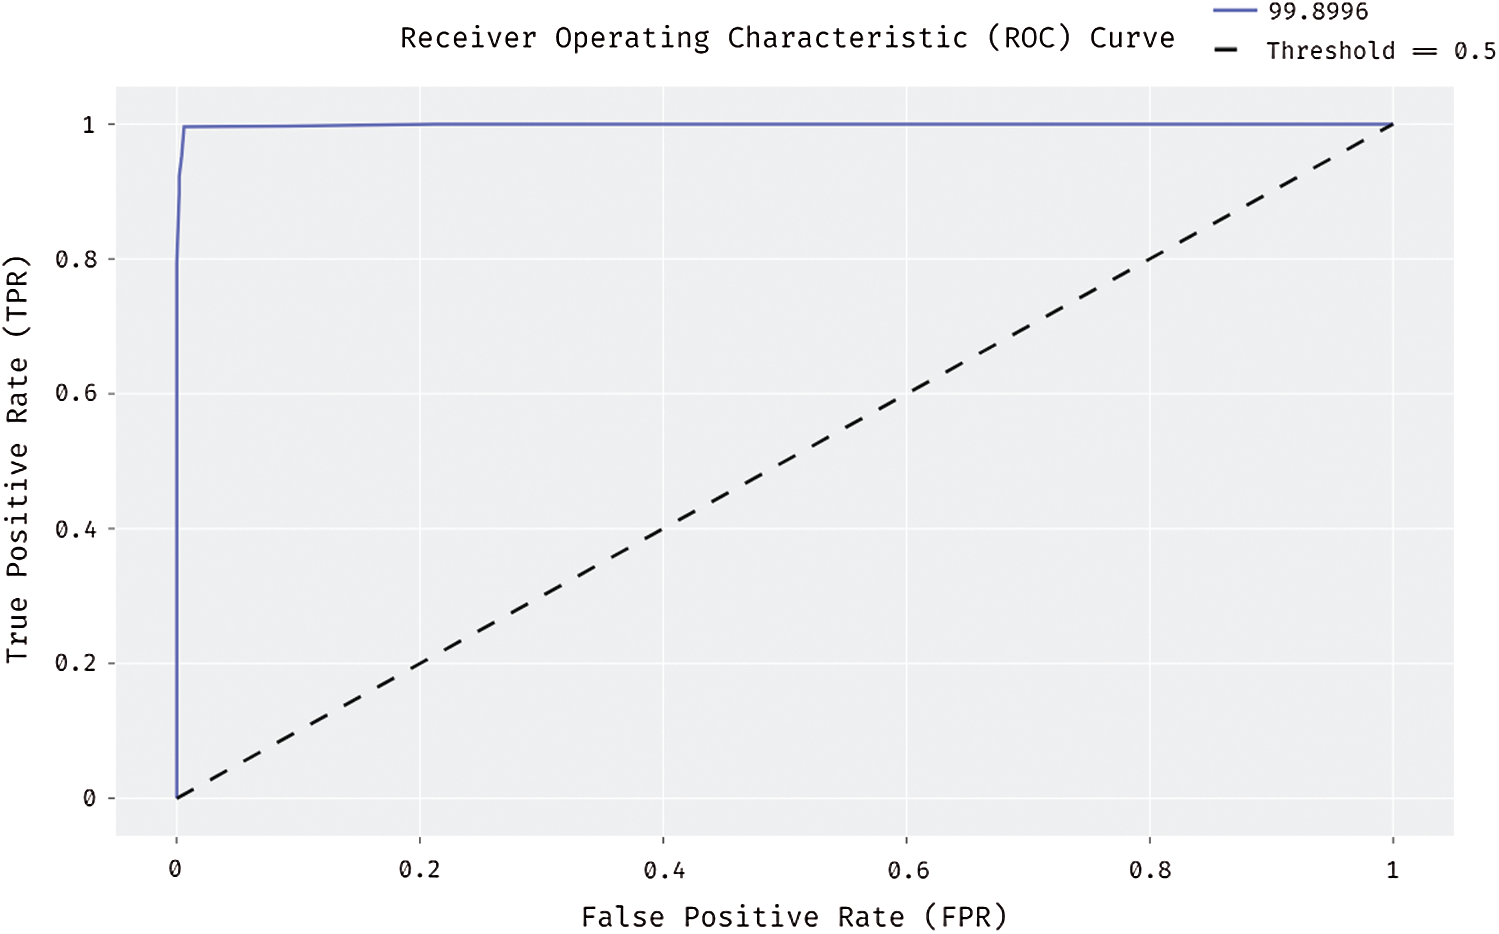
Figure 10: ROC analysis of DL-EAIS model
Tab. 4 and Fig. 11 portrays the results of comparative analysis of DL-EAIS model against existing models under different measures. The experimental values showcase that the DL-EAIS model outperformed the existing methods. When determining the classifier results in terms of sensitivity, the SVM model failed to exhibit an effective outcome since it achieved a least sensitivity of 73.15%. Next to that, ResNet, CNN, DLN, and CDNN models produced slightly increased sensitivity values such as 80.2%, 81.7%, 82%, and 82.5% respectively. Besides, the high level feature extraction technique accomplished an even more sensitivity of 83.5%. Meanwhile, ensemble model and deep convolutional NN models achieved close sensitivity values such as 84.16% and 84.64% respectively. Concurrently, YOLO-GC and DS-ASLS models portrayed near optimal sensitivity values such as 90.83% and 93.4% respectively. But, the proposed DL-EAIS technique showcased better classification results with a superior sensitivity of 96.17%. Similarly, when examining the classifier outcomes with respect to specificity, the SVM method failed to show effective outcomes since it attained the worst specificity of 75.41%. In line with this, High Level Feature Extraction, Ensemble model, CNN, and deep convolutional NN models resulted in somewhat superior specificity values such as 81.3%, 82.64%, 82.9%, and 83.19% respectively. Further, YOLO-GC technique accomplished an even more specificity of 92.68%. Likewise, CDNN and DLN approaches demonstrated close specificity values such as 97.50% and 97.80% respectively. At the same time, ResNet and DS-ASLS methods exhibited near optimal specificity values such as 98.5% and 98.7% respectively. But, the proposed DL-EAIS model illustrated optimal classification results with a superior specificity of 99.34%.
Finally, the classifier outcomes in terms of accuracy revealed that the SVM technique failed to demonstrate an effective outcome, since it reached a minimum accuracy of 74.3%. Likewise, High Level Feature Extraction, CNN, Ensemble, and deep convolution NN methodologies produced somewhat high accuracy values such as 81.1%, 82.4%, 83.98%, and 84.27% respectively. Besides, DLN and YOLO-GC models accomplished higher accuracy values such as 93.2% and 93.39% correspondingly. However, both CDNN and ResNet techniques exhibited an accuracy of 93.4%. Also, DS-ASLS model showcased a near optimal accuracy of 97.91%. Finally, the projected DL-EAIS technique accomplished better classification results while its accuracy was 98.83%.
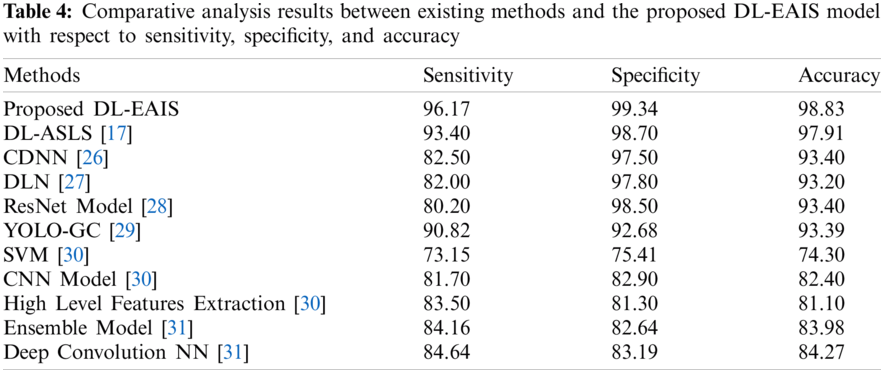
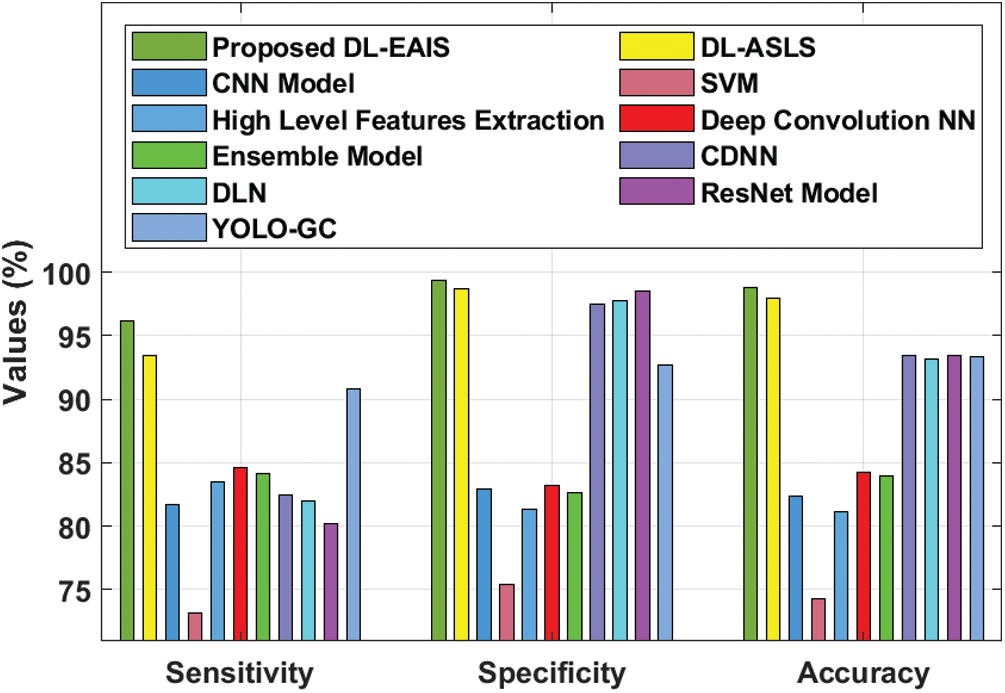
Figure 11: Comparative analysis of DL-EAIS model with existing methods
The current research article presented an effective skin lesion diagnosis model using DL-EAIS model for IoT and cloud-based smart healthcare environment. IoT devices are used to capture and transmit the skin lesion images to cloud; Followed by, preprocessing occurs in different ways. Then, the preprocessed images are segmented with the help of BSA-EBT technique to identify the infected regions. Next to image segmentation, SCNN model gets executed to generate a useful set of feature vectors for the segmented image. At the final stage, D-KELM model is applied as a classifier to determine proper class labels of the applied dermoscopic images. A detailed simulation study was performed to highlight the effectiveness of the presented method upon benchmark dataset. The experimental outcomes infer that the proposed method performed better compared to other techniques under diverse measures. In future, the performance of the presented DL-EAIS model can be enhanced with the help of learning rate scheduler for SCNN and D-KELM models.
Funding Statement: The authors received no specific funding for this study.
Conflicts of Interest: The authors declare that they have no conflicts of interest to report regarding the present study.
1. T. Y. Satheesha, D. Satyanarayana, M. N. Giriprasad and K. N. Nagesh, “Detection of melanoma using distinct features,” in 2016 3rd MEC Int. Conf. on Big Data and Smart City, IEEE, Muscat, Oman, pp. 1–6, 2016. [Google Scholar]
2. R. S. Sundar and M. Vadivel, “Performance analysis of melanoma early detection using skin lession classification system,” in 2016 Int. Conf. on Circuit, Power and Computing Technologies, IEEE, Nagercoil, India, pp. 1–5, 2016. [Google Scholar]
3. S. M. Kumar, J. R. Kumar and K. Gopalakrishnan, “Skin cancer diagnostic using machine learning techniques-shearlet transform and naïve Bayes classifier,” International Journal of Engineering and Advanced Technology, vol. 9, no. 2, pp. 3478–3480, 2019. [Google Scholar]
4. C. Spampinato, B. Boom and J. He, “First international workshop on visual interfaces for ground truth collection in computer vision applications,” in AVI ‘12: Proc. of the Int. Working Conf. on Advanced Visual Interfaces, Capri Island, Italy, pp. 812–814, 2012. [Google Scholar]
5. C. Sinz, P. Tschandl, C. Rosendahl, B. N. Akay, G. Argenziano et al., “Accuracy of dermatoscopy for the diagnosis of nonpigmented cancers of the skin,” Journal of the American Academy of Dermatology, vol. 77, no. 6, pp. 1100–1109, 2017. [Google Scholar]
6. K. Shankar, Y. Zhang, Y. Liu, L. Wu and C. H. Chen, “Hyperparameter tuning deep learning for diabetic retinopathy fundus image classification,” IEEE Access, vol. 8, pp. 118164–118173, 2020. [Google Scholar]
7. I. V. Pustokhina, D. A. Pustokhin, D. Gupta, A. Khanna, K. Shankar et al., “An effective training scheme for deep neural network in edge computing enabled internet of medical things (IoMT) systems,” IEEE Access, vol. 8, pp. 107112–107123, 2020. [Google Scholar]
8. R. J. S. Raj, S. J. Shobana, I. V. Pustokhina, D. A. Pustokhin, D. Gupta et al., “Optimal feature selection-based medical image classification using deep learning model in internet of medical things,” IEEE Access, vol. 8, pp. 58006–58017, 2020. [Google Scholar]
9. S. Kathiresan, A. R. W. Sait, D. Gupta, S. K. Lakshmanaprabu, A. Khanna et al., “Automated detection and classification of fundus diabetic retinopathy images using synergic deep learning model,” Pattern Recognition Letters, vol. 133, pp. 210–216, 2020. [Google Scholar]
10. Z. Yu, X. Jiang, F. Zhou, J. Qin, D. Ni et al., “Melanoma recognition in dermoscopy images via aggregated deep convolutional features,” IEEE Transactions on Biomedical Engineering, vol. 66, pp. 1006–1016, 2018. [Google Scholar]
11. N. C. Codella, D. Gutman, M. E. Celebi, B. Helba, M. A. Marchetti et al., “Skin lesion analysis toward melanoma detection: A challenge at the 2017 international symposium on biomedical imaging (ISBI),” in Proc. 15th Int. Symp. on Biomedical Imaging, IEEE, Washington, DC, USA, pp. 4–7, 2018. [Google Scholar]
12. Y. Yuan, M. Chao and Y. C. Lo, “Automatic skin lesion segmentation using deep fully convolutional networks with jaccard distance,” IEEE Transactions on Medical Imaging, vol. 36, pp. 1876–1886, 2017. [Google Scholar]
13. L. Bi, J. Kim, E. Ahn, A. Kumar, M. Fulham et al., “Dermoscopic image segmentation via multi-stage fully convolutional networks,” IEEE Transactions on Biomedical Engineering, vol. 64, pp. 2065–2074, 2017. [Google Scholar]
14. O. Abuzaghleh, B. D. Barkana and M. Faezipour, “Noninvasive real-time automated skin lesion analysis system for melanoma early detection and prevention,” IEEE Journal of Translational Engineering in Health and Medicine, vol. 3, pp. 1–12, 2015. [Google Scholar]
15. T. Do, T. Hoang, V. Pomponiu, Y. Zhou, Z. Chen et al., “Accessible melanoma detection using smartphones and mobile image analysis,” IEEE Transactions on Multimedia, vol. 20, no. 10, pp. 2849–2864, 2018. [Google Scholar]
16. P. Sahu, D. Yu and H. Qin, “Apply lightweight deep learning on internet of things for low-cost and easy-to-access skin cancer detection,” in Proc.: SPIE 10579, Medical Imaging 2018: Imaging Informatics for Healthcare, Research, and Applications, Houston, Texas, United States, 2018. [Google Scholar]
17. M. Y. Sikkandar, B. A. Alrasheadi, N. B. Prakash, G. R. Hemalakshmi, A. Mohanarathinam et al., “Deep learning based an automated skin lesion segmentation and intelligent classification model,” Journal of Ambient Intelligence and Humanized Computing, vol. 12, pp. 1–11, 2020. [Google Scholar]
18. K. J. Jaworek, “Computer-aided diagnosis of micro-malignant melanoma lesions applying support vector machines,” BioMed Research International, vol. 2016, pp. 1–8, 2016. [Google Scholar]
19. S. Mishra and M. Panda, “Bat algorithm for multilevel colour image segmentation using entropy-based thresholding,” Arabian Journal for Science and Engineering, vol. 43, no. 12, pp. 7285–7314, 2018. [Google Scholar]
20. S. Pare, A. Kumar, V. Bajaj and G. K. Singh, “A multilevel color image segmentation technique based on cuckoo search algorithm and energy curve,” Applied Soft Computing, vol. 47, pp. 76–102, 2016. [Google Scholar]
21. P. Civicioglu, “Backtracking search optimization algorithm for numerical optimization problems,” Applied Mathematics and Computation, vol. 219, no. 15, pp. 8121–8144, 2013. [Google Scholar]
22. K. Guney, A. Durmus and S. Basbug, “Backtracking search optimization algorithm for synthesis of concentric circular antenna arrays,” International Journal of Antennas and Propagation, vol. 2014, pp. 1–11, 2014. [Google Scholar]
23. A. Ghoneim, G. Muhammad and M. S. Hossain, “Cervical cancer classification using convolutional neural networks and extreme learning machines,” Future Generation Computer Systems, vol. 102, pp. 643–649, 2020. [Google Scholar]
24. J. Li, B. Xi, Q. Du, R. Song, Y. Li et al., “Deep kernel extreme-learning machine for the spectral–spatial classification of hyperspectral imagery,” Remote Sensing, vol. 10, no. 12, pp. 2036, 2018. [Google Scholar]
25. J. Tang, C. Deng and G. Huang, “Extreme learning machine for multilayer perceptron,” IEEE Transactions on Neural Networks and Learning Systems, vol. 27, pp. 809–821, 2015. [Google Scholar]
26. Y. Yuan and Y. C. Lo, “Improving dermoscopic image segmentation with enhanced convolutional-deconvolutional networks,” IEEE Journal of Biomedical and Health Informatics, vol. 23, no. 2, pp. 519–526, 2019. [Google Scholar]
27. Y. Li and L. Shen, “Skin lesion analysis towards melanoma detection using deep learning network,” Sensors, vol. 18, no. 2, pp. 556, 2018. [Google Scholar]
28. L. Bi, J. Kim, E. Ahn and D. Feng, “Automatic skin lesion analysis using large-scale dermoscopy images and deep residual networks,” arXiv, vol. 2017, pp. 1–4, arXiv: 1703.04197, 2017. [Google Scholar]
29. H. M. Ünver and E. Ayan, “Skin lesion segmentation in dermoscopic images with combination of YOLO and grabcut algorithm,” Diagnostics, vol. 9, no. 3, pp. 72, 2019. [Google Scholar]
30. D. Połap, A. Winnicka, K. Serwata, K. Kęsik and M. Woźniak, “An intelligent system for monitoring skin diseases,” Sensors, vol. 18, no. 8, pp. 2552, 2018. [Google Scholar]
31. T. Y. Tan, L. Zhang and C. P. Lim, “Adaptive melanoma diagnosis using evolving clustering, ensemble and deep neural networks,” Knowledge-Based Systems, vol. 187, pp. 104807, 2020. [Google Scholar]
 | This work is licensed under a Creative Commons Attribution 4.0 International License, which permits unrestricted use, distribution, and reproduction in any medium, provided the original work is properly cited. |