DOI:10.32604/cmc.2022.018295
| Computers, Materials & Continua DOI:10.32604/cmc.2022.018295 | |
| Article |
A Hybrid Feature Selection Framework for Predicting Students Performance
1High Performance Cloud Computing (HPC3), Department of Computer and Information Sciences, Universiti Teknologi PETRONAS, 32610, Seri, Iskandar, Malaysia
2Department of Computer Science and Information Technology, University of Lahore, Pakistan
3Department of Process Engineering, Pakistan Institute of Engineering & Applied Sciences, Nilore, Islamabad, Pakistan
4Electrical Engineering Department, College of Engineering, Najran University, Najran, 61441, Saudi Arabia
5College of Computer Science and Information Systems, Najran University, 61441, Najran, Saudi Arabia
*Corresponding Author: Maryam Zaffar. Email: maryam.zaffar82@gmail.com
Received: 04 March 2021; Accepted: 24 May 2021
Abstract: Student performance prediction helps the educational stakeholders to take proactive decisions and make interventions, for the improvement of quality of education and to meet the dynamic needs of society. The selection of features for student's performance prediction not only plays significant role in increasing prediction accuracy, but also helps in building the strategic plans for the improvement of students’ academic performance. There are different feature selection algorithms for predicting the performance of students, however the studies reported in the literature claim that there are different pros and cons of existing feature selection algorithms in selection of optimal features. In this paper, a hybrid feature selection framework (using feature-fusion) is designed to identify the significant features and associated features with target class, to predict the performance of students. The main goal of the proposed hybrid feature selection is not only to improve the prediction accuracy, but also to identify optimal features for building productive strategies for the improvement in students’ academic performance. The key difference between proposed hybrid feature selection framework and existing hybrid feature selection framework, is two level feature fusion technique, with the utilization of cosine-based fusion. Whereas, according to the results reported in existing literature, cosine similarity is considered as the best similarity measure among existing similarity measures. The proposed hybrid feature selection is validated on four benchmark datasets with variations in number of features and number of instances. The validated results confirm that the proposed hybrid feature selection framework performs better than the existing hybrid feature selection framework, existing feature selection algorithms in terms of accuracy, f-measure, recall, and precision. Results reported in presented paper show that the proposed approach gives more than 90% accuracy on benchmark dataset that is better than the results of existing approach.
Keywords: Educational data mining; feature selection; hybrid feature selection
Education is one of the main pillars of society. It polishes the character and intelligence of students. Current education system may not be suitable for the new and dynamic needs of the society. One major aspect of the new paradigm of the education system is to predict student performance beforehand. As the students are the main stakeholders of the educational systems, therefore by analyzing the student's data and developing different predictions from it, academic organizations may meet the dynamic needs of the society. Moreover, the results of predictions can be helpful for making strategies to improve the quality of education. The better-quality education supports in building the skillful and featureful students. This gives the attention to analyze the academic data. Student performance prediction models help in analyzing the student data with the help of different data mining techniques. Furthermore, to facilitate student performance prediction, many student performance prediction models have been proposed. Student performance prediction models have received a significant amount of contemplation from both the research community and educational sector. Student performance prediction models tackle the problem of prediction of student grades [1], GPA (Grade Point Average) [2], CGPA [3], and Pass/Fail Course [4]. The goal of students’ performance prediction models in EDM (Educational Data Mining) is not only to achieve the high accuracy of prediction models but also to help the educational stakeholders in predicting the performance of students. The students are the main assets of any community and the main aim of any academic organization is to provide the quality education to its students. Moreover, the quality education supports in building the skillful and featureful students. Student performance prediction models help in analyzing the student data with the help of different data mining techniques. A lot of work has been done on the development of students’ performance prediction models. There are two main methods of developing student performance prediction models. One is supervised, and another is the unsupervised method. Classification is a type of supervised learning method. According to [5] around 71.4% of research articles on students’ performance prediction models are using a classification method. It is the top method for the performance prediction models [6]. In the classification method, the target variable is clearly defined as that which we want to predict whether grades, GPA, CGPA, or students PASS/FAIL. This motivated us to focus on the students’ performance prediction model with the help of the classification method.
Feature selection can play a prominent role in enhancing the accuracy of a prediction model. In student's prediction model, the selected features play an important role not only in increasing the prediction accuracy but also in providing the base for the strategic plans for the educational environment. According to [7] information gain attribute evaluator is the best feature selection technique to improve the effectiveness of student prediction model. Whereas, [8] claims CFS subset evaluator as the best feature selection method for predicting the final semester examination performance of students. According to [9] there is not one common feature selection method which can be accurate for all datasets even for a common domain. There is a need to focus on the feature selection algorithms in the area of predicting the performance of students. The third main type of feature selection is hybrid feature selection, which combines the advantages of filter and wrapper feature selection. Unfortunately, there is only a single framework for hybrid feature selection for EDM [10]. The importance of feature selection methods in predicting students’ performance, motivated us to develop a feature selection framework for students’ performance prediction with better prediction accuracy. Furthermore, the design of existing hybrid feature selection framework also motivated us to focus on hybridization of feature selection algorithms to build a robust feature selection framework for student performance prediction.
Contributions: Followings are the contributions of this research in the domain of Educational Data Mining.
a) First different benchmark datasets have been used to predict the student's performance using feature selection.
b) Second, importance of hybrid feature selection has been explored by comparing the results of hybrid feature selection algorithm, filter and wrapper on various students’ benchmark datasets.
c) Limited work was done in students’ performance prediction using hybrid feature selection.
d) A novel hybrid feature selection framework is proposed to predict the performance of students, with better results than existing hybrid feature selection method [10].
A lot of work has been done on the development of students’ performance prediction models. But the study of student's prediction models is still inadequate in predicting the performance of students [11,12], especially in terms of prediction accuracy. So, this motivated us to focus on developing a feature selection framework for predicting the performance of students. Furthermore, this motivated us to build a feature selection framework that can be helpful for building a student performance prediction model, to help the educational stakeholders. This will not only be helpful for academic organizations to build strategic plans accordingly but also with the help of proposed hybrid feature selection framework, we can go to the next level of the education system which fulfills the needs of the current and futuristic society.
Improving the quality of education is one of the challenges for the educational institutions, the improvement in the quality of education is not only required for assembling a higher level of knowledge, but also providing effective facilities of education that can help students in achieving their academic objectives without any problem [13–15]. Identification of factors affecting the performance of students is very important to improve the quality of education [16]. Student performance prediction models help the educational institutions to increase the quality of education by analyzing the student's data to make the academic strategic plans for the improvement of the student's academic performance [17]. However the study on student performance prediction is still insufficient [11]. The performance of student prediction model mainly depends on the selected features from the under-considered dataset [18]. Feature selection helps in identification of suitable features from a dataset and hence very important for the student performance prediction models [19–23]. The main focus of existing feature selection methods in EDM is to improve the prediction accuracy of student performance prediction model henceforth, only focusing on the feature's association with the target class. There are mainly two types of feature selection algorithms, filter, and wrapper feature selection algorithm. The main focus of existing student performance prediction models [24–28] is on using filter feature selection algorithm, and these existing feature selection algorithms have issues of ignoring dependencies and associative features (interaction of features with the classifier) [29]. The emphasis of existing research on student performance prediction using feature selection is on reducing the number of features to improve the prediction accuracy of the model. The two main types of feature selection algorithms, filter and wrapper both have different pros and cons. Hybrid feature selection takes the advantages of both filter and wrapper feature selection approaches [30]. Hybrid feature selection IFSFS [30], is the hybridization of filter and wrapper feature selection algorithms and was proposed to diagnose the erythema to-squamous diseases. Hybridization of SU (Filter feature selection) and backward search strategy as a wrapper has various applications including hypertension diagnosis [31,32], prediction of the type of cancer in a cancer patient [33,34], bioinformatics [35], credit scoring [36,37] as well as in other domains [38]. The existing hybrid feature selection models in different domains of research try to retrieve the optimal features to obtain high prediction accuracy. But they have the foremost limitation in the flow of feature identification, as the features ignored in such hybrid feature selection methods are neither be evaluated in other levels. To the best of our knowledge, there exists a hybrid feature selection framework in EDM to predict the performance of students [39]. The existing hybrid feature selection is the combination of FCBF (filter feature selection) and SFS (wrapper feature selection), but it has the limitation of ignoring feature dependencies, and ignorance of highly associated features in the first phase of hybridization, and the problem in the flow of hybridization strategy, as one feature removed can never be evaluated further in the hybridization flow.
The identification of features from the student performance prediction to help the educational stakeholders is still a problem [40]. The reason for this is that the existing features selection algorithms lack in optimal identification of features. Majority of approaches in student performance prediction are based on the filter feature selection, hence the chance of ignoring uniquely associated features with the target class is high. The importance of hybridization in terms of utilizing the advantages of filter and wrapper feature selection gives the motivation to build a hybrid feature selection framework to obtain optimal features. The selected features for predicting the performance of students plays a vital role in building the strategic plans for the improvement in the quality of education, which in return can result in positive changes in the performance of students. So, the features identified through the educational datasets must not only be associated with the target class, but they must also be significant. The importance of feature significance and association with the target emphasizes on the integration of such type of features in a student dataset. It is necessary to remove the redundant features from a dataset, as well as keeping the associated and significant features in focus. Also, there may be features that can have the significant as well as associated feature properties, and these features must not be ignored during feature selection. Ignoring an optimal feature may lead to non-productive strategic plans for the improvement in the quality of education.
The Fig. 1 describes the main process of the proposed optimized feature selection method for predicting the performance of students. The main phases of the proposed method are the identification of significant features and identification of highly associated features with the target class. The significant features and highly associated features are fused into a new hybrid feature vector by using early level feature fusion technique. The cosine feature selection equation is formulated to calculate the weights of significant features and the highly associated features. The proposed optimized feature selection method has given the concept of selecting the significant feature, associated feature, and hybrid feature. Whereas the proposed method defines hybrid features that are not only significant but also have an association with the target class. To obtain the optimized features, the main steps of the hybrid feature selection framework using feature-level strategy are listed below along with a brief description.

Figure 1: Hybrid feature selection framework with feature fusion
3.1 Identification of Significant Features
Filter feature selection algorithm is performed in this step. The details of the step are explained in coming sections. Chi-square feature selection is used to statistically test the independence of a feature with the class label. It is being computed in different prediction models [41,42] to predict the student's performance. In the proposed approach the chi-square feature selection algorithm is adjusted to compute the test of independence of the feature sfvi and class scj.
Then the feature sfvi and the class scj are independent. This means that the feature sfvi does not contain any category information. Larger values of X2(sfvi, scj), indicates the importance of category information the feature sfvi owns. Chi-square formula is presented through Eq. (2).
N is the total no of instances (students). The rij is the frequency that the feature sfvi and the category scj. pij is the frequency that features sfvi occurs and does not belong to category scj. cij is the frequency that category ci occurs and cannot contain feature sfvi. qij shows number of times neither sci nor sfvi occur. So that mathematical equation of feature vector containing significant features Edf is presented through Eq. (3).
Whereas Edf contains all sfv having the value of X2 (sfvi, scj) greater than zero. Whereas Eq. (4) presents the feature vector containing associated features.
3.2 Identification of Associated Features (Wrapper)
The second step is the identification of features associated with the target class. This step not only identifies the features with a high association with the target class, but also the dependencies between the features. This is not only important for the students but also for the teachers, as they may guide teachers to improve their capabilities in order to increase the quality of education [43]. To identify the associated features, SFS wrapper feature selection is computed. SFS feature selection is a heuristic search algorithm, that start with an empty set [44]. Each of the features in feature matrix SDmis evaluated through SFS feature selection, wrapped by the SVM classification algorithm. Each of the features does the 10-cross-validation and calculates the average accuracy of the 10-cross-validation. The highest accuracy that is the least minimum of the functions that determines whether the evaluated feature should be added to the feature association vector. To identify the associated features with the target class, SFS wrapper feature selection is computed. SFS feature selection is a heuristic search algorithm, that start with an empty set [44]. Each of the features in feature matrix SDm is evaluated through SFS feature selection, wrapped by the SVM classification algorithm. Each of the features does the 10-cross-validation and calculates the average accuracy of the 10-cross-validation. The highest accuracy that is the least minimum of the functions that determines whether the evaluated feature should be added to the feature association vector. The features selected by sequential forward search (SFS) in each of the rounds are evaluated through the wrapped classifier SVM. The features with high prediction accuracy in each of the round are selected. In order to avoid the overfitting issue, data is divided into 10 equal folds by 10-cross-validation. The feature with high accuracy in 10-folds is highly associated with the target class. And on each of the round, the selected features are added in Eaf feature vector. The feature vector Eaf, contains the features associated with the target class, and is represented through Eq. (5):
3.3 Fusion of Significant and Associated Features Using Early-Level Feature Fusion Technique
The significant and associated features are fused using the early-level feature fusion strategy. The academic decisions based on these features can play a vital role in the improvement of quality education. Fusion of features is performed at two levels.
i.Level 1: Identification of projected features using cosine weighting.
ii.Level 2: Identification of highly associated features. Fusion is termed as the integration of different types of features in the process of feature selection [45]. There are different types of fusions, data fusion, decision fusion, and feature-level fusion. The main task of the proposed approach is related to features, therefore feature fusion is computed in the proposed approach, and furthermore, feature fusion is computed in different domains due to its simplicity. Feature Fusion is a technique in which different feature sets are fused into a single feature set/presentation The main advantage of feature fusion is that the new union feature not only keeps the information about the feature but also eliminates the redundant information to a certain degree [46].
The selection of feature-level fusion helps in computing the hybrid feature selection mainly in two folds.
a) The main intention of proposed work is to develop a feature selection method that may identify the most dominating factors affecting the performance of students, feature-level fusion has the ability to derive the most important features from the feature sets involved in the fusion [45,47]. Therefore, taking this advantage in the account, the proposed approach adapted feature fusion.
b) Feature fusion can eliminate the redundant features [47]. As the redundant feature might affect the prediction accuracy of student performance models. So, this might help in elevating the prediction accuracy of the hybrid feature selection frame for student performance prediction.
Early-level fusion and late-level fusion are two main feature fusion strategies. However late-level fusion is expensive in terms of learning efforts as it requires learning algorithm on each of the steps. Whereas late feature fusion also has an issue of the potential loss of correlation in fused space [48]. Combining the two feature vectors for prediction models is a challenging task. Early-level fusion is one of the feature-level fusion strategies to perform concatenation of two feature sets in a common feature vector [49]. In sum, the feature obtained through late-level feature fusion are highly associated with the target class. Whereas the main focus of the proposed approach is not only highly associated features with the target class but also feature dependencies and significance of features are also take into account. As to make the proactive decision for the improvement in students’ performance and building different academic strategical plan the student data must be analyzed properly. So that early-level fusion strategy is adapted to fuse the significant feature vector Edf and associated feature vector Eaf. This may lead towards the optimal selection of features for predicting the academic performance of students. Cosine similarity measure is used to calculate the similarity between the two vectors [50]. Similarity between the two vectors is computed by the cosine of the angle between the two vectors. There are different approaches for predicting the similarity between two vectors, these approaches include, cosine similarity, Jaccard coefficient, Spearman distance, etc. Out of all above-mentioned approaches cosine similarity is proven to work best [51–53], and also have retrieval effectiveness than other similarity measures. Whereas the existing similarity measures have the drawback that they give dominance to largest scale feature, and also existing similarity measures are sensitive to outlier [54]. Furthermore, the existing similarity measure is not the best choice when the similarity relations are complex [52]. Cosine similarity is used to measure the similarity between two vectors in different domains like pattern recognition face recognition [55], text classification [56], search engines [57]. Cosine similarity weights are computed to identify the optimal features and fusion of features vectors by tuning the parameters of cosine similarity measure in the proposed hybrid feature selection framework. The weights are given to different features based on the similarities between these features. The fusion of the feature vectors Edf and Eaf is computed in two levels. Fig. 2 reflects the whole fusions step in proposed hybrid feature selection framework.

Figure 2: Flow of fusion steps in hybrid feature selection framework
3.3.1 Level1: Identification of Projected Features Using Cosine Weighting
In this section, the level 1 of feature fusion technique for hybrid feature selection framework is explained in detail. The cosine similarity measure is the best choice as compared to the other similarity measures because of its ability of effectiveness and dealing with complex similarities. Fig. 3 shows a block diagram of the process of identification of hybrid features by fusing significant feature vector Edf and associated feature vector Eaf using cosine weights cpfw.

Figure 3: Block diagram of level1 of projected feature selection framework using fusion
In the first step, the projected features p are identified from the feature vectors. Whereas it is assumed that the projected features are defined as the features having a projection in Edf and Eaf. So, hybrid features are highly important features as they may have highly associated with the target class as well as significant. Initialize a feature vector daf as an empty feature vector. Whereas daf is denoted as feature vector contacting projected features. Let
Referring to section III.A, Eq. (4), Edf presents a feature vector containing significant features.
Referring to section III.B, Eq. (5), Eaf presents feature vector containing associated features.
Cosine similarity weights are introduced to identify the projected features pf with the fusion Edf and Eaf. The similarity between the two feature vectors can be measured using cosine similarity technique [58]. Eq. (6) presents the cosine similarity equation for the identification of projected features.
where
a) If sim (fdi, fai) = = 0 then cpfw = 0 and fdi = cpfw & fai = cpfw. Furthermore, fdiand fai are ignored in this step.
b) If sim (fdi, fai) = = 1 then cpfw = 1 and fdi = cpfw & fai = cpfw
Therefore, this feature is added as a projected feature in projected feature vector daf.
The above mentioned point a, presents that if the similarity between two features say fdi, and fai from feature vector Edf and Eaf is 0, then it indicates that feature is not similar so that they are ignored. Whereas line 2 presents that if the similarity between two features say fdi, and fai from feature vector Edf and Eaf is 1, then it indicates that feature is similar so that they are added to projected feature vector daf. So that projected feature vector daf contains all the projected feature with cpfw = 1.
3.3.2 Level 2: Identification of Highly Significant Feature (Edf +) and Identification of Highly Associated Features (Eaf +)
The level 2 of feature fusion step in proposed hybrid feature selection framework identifies the highly significant and highly associated feature with the fusion of significant feature vector Edf, associated feature vector Eaf, and projected feature vector pf feature vectors using cosine feature weights. Whereas Fig. 4 explains the identification of Edf+ and Eaf+ by using cosine feature weights. Basically, the level 2 of feature fusion in hybrid feature selection framework further consists of two steps, in first step uniquely significant features are identified. Whereas in the second step uniquely associated features are identified.

Figure 4: Block diagram of level 2 of hybrid feature selection framework using fusion
Uniquely significant feature identification: Edf+ is initialized as an empty set. Whereas Edf+ is considered as a feature vector, containing all uniquely significant features, especially these features are not projected over associated features. Referring to equation, Edf presents a feature vector containing significant features.
daf presents projected feature vector, and cpfw is the weight of projected features in daf. fusion of Edf and daf using csfw. whereas csfw is the cosine weight for uniquely significant features. Eq. (7) presents the cosine weight for uniquely significant features.
where Eq. (8) presents the cosine weight for uniquely significant feature identified from Edf and daf.
The values of csfw will either be 0 or 1.
a) If csfw = = 1 then fdi = csfw, so that feature fdiis ignored and not added to Edf+.
b) If csfw = = 0 then fdi = csfw, so that fdi is added in Edf+ feature vector.
Line 1 shows that if the value of csfw become 1, then it shows the similarity between the features in Edf and feature in daf. So that feature is not considered as a uniquely significant feature. Whereas line 2 shows that if the value of csfw is 0, the feature has no projection, so that is considered a uniquely significant feature, and hence added to Edf+. In sum, the projections of daf feature vectors are compared with Edf in this step. The similarity between the weights of the Edf and daf is checked in such a way that features having no projections with associated feature vectors are added in the Edf+ feature vector.
Edf+ = Feature vectors contains uniquely significant features.
Uniquely associated feature identification: Eaf+ is initialized as an empty set. Whereas Eaf+ is considered as a feature vector, containing all uniquely associated features. daf is compared with Eaf. The similarity between the features of the Eaf and daf is checked in such a way that the features having similarity will be computed in Eaf+ feature vector. Referring to section III.B, Eq. (5), Eaf presents feature vector containing associated features.
Fusion of Eaf and daf using cafw. Whereas cafw is the cosine weight for the uniquely associated features. The Eq. (9) presents the mathematical equation for calculating the uniquely associated features.
where Eq. (10) presents the cosine weight for identifying the ith feature.
And values of cafw either 0, or 1. i. If cafw = = 1 and fai = cafw . Furthermore, faiand dafi are ignored, ii. If casfw = = 0 and fai = cafw, then faiis added in Eaf+ feature vector. Eaf+ = Feature vectors having features uniquely associated features with the target class .In sum line 1 shows that if the features are projected on significant features with the target class, then they are neglected and not added to the Eaf+. Whereas line 2 shows that the features are considered as uniquely associated as having no projections on significant features, and hence such features are added to Eaf+. As a result of level 1, level 2 of feature fusion three types of feature vectors are identified Edf+, Eaf+, and daf.
The features are further training using SVM classification algorithm. SVM is selected in the proposed approach due to its high generalization ability and history of achieving high accuracy in datamining [59]. 10-fold cross validation is performed to evaluate the robustness of proposed hybrid feature selection framework, and high-frequency feature matrix is obtained by applying the frequency criterion. The hybrid features are divided into ten folds using 10-fold cross-validation. Whereas the model is trained using the SVM classification algorithm. The SVM classification algorithm is being used due to its flexibility in dealing with educational parameters in prediction models [60,61]. SVM linear kernel is adjusted with the help of the optimization function of the linear kernel function. The Eq. (11) presents SVM linear kernel function is [62]:
The kernel functions have the ability to whereas, SVM kernel functions have the ability to transform the dataset space into a high dimension. Each of the kernels has optimized function to obtain high performance [63]. For SVM linear kernel the penalty value C is an optimized function. The value of C is optimized to obtain a better classification prediction for the proposed approach. Furthermore, the selected features are trained on SVM linear kernel and then tested and evaluated through different evaluation measures. The detailed of each of the evaluation measure is explained in next section.
The performance of the proposed approach is measured through prediction accuracy, precision, recall, and f-measure. These evaluation matrices are widely used in different domains such as information retrieval, machine learning, sentiment analysis and EDM [34,61]. Let D be a student dataset, containing “n” number of features for “m” number of students. Let SDm be n-size student data feature matrix; the size of the feature vector for each example within data matrix SDm is “n” and “m” is the number of examples. Each feature of the vector contains data related to the students’ information relevant to his/her educational activity.
Size of S Feature Vector = Size of Feature Vector
Dimension of feature matrix=Number of examples in dataset D.
Hybrid feature selection framework using fusion is evaluated on prediction accuracy, precision, recall, and f-measure evaluation measures. The detail of this topic is explained further, Prediction Accuracy: Accuracy is the ratio between the correct predictions. The Eq. (13) shows the accuracy formula for evaluation of hybrid feature selection framework with fusion. It is used to measure the effectiveness of the prediction model. However how minority classification of minority classes cannot be shown by accuracy evaluation measure. Also, accurately predicting the positive outcome is not adequate.
Recall and Precision: As a good prediction model must have successful positive and successful negative predictions as well. Henceforth precision and recall evaluation measure is also used to evaluate the proposed hybrid feature selection framework. Eqs. (14) and (15) present the recall and precision calculations for the evaluating the proposed hybrid feature selection framework.
F-measure: It considers both precision and recall. The results are also evaluated through the, to get the classification of instances with respect to the target class. equation presents the mathematical Eq. (16) for calculating f-measure. In sum, these evaluation measures can give a deeper insight into the performance of the proposed hybrid feature selection framework. So that proposed hybrid feature selection is not only validated in terms of accuracy, but also in terms of precision, recall, and f-measure. This section presented the proposed hybrid feature selection framework using fusion. Each level of the proposed framework is discussed in detail. The methodology of identification significance features, identification of associated features and identification of projected features towards significance and associated features is discussed in detail. Furthermore, the cosine-based feature fusion through cosine weighting is explained in detail. This section also discusses the model training and evaluation measures that evaluate the proposed approach. The next section presents the simulation results of the proposed approach on benchmark students’ datasets.
To check the robustness of a hybrid feature selection, a dataset with a varying number of features and instances are required. Henceforth to empirically evaluate the proposed hybrid feature selection framework using fusion, four benchmark datasets of students’ academic records from different educational domains are selected, to check the robustness, as the robustness in feature selection can be evaluated through variations in the number of instances or variations in the number of features [64]. These four datasets sets are benchmark datasets and are publicly available. The dataset acquired from different databases have different attributes from each other, hence presents a different set of challenges which have not been studied altogether previously. Four different student's benchmark datasets have been used in the proposed research, due to their diversity in nature of datasets in terms of a number of features, no of instances and belonging to different areas of education, to show the robustness of the proposed hybrid feature selection framework for student performance prediction.
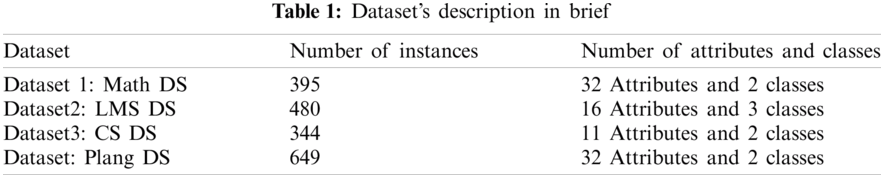
The Tab. 1 presents a brief description of four benchmark datasets, related to variations in number of instances, and number of features. The number of instances in student datasets actually presents the number of records in a particular dataset. Tab. 1 shows the number of instances in Math, LMS, CS, and PLang datasets. PLang dataset contains 649 number of instances (records of students) that are greater in a number of instances than other three datasets. Furthermore, Tab. 1 shows that CS dataset contains the smallest number of instances as compared to other datasets. The reason for selecting datasets having different instances and different attributes is to evaluate the proposed framework in terms of its performance being robust or otherwise. Tab. 1 shows the number of features in Math, LMS, CS, and PLang dataset. It shows that Math and PLang dataset contains 32 number of features, however, these two datasets have a different number of instances as shown in Tab. 1. Furthermore, LMS dataset contains 16 features, and CS contains the smallest number of features as compared to the other three datasets. Hence, Math, LMS, CS and PLang dataset different from each other in terms of a number of students’ records present in them and number of features/attributes in these four datasets.
Simulation Environment: The simulations to implement proposed hybrid feature selection framework for EDM were conducted on machine incorporated with core i5. Python 2.7 version is used as an editor, whereas PYcharm Edu IDE was set up as the development environment.
4.1 Prediction Accuracy of Proposed Hybrid Feature Selection Framework
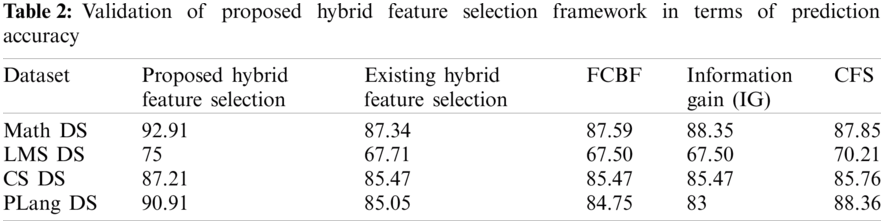
To validate the performance of the proposed hybrid feature selection framework accuracy of hybrid feature selection framework is evaluated. Accuracy is defined as the fraction of correctly predicted observations to the total observations [65–67]. The model with better accuracy is considered as the best prediction model [68]. So that accuracy of the proposed approach will give the ratio of correctly classified students in a pass or fail a class, over the total number of students. Accuracy gives the overall effectiveness of the proposed hybrid feature selection framework. Furthermore, accuracy gives effectiveness over existing feature selection framework and feature selection algorithm by comparing the results of accuracy on benchmark students’ datasets of proposed feature selection framework with existing feature selection framework, and feature selection algorithms. In this section, the accuracy of proposed hybrid feature selection framework is compared with existing feature selection framework, and other feature selection algorithms like FCBF, Information Gain, and CFS, feature selection algorithm and with proposed hybrid feature selection framework.
Referring to Tab. 2, the results in Fig. 5 presents the comparison of prediction accuracy of existing Feature selection framework with the proposed hybrid feature selection framework [39]. The red bar shows the proposed framework and the black bar shows the existing hybrid feature selection framework [39] in Fig. 5. The x-axis shows the results four benchmark datasets and the y-axis shows the percentage value of prediction accuracy on four benchmark datasets. It is clearly observed that the prediction accuracy of the proposed feature section on all datasets show better result than existing hybrid feature selection framework. So that it is retrieved through the result that proposed feature selection perform better in terms of prediction accuracy than existing feature selection framework. As the existing framework overlooks the prediction model [69], and neglect the optimal features. Hence the correctly classified instances of proposed hybrid feature selection are greater than existing hybrid feature selection framework [39]. Fig. 6 shows the comparison of the Prediction Accuracy of existing FCBF filter feature selection algorithm [70] with proposed hybrid feature selection framework. The x-axis shows the results on four benchmark datasets and y-axis shows the percentage values of FCBF and proposed feature selection framework on four datasets. Fig. 6 shows that the proposed feature selection framework outperforms than FCBF on all selected benchmark datasets. It means that a number of students correctly classified by FCBF on each of the four datasets is much less than the proposed feature selection framework. So that it is retrieved through the result that proposed feature selection perform better in terms of prediction accuracy than FCBF feature selection algorithm. Also, the results reported in the existing literature [39] also shows that the prediction accuracy using FCBF feature selection shows prediction accuracy less than the prediction accuracy of proposed hybrid feature selection framework to predict the performance of students.
4.2 Precision of Proposed Hybrid Feature Selection Framework Using Fusion
The hybrid feature selection performance is validated through the precision and recall However, to show the classification of minority classes in a prediction model the precision of proposed hybrid feature selection framework is performed. Precision is the fraction of the retrieved instances that belong to the target class. In precision of the proposed feature selection framework gives the ratio of the total number of pass students classified correctly, over the number of students classified as pass. In sum, it shows how accurately the pass, students are identified correctly. Larger the number of pass students correctly classified means that educational stakeholder can build productive academic plans for the improvement in the performance of students. In this section, the precision results of proposed hybrid feature selection framework on four benchmark datasets are compared with exiting feature selection framework, and feature selection algorithms for predicting the performance of students. Referring to Tab. 3 shows the comparison of the precision of existing hybrid feature selection framework [39] with the proposed feature selection framework. The red bar shows the proposed framework and black bar shows the existing hybrid feature selection framework in Fig. 7. The x-axis shows the results four datasets, and the y-axis shows the percentage value of precession on four datasets. It is clearly observed that the precision of the proposed feature section all datasets show a better result than existing hybrid feature selection framework. Moreover, the number of correctly-classified students by the proposed feature selection framework is greater than existing hybrid feature selection framework. So that it is retrieved through the result that the proposed hybrid feature selection framework performs better in terms of precision than existing feature selection framework.

Figure 5: Comparing the prediction accuracy of proposed feature selection with FCBF
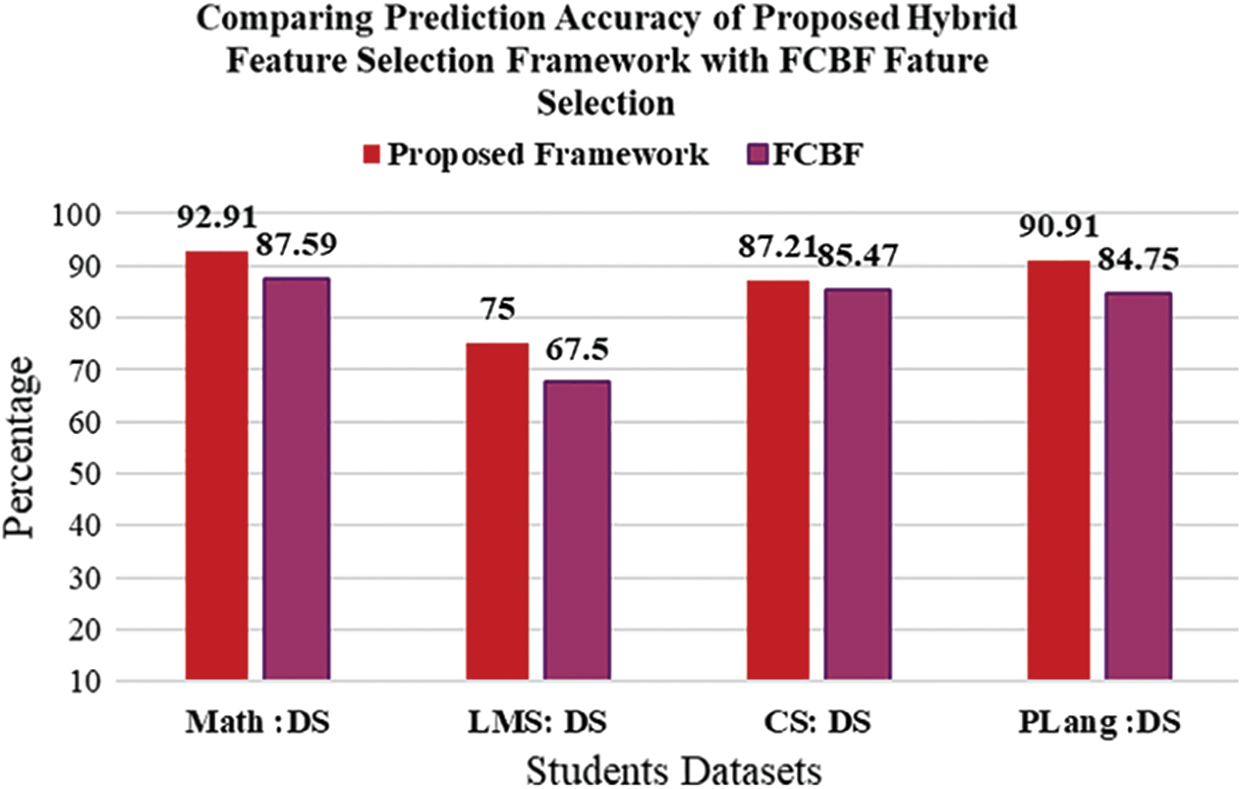
Figure 6: Comparing the prediction accuracy hybrid feature of proposed framework with existing work
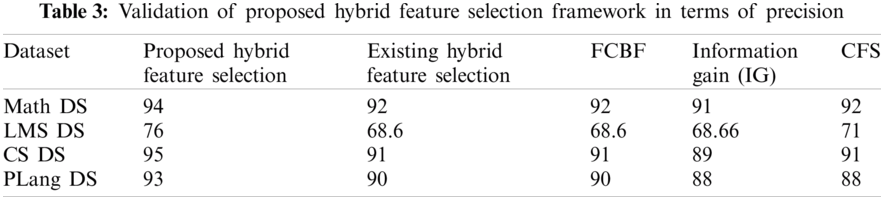

Figure 7: Comparing the precision of proposed framework with existing framework
Fig. 8 shows the comparison of the precision of existing FCBF filter feature selection framework with proposed hybrid feature selection framework. The red bar shows the proposed framework and purple bar shows the existing FCBF filter feature selection algorithm in Fig. 8. The x-axis shows the results four datasets, and the y-axis shows the percentage values of precision by applying FCBF and proposed feature selection framework on four datasets. The results in Fig. 8 depicts that the number of students correctly classified by FCBF algorithm on all selected datasets is much less than the number of correctly classified students by proposed feature selection framework. Hence it is retrieved through the result that proposed feature selection perform better in terms of precision than existing FCBF feature selection algorithm. Fig. 9 shows the comparison of the precision of existing IG (Information Gain) filter feature selection algorithm with proposed feature selection framework. The red bar shows the proposed framework and light blue line bar shows the existing IG filter feature selection algorithm in Fig. 9. The x-axis shows the results four benchmark datasets, and the y-axis shows the percentage value of f-measure on four datasets. It is clearly observed that the precision of the proposed feature selection on all selected datasets show a better result than existing IG feature selection algorithm. So that it is retrieved through the result that proposed feature selection perform better in terms of precision than existing IG filter feature selection algorithm.

Figure 8: Comparing precision of proposed hybrid feature selection framework with FCBF

Figure 9: Comparing precision of proposed hybrid feature selection framework with information gain
Fig. 10 shows the comparison of the precision of existing CFS (Correlation based feature selection) filter feature selection algorithm with proposed hybrid feature selection framework. The x-axis shows the results four datasets, and the y-axis shows the percentage value of precession on four datasets. It is clearly observed that the precession of the proposed feature section on Math, LMS, CS, and PLang datasets show better result than existing CFS feature selection algorithm. So that it is retrieved through the result that proposed feature selection perform better in terms of precision than existing CFS filter feature selection algorithm.
4.3 Recall of Proposed Hybrid Feature Selection Framework Using Fusion
The recall is another important measure to evaluate the efficiency of selected features [7]. The recall is the fraction of the target class recognized as an actual class [71,72]. It gives the ratio of correctly classified students belong to a particular class, over a total number of students. So that the recall results of proposed hybrid feature section framework present the ratio of correctly classified pass students over the total number of students. Henceforth, recall results of the proposed hybrid feature selection framework depicts, the worth of the selected features by proposed hybrid feature selection framework on pass class. In sum, recall gives the percentage that at which extend feature selected by the proposed approach framework can be affected on the performance of students. Tab. 4 presents recall results of proposed hybrid feature selection framework, existing feature selection framework, and FCBF, Information gain, CFS, feature selection algorithms on four benchmarking students’ datasets (having diversity in number of features, number of instances, and educational domains). Referring to Tab. 4, the results in Fig. 11 presents the comparison of recall of existing hybrid feature selection framework [39] with the proposed feature selection framework. The x-axis shows the results four datasets, and the y-axis shows the percentage value of precession on four datasets. It is clearly observed that the recall of proposed feature section on all selected datasets show better result than existing hybrid feature selection framework.

Figure 10: Comparing precision of proposed hybrid feature selection framework with CFS
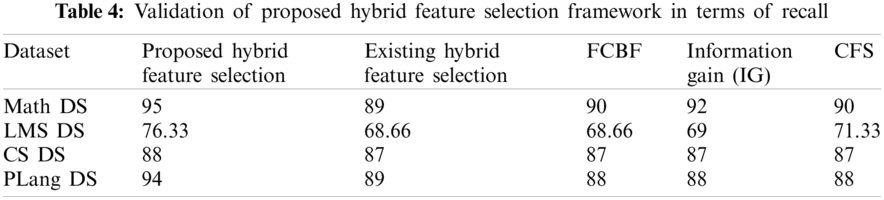

Figure 11: Comparing recall of proposed hybrid feature selection framework with existing hybrid feature selection framework
So that it is retrieved through the result that proposed feature selection perform better in terms of recall than existing feature selection framework. Fig. 12 shows the comparison of Recall of existing FCBF filter feature selection framework with proposed hybrid feature selection framework. The x-axis shows the results four datasets, and the y-axis shows the percentage values of precession by applying FCBF and proposed feature selection framework on four datasets. The results shown in Fig. 16 depicts that there is greater number of incorrectly classified students than correctly classified. Students for each class (pass, fail) by applying FCBF algorithm on Math, LMS, and PLang datasets. Whereas the results depict that there is a much smaller number of incorrectly classified students for each class on Math, LMS, and PLang datasets by applying proposed feature selection framework. The results also depict that FCBF and proposed feature selection framework show similar results on CS dataset. It means the rate of correctly classified students for a class over the total number of students in a class, the percentage is equally resulted by FCBF and proposed feature selection. However, it is also noticed that CS dataset contains a smaller number of features than other three datasets. Moreover, the recall So that it is retrieved through the result that proposed feature selection perform better in terms of recall than existing FCBF feature selection algorithm.

Figure 12: Comparing recall of proposed hybrid feature selection framework with FCBF feature selection
Fig. 13 shows the comparison of f-measure of existing CFS filter feature selection algorithm with proposed feature selection framework on all datasets. The red bar shows the proposed framework and blue bar shows the existing CFS filter feature selection algorithm in Fig. 13 (referring to results in Tab. 4). The x-axis shows the results four datasets, and the y-axis shows the percentage value of f-measure on four datasets. It is clearly observed that f-measure of proposed feature section on all datasets show a better result than existing CFS feature selection algorithm. So that it is retrieved through the result that proposed feature selection perform better in terms of f-measure than existing CFS filter feature selection algorithm.

Figure 13: Comparing recall of proposed hybrid feature selection framework CFS feature selection
4.4 F-Measure of Proposed Hybrid Feature Selection Framework Using Fusion
To evaluate the performance of the proposed hybrid feature selection framework, f-measure results of hybrid feature selection framework on four benchmark datasets are evaluated. F-measure is commonly used in EDM that gives a maximum value, in case, there is a balance between the values of precision and the recall evaluation measures [71]. F-measure is the harmonic mean of precision and recall. This measure also conveys the balance between precision and recall evaluation measures. The equation of obtaining f-measure is as follows through equation. In this section the f-measure results of the proposed hybrid feature selection framework are evaluated on four benchmarks students’ datasets, and these results are compared with the precision results of existing feature selection framework and feature selection algorithms (like FCB, Information Gain, CFS) on four benchmark students’ datasets, in order to validate the proposed hybrid feature selection framework.
Tab. 5 presents f-measure results of proposed hybrid feature selection framework, existing feature selection framework, and FCBF, Information gain, and CFS, feature selection algorithms on four benchmarking students’ datasets (having diversity in the number of features, number of instances, and educational domains). Fig. 14 shows the comparison of f-measure of existing hybrid feature selection framework with the proposed feature selection framework.

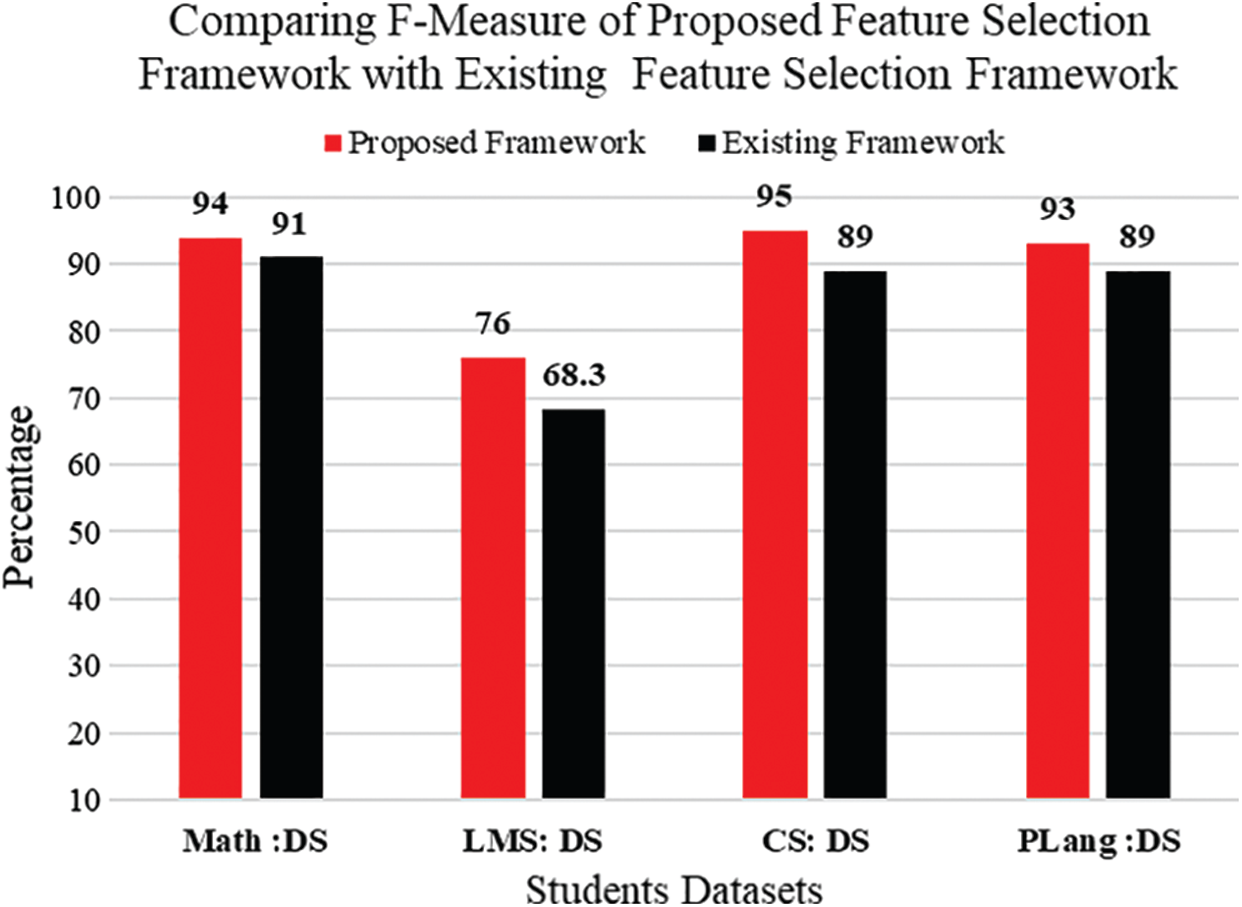
Figure 14: Comparing F-Measure of proposed hybrid feature selection framework with existing hybrid feature selection framework
The x-axis shows the results four datasets, and the y-axis shows the percentage value of f-measure on four datasets. It is clearly observed that the f-measure of proposed feature section on Math, LMS, CS, and PLang datasets show better result than existing hybrid feature selection framework. So that it is retrieved through the result that proposed feature selection perform better in terms of F-measure than existing feature selection framework. Fig. 15 shows the comparison of F-Measure of existing FCBF filter feature selection framework with the proposed feature selection framework. The x-axis shows the results four datasets, and the y-axis shows the percentage values of FCBF and proposed feature selection framework on four datasets. Fig. 15 depicts that the f-measure results of FCBF on seected datasets are less than the proposed feature selection framework. So that it is retrieved through the result that proposed feature selection perform better in terms of f-measure than FCBF feature selection algorithm. Fig. 16 shows the comparison of F-Measure of existing IG filter feature selection framework with the proposed feature selection framework. The x-axis shows the results four datasets, and the y-axis shows the percentage values of IG and proposed feature selection framework on four datasets.
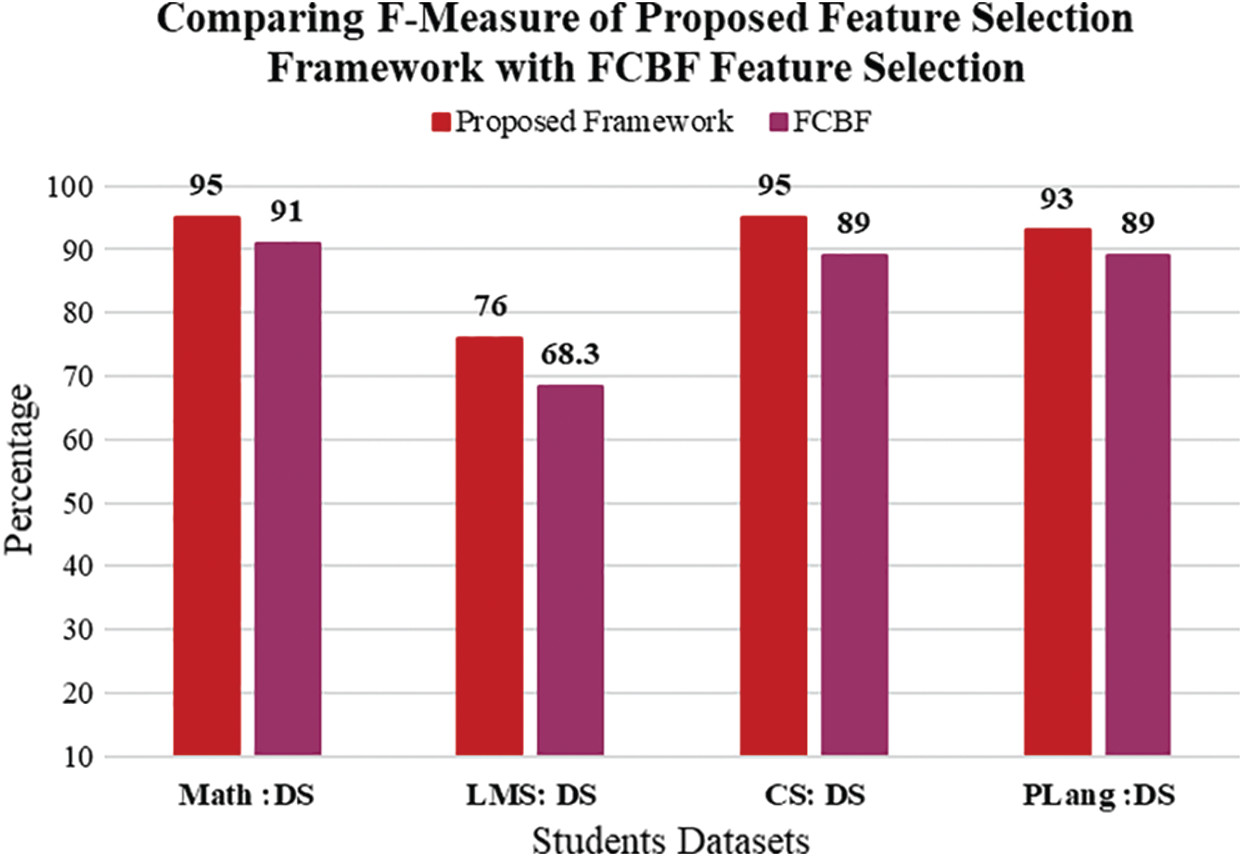
Figure 15: Comparing F-Measure of proposed hybrid feature selection framework with FCBF feature selection
Fig. 16 depicts that the F-measure results of IG on all datasets are less than the proposed feature selection framework. So that it is retrieved through the result that proposed feature selection perform better in terms of f-measure than IG feature selection algorithm. Fig. 17 shows the comparison of f-measure of existing CFS filter feature selection algorithm with proposed feature selection framework. The red bar shows the proposed framework and green line bar shows the existing CFS filter feature selection algorithm in Fig. 17. The x-axis shows the results four datasets, and the y-axis shows the percentage value of f-measure on four datasets. It is clearly observed that f-measure of proposed feature section on four benchmark datasets show better result than existing CFS feature selection algorithm. So that it is retrieved through the result that proposed feature selection perform better in terms of f-measure than existing CFS filter feature selection algorithm. Above mentioned results show that proposed hybrid feature selection framework performs better on four benchmark datasets with a varying number of feature and instances, as compared to other feature selection algorithm as well as existing hybrid feature selection in EDM. In sum, the results concluded that the proposed hybrid feature selection outperforms than other existing hybrid feature selection and existing feature selection algorithms. Hence the proposed hybrid feature selection framework is validated.

Figure 16: Comparing F-Measure of proposed hybrid feature selection framework with IG feature selection

Figure 17: Comparing F-Measure of proposed hybrid feature selection framework with CFS feature selection
This research identifies the suitable feature selection algorithms for identification of optimal features for predicting the performance of students. The proposed hybrid feature selection framework overcomes the issues identified in existing hybrid feature selection framework [39], as well as in other hybrid feature selection algorithms [31,33,73]. The proposed hybrid feature selection framework contributed to the body knowledge of EDM is such a way that it identifies the optimal features that are significant as well as associated with the target class. The two-level feature fusion added a novel contribution in state-of-the art of students’ performance prediction to obtain the optimal selection of features. The proposed hybrid feature selection framework not only identifies the optimal features but also perform better in terms of accuracy, precision, recall, and f-measure than the existing hybrid feature selection framework [39] for predicting the performance of students. Furthermore, the proposed hybrid features selection framework has the ability to perform better on a different number of features and instance. As the proposed hybrid feature selection framework is validated on benchmark datasets with the different number of features, and a different number of instances to show is robustness. Future Directions: In future hybridization of different filter and wrapper feature section will be considered for further accuracy approvement of students’ performance prediction model. In future other stakeholders of education like teachers will also be considered for prediction model.
Funding Statement: The authors received no specific funding for this study.
Conflicts of Interest: The authors declare that they have no conflicts of interest to report regarding the present study.
1. M. A. Al-Barrak and M. S. Al-Razgan, “Predicting students'performance through classification: A case study,” Journal of Theoretical & Applied Information Technology, vol. 75, no. 2, pp. 167–175, 2015. [Google Scholar]
2. A. A. Aziz, N. H. Ismail, F. Ahmad and H. Hassan, “A framework for students'academic performance analysis using naïve Bayes classifier,” Jurnal Teknologi (Sciences & Engineering), vol. 75, no. 3, pp. 13–19, 2015. [Google Scholar]
3. N. Buniyamin, U. bin Mat and P. M. Arshad, “Educational data mining for prediction and classification of engineering students achievement,” in Int. Conf. on Engineering Education, Japan, IEEE, pp. 49–53, 2015. [Google Scholar]
4. L. Ramanathan, S. Dhanda and S. Kumar, “Predicting students’ performance using modified ID3 algorithm,” International Journal of Engineering and Technology, vol. 5, no. 3, pp. 2491–2497, 2013. [Google Scholar]
5. C. Del Río and J. P. Insuasti, “Predicting academic performance in traditional environments at higher-education institutions using data mining: A review,” Ecos de la Academia, vol. 2, no. 4, pp. 185–201, 2016. [Google Scholar]
6. P. Thakar, “Performance analysis and prediction in educational data mining: A research travelogue,” International Journal of Computer Application, vol. 110, no. 15, pp. 975–8887, 2015. [Google Scholar]
7. M. Ramaswami and R. Bhaskaran, “A study on feature selection techniques in educational data mining,” Journal of Computing, vol. 1, no. 1, pp. 7–11, 2009. [Google Scholar]
8. T. Velmurugan and C. Anuradha, “Performance evaluation of feature selection algorithms in educational data mining,” Performance Evaluation, vol. 5, no. 2, pp. 131–139, 2016. [Google Scholar]
9. A. Abid, I. Kallel, I. J. Blanco and M. Benayed, “Selecting relevant educational attributes for predicting students’ academic performance,” in Int. Conf. on Intelligent Systems Design and Applications, Malaysia, Springer, vol. 736, pp. 650–660, 2017. [Google Scholar]
10. A. M. Shahiri, W. Husain and N. A. A. Rashid, “A proposed framework on hybrid feature selection techniques for handling high dimensional educational data,” AIP Conference Proceedings, Malaysia, AIP Publishing, vol. 1891, pp. 20130, 2017. [Google Scholar]
11. A. M. Shahiri and W. Husain, “A review on predicting student's performance using data mining techniques,” Procedia Computer Science, vol. 72, pp. 414–422, 2015. [Google Scholar]
12. K. Shaukat, S. Luo, V. Varadharajan, I. A. Hameed and M. Xu, “A survey on machine learning techniques for cyber security in the last decade,” IEEE Access, vol. 8, pp. 222310–222354, 2020. [Google Scholar]
13. S. K. Yadav and S. Pal, “Data mining application in enrollment management: A case study,” International Journal of Computer Applications, vol. 41, no. 5, pp. 1–6, 2012. [Google Scholar]
14. M. Chalaris, S. Gritzalis, M. Maragoudakis, C. Sgouropoulou and A. Tsolakidis, “Improving quality of educational processes providing new knowledge using data mining techniques,” Procedia-Social and Behavioral Sciences, vol. 147, pp. 390–397, 2014. [Google Scholar]
15. K. Shaukat, I. Nawaz, S. Aslam, S. Zaheer and U. Shaukat, In Student's Performance: A Data Mining Perspective, LAP Lambert Academic Publishing: Saarbrücken, Germany, 2017. [Google Scholar]
16. A. B. F. Mansur, N. Yusof and A. H. Basori, “Comprehensive analysis of student's academic failure classification through role-sphere influence and flow betwenness centrality,” Procedia Computer Science, vol. 116, pp. 509–515, 2017. [Google Scholar]
17. M. Doshi and S. K. Chaturvedi, “Survey of feature selection algorithms in higher education,” International Journal of Computer Applications in Engineering Sciences, vol. 4, no. 1, pp. 5, 2014. [Google Scholar]
18. H. M. Harb, A. A. Zaghrot, M. A. Gomaa and A. S. Desuky, “Selecting optimal subset of features for intrusion detection systems,” Advances in Computational Sciences and Technology, vol. 4, no. 2, pp. 179–192, 2011. [Google Scholar]
19. C. Romero, J. R. Romero and S. Ventura, “A survey on pre-processing educational data,” in Educational Data Mining, Cham: Springer, pp. 29–64, 2014. [Google Scholar]
20. K. Shaukat, F. Iqbal, T. M. Alam, G. K. Aujla, L. Devnath et al., “The impact of artificial intelligence and robotics on the future employment opportunities,” Trends in Computer Science and Information Technology, vol. 5, no. 1, pp. 50–54, 2020. [Google Scholar]
21. K. Shaukat, T. M. Alam, M. Ahmed, S. Luo, I. A. Hameed et al., “A model to enhance governance issues through opinion extraction,” in 2020 11th IEEE Annual Information Technology, Electronics and Mobile Communication Conf., Vancouver, IEEE, pp. 511–516, 2020. [Google Scholar]
22. K. Shaukat, T. M. Alam, I. A. Hameed, S. Lu0, G. Li et al., “A comprehensive dataset for bibliometric analysis of SARS and coronavirus impact on social sciences,” Data in Brief, vol. 33, pp. 106520, 2020. [Google Scholar]
23. U. Javed, K. Shaukat, I. A. Hameed, F. Iqbal, T. M. Alam et al., “A review of content-based and context-based recommendation systems,” International Journal of Emerging Technologies in Learning, vol. 16, no. 3, pp. 274–306, 2021. [Google Scholar]
24. E. Wright, Q. Hao, K. Rasheed and Y. Liu, “Feature selection of post-graduation income of college students in the United States,” in Int. Conf. on Social Computing, Behavioral-Cultural Modeling and Prediction and Behavior Representation in Modeling and Simulation, USA, Springer, pp. 38–45, 2018. [Google Scholar]
25. C. Anuradha and T. Velmurugan, “Feature selection techniques to analyse student acadamic performance using naïve Bayes classifier,” in the 3rd Int. Conf. on Small & Medium Business, Vietnam, pp. 345–350, 2016. [Google Scholar]
26. A. Mueen, B. Zafar and U. Manzoor, “Modeling and predicting students’ academic performance using data mining techniques,” International Journal of Modern Education and Computer Science, vol. 8, no. 11, pp. 36, 2016. [Google Scholar]
27. C.-H. Cheng and W.-X. Liu, “An appraisal model based on a synthetic feature selection approach for students’ academic achievement,” Symmetry, vol. 9, no. 11, pp. 282, 2017. [Google Scholar]
28. K. Shaukat, I. Nawaz, S. Aslam, S. Zaheer and U. Shaukat, “Student's performance in the context of data mining,” in 2016 19th Int. Multi-Topic Conf., Pakistan, IEEE, pp. 1–8, 2016. [Google Scholar]
29. D. Jain and V. Singh, “Feature selection and classification systems for chronic disease prediction: A review,” Egyptian Informatics Journal, vol. 19, no. 3, pp. 179–189, 2018. [Google Scholar]
30. J. Xie and C. Wang, “Using support vector machines with a novel hybrid feature selection method for diagnosis of erythemato-squamous diseases,” Expert Systems with Applications, vol. 38, no. 5, pp. 5809–5815, 2011. [Google Scholar]
31. H. W. Park, D. Li, Y. Piao and K. H. Ryu, “A hybrid feature selection method to classification and Its application in hypertension diagnosis,” in Int. Conf. on Information Technology in Bio-and Medical Informatics, France, Springer, pp. 11–19, 2017. [Google Scholar]
32. R. Habib and M. T. Afzal, “Sections-based bibliographic coupling for research paper recommendation,” Scientometrics, vol. 119, no. 2, pp. 643–656, 2019. [Google Scholar]
33. D. H. Mazumder and R. Veilumuthu, “Cancer classification with a novel hybrid feature selection technique,” International Journal of Simulation--Systems Science & Technology, vol. 19, no. 2, 2018. [Google Scholar]
34. K. Shaukat, S. Luo, V. Varadharajan, I. A. Hameed, S. Chen et al., “Performance comparison and current challenges of using machine learning techniques in cybersecurity,” Energies, vol. 13, no. 10, pp. 2509, 2020. [Google Scholar]
35. Y. Qiao, Y. Xiong, H. Gao, X. Zhu and P. Chen, “Protein-protein interface hot spots prediction based on a hybrid feature selection strategy,” BMC Bioinformatics, vol. 19, no. 1, pp. 14, 2018. [Google Scholar]
36. D. Wang, Z. Zhang, R. Bai and Y. Mao “A hybrid system with filter approach and multiple population genetic algorithm for feature selection in credit scoring,” Journal of Computational and Applied Mathematics, vol. 329, pp. 307–321, 2018. [Google Scholar]
37. T. M. Alam, K. Shaukat, I. A. Hameed, S. Luo, M. U. Sarwar et al., “An investigation of credit card default prediction in the imbalanced datasets,” IEEE Access, vol. 8, pp. 201173–201198, 2020. [Google Scholar]
38. M. Z. Latif, K. Shaukat, S. Luo, I. A. Hameed, F. Iqbal et al., Risk factors identification of malignant mesothelioma: A data mining based approach,” in 2020 Int. Conf. on Electrical, Communication, and Computer Engineering, Malaysia, IEEE, pp. 1–6, 2020. [Google Scholar]
39. A. M. Shahiri and W. Husain, “Handling high dimensional educational data using feature selection techniques,” Journal of Telecommunication, Electronic and Computer Engineering (JTEC), vol. 9, no. 2–12, pp. 89–93, 2017. [Google Scholar]
40. H. Lu and J. Yuan, “Student performance prediction model based on discriminative feature selection,” International Journal of Emerging Technologies in Learning, vol. 13, no. 10, pp. 55–68, 2018. [Google Scholar]
41. W. Punlumjeak, N. Rachburee and J. Arunrerk, “Big data analytics: Student performance prediction using feature selection and machine learning on microsoft azure platform,” Electronic and Computer Engineering, vol. 9, no. 1–4, pp. 113–117, 2017. [Google Scholar]
42. J. Shana and T. Venkatachalam, “Identifying Key performance indicators and predicting the result from student data,” Int. J. Comput. Appl, vol. 25, no. 9, pp. 45–48, 2011. [Google Scholar]
43. X. Ma and Z. Zhou, “Student pass rates prediction using optimized support vector machine and decision tree,” in Computing and Communication Workshop and Conf., 2018 IEEE 8th Annual, USA, IEEE, pp. 209–215, 2018. [Google Scholar]
44. B. Xue, M. Zhang, W. N. Browne and X. Yao, “A survey on evolutionary computation approaches to feature selection,” IEEE Transactions on Evolutionary Computation, vol. 20, no. 4, pp. 606–626, 2016. [Google Scholar]
45. R. Zhang, F. Nie, X. Li and X. Wei, “Feature selection with multi-view data: A survey,” Information Fusion, vol. 50, pp. 158–167, 2018. [Google Scholar]
46. Z. Guo, H. Wang, Q. Liu and J. Yang, “A feature fusion based forecasting model for financial time series,” PLOS One, vol. 9, no. 6, pp. e101113, 2014. [Google Scholar]
47. J. Yang, J. Y. Yang, D. Zhang and J. F. Lu, “Feature fusion: Parallel strategy vs. serial strategy,” Pattern Recognition, vol. 36, no. 6, pp. 1369–1381, 2003. [Google Scholar]
48. C. G. Snoek, M. Worring and A. W. Smeulders, “Early versus late fusion in semantic video analysis,” in Proc. of the 13th Annual ACM Int. Conf. on Multimedia, Singapore, ACM, pp. 399–402, 2005. [Google Scholar]
49. S. I. Dimitriadis, D. Liparas and M. N. Tsolaki, “Random forest feature selection, fusion and ensemble strategy: Combining multiple morphological MRI measures to discriminate among healthy elderly, MCI, cMCI and Alzheimer's disease patients: From the Alzheimer's disease neuroimaging initiative (ADNI) database,” Journal of Neuroscience Methods, vol. 302, pp. 14–23, 2017. [Google Scholar]
50. O. Maimon and L. Rokach, Data Mining and Knowledge Discovery Handbook, Berlin, Germany: Springer, 2010. [Google Scholar]
51. P. Ambardekar, A. Jamthe and M. Chincholkar, “Predicting defect resolution time using cosine similarity,” in Int. Conf. on Data and Software Engineering, Indonesia, IEEE, pp. 1–6, 2017. [Google Scholar]
52. M. Alewiwi, C. Orencik and E. Savaş, “Efficient top-k similarity document search utilizing distributed file systems and cosine similarity,” Cluster Computing, vol. 19, no. 1, pp. 109–126, 2016. [Google Scholar]
53. W. L. Xiang, Y. Z. Li, R. C. He, M. X. Gao and M. An, “A novel artificial bee colony algorithm based on the cosine similarity,” Computers & Industrial Engineering, vol. 115, pp. 54–68, 2018. [Google Scholar]
54. Q. Yu, S. J. Jiang, R. C. Wang and H. Y. Wang, “A feature selection approach based on a similarity measure for software defect prediction,” Frontiers of Information Technology & Electronic Engineering, vol. 18, no. 11, pp. 1744–1753, 2017. [Google Scholar]
55. H. V. Nguyen and L. Bai, “Cosine similarity metric learning for face verification,” in Asian Conf. on Computer Vision, New Zealand, Springer, pp. 709–720, 2010. [Google Scholar]
56. A. Karima, E. Zakaria and T. G. Yamina, “Arabic text categorization: A comparative study of different representation modes,” Journal of Theoretical and Applied Information Technology, vol. 38, no. 1, pp. 1–5, 2012. [Google Scholar]
57. Y. Kawada, “Cosine similarity and the Borda Rule,” Social Choice and Welfare, vol. 51, no. 1, pp. 1–11, 2018. [Google Scholar]
58. V. K. Dubey and A. K. Saxena, “A cosine-similarity mutual-information approach for feature selection on high dimensional datasets,” Journal of Information Technology Research, vol. 10, no. 1, pp. 15–28, 2017. [Google Scholar]
59. S. Bakheet, “An svm framework for malignant melanoma detection based on optimized hog features,” Computation, vol. 5, no. 1, pp. 4, 2017. [Google Scholar]
60. D. Ifenthaler and C. Widanapathirana, “Development and validation of a learning analytics framework: Two case studies using support vector machines,” Technology Knowledge and Learning, vol. 19, no. 1–2, pp. 221–240, 2014. [Google Scholar]
61. L. Yu, C. W. Lee, H. I. Pan, C. Y. Chou, P. Y. Chao et al., “Improving early prediction of academic failure using sentiment analysis on self-evaluated comments,” Journal of Computer Assisted Learning, vol. 34, no. 4,. pp. 358–365, 2018. [Google Scholar]
62. D. Wilk-Kolodziejczyk, K. Regulski and G. Gumienny, “Comparative analysis of the properties of the nodular cast iron with carbides and the austempered ductile iron with use of the machine learning and the support vector machine,” The International Journal of Advanced Manufacturing Technology, vol. 87, no. 1–4, pp. 1077–1093, 2016. [Google Scholar]
63. M. Achirul Nanda, K. Boro Seminar, D. Nandika and A. J. I. Maddu, “A comparison study of kernel functions in the support vector machine and its application for termite detection,” Information, vol. 9, no. 1, pp. 5, 2018. [Google Scholar]
64. Y. Saeys, T. Abeel and Y. Van de Peer, “Robust feature selection using ensemble feature selection techniques,” in Joint European Conf. on Machine Learning and Knowledge Discovery in Databases, Belgium, Springer, pp. 313–325, 2008. [Google Scholar]
65. G. Kostopoulos, S. Kotsiantis, C. Pierrakeas, G. Koutsonikos and G. A. Gravvanis, “Forecasting students’ success in an open university,” International Journal of Learning Technology, vol. 13, no. 1, pp. 26–43, 2018. [Google Scholar]
66. E. Sugiyarti, K. A. Jasmi, B. Basiron, M. Huda, K.Shankar et al., “Decision support system of scholarship grantee selection using data mining,” International Journal of Pure and Applied Mathematics, vol. 119, no. 15, pp. 2239–2249, 2018. [Google Scholar]
67. S. Rana and R. Garg, “Student's performance evaluation of an institute using various classification algorithms,” in Information and Communication Technology for Sustainable Development, Springer, vol. 7, no. 5, pp. 229–238, 2018. [Google Scholar]
68. T. Chakraborty, S. Chattopadhyay and A. K. Chakraborty, “A novel hybridization of classification trees and artificial neural networks for selection of students in a business school,” OPSEARCH, vol. 55, no. 2, pp. 434–446, 2018. [Google Scholar]
69. F. Bagherzadeh-Khiabani, A. Ramezankhani, F. Azizi, F. Hadaegh, E. W. Steyerberg et al., “A tutorial on variable selection for clinical prediction models: Feature selection methods in data mining could improve the results,” Journal of Clinical Epidemiology, vol. 71, pp. 76–85, 2016. [Google Scholar]
70. L. Yu and H. Liu, “Feature selection for high-dimensional data: a fast correlation-based filter solution,” in Proc. of the 20th Int. Conf. on Machine Learning, Washington D.C, pp. 856–863, 2003. [Google Scholar]
71. M. Aman, A. bin Md Said, S. J. A. Kadir and I. J. I. Ullah, “Key concept identification: A comprehensive analysis of frequency and topical graph-based approaches,” Information, vol. 9, no. 5, pp. 128, 2018. [Google Scholar]
72. S. A. Kumar and M. Vijayalakshmi, “Efficiency of multi-instance learning in educational data mining,” in Knowledge Computing and its Applications, Berlin, Germany: Springer, pp. 47–64, 2018. [Google Scholar]
73. J. Xie and C. Wang, “Using support vector machines with a novel hybrid feature selection method for diagnosis of erythemato-squamous diseases,” Expert Systems with Applications, vol. 38, no. 5, pp. 5809–5815, 2011. [Google Scholar]
 | This work is licensed under a Creative Commons Attribution 4.0 International License, which permits unrestricted use, distribution, and reproduction in any medium, provided the original work is properly cited. |