DOI:10.32604/cmc.2022.017114
| Computers, Materials & Continua DOI:10.32604/cmc.2022.017114 | |
| Article |
A New Fuzzy Adaptive Algorithm to Classify Imbalanced Data
1School of Information Technology & Engineering, Vellore Institute of Technology, Vellore, 632014, India
2Technical University of Cluj Napoca, Faculty of Automation and Computer Science, Cluj Napoca, 400114, Romania
*Corresponding Author: Dharmendra Singh Rajput. Email: dharmendrasingh@vit.ac.in
Received: 21 January 2021; Accepted: 30 April 2021
Abstract: Classification of imbalanced data is a well explored issue in the data mining and machine learning community where one class representation is overwhelmed by other classes. The Imbalanced distribution of data is a natural occurrence in real world datasets, so needed to be dealt with carefully to get important insights. In case of imbalance in data sets, traditional classifiers have to sacrifice their performances, therefore lead to misclassifications. This paper suggests a weighted nearest neighbor approach in a fuzzy manner to deal with this issue. We have adapted the ‘existing algorithm modification solution’ to learn from imbalanced datasets that classify data without manipulating the natural distribution of data unlike the other popular data balancing methods. The K nearest neighbor is a non-parametric classification method that is mostly used in machine learning problems. Fuzzy classification with the nearest neighbor clears the belonging of an instance to classes and optimal weights with improved nearest neighbor concept helping to correctly classify imbalanced data. The proposed hybrid approach takes care of imbalance nature of data and reduces the inaccuracies appear in applications of original and traditional classifiers. Results show that it performs well over the existing fuzzy nearest neighbor and weighted neighbor strategies for imbalanced learning.
Keywords: Machine learning; fuzzy classification; nearest neighbor; adaptive approach; optimal weights
The last few decades have borne witness to various developments in science and technology. These developments have empowered the generation of enormous amounts of data and opportunities for mining useful information from this data and other activities of data science. It can already be seen applied in various applications of data mining [1,2]. In such data mining applications many challenges occur at different levels. Classification of imbalanced data is one of the important and frequently occurring challenges of data mining. In general, imbalance refers to the unequal distribution of data into classes where a large number of data instances belong to one class while a small number of examples represent other classes, known as majority and minority classes. Resultantly, the classifier's accuracy will be biased towards the majority class and minority class instances will be misclassified. This is happening because traditional classifiers are considering the balanced distribution of data in general. Various types of imbalance are ‘between class imbalance,’ ‘intrinsic/extrinsic,’ ‘relative,’ ‘absolute rarity’ and ‘within class imbalance’ etc. [3–5]. Classification of imbalanced data is considered as one of the top ten challenging issues of data mining [6] and researchers include it in new and frequently explored trends of data mining [7,8]. It can become very hazardous as an imbalance in data appears in many real world applications such as Medical Diagnosis [9,10], Oil-spill Detection [11], Credit Card Fraud Detection [12], Culture Modeling [13], Network Intrusion, Text Categorization, Helicopter Gearbox Fault Monitoring, remote sense classification for land mine detection [14] etc. These are some examples that show the need for special treatment being required for datasets with imbalance.
Four known ways to deal with imbalance are (i) balancing datasets by resampling techniques, (ii) modification in tradition classification algorithms, (iii) cost-sensitive techniques and (iv) ensemble approaches. In this paper we focus on the second approach, of modifying the traditional classifier. We proposed an improved nearest neighbor approach to learn from imbalanced data with fuzzy logic.
The nearest neighbor classifier is a significant instance-based learning approach where prior information about data is not available and the sample size is insufficient to represent. The classifier is not prepared in advance for the nearest neighbor and the class label is assigned on the basis of the higher number of the nearest neighbors of the test data. It is one of the best known and most important algorithms of data mining [15]. K-nearest neighbor is characterized by its simplicity, programmability, comprehensibility, and robustness. Its error rate is bounded above by twice the Bayes error rate [16,17]. Its improved versions and weighted variants are proposed to solve different issues such as but not limited to, imbalanced data. Alliance with fuzzy further improved the performance of nearest neighbor and with weights deals some more issues. Fuzzy logic, unlike crisp concept in classification, looks for memberships of data instances into classes instead of their complete belonging. Though fuzzy logic provides complementary solutions that are not competitive with crisp, it helps in obtaining a better classification. Fuzzy K nearest neighbor and weighted nearest neighbors may deal with imbalance when they are specifically designed for such cases. In the past many fuzzy rule-based algorithms and other combinations with nearest neighbor algorithms have been proposed to tackle the imbalance issue. Optimally weighted fuzzy nearest neighbor is the most trusted due to its low bias, its weighing is kriging based, which is also known as the best linear estimator [18].
• This paper adopts an algorithm modification strategy for learning.
• Optimal weights and adaptive approach [19] are merged with fuzzy nearest neighbor [20] and it results in better classification performance for imbalanced data.
• This research work is an advanced version of [21] with detailed experimental studies and assessment of significance.
The paper is organized as follows: Section 2 contains a related literature review for the proposed algorithm. Section 3 offers brief details of basic techniques for our work. Section 4 describes the steps of the proposed methodology of improved fuzzy weighted nearest neighbor approach for imbalanced data. Section 5 discusses the way in which our algorithm works. Experiments and results are being discussed in Section 6 followed by significance testing in Section 7. The conclusion of the work and future possibilities marked as ‘conclusions’ and kept in Section 8.
This section discusses relevant modified nearest neighbor approaches to deal with imbalanced data. To evaluate the performances of classifiers for different degrees of class imbalance, Prati et al. [22] designed an experimental setup. Also, a confidence interval-based procedure was proposed to examine the performance statistics of classifiers in this setup. It was discovered that misclassification is proportional to the degree of imbalance, i.e., higher imbalance results in higher loss and vice versa; existing solutions are partially dealing with the issue. López et al. [23] have performed two fold studies on imbalanced learning. In the first one they are examining the pre-processing with data balancing techniques, cost sensitive and ensemble techniques on the experimental background. In the second fold of the study authors have discussed the significance of inherent data characteristics, such as size or density of the sample, the possibility of classes overlapping, presence of noise etc.
A good number of crisp and fuzzy nearest neighbor approaches have been proposed to improve the classification of imbalanced data. Kriminger et al. [24] proposed a single class algorithm entitled Class Conditional Nearest Neighbor Distribution (CCNND) to minimize the consequences of imbalance by applying a local geometric structure in data. Tomašev et al. [25], considers that the high misclassification rate is due to minority class examples. The classification is different with low and medium dimensional datasets where majority class examples are responsible for misclassification. An Instance Hybrid Selection using Nearest Neighbor (HISNN) is proposed by Ryu et al. [26] for Cross-Project Defect Prediction (CPDP). In such cases, the class imbalance is presented in distributions of source and target projects. In this approach, the K-nearest neighbor algorithm is used to learn local information, while global information is learned by naive Bayes. This hybrid approach is yielding high performance in software defect prediction.
Some notable contribution with weighing strategy is given by the community. Dubey et al. proposed a modified class-based weighted nearest neighbor algorithm for imbalanced data. Weights are calculated on the basis of the distribution of nearest neighbors of test instances for the traditional k-nearest neighbor approach [27]. A hybrid neighbor weighted approach is proposed by Patel et al. [28] to improve imbalance learning using the nearest neighbor policy; large and small weights for small and large classes are improved with different values of K for different classes, according to their sizes. Ando [29] proposed another class-wise weighted nearest neighbor classification model in which convex optimization technique was used to learn weights with a powerful mathematical model to maximize nonlinear performance measure for training data. An improved weighted nearest neighbor approach with class confidence weights was proposed by Liu et al. [30]. This approach takes attribute probabilities to weight prototypes and to get posterior probabilities. Class confidence weights were calculated using Mixture Modelling and Bayesian Networks.
Not a lot of work has been done on fuzzy K-nearest neighbor approaches for imbalanced data. A fuzzy-rough ordered weighted average nearest neighbor approach is proposed by Ramentol et al. [31] for binary class imbalance using six weight vectors. They also proposed indiscernibility relations in combination with these weight vectors. Fernández et al. [32] have performed analysis on fuzzy rule based classification systems for imbalanced data sets. Adaptive parametric conjunction operators are applied for better classification results for varying imbalanced ratios. Han et al. [33] proposed fuzzy and rough properties based nearest neighbors approach that minimizes the majority class generated bias. They also defined a membership function to provide advantages to minority class examples. A coupled fuzzy K-nearest neighbor approach for categorical data is proposed by Liu et al. [34] where data instances are unequally distributed and retain bonds among attributes, classes and other instances. Assignment of sized membership, similarity calculation and integration are the key functions of this approach. Patel et al. [35] have proposed a fuzzy nearest neighbor method in an adaptive way to deal with class imbalance issue with varying K values proportional to the size of the classes; this fuzzy-adaptive K concept is dealing well against the bias of the traditional nearest neighbor classifier.
The fundamentals of the K-nearest neighbor algorithm, fuzzy K-nearest neighbor algorithm, adaptive approach and optimally weighted fuzzy KNN are provided in this section. These details make our proposed approach easy to learn. We consider default Euclidian distance as the distance measure to find nearest neighbors of data instances. The following subsections explain the details of all these approaches with their mathematical formulation.
3.1 K-Nearest Neighbor Algorithm
We know that for the K nearest neighbor algorithm training set is kept until the classification process is completed and no classifier is prepared in advance. Consider any query instance of q, given the class label of the q algorithm to find the K nearest neighbors of q from the training set where K is any integer value. The concept of KNN says that the class label would be assigned to the query instance from which it will have more nearest neighbors. The mathematical assumption of KNN could be understood with the following equation:
3.2 Fuzzy K-Nearest Neighbor Algorithm
Unlike their crisp counterparts the fuzzy the K-nearest neighbor algorithm finds memberships of data instances into classes instead of looking for complete belonging. It is encouraging to priorly known that for unlabeled query instance that its neighbors belong to a class of more accurate classification.
Equations are given by Keller et al. (1985) for fuzzy memberships of training instances into classes
And for memberships of test instance q
where p is an integer and p > 1
And qi nearest neighbour of q, (i = 1,..., K)
Baoli et al. (2004) proposed an adaptive method for imbalanced text data categorization with the concept of different K for different classes i.e., large K for large classes and small K for small classes. They suggested a way to calculate the value of K (it will be called
3.4 Optimally Weighted Fuzzy K-Nearest Neighbor Algorithm
Optimally Weighted Fuzzy K-Nearest Neighbor Algorithm is given by Pham. These optimal weights are based on the kriging concept. In this approach, the K nearest neighbor is first found for query instance q traditionally and then the calculation of optimal weights is done to find membership of q shown by the following equation:
Now fuzzy membership is assigned to q for class Ci with
This method may result in negative weights that could be converted to positive values by the following given formula:
The proposed algorithm unites the properties of fuzzy nearest neighbor classification, optimal weights, and adaptive approach to classify imbalanced data. The fuzzy nearest neighbor finds out memberships of test instants into classes instead of their complete belonging in one class. These memberships strengthened by optimal weights. The adaptive approach finds different K for different classes with respect to their sizes which, leads to reduce misclassification of imbalanced data.
Proposed Algorithm:
Step 1. Find
Step 2. Find memberships of training data into each class using
Step 3. For test instance u, find a set of nearest neighbors X for any K
Where X= (x1, x2,…, xn), for K= n (some integer)
Step 4. Get covariance matrix Cu between nearest neighbors of u
Step 5. Get covariance matrix Cux between u and its nearest neighbors
Step 6. Calculate weight matrix using
Step 7. Normalize negative weights to positive
Step 8. Find membership of test instance u using
Step 9. Assign class label to test instance u by
The first step of the proposed algorithm is to find out the values of K in terms of
To judge the performance, experimental analysis is done between our proposed method weighted fuzzy K nearest neighbor algorithm using adaptive approach (WFAKNN), neighbor weighted K nearest neighbor (NWKNN) [36], hybrid weighted nearest neighbor approach (Adpt-NWKNN), and fuzzy neighbor weighted approach (Fuzzy-NWKNN) [37]. All these algorithms are taken from a similar background of weights and fuzzy aggregation. Eight datasets with different imbalance ratios are taken from UCI [38] and KEEL [39] repositories for binary classification with full feature space. All experiments took place in MATLAB platform.
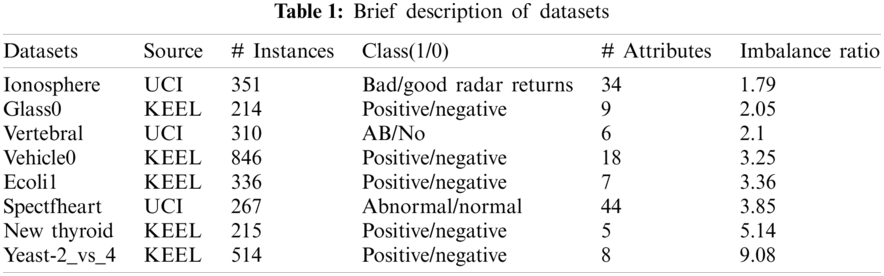
All the eight numerical datasets are taken from UCI and KEEL repositories to judge the performance of the proposed algorithm with different imbalance ratios.
Ionosphere: This is radar signals data taken from the UCI repository, it is a collection of 351 instances for 34 attributes and a class attribute. It is a binary class dataset; classes are ‘Good’ and ‘Bad.’ ‘Good’ class instances are radar's returned signals representing the state of free electrons resulting in any possible structure in the ionosphere while ‘Bad’ signals are passing through the layers directly. The ‘Good’ class is the majority class with 225 instances while the ‘Bad’ class is representing minority instances, totalling 126. The imbalance ratio between the minority and the majority classes is 1.79.
Glass0: Originally Glass Identification dataset with 214 instances and 9 attributes was used for the identification of the glass used in a crime. These are seven sources, originally representing the seven classes. KEEL repository is providing pre-processed versions of this dataset for a better understanding of imbalanced classification. Glass0 is one binary class version of such a concept taken from all the 214 instances with two classes ‘Negative’ and ‘Positive’. The ‘Negative’ is representing the majority class with 144 instances and the ‘Positive’ class is having 70 minority instances. The imbalance ratio for these two classes is 2.05.
Vertebral: Vertebral data set is taken from the UCI repository, it is an orthopaedic dataset of 310 instances, 100 of which are normal and 210 are abnormally categorized, hence ‘Normal’ is minority class and ‘Abnormal’ is majority class. Vertebral is having 6 attributes, and the dataset is showing an imbalance ratio value of 2.1.
Vehicle0: This pre-processed dataset has been taken from the KEEL repository, having 846 instances, 18 attributes, two classes i.e., ‘Positive’ and ‘Negative’ and 3.25 as the imbalance ratio. The dataset was originally featured for the identification of 3D objects from 2D images and having four classes of vehicles, converted into two class data for learning.
Ecoli1: The Ecoli1 is also a specific imbalance representing pre-processed dataset taken from the KEEL repository with 336 instances and an imbalance ratio of 3.36. Ecoli is a type of bacteria that resides in human or animal's intestine and generally doesn't do harm. However, in some cases it may cause diarrhea and other abdominal problems. This dataset is having 7 biological attributes and a class attribute. Ecoli1 is considered a binary class dataset, i.e., minority class ‘Positive’ with 77 instances and majority class ‘Negative’ with 259 instances.
Spectfheart: It is a binary dataset having 267 instances for 44 attributes representing cardiac Single Proton Emission Computed Tomography (SPECT) images. 267 patients are categorized into two classes; normal (0) and abnormal (1). 55 normal and 212 abnormal images are representing the minority and majority classes respectively and the imbalance ratio is 3.85. The dataset is taken from the UCI repository.
New Thyroid: This is a data set of 215 instances for 5 attributes that have been taken from the KEEL repository where 35 ‘Positive’ instances are representing the hyperthyroidism as a minority class and 180 ‘Negative’ representing the remaining others have been considered the majority class instances. The imbalance ratio of majority and minority classes is 5.14.
Yeast-2_vs._4: This imbalanced version of the Yeast dataset has been taken from the KEEL repository, having 514 instances for 8 attributes and the classification task is intended for two classes ‘Positive’ and ‘Negative’. ‘Positive’ is the minority class with 51 instances whereas ‘Negative’ is the majority class with 463 instances. The imbalance ratio is 9.08. The classification's task is to localize protein in yeast bacteria.
A short description of data sets is given in Tab. 1.
Accuracy is a popular traditional evaluation measure for classification, but seems insufficient for imbalanced datasets. Though it gives overall good results or accuracy, this accuracy takes place due to the majority class instances which are higher in quantity, neglecting the minority classes not taking into consideration that many times the minority classes are of more interest. Needing to comply with the special treatment of imbalanced datasets, specific measures are also required for evaluation. Many performance evaluation measures have been proposed and performing well on imbalanced data, that consider data distribution with specific metrics, some of them are F-measure, G-mean and AUC, have been evaluated in this paper as well. The confusion metric used to evaluate the classifier for binary data presented in Tab. 2.
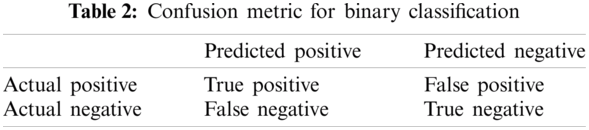
True positive (TP) represents the actual positive instances that are classified correctly as positive whereas false positive (FP) represents actual positives incorrectly classified as negative. Similarly true negatives (TN) are actual negative instances, while also correctly classified as negatives and false negatives (FN) are actual negative instances and incorrectly classified as positive. These measures are properly explained in [3]. Performance evaluation measures in terms of these metrics are given below in Tab. 3:
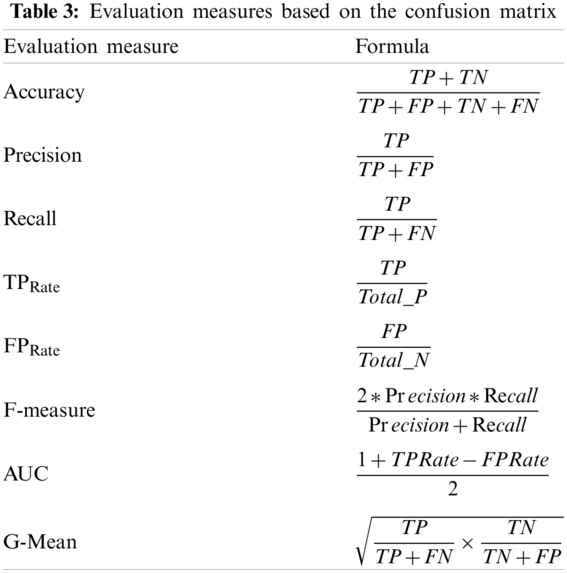
We are using F-Measure because it is a more comprehensive metric than accuracy as it comprises the weighted ratio of precision and recall and is sensitive towards data distribution as well. G-Mean is concerned to evaluate the degree of bias in unevenly distributed data. AUC or area under the ROC curve is again a very sensitive measure to work with such binary data points to aggregate the classifier's performance over all possible threshold values.
To evaluate the performance of the proposed methodology we took three evaluation measures F-Measure, AUC and G-Mean. Tab. 4 contains the results drawn on F-Measure, AUC and G-Mean of NWKNN, Adpt-NWKNN, Fuzzy-NWKNN and WFAKNN on all eight datasets for five values of K; 5 to 25. Most of the result shows the better performance of WFAKNN over other three approaches.
Graphical representation for the comparison on the performance of Fuzzy KNN and Weighted Fuzzy Adaptive KNN (WFAKNN) is given in Figs. 1–3 for F-measure, AUC and G-mean for average values of K. These figures show improvements in WFAKNN over Fuzzy KNN for all these measures. This also shows that performance improvement is generalized with different degrees of imbalance for different datasets.
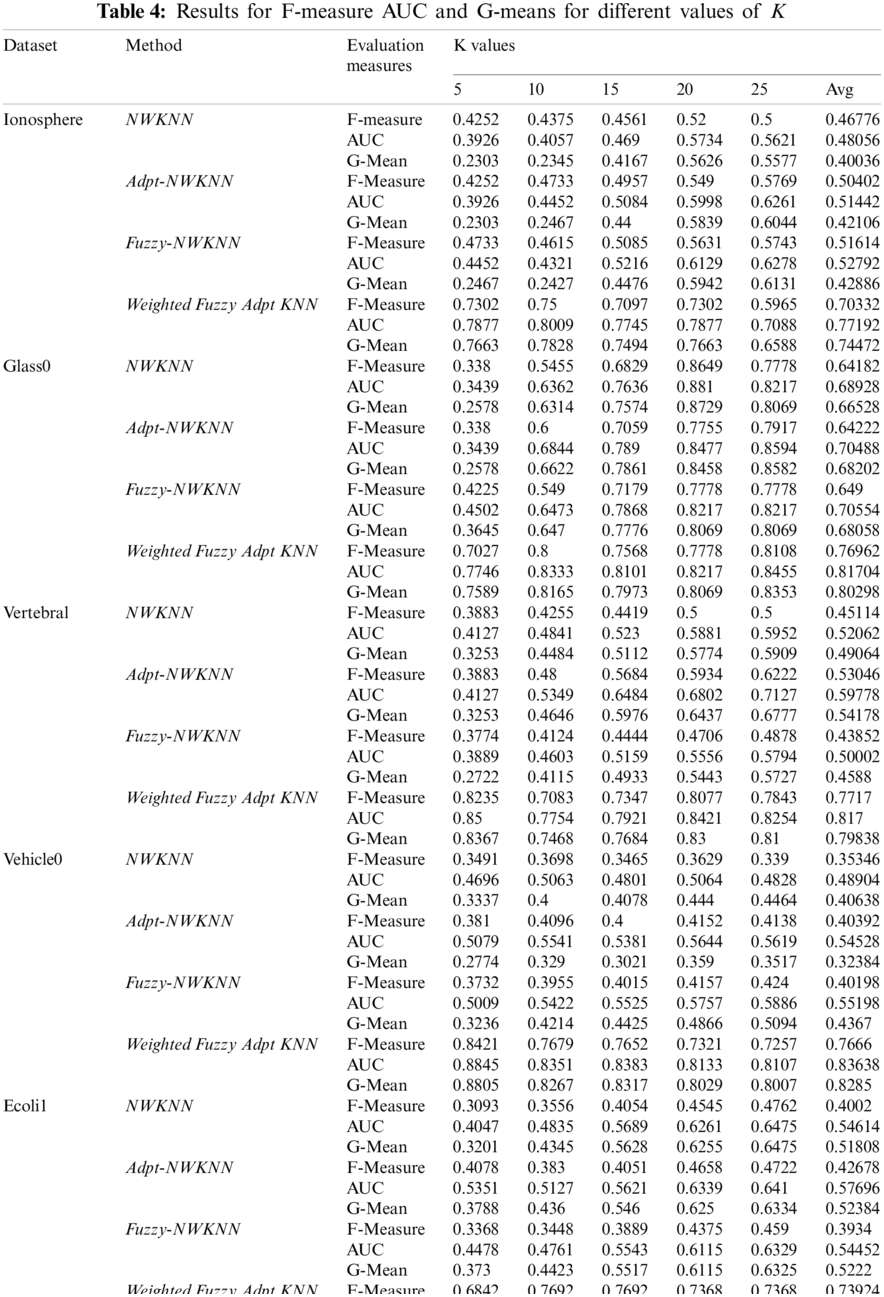
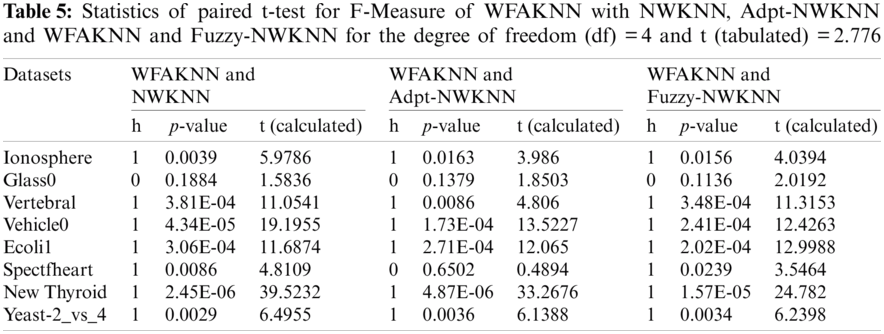
Here t-test [40,41] is applied to find the significant statistical difference between the proposed and existing approaches being used in this work for comparison. This null hypothesis shown by H0 implies that there is no significant difference between the existing algorithm and the proposed algorithm. We performed the t-test in MATLAB for significance level 0.05, where statistics are ‘h’, ‘p’ and ‘t’. If the t-test returns the value h = 0, the null hypothesis is accepted and if h = 1, it rejects the null hypothesis, which implies that there exists a significant difference between our proposed algorithm and the existing one. This could be proven with a smaller p value rather than using the significance level of 0.05 and higher value of t (calculated), rather than the value of t (tabulated). In our experiment section we have taken five different values for integer K to evaluate the performance measures F-Measure, AUC and G-Mean. Hence for the degree of freedom = 4 (degree of freedom (df)=observation-1 so for K = 5; df = 4) comparative t-test results for F-Measure on eight datasets are given in Tab. 5. We can observe that except Glass0 all datasets are significantly performing better for WFAKNN rather than other algorithms. Also for Glass0 all evaluation measures are showing better results for both different values of K and their average value (Tab. 4).
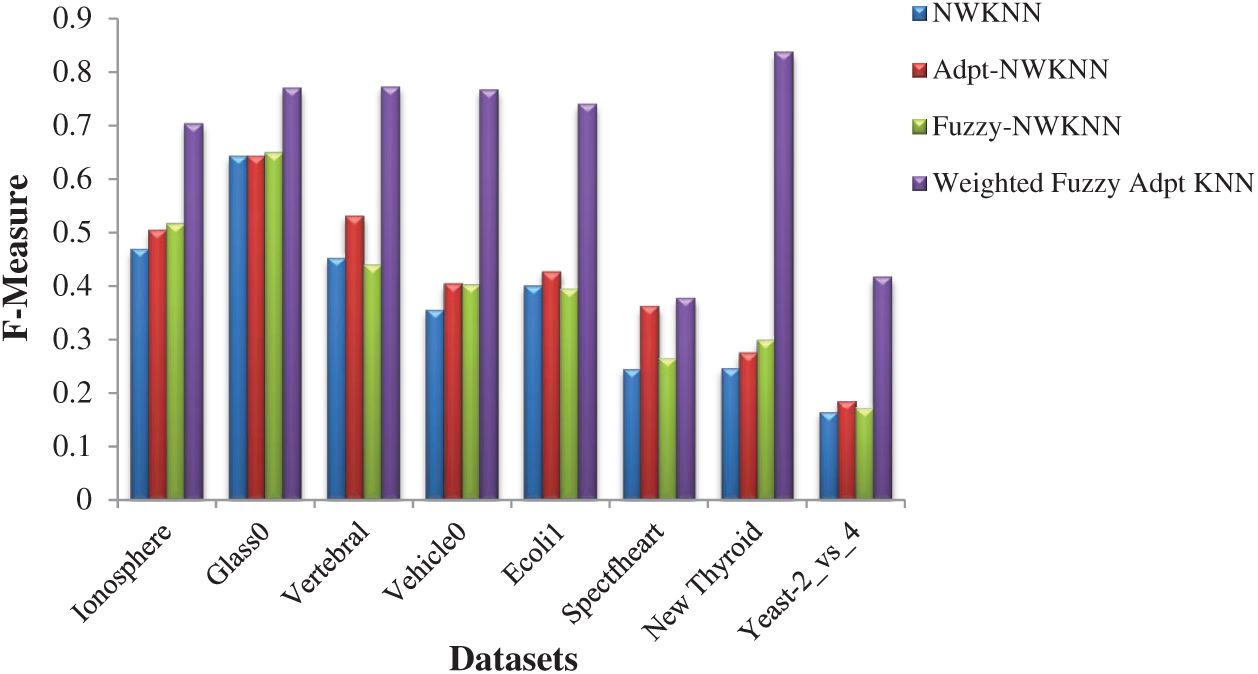
Figure 1: F-Measure performances of NWKNN, Adpt-NWKNN, Fuzzy-NWKNN and Weighted Fuzzy Adpt KNN
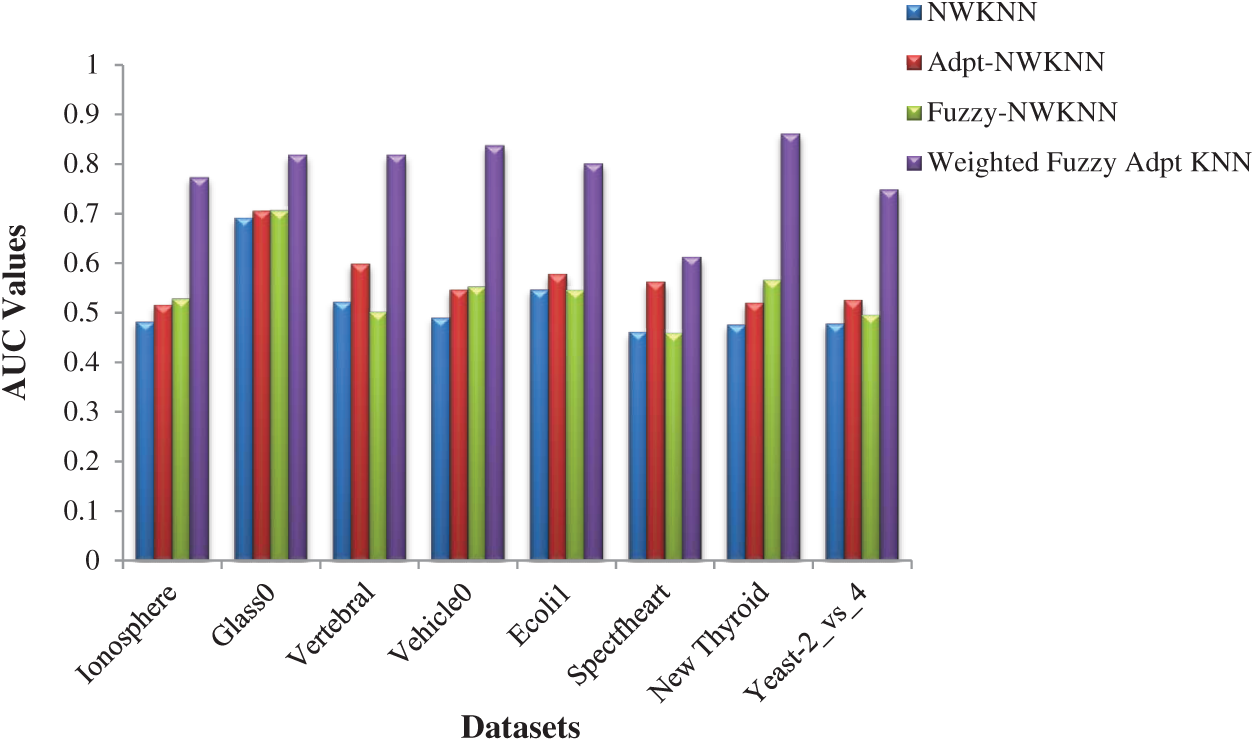
Figure 2: AUC performances of NWKNN, Adpt-NWKNN, Fuzzy-NWKNN and Weighted Fuzzy Adpt KNN
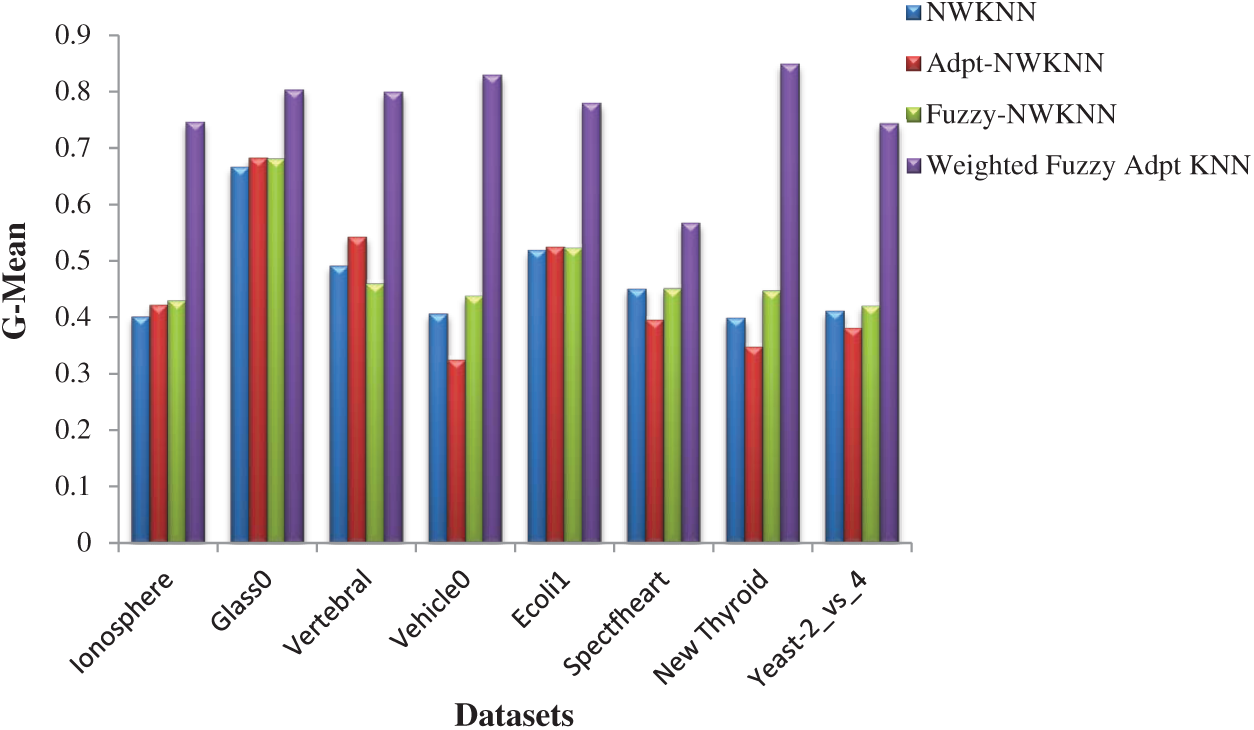
Figure 3: G-Mean performances of NWKNN, Adpt-NWKNN, Fuzzy-NWKNN and Weighted Fuzzy Adpt KNN
In this paper we have proposed a modified weighted fuzzy adaptive nearest neighbor algorithm (WFAKNN) to classify imbalanced data using optimal weights. The fuzzy nearest neighbor approach becomes more impactful while applying weights and then incorporating the adaptive approach to be applied on imbalanced data. One can observe clearly in the results section that for the given evaluation measures the proposed method is performing better than other weighted and/or fuzzy nearest neighbor algorithms. Though the experiments are limited with binary data sets in this paper; they could also be done with multi-class data sets in the future. Moreover, feature selection could be applied to improve the performance. This approach can be applied to recent machine learning studies on the healthcare sector or where using IoT generated data too, because both of them are very sensitive to the accuracy of the classifier and negligence of data distribution can affect it a lot. Some of the possible studies can be extended with the consideration of data imbalance and application of WFAKNN are [42–45] and definitely not limited to.
Funding Statement: The authors received no specific funding for this study.
Conflicts of Interest: The authors declare that they have no conflicts of interest to report regarding the present study.
1. J. Han, J. Pei and M. Kamber, Data Mining: Concepts and Techniques, Waltham, USA: Elsevier, 2011. [Google Scholar]
2. H. Patel and D. S. Rajput, “Data mining applications in present scenario: A review,” International Journal of Soft Computing, vol. 6, no. 4, pp. 136–142, 2011. [Google Scholar]
3. H. He and E. A. Garcia, “Learning from imbalanced data,” IEEE Transactions on Knowledge and Data Engineering, vol. 21, no. 9, pp. 1263–1284, 2009. [Google Scholar]
4. Y. Sun, A. K. Wong and M. S. Kamel, “Classification of imbalanced data: A review,” International Journal of Pattern Recognition and Artificial Intelligence, vol. 23, no. 4, pp. 687–719, 2009. [Google Scholar]
5. H. Patel, D. S. Rajput, G. T. Reddy, C. Iwendi, A. K. Bashir et al. “A review on classification of imbalanced data for wireless sensor networks,” International Journal of Distributed Sensor Networks, vol. 16, no. 4, pp. 1–15, 2020. [Google Scholar]
6. Q. Yang and X. Wu, “10 challenging problems in data mining research,” International Journal of Information Technology & Decision Making, vol. 5, no. 4, pp. 597–604, 2006. [Google Scholar]
7. J. M. Benítez, N. García-Pedrajas and F. Herrera, “Special issue on “New trends in data mining” NTDM,” Knowledge-Based Systems, vol. 25, no. 1, pp. 1–2, 2012. [Google Scholar]
8. T. Raeder, G. Forman and N. V. Chawla, “Learning from imbalanced data: Evaluation matters,” in Data Mining: Foundations and Intelligent Paradigms, Berlin, Heidelberg, Germany: Springer, pp. 315–331, 2012. [Google Scholar]
9. R. Pavón, R. Laza, M. Reboiro-Jato and F. Fdez-Riverola, “Assessing the impact of class-imbalanced data for classifying relevant/irrelevant medline documents,” in 5th Int. Conf. on Practical Applications of Computational Biology & Bioinformatics, Spain, Springer, pp. 345–353, 2011. [Google Scholar]
10. R. B. Rao, S. Krishnan and R. S. Niculescu, “Data mining for improved cardiac care,” ACM SIGKDD Explorations Newsletter, vol. 8, no. 1, pp. 3–10, 2006. [Google Scholar]
11. M. Kubat, R. C. Holte and S. Matwin, “Machine learning for the detection of oil spills in satellite radar images,” Machine Learning, vol. 30, no. 2–3, pp. 195–215, 1998. [Google Scholar]
12. P. K. Chan and S. J. Stolfo, “Toward scalable learning with non-uniform class and cost distributions: A case study in credit card fraud detection,” KDD, vol. 98, pp. 164–168, 1998. [Google Scholar]
13. X.-C. Li, W.-J. Mao, D. Zeng, P. Su and F.-Y. Wang, “Performance evaluation of machine learning methods in cultural modeling,” Journal of Computer Science and Technology, vol. 24, no. 6, pp. 1010–1017, 2009. [Google Scholar]
14. D. P. Williams, V. Myers and M. S. Silvious, “Mine classification with imbalanced data,” IEEE Geoscience and Remote Sensing Letters, vol. 6, no. 3, pp. 528–532, 2009. [Google Scholar]
15. X. Wu, V. Kumar, J. R. Quinlan, J. Ghosh, Q. Yang et al., “Top 10 algorithms in data mining,” Knowledge and Information Systems, vol. 14, no. 1, pp. 1–37, 2008. [Google Scholar]
16. T. Cover and P. Hart, “Nearest neighbor pattern classification,” IEEE Transactions on Information Theory, vol. 13, no. 1, pp. 21–27, 1967. [Google Scholar]
17. G. Loizou and S. J. Maybank, “The nearest neighbor and the Bayes error rates,” IEEE Transactions on Pattern Analysis and Machine Intelligence, vol. 2, pp. 254–262, 1987. [Google Scholar]
18. T. D. Pham, “An Optimally Weighted Fuzzy k-NN Algorithm,” in Int. Conf. on Pattern Recognition and Image Analysis, Bath, UK, Springer, pp. 239–247, 2005. [Google Scholar]
19. L. Baoli, L. Qin and Y. Shiwen, “An adaptive k-nearest neighbor text categorization strategy,” ACM Transactions on Asian Language Information Processing, vol. 3, no. 4, pp. 215–226, 2004. [Google Scholar]
20. J. M. Keller, M. R. Gray and J. A. Givens, “A fuzzy k-nearest neighbor algorithm,” IEEE Transactions on Systems, Man, and Cybernetics, vol. 4, pp. 580–585, 1985. [Google Scholar]
21. H. Patel and G. S. Thakur, “Improved fuzzy-optimally weighted nearest neighbor strategy to classify imbalanced data,” Int. J. Intell. Eng. Syst., vol. 10, pp. 156–162, 2017. [Google Scholar]
22. R. C. Prati, G. E. Batista and D. F. Silva, “Class imbalance revisited: A new experimental setup to assess the performance of treatment methods,” Knowledge and Information Systems, vol. 45, no. 1, pp. 247–270, 2015. [Google Scholar]
23. V. López, A. Fernández, S. García, V. Palade and F. Herrera, “An insight into classification with imbalanced data: Empirical results and current trends on using data intrinsic characteristics,” Information Sciences, vol. 250, pp. 113–141, 2013. [Google Scholar]
24. E. Kriminger, J. C. Principe and C. Lakshminarayan, “Nearest neighbor distributions for imbalanced classification,” in Int. Joint Conf. on Neural Networks, Brisbane, Australia, IEEE, pp. 1–5, 2012. [Google Scholar]
25. N. Tomašev and D. Mladenić, “Class imbalance and the curse of minority hubs,” Knowledge-Based Systems, vol. 53, pp. 157–172, 2013. [Google Scholar]
26. D. Ryu, J. I. Jang and J. Baik, “A hybrid instance selection using nearest-neighbor for cross-project defect prediction,” Journal of Computer Science and Technology, vol. 30, no. 5, pp. 969–980, 2015. [Google Scholar]
27. H. Dubey and V. Pudi, “Class based weighted k-nearest neighbor over imbalance dataset,” in Pacific-Asia Conf. on Knowledge Discovery and Data Mining, Gold Coast, Australia, Springer, pp. 305–316, 2013. [Google Scholar]
28. H. Patel and G. Thakur, “A hybrid weighted nearest neighbor approach to mine imbalanced data,” in Proc. of the Int. Conf. on Data Mining: The Steering Committee of the World Congress in Computer Science, Computer Engineering and Applied Computing (WorldComp), Las, Vegas, USA, pp. 106–110, 2016. [Google Scholar]
29. S. Ando, “Classifying imbalanced data in distance-based feature space,” Knowledge and Information Systems, vol. 46, no. 3, pp. 707–730, 2016. [Google Scholar]
30. W. Liu and S. Chawla, “Class confidence weighted knn algorithms for imbalanced data sets,” in Pacific-Asia Conf. on Knowledge Discovery and Data Mining, Shenzhen, China, Springer, pp. 345–356, 2011. [Google Scholar]
31. E. Ramentol, S. Vluymans, N. Verbiest, Y. Caballero, R. Bello et al., “IFROWANN: Imbalanced fuzzy-rough ordered weighted average nearest neighbor classification,” IEEE Transactions on Fuzzy Systems, vol. 23, no. 5, pp. 1622–1637, 2015. [Google Scholar]
32. A. Fernández, M. J. del Jesus and F. Herrera, “On the influence of an adaptive inference system in fuzzy rule based classification systems for imbalanced data-sets,” Expert Systems with Applications, vol. 36, no. 6, pp. 9805–9812, 2009. [Google Scholar]
33. H. Han and B. Mao, “Fuzzy-rough k-nearest neighbor algorithm for imbalanced data sets learning,” in Fuzzy Systems and Knowledge Discovery, Seventh Int. Conf., Shandong, China, IEEE, vol. 3, pp. 1286–1290, 2010. [Google Scholar]
34. C. Liu, L. Cao and S. Y. Philip, “Coupled fuzzy k-nearest neighbors classification of imbalanced non-iID categorical data,” in 2014 Int. Joint Conf. on Neural Networks, Beijing, China, IEEE, pp. 1122–1129, 2014. [Google Scholar]
35. H. Patel and G. S. Thakur, “An improved fuzzy k-nearest neighbor algorithm for imbalanced data using adaptive approach,” IETE Journal of Research, vol. 65, no. 6, pp. 780–789, 2019. [Google Scholar]
36. S. Tan, “Neighbor-weighted k-nearest neighbor for unbalanced text corpus,” Expert Systems with Applications, vol. 28, no. 4, pp. 667–671, 2005. [Google Scholar]
37. H. Patel and G. Thakur, “Classification of imbalanced data using a modified fuzzy-neighbor weighted approach,” International Journal of Intelligent Engineering and Systems, vol. 10, no. 1, pp. 56–64, 2017. [Google Scholar]
38. A. Asuncion and D. Newman, “UCI machine learning repository,” [Online]. Available: http://archive.ics.uci.edu/ml/index.php. [Google Scholar]
39. J. Alcalá-Fdez, A. Fernández, J. Luengo, J. Derrac, S. García et al., “Keel data-mining software tool: Data set repository, integration of algorithms and experimental analysis framework,” Journal of Multiple-Valued Logic & Soft Computing, vol. 17, no. 2–3, pp. 255–287, 2011. [Google Scholar]
40. R. A. Fisher, Statistical Methods and Scientific Inference, Edinburgh: Oliver & Boyd, 1956. [Google Scholar]
41. M. Hollander, D. A. Wolfe and E. Chicken, “Wiley series in probability and statistics,” Nonparametric Statistical Methods 3rd ed., USA: Wiley, pp. 821–828, 1999. [Google Scholar]
42. D. S. Rajput and R. Gour, “An IoT framework for healthcare monitoring systems,” International Journal of Computer Science and Information Security, vol. 14, no. 5, pp. 451–455, 2016. [Google Scholar]
43. S. M. Basha, D. S. Rajput, N. Iyengar and D. Caytiles, “A novel approach to perform analysis and prediction on breast cancer dataset using R,” International Journal of Grid and Distributed Computing, vol. 11, no. 2, pp. 41–54, 2018. [Google Scholar]
44. A. Palve and H. Patel, “Towards Securing Real Time Data in IoMT Environment,” in 2018 8th Int. Conf. on Communication Systems and Network Technologies, Bhopal, India, IEEE, pp. 113–119, 2018. [Google Scholar]
45. R. Kaluri, D. S. Rajput, Q. Xin, K. Lakshmanna, S. Bhattacharya et al., “Roughsets-based approach for predicting battery life in IoT,” arXiv preprint arXiv: 2102.06026, 2021. [Google Scholar]
 | This work is licensed under a Creative Commons Attribution 4.0 International License, which permits unrestricted use, distribution, and reproduction in any medium, provided the original work is properly cited. |