DOI:10.32604/cmc.2022.017068
| Computers, Materials & Continua DOI:10.32604/cmc.2022.017068 | |
| Article |
Prediction of BRIC Stock Price Using ARIMA, SutteARIMA, and Holt-Winters
1Department of Statistics, Faculty of Mathematics and Natural Sciencces, Universitas Negeri Makassar, Makassar, 90223, Indonesia
2School of Humanities and Social Sciences, Thapar Institute of Engineering and Technology, Patiala, 147004, India
3Faculty of Commerce, Van Lang University, Ho Chi Minh City, 70000, Vietnam
*Corresponding Author: Nguyen Van Thanh. Email: thanh.nguyenvan@vlu.edu.vn
Received: 20 January 2021; Accepted: 07 May 2021
Abstract: The novel coronavirus has played a disastrous role in many countries worldwide. The outbreak became a major epidemic, engulfing the entire world in lockdown and it is now speculated that its economic impact might be worse than economic deceleration and decline. This paper identifies two different models to capture the trend of closing stock prices in Brazil (BVSP), Russia (IMOEX.ME), India (BSESN), and China (SSE), i.e., (BRIC) countries. We predict the stock prices for three daily time periods, so appropriate preparations can be undertaken to solve these issues. First, we compared the ARIMA, SutteARIMA and Holt-Winters (H-W) methods to determine the most effective model for predicting data. The stock closing price of BRIC country data was obtained from Yahoo Finance. That data dates from 01 November 2019 to 11 December 2020, then divided into two categories--training data and test data. Training data covers 01 November 2019 to 02 December 2020. Seven days (03 December 2020 to 11 December 2020) of data was tested to determine the accuracy of the models using training data as a reference. To measure the accuracy of the models, we obtained the means absolute percentage error (MAPE) and mean square error (MSE). Prediction model Holt-Winters was found to be the most suitable for forecasting the Brazil stock price (BVSP) while MAPE (0.50) and MSE (579272.65) with Holt-Winters (smaller than ARIMA and SutteARIMA), model SutteARIMA was found most appropriate to predict the stock prices of Russia (IMOEX.ME), India (BSESN), and China (SSE) when compared to ARIMA and Holt-Winters. MAPE and MSE with SutteARIMA: Russia (MAPE:0.7; MSE:940.20), India (MAPE:0.90; MSE:207271.16), and China (MAPE: 0.72; MSE: 786.28). Finally, Holt-Winters predicted the daily forecast values for the Brazil stock price (BVSP) (12 December to 14 December 2020 i.e., 115757.6, 116150.9 and 116544.1), while SutteARIMA predicted the daily forecast values of Russia stock prices (IMOEX.ME) (12 December to 14 December 2020 i.e., 3238.06, 3241.54 and 3245.01), India stock price (BSESN) (12 December to 14 December 2020 i.e.,. 45709.38, 45828.71 and 45948.05), and China stock price (SSE) (11 December to 13 December 2020 i.e., 3397.56, 3390.59 and 3383.61) for the three time periods.
Keywords: SutteARIMA; Holt-Winters; ARIMA; stock price; COVID-19
COVID-19 is an infectious disease caused by a new coronavirus (SARS-CoV-2). It was first reported in Wuhan, Hubei Province, in China in December of 2019 [1–3]. This outbreak became a pandemic, engulfing the entire world in lock-down. It is now speculated that its economic impact might be worse than the Great Depression of the 1930s [4]. Developed and undeveloped economies, which were already experiencing weaker growth before this crisis, now face even greater challenges of economic deceleration and decline, with the expectation that the world economy will have shrunk by 3% in 2020 [4]. The coronavirus (COVID-19) disease still continues to spread around the world, with over 63 million cases and over 1.47 million deaths as of November 30, 2020 [5].
The current pandemic (COVID-19) is badly affecting stock prices, financial markets, and other economic activities of BRIC (Brazil, Russia, India, and China) as well as the entire world economy [6]. The pandemic and the related financial crisis has rekindled interest in predicting the path of leading economic indicators including asset prices. There is evidence that asset prices, including stock prices, help predict output and inflation by acting as leading indicators [7,8]. Further, there are major (asymmetric) spillovers from the stock markets to the real sector of economies [9]. Asset price bubbles have potentially negative effects on an economy. The departure of asset prices from the fundamentals can lead to inappropriate investments that decrease the efficiency of an economy [10]. Hence, the need for accurate prediction of stock prices in the COVID-19 pandemic cannot be overlooked. Intelligent use of such predication data will help policymakers’ decision-making strategies [11]. The benefits of such forecasts include paving the path for relevant policy decisions in advance and providing important information to officials to prepare appropriate policies to avoid the steepest slowdown since the Great Depression of the 1930s from the unprecedented pandemic COVID-19. Indeed, Gupta and Modise clearly illustrated the importance of forecasting information to fight such economic crises [12].
Stock markets in BRIC countries have become an important source of global portfolio diversification. However, there are challenges when predicting stock returns of emerging stock markets, and identifying the dynamic behaviours of stock prices in Brazil, Russia, India, and China. Hence, this study emphasizes the prediction of stock prices for a group of emerging market economies, namely, Brazil, Russia, India, and China (BRICS). BRICS unites five significant arising economies that involve 40% of the total populace, have 25% of the world's GDP and 17% offers on the worldwide exchanges [13]. Indeed, predictions of stock markets is important to understand the fluctuation in markets in the presence of the novel coronavirus (COVID-19). Such investigations have been previously undertaken during different crises and during the 2020 pandemic on various stock prices using different forecasting models.
Zhang et al. [14] developed the IBCO–BP model to predict the stock indices. Pang, et al. [15] developed a neural network approach for greater accuracy in stock market predictions. Thakkar et al. [16] used fusion methods for various stock market applications. The Infectious Disease EMV tracker (IDEMV) proposed by Baker et al. [17] also offers additional predictive ability for the European stock market's volatility during the COVID-19 pandemic. Zhou et al. [18] used multiple heterogeneous data sources to predict the direction of stock price movements. Cao et al. [19] compared the prediction abilities of linear models in the financial forecasting literature to the prediction abilities of univariate and multivariate neural network models. Guresen et al. [20] evaluated the effectiveness of neural network models using real exchange daily rate values for the NASDAQ stock exchange index in the U. S. Aye et al. [21] tried to predict BRICS stock returns with the help of ARFIMA models. The SutteARIMA method, a short-term prediction method Qa used in the U. S. for COVID-19 and for COVID-19 and the stock market in Spain [22–24], while Ahmar et al. [3] used the SutteARIMA method ro predict confirmed cases in Spain. Salisu et al. [25] applied the GFI (Global Fear Index) to understand the predictability of commodity price levels during COVID. Nabipour et al. [26] used machine learning algorithms to predict the future values of the Tehran stock market while Garcia-Vega et al. [27] applied the KAF (Kernel Adaptive Index) with stock market interdependence to systematically predict stock market returns. Pang et al. [15] advocated for the use of a deep long short-term memory neural network (LSTM) with an embedded layer and the long short-term memory neural network with an automatic encoder to forecast stock market data. Ahmar et al. [28] compared the indicators ARIMA, Holt-Winters, SARIMA, α sutte, which are widely used along with NNAR for predicting stock market and time series data.
Against this background, the current paper contributes to this research area by first reinvestigating the existence or otherwise of long memory for BRIC stock prices. Secondly, we predict the stock price for the BRIC countries using the ARIMA, SutteARIMA, and Holt Winters models. Third, we compare the forecast ability of the ARIMA, SutteARIMA, and Holt Winters models. ARIMA, SutteARIMA and Holt-Winters are very important models often used by different researchers [3,22,25]. Hence, the current study examines the application of ARIMA, SutteARIMA and Holt-Winters models.
The
with
If there is a differencing then the ARIMA model becomes as follows [3,22]:
with
The α-Sutte indicator (α-Sutte) is based on the forecasting practice developed using the previous values of the variable or data set [28]. This model applies the adapted version of the MA (moving average) method of forecasting, which is generally used to detect and forecast trends in time series data. The α-Sutte indicator's predictions are based on four data sets from the previous period, i.e.,
where:
The SutteARIMA is a method of forecasting that combines the ARIMA method and α-Sutte [22]. The result of this SutteARIMA forecast is the average of the results coming from ARIMA and α-Sutte.
The SutteARIMA Eq. (1), can be described as [28]:
While Eq. (3), can be reduced by using backward shift operator
If we define:
The Eq. (4) can be:
and the Eq. (2) can be simplified as:
Let, Eq. (4) added with Eq. (5), we will find:
So, Eq. (6) is the formula for SutteARIMA. After an overview of related models, the next section discusses the methodology.
The Holt-Winters prediction method has been categorized into two parts-- Multiplicative Holt-Winters (MHW), and Additive Holt-Winters (AHW). The MHW method is described in the following Eq. (7) [29].
The component form for the additive method is:
where:
The stock closing price data for Brazil, Russia, India and China (BRIC) were collected from YahoFinance for period from 01 November 2019 to 11 December 2020 [30]. In this research, the data have been divided into two parts, namely, training data and test data. The training data covers 01 November 2019 to 02 December 2020, while test data covers 03 December to 11 December 2020. Based on these fitted data, this study conducted short-term forecasts for 3 future periods. Ahmar developed the SutteForecast R package in R software, and it compares the forecasting results of other forecasting methods [31]. In our interpretation of these predictions, we used the forecasting accuracy measure MAPE (Mean Absolute Percentage Error) and Mean Squared Error (MSE) [32] noted as follows:
where:
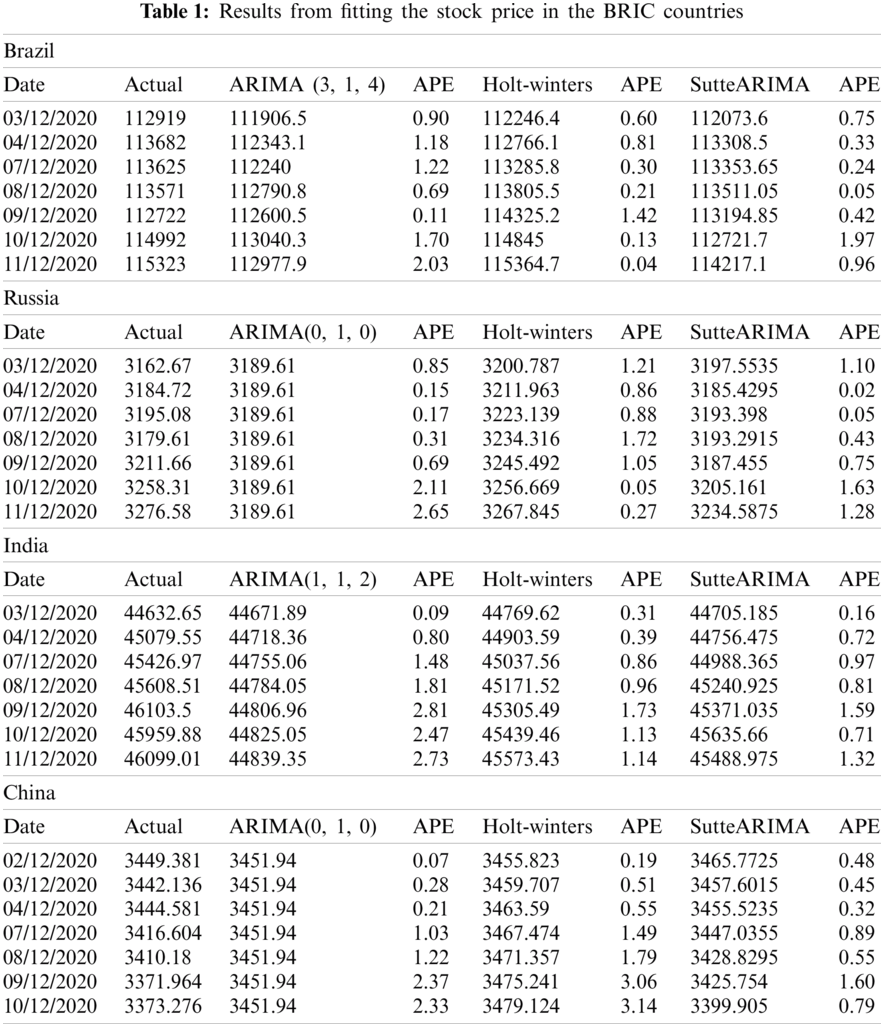
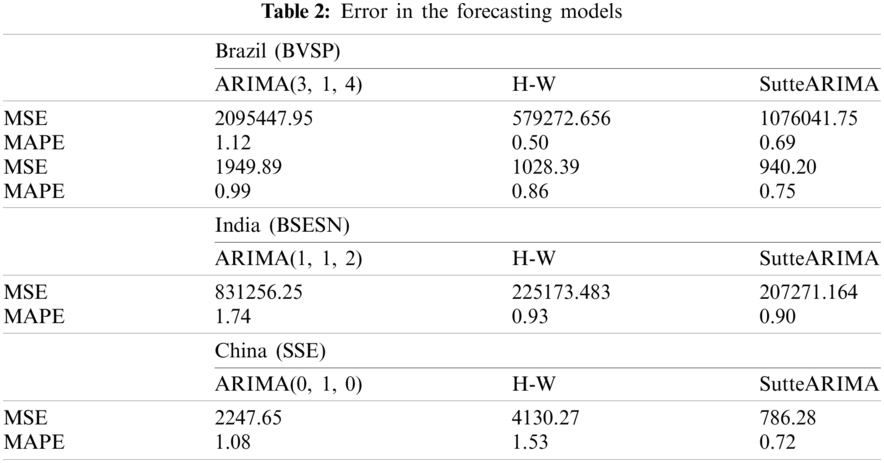
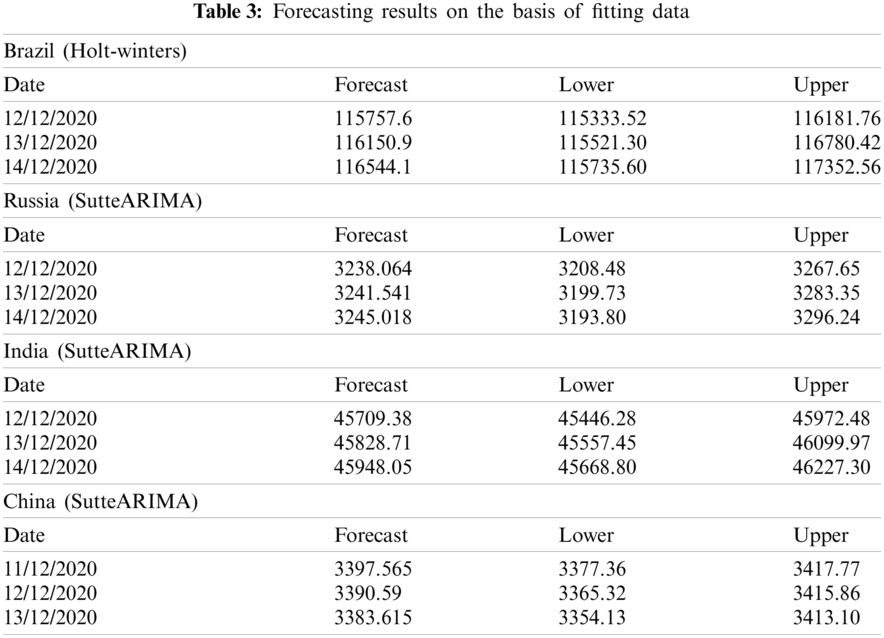
Short-term daily estimates for stock prices are important in order to make strategic decisions for the future. Figs. 1a–1d highlight that the stock prices in Brazil, Russia, India and China have fluctuated since the beginning of COVID-19. A crucial impact was felt on the stock prices of BRIC countries, because with the outbreak of the unprecedented pandemic called COVID-19, investors started panic buying, which then led to selling of stocks, which resulted in a drop-in stock price. This trend increased after the WHO announced COVID-19 was a global pandemic. Brazil, Russia, India and China saw large numbers of confirmed cased and deaths due to the pandemic. Hence, it became very important to throw light on the fluctuations of stock prices in BRIC countries during this COVID-19 period.
This study applied the ARIMA, SutteARIMA, and Holt-Winters prediction models to forecast the stock price for BVSP (Brazil), IMOEX.ME (Russia), BSESN (India), and SSE (China). Results of the fitted data for ARIMA, SutteARIMA, and Holt-Winters in the BRIC countries are presented in Tab. 1. Tab. 1 shows the value of the average percentage error (APE) of each method. The value of APE for SutteARIMA was lower than the other methods for RIS (Russia, India, and China) and Holt-Winters for Brazil.
To determine the accuracy of each method, the comparison of the value of mean absolute percentage error (MAPE) and the mean square error from the results of predicting the test data was done (Tab. 2). A comparison of accuracy value is presented in Tab. 2, and the forecast results based of most appropriate model for the next three periods are presented in Tab. 3.
Holt-Winters was found to be most appropriate method for predicting the Brazilian stock price (BVSP), while SutteARIMA was found to be most appropriate model to use for predicting the Russian stock price (IMOEX.ME), Indian stock price (BSESN), and Chinese stock price (SSE). Hence Holt-Winters was used to forecast the Brazilian stock price, and SutteARIMA was used to forecast the Russian, Indian and Chinese stock prices in Tab. 3.
All the predictions were performed with 99% confidence intervals. The MAPE (0.50) and MSE (579272.65) value using the Holt-Winters method for Brazil stock price, and MAPE (Russia:0.75; India: 0.90 and China:0.72), and MSE (Russia:940.20; India: 207271.16 and China: 786.28) and using the SutteARIMA method for Russia, India and China stock price were to be found relatively smaller as noted in Tab. 2.
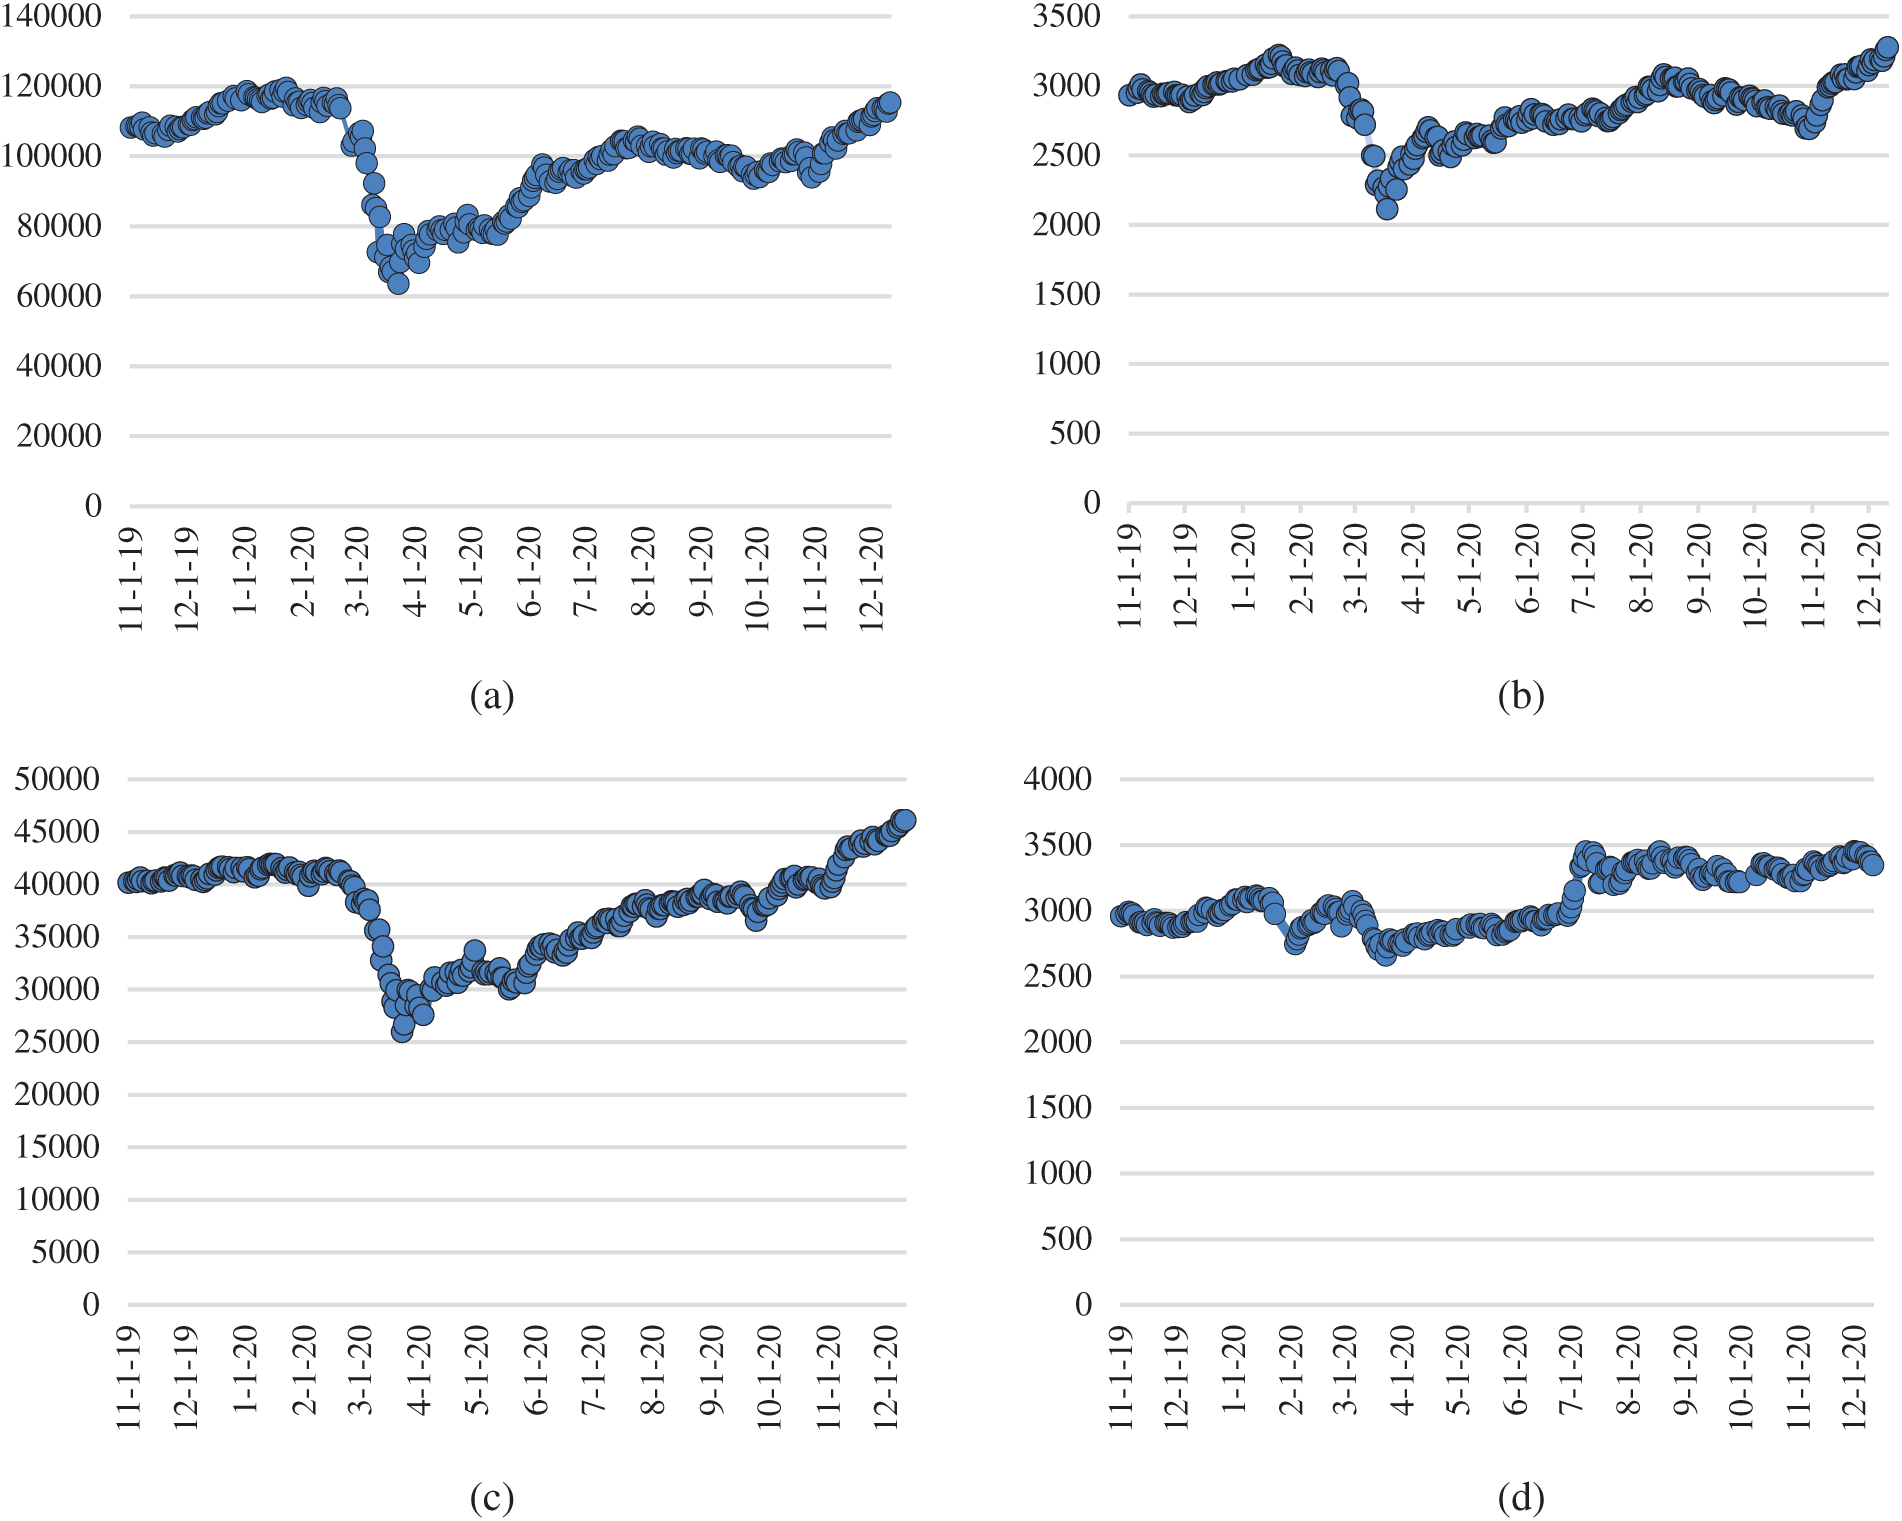
Figure 1: The stock price of Brazil (a), Russia (b), India (c) and China (d) fluctuated since the beginning of COVID-19
5 Conclusion and Further Research
In fitting the data from 03 December 2020 to 11 December 2020, Holt-Winters and SutteARIMA were found to be most suitable to use to predict the stock price of BRIC countries. Therefore, in this paper, we propose two different techniques for predicting the stock prices BVSP (Brazil), IMOEX.ME (Russia), BSESN (India), and SSE (China). First Holt-Winters can be used to predict the Brazil stock price, and SutteARIMA can be used to predict Russia, India, and China stock prices. Finally, Holt-Winters predicted daily forecast values for the Brazil stock price (BVSP) (12 December to 14 December 2020 i.e., 115757.6, 116150.9 and 116544.1) and SutteARIMA was used to predict the daily forecast values of Russia (IMOEX.ME) (12 December to 14 December 2020 i.e., 3238.06, 3241.54 and 3245.01), India (BSESN) (12 December to 14 December 2020 i.e., 45709.38, 45828.71 and 45948.05), and China (SSE) (11 December to 13 December 2020 i.e., 3397.56, 3390.59 and 3383.61) for the three-time periods.
This result demonstrates that the Holt-Winters and SutteARIMA models are most appropriate for predicting BRIC countries’ stock prices, and they can provide an intellectual notion for policy makers to use as a tool for policy formulation. This models will also be helpful for policymakers when ascertaining future impacts. Further this approach can be compared with other methods, for example, the α-Sutte indicator, NNAR, Theta, the time series linear model (TSLM) or other forecasting methods.
Acknowledgement: Authors should thank those who contributed to the article but cannot include themselves.
Funding Statement: The authors received no specific funding for this study.
Conflicts of Interest: The authors declare that they have no conflicts of interest to report regarding the present study.
1. S. Atuahene, Y. Kong and G. Bentum-Micah, “COVID-19 pandemic, economic loses and education sector management,” Quantitative Economics and Management Studies, vol. 1, no. 2, pp. 103–109, 2020. [Google Scholar]
2. J. Yang, Y. Zheng, X. Gou, K. Pu, Z. Chen et al., “Prevalence of comorbidities and its effects in coronavirus disease 2019 patients: A systematic review and meta-analysis,” International Journal of Infectious Diseases, vol. 94, no. 1, pp. 91–95, 2020. [Google Scholar]
3. A. S. Ahmar and E. Boj, “The date predicted 200.000 cases of covid-19 in Spain,” Journal of Applied Science, Engineering, Technology, and Education, vol. 2, no. 2, pp. 188–193, 2020. [Google Scholar]
4. G. Gopinath, “Tentative stabilization, sluggish recovery?,” Washington D.C., USA, 2020. [Online]. Available: https://blogs.imf.org/2020/01/20/tentative-stabilization-sluggish-recovery/. [Google Scholar]
5. Worldometer, “COVID-19 coronavirus pandemic,” USA, 2020. [Online]. Available: https://www.worldometers.info/coronavirus/. [Google Scholar]
6. C. Devonshire-Ellis, A. Livermore, R. Kapur, M. Kotova and P. Varejao. “The current social & economic impact of covid-19 upon the BRICS nations,” New York, USA, 2020. [Online]. Available: https://www.mondaq.com/china/operational-impacts-and-strategy/941646/the-current-social-economic-impact-of-covid-19-upon-the-brics-nations. [Google Scholar]
7. J. H. Stock and M. W. Watson, “Forecasting output and inflation: The role of asset prices,” Journal of Economic Literature, vol. 41, no. 3, pp. 788–829, 2003. [Google Scholar]
8. A. Muchayan, “Comparison of holt and brown's double exponential smoothing methods in the forecast of moving price for mutual funds,” Journal of Applied Science, Engineering, Technology, and Education, vol. 1, no. 2, pp. 183–192, 2019. [Google Scholar]
9. M. Lettau and S. Ludvigson, “Consumption, aggregate wealth, and expected stock returns,” Journal of Finance, vol. 56, no. 3, pp. 815–849, 2002. [Google Scholar]
10. M. Jianjun, “Introduction to economic theory of bubbles,” Journal of Mathematical Economics, vol. 53, no. 1, pp. 130–136, 2014. [Google Scholar]
11. R. Bakri, U. Data and A. Saputra, “Marketing research: The application of auto sales forecasting software to optimize product marketing strategies,” Journal of Applied Science, Engineering, Technology, and Education, vol. 1, no. 1, pp. 6–12, 2019. [Google Scholar]
12. R. Gupta and M. P. Modise, “South African stock return predictability in the context data mining: The role of financial variables and international stock returns,” Economic Modelling, vol. 29, no. 3, pp. 908–916, 2012. [Google Scholar]
13. S. Acharya, S. Barber, D. Lopez-Acuna, N. Menabde, L. Migliorini et al., “BRICS and global health,” Bulletin of the World Health Organization, vol. 92, no. 6, pp. 386–386A, 2014. [Google Scholar]
14. Y. Zhang and L. Wu, “Stock market prediction of S & P 500 via combination of improved BCO approach and BP neural network,” Expert Systems with Applications, vol. 36, no. 5, pp. 8849–8854, 2009. [Google Scholar]
15. X. Pang, Y. Zhou, P. Wang, W. Lin and V. Chang, “An innovative neural network approach for stock market prediction,” Journal of Supercomputing, vol. 76, no. 3, pp. 2098–2118, 2020. [Google Scholar]
16. A. Thakkar and K. Chaudhari, “Fusion in stock market prediction: A decade survey on the necessity, recent developments, and potential future directions,” Information Fusion, vol. 65, no. 1, pp. 95–107, 2021. [Google Scholar]
17. Y. Li, C. Liang, F. Ma and J. Wang, “The role of the IDEMV in predicting european stock market volatility during the COVID-19 pandemic,” Finance Research Letters, vol. 36, no. 101749, pp. 1–7, 2020. [Google Scholar]
18. Z. Zhou, M. Gao, Q. Liu and H. Xiao, “Forecasting stock price movements with multiple data sources: Evidence from stock market in China,” Physica A: Statistical Mechanics and Its Applications, vol. 542, no. 123389, pp. 1–15, 2020. [Google Scholar]
19. Q. Cao, K. B. Leggio and M. J. Schniederjans, “A comparison between fama and French's model and artificial neural networks in predicting the Chinese stock market,” Computers & Operations Research, vol. 32, no. 10, pp. 2499–2512, 2005. [Google Scholar]
20. E. Guresen, G. Kayakutlu and T. U. Daim, “Using artificial neural network models in stock market index prediction,” Expert Systems with Applications, vol. 38, no. 8, pp. 10389–10397, 2011. [Google Scholar]
21. G. C. Aye, M. Balcilar, R. Gupta, N. Kilimani, A. Nakumuryango et al., “Predicting BRICS stock returns using ARFIMA models,” Applied Financial Economics, vol. 24, no. 17, pp. 1159–1166, 2014. [Google Scholar]
22. A. S. Ahmar and E. B. del Val, “SutteARIMA: Short-term forecasting method, a case: Covid-19 and stock market in Spain,” Science of the Total Environment, vol. 729, no. 138883, pp. 1–6, 2020. [Google Scholar]
23. A. S. Ahmar and E. Boj, “Will COVID-19 confirmed cases in the USA reach 3 million? a forecasting approach by using SutteARIMA method,” Current Research in Behavioral Sciences, vol. 1, no. 100002, pp. 1–3, 2020. [Google Scholar]
24. A. S. Ahmar and R. Rusli, “Will Covid-19 cases in the world reach 4 million? a forecasting approach using SutteARIMA,” JOIV: International Journal on Informatics Visualization, vol. 4, no. 3, pp. 159–161, 2020. [Google Scholar]
25. A. A. Salisu, L. Akanni and I. Raheem, “The COVID-19 global fear index and the predictability of commodity price returns,” Journal of Behavioral and Experimental Finance, vol. 27, no. 100383, pp. 1–7, 2020. [Google Scholar]
26. M. Nabipour, P. Nayyeri, H. Jabani, A. Mosavi, E. Salwana et al., “Deep learning for stock market prediction,” Entropy, vol. 22, no. 8, pp. 1–23, 2020. [Google Scholar]
27. S. Garcia-Vega, X. J. Zeng and J. Keane, “Stock returns prediction using kernel adaptive filtering within a stock market interdependence approach,” Expert Systems with Applications, vol. 160, no. 113668, pp. 1–10, 2020. [Google Scholar]
28. A. S. Ahmar, A. Rahman and U. Mulbar, “α-Sutte indicator: A new method for time series forecasting,” Journal of Physics: Conference Series, vol. 1040, no. 1, pp. 1–9, 2018. [Google Scholar]
29. L. F. Tratar and A. S. Ahmar, “The comparison of holt-winters methods and α-sutte indicators in forecasting the foreign visitor arrivals in Indonesia, Malaysia, and Japan,” SOR ‘19 Proc., Ljubljana, Slovenia, pp. 587–592, 2019. [Google Scholar]
30. Yahoo Finance, “S & P BSE SENSEX (BSESN) charts, data & news,” California, USA, 2020. [Online]. Available: https://finance.yahoo.com/quote/%5EBSESN?p=%5EBSESN&.tsrc=fin-srch. [Google Scholar]
31. A. S. Ahmar, “Rcmdrplugin.sutteForecastR : An rcmdrPlugin for forecasting data,” Journal of Physics: Conf. Series, vol. 1028, no. 1, pp. 1–8, 2018. [Google Scholar]
32. A. S. Ahmar, “Forecast error calculation with mean squared error (MSE) and mean absolute percentage error (MAPE),” JINAV: Journal of Information and Visualization, vol. 1, no. 2, pp. 92–95, 2020. [Google Scholar]
 | This work is licensed under a Creative Commons Attribution 4.0 International License, which permits unrestricted use, distribution, and reproduction in any medium, provided the original work is properly cited. |