DOI:10.32604/cmc.2021.018179
| Computers, Materials & Continua DOI:10.32604/cmc.2021.018179 | |
| Article |
Dynamic Voting Classifier for Risk Identification in Supply Chain 4.0
1Community college, Jazan University, Jazan, Kingdom of Saudi Arabia
2Delta Higher Institute of Engineering and Technology, Mansoura, Egypt
3Faculty of Engineering, Mansoura University, Mansoura, Egypt
*Corresponding Author: Ibrahim Abdelhameed. Email: afai79@mans.edu.eg
Received: 28 February 2021; Accepted: 05 May 2021
Abstract: Supply chain 4.0 refers to the fourth industrial revolution’s supply chain management systems, which integrate the supply chain’s manufacturing operations, information technology, and telecommunication processes. Although supply chain 4.0 aims to improve supply chains’ production systems and profitability, it is subject to different operational and disruptive risks. Operational risks are a big challenge in the cycle of supply chain 4.0 for controlling the demand and supply operations to produce and deliver products across IT systems. This paper proposes a voting classifier to identify the operational risks in the supply chain 4.0 based on a Sine Cosine Dynamic Group (SCDG) algorithm. Exploration and exploitation mechanisms of the basic Sine Cosine Algorithm (CSA) are adjusted and controlled by two groups of agents that can be changed dynamically during the iterations. External and internal features were collected and analyzed from different data sources of service level agreements and transaction data from various KSA firms to validate the proposed algorithm’s efficiency. A balanced accuracy of 0.989 and a Mean Square Error (MSE) of 0.0476 were achieved compared with other optimization-based classifier techniques. A one-way analysis of variance (ANOVA) and Wilcoxon rank-sum tests were performed to show the superiority of the proposed SCDG algorithm. Thus, the experimental results indicate the effectiveness of the proposed SCDG algorithm-based voting classifier.
Keywords: Machine learning; artificial intelligence; supply chain 4.0; risk factors; risk management
Given the array of uncertainties in supply chain management, supply chain performance is vulnerable to several risk factors. Supply chain risk is defined as the probability of a risk event that impacts the supply chain at the micro or macro level and leads to disruption at any stage of supply chain operations [1]. Risk management is the process of assessing and predicting risks to identify risk events to minimize or avoid their effects [2]. Supply risk can be categorized into disruption type or operation type [3–5]. The risk associated with natural disasters, such as earthquake or flooding, is difficult to control. Operational risk leads suboptimal or failed supply and demand operations while delivering or producing final products [6]. The quality of products or delivery of products or services to end customers is a challenge that can be controlled and predicted if it is well-recognized [7]. These events are categorized based on supply chain components such as planning, sourcing, making, delivery, and return [8].
Operational risk events can arise from external sources and inherent supply chain features. The probability of external risk events may affect the whole supply chain, leading firms to declare bankruptcy or fall behind in their finances [9]. The supply chain depends on defining and controlling the external factors by an appropriate method [10]. For example, to increase the sustainability of profits, supply chain firms should take action on factors from external risks or internal risks for maintaining their business [11]. Defining risks is one of the significant challenges for the success of managing risks and decreasing supply chain firms’ uncertainty [12]. External risk events that occur within the internal processes of supply chain 4.0 can cause issues if not planned adequately and affect supply chain firms if methods to mitigate the risks are lacking. Thus, the supply chain risk assessment process has become a necessity today.
A precise analysis of managing risks through better methods is necessary for supply chain 4.0 risk management. Identification and mitigation processes are the main elements of controlling risk events and that includes the concept of understanding the reasons for risk probability and impacts. Management of risk is an essential component of risk analysis, and it can improve decision making for mitigating risks. A supply chain’s profitability depends mainly on identifying and controlling external and internal factors through appropriate responsiveness, efficiency, and reliability [10]. To sustain firms’ profitability levels, supply chains must respond rapidly to internal and external risk events to maintain their businesses effectively and dynamically [11–13]. Different researchers have applied several methods, including quantitative methods, for defining risk events in the supply chain’s operational processes [14–16].
This paper focuses on managing risk in supply chain 4.0 by identifying, assessing, and mitigating external risk events. It proposes a voting classifier based on a Sine Cosine Dynamic Group (SCDG) optimization algorithm to identify and quantify external and internal risk events. The proposed method helps firms mitigate risk events. Exterior and interior features were collected and analyzed from data sources such as service level agreements and Kingdom of Saudi Arabia’s (KSA) firms’ transaction data to validate the proposed algorithm’s efficiency. Experiments were designed to determine the proposed SCDG algorithm-based voting classifier’s effectiveness using balanced accuracy and Mean Square Error (MSE) metrics. Results were compared with other optimization-based classifier techniques. The proposed voting SCDG classifier was compared with Particle Swarm Optimization (PSO) [17,18], Whale Optimization Algorithm (WOA) [19,20], Grey Wolf Optimizer (GWO) [21,22], and Genetic Algorithm (GA)-based [23,24] voting classifier algorithms. One-way analysis of variance (ANOVA) and Wilcoxon rank-sum tests were performed to test the proposed SCDG algorithm’s superiority.
This paper is organized as follows. Section 2 discusses the background and related work of this research. Section 3 explains the artificial intelligence methods for managing risk in supply chain 4.0. Section 4 discusses the proposed Sine Cosine Dynamic Group Algorithm. Section 5 describes the experimental results. Finally, Section 6 presents the conclusions of the study.
Different external risk events affect supply chain performance and cause harm to a supply chain’s internal processes, which can lead to severe financial issues that drag down firms [14,15]. The authors in [8] defined risk management as helping firms describe risk before it happens and trying to mitigate it in any possible way. Most of the previous studies have categorized risk management into three steps: risk identification, risk assessment, and risk mitigation. There have been multiple descriptions of the risk management process from different authors. The authors in [8,25,26] described risk identification as the first step in risk management, which can help the decision maker manage the risk if defined well.
The authors in [27–29] explained risk assessment as the method or system that helps a firm assess and evaluate the impact of historical data of the firm. In [16,30,31], the authors discussed risk mitigation as the method that helps the decision makers quantify risk before it occurs, thus allowing the firm to prevent it. It is essential to study the external risk of supply chain 4.0 to find a better method for measuring its impact on the supply chain. For example, DHL provides Resilience 360, which helps firms map the supply chain end to end and build a system for identifying critical risks by alerting stakeholders on time, which helps mitigate the risk [32]. Many recent machine learning techniques, such as [33–39], can be applied to such problems. Fig. 1 shows the importance of industry 4.0 in the supply chain, which can help firms to attain competitive and sustainable advantages. This paper focuses on quantifying risk events for improving supply chain 4.0 firms’ decision making.
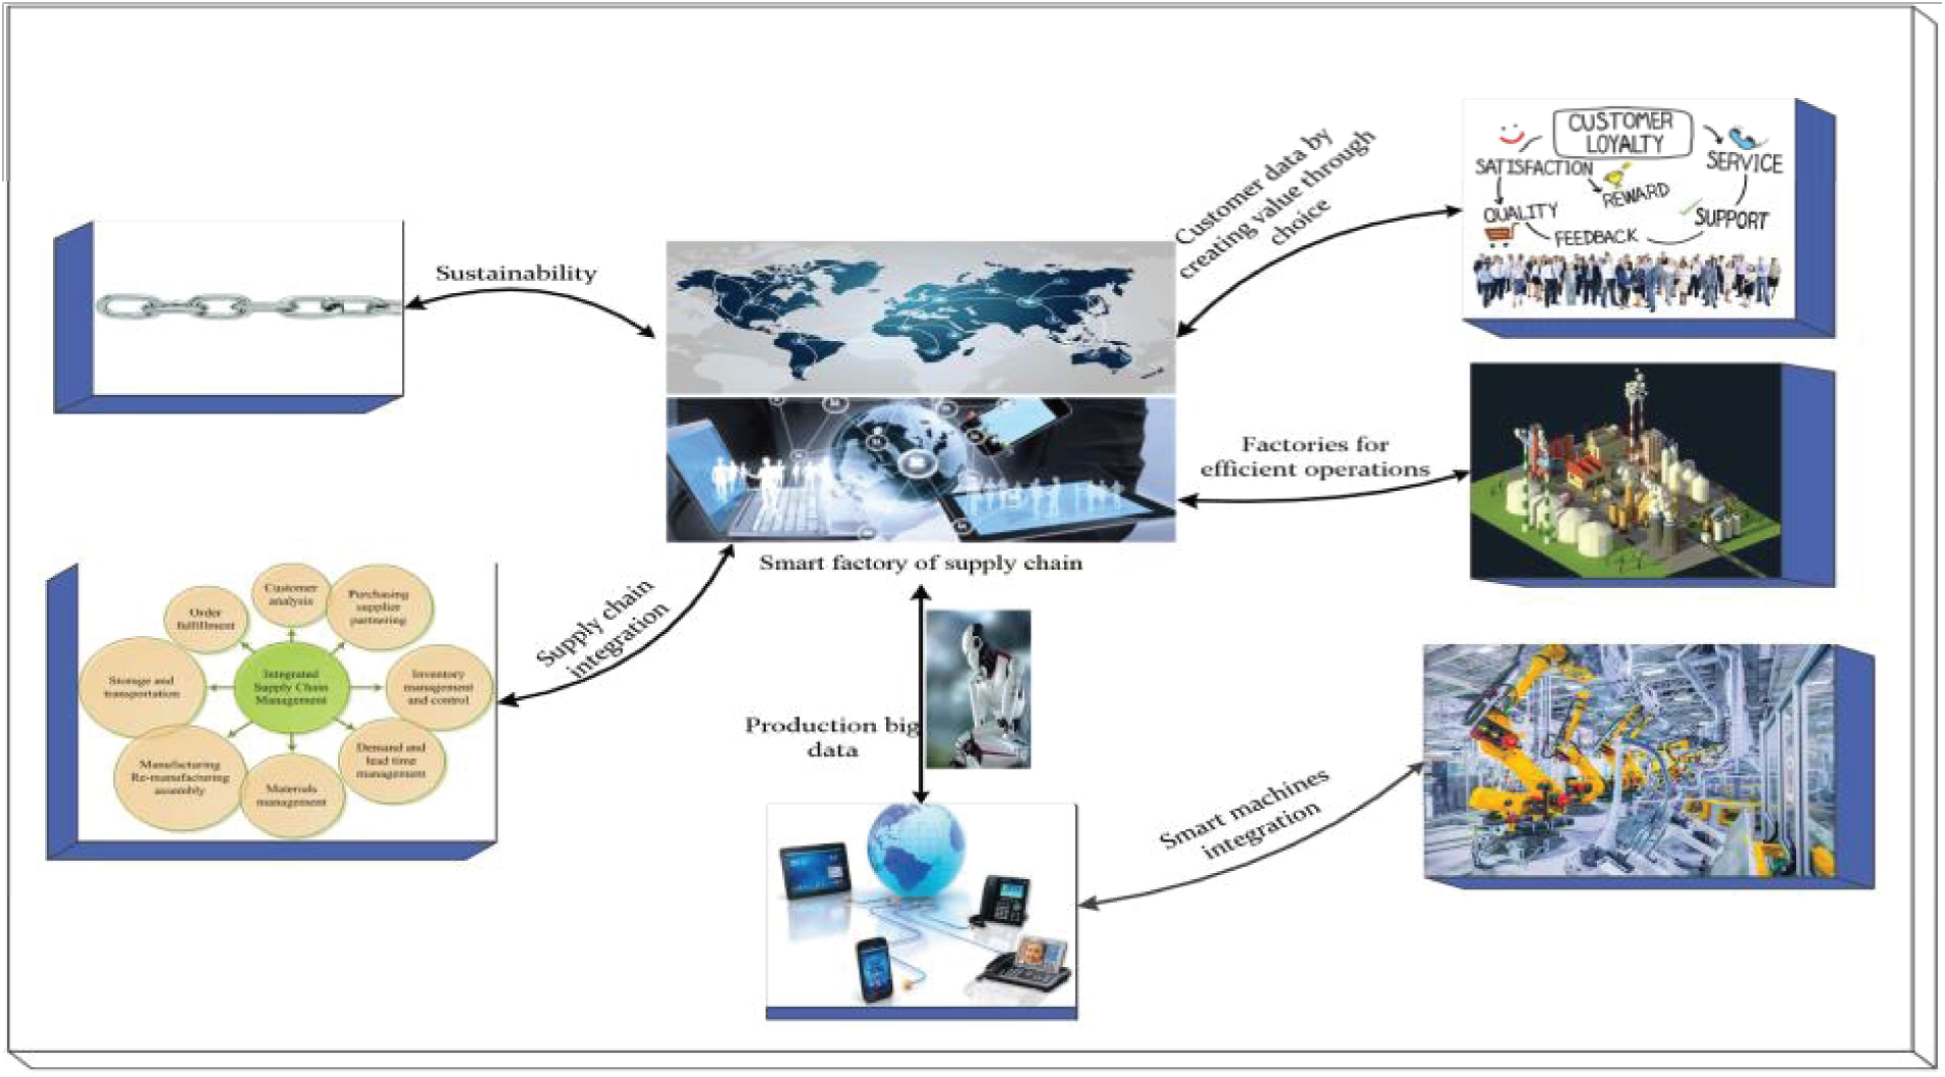
Figure 1: Industry 4.0 in a supply chain smart factory
3.1 Supply Chain 4.0 Operation
Industry 4.0 refers to the fourth industrial revolution and a new model of an intelligent system that helps enterprises in the production and manufacturing environment. It emphasizes global networks in a smart factory for controlling and exchanging information [40]. Supply chain 4.0 consists of independent activities that are geographically separated, combined in various ways, and linked through varied companies, resulting in a capability to respond to consumers’ necessities and needs. As shown in Fig. 2, the dependencies in a supply chain 4.0 include customers, vendors, devices, manufacturing plants, and other physical source systems [41].
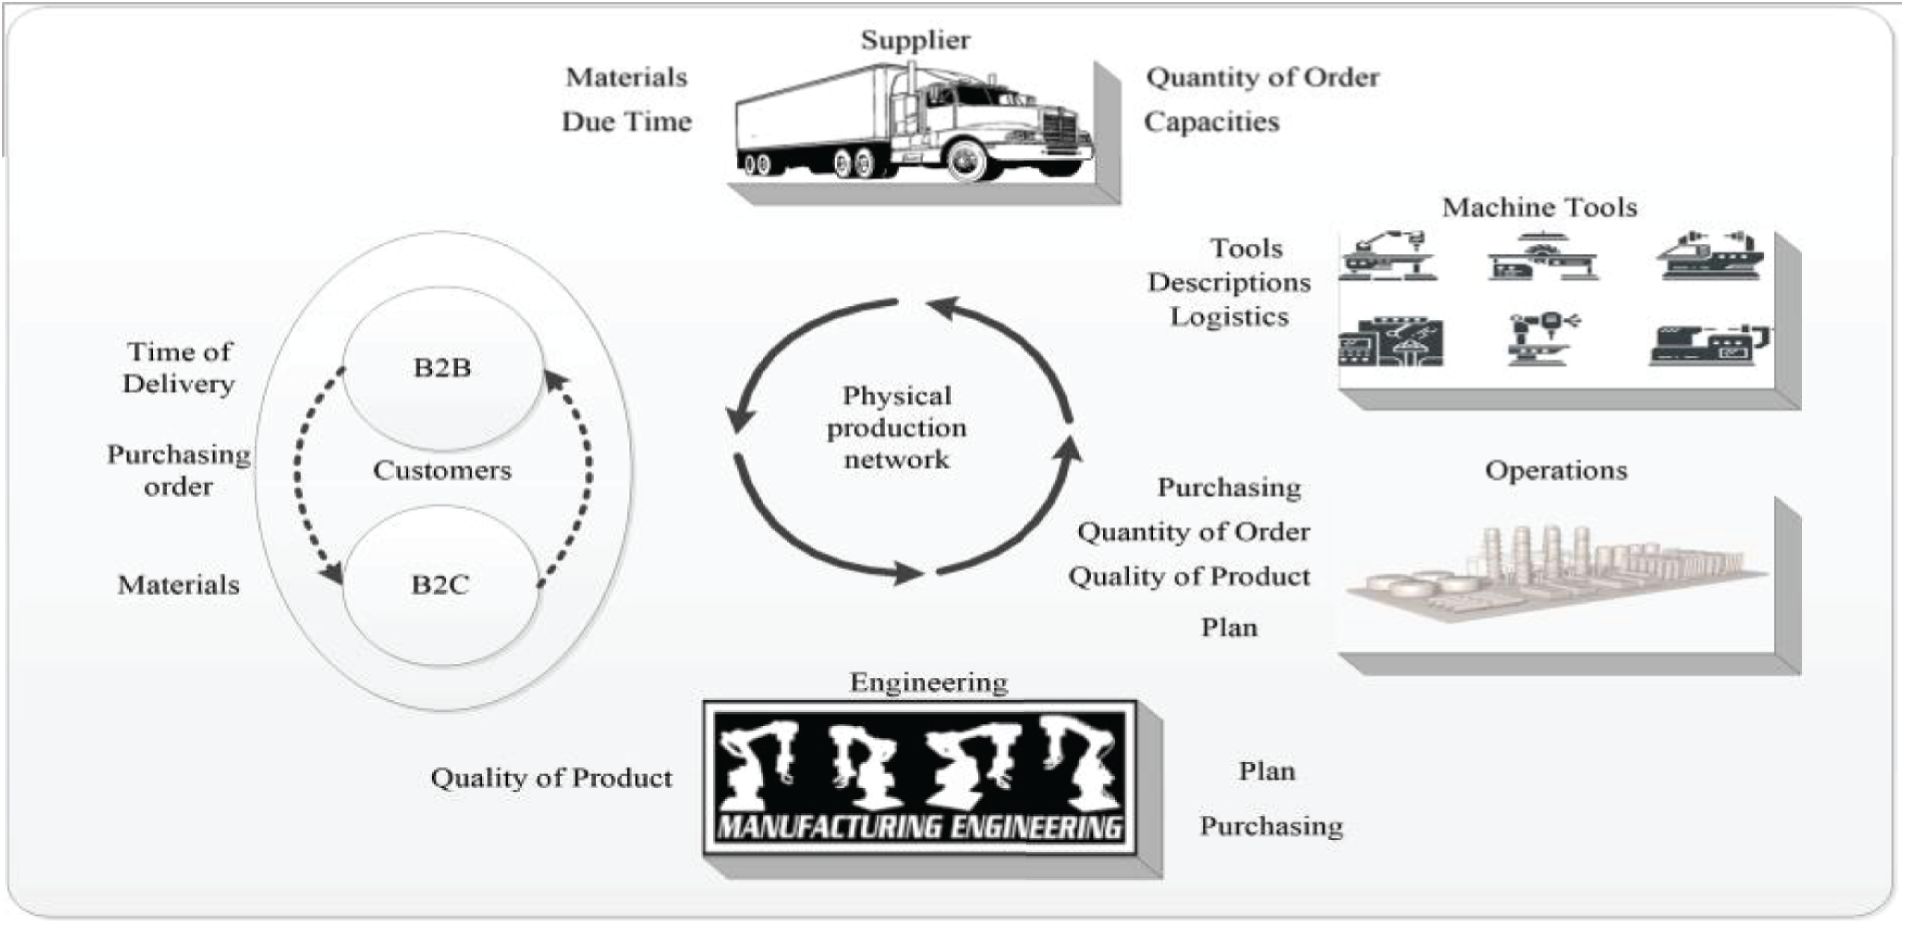
Figure 2: The context of the supply chain within industry 4.0
Supply chain 4.0 is a disruption that causes firms to rethink the components, processes, and designs of their supply chain. In response to client requirements and the need for speedy for fulfillment, numerous strategies have arisen that have changed typical working techniques. Furthermore, the demand for naturalization and supply establishments can also be used to reach the next horizon of operational efficiency, establish the company as an electronic supply chain, as well as change the service provider right into a digital supply chain [42]. To take advantage of these trends and deal with changing requirements, supply chains need to become faster, more credible, and more accurate.
Different researchers have attempted to apply various techniques for defining risks, which is the first step in risk management [43–45]. The authors in [46] stated that artificial intelligence is the technique of the future, and it will help capture risk events automatically by finding the correlation between risk features and labels, as shown in Tab. 1. One of the significant challenges in previous studies was the lack of real data or visible data sources that help yield accurate results for defining risk events by categorizing the firm’s decision when risks occur into three decisions: avoid, reduce, or accept the risks. The proposed framework quantifies the risk as either low, medium, or high, which helps firms make better decisions without uncertainty. Fig. 3 shows the internal and external risk events that impact the processes of supply chain 4.0.

3.2 Big Data Collection Process
Big data collection from different KSA firms was performed, and the data was pre-processed to make it more meaningful for the proposed technique, as depicted in Fig. 4. The first step is categorized into two stages. The first stage involved gathering information from SLAs, including the products’ features and supply chain 4.0 attributes. The second stage linked the labels to the data’s features and attributes by the firms’ chief executive officer (CEO), as shown in Tab. 1. According to these features’ values, the CEOs can manually identify the potential risks that the company faces. The next step logged the data into the Structured Query Language (SQL) format to read the data to identify the risk labels and then sort them into Object Linking and Embedding, Database (Ole DB). The tested dataset in this work comprised nine risk labels. To automatically define the firms’ risks, the relationships between risk labels and their attributes are identified by the proposed voting classifier based on the SCDG optimization algorithm.
The basic Sine Cosine Algorithm (SCA) was first proposed in [47] for optimization problems. The algorithm was based initially on the sine and cosine oscillation functions for updating the candidate solutions’ position. SCA uses a set of random variables to indicate the movement direction and how far the movement should be in order to emphasize/deemphasize the effect of the destination and to switch between the cosine and sine components. SCA uses the following mathematical form for updating the positions of different solutions:
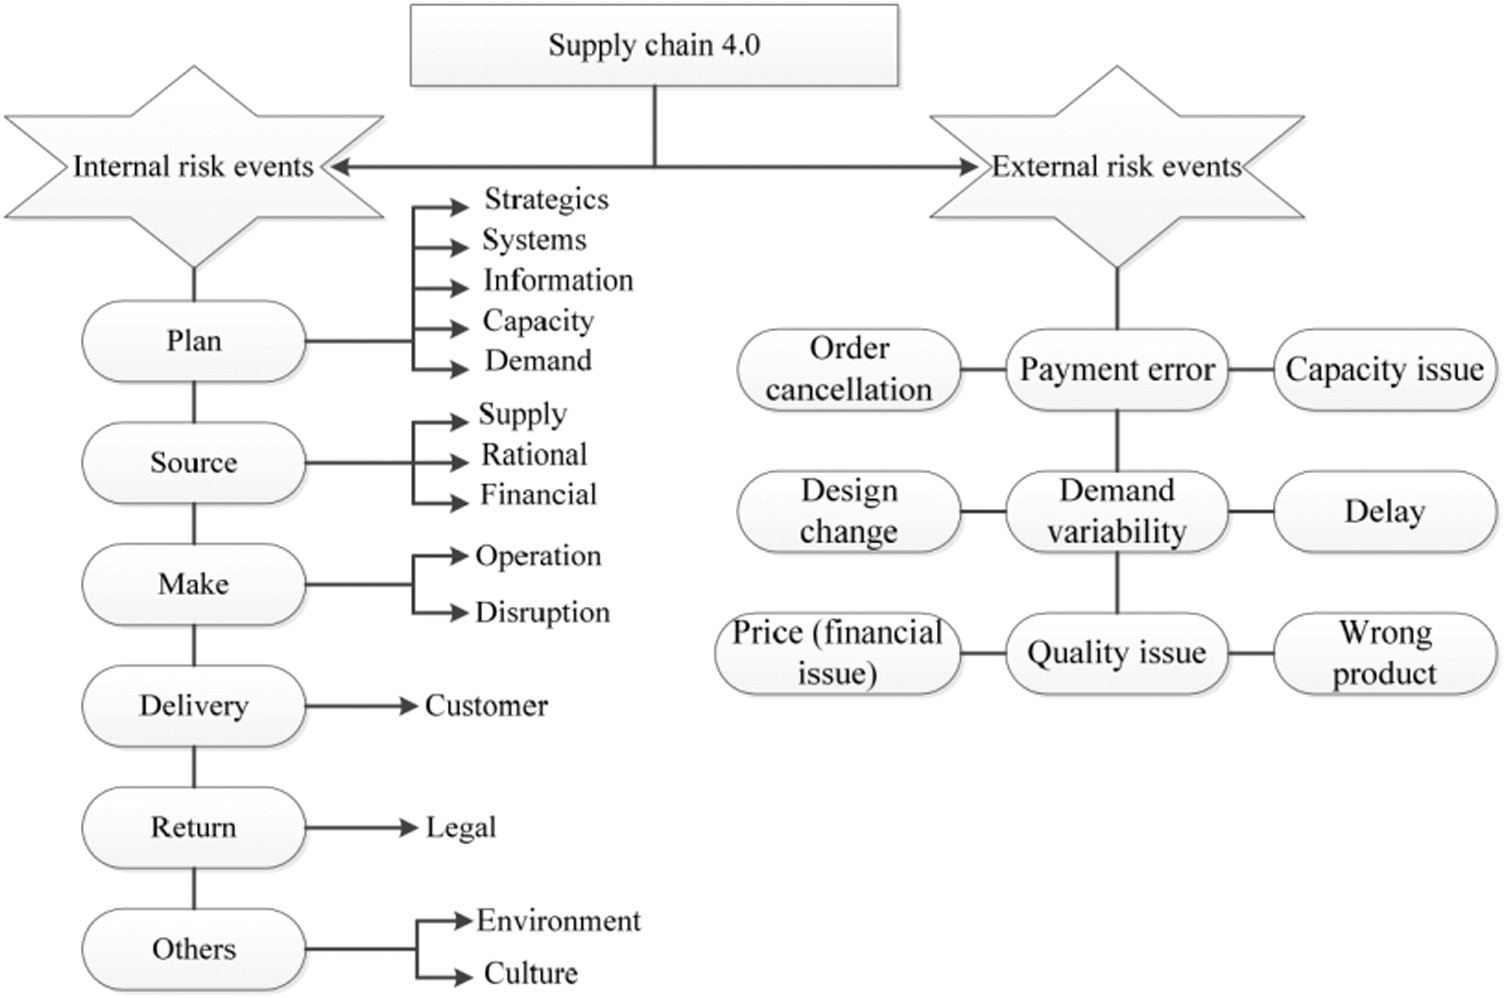
Figure 3: Internal and external risk events of supply chain 4.0
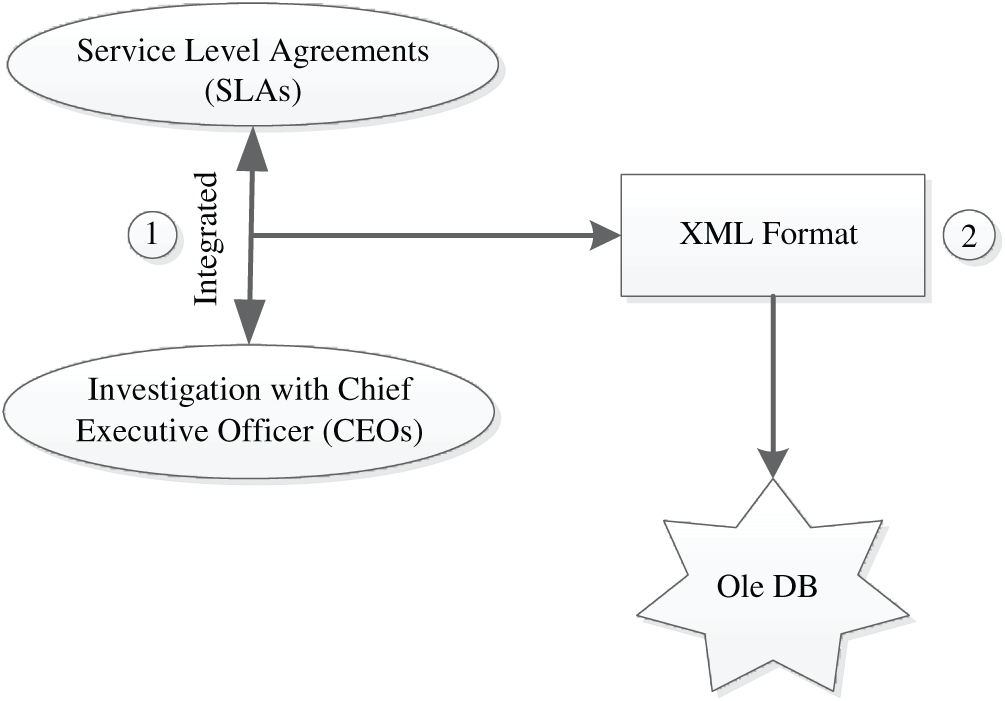
Figure 4: Pre-processing big data gathered from different KSA firms
where Xit is the current solution position in the ith dimension, and Pit represents the best solution in the ith dimension. The parameters r2, r3, and r4 are random values in [0,1]. Eq. 1 shows that the agents’ positions are updated using the position of the best solution. To achieve a balance between the exploitation and exploration processes in the SCA algorithm, parameter r1 can be updated during iterations as:
where t represents the current iteration; a is a constant; and tmax is the maximum number of iterations.
The initial population positions with n agents in the SCA algorithm are randomly set up as shown in Algorithm (1). The objective function is computed in Step 5 for all agents to find the best solution’s position. P in Step 6 indicates the best solution. Parameter r1 is updated according to Eq. (2) in Step 7. The positions of different agents are updated by Eq. (1) in Steps 8–13. Steps 4–16 are repeated according to the number of iterations. The best solution is updated until the end of the iteration.
The original SCA algorithm shows high exploitation of the search space compared to a wide range of other meta-heuristics owing to its use of a single best solution to guide other candidate solutions. This makes the algorithm efficient in terms of memory usage and convergence speed. However, this algorithm may show slightly lower performance in problems with many locally optimal solutions. This motivated our attempt to overcome this drawback in the proposed Sine Cosine Dynamic Group algorithm.

4 Proposed Sine Cosine Dynamic Group Algorithm
The proposed optimization technique in this work is called the SCDG algorithm. The SCDG algorithm can be employed for risk identification in supply chain 4.0 based on an ensemble model. The SCDG algorithm starts by randomly generating several individuals, as shown in Algorithm (2). Each individual indicates a solution that can be a candidate solution to the supply chain 4.0 problem. After calculating the objective function Fn for each agent Xi, the best solution is selected and indicated as P.
The Dynamic Groups behavior of the SCDG algorithm divides all the individuals into an exploration group (n1) and an exploitation group (n2). The number of solutions in each group is managed dynamically with each iteration according to the best solution. The exploration group processes with n1 agents, and the exploitation group with n2 agents, as shown in Fig. 5. SCDG initiates the groups with 50% exploration and 50% exploitation. Then, the number of agents in the exploration group (n1) is decreased, and the number of agents in the exploitation group (n2) is increased.

However, suppose the best solution’s objective function value did not change for three continuous iterations. In that case, the algorithm starts to increase the number of agents in the exploration group (n1) to get another best solution and hopefully avoid local optima. Fig. 6 shows the balancing between exploration and exploitation in the proposed SCDG algorithm during iterations. SCDG uses the Sine Cosine Eq. (1) for updating the positions of the exploration group (n1) and the exploitation group (n2). Parameter r1 is updated during iterations as
This section details three different experiments and statistical tests that were conducted to verify the accuracy of the proposed algorithm. In the first experiment, Support Vector Machine (SVM) [48], Neural Network (NN) [49], k-Nearest Neighbor (KNN) [50], and Random Forest [51] classifiers were applied to identify the operational risks in the supply chain 4.0. The second experiment was designed to compare the proposed SCDG-based voting classifier with the bagging and majority voting ensemble techniques. The last experiment compared the proposed voting SCDG algorithm with Particle Swarm Optimization (PSO) [17], Whale Optimization Algorithm (WOA) [19], Grey Wolf Optimizer (GWO) [21], and the Genetic Algorithm (GA)-based [23] voting classifier algorithms to test the algorithm’s effectiveness. The ANOVA and Wilcoxon’s rank-sum statistical tests were performed to verify the efficacy of the proposed SCDG algorithm. Tab. 2 lists the configurations of the proposed SCDG algorithm and the other algorithms used in the experiments.
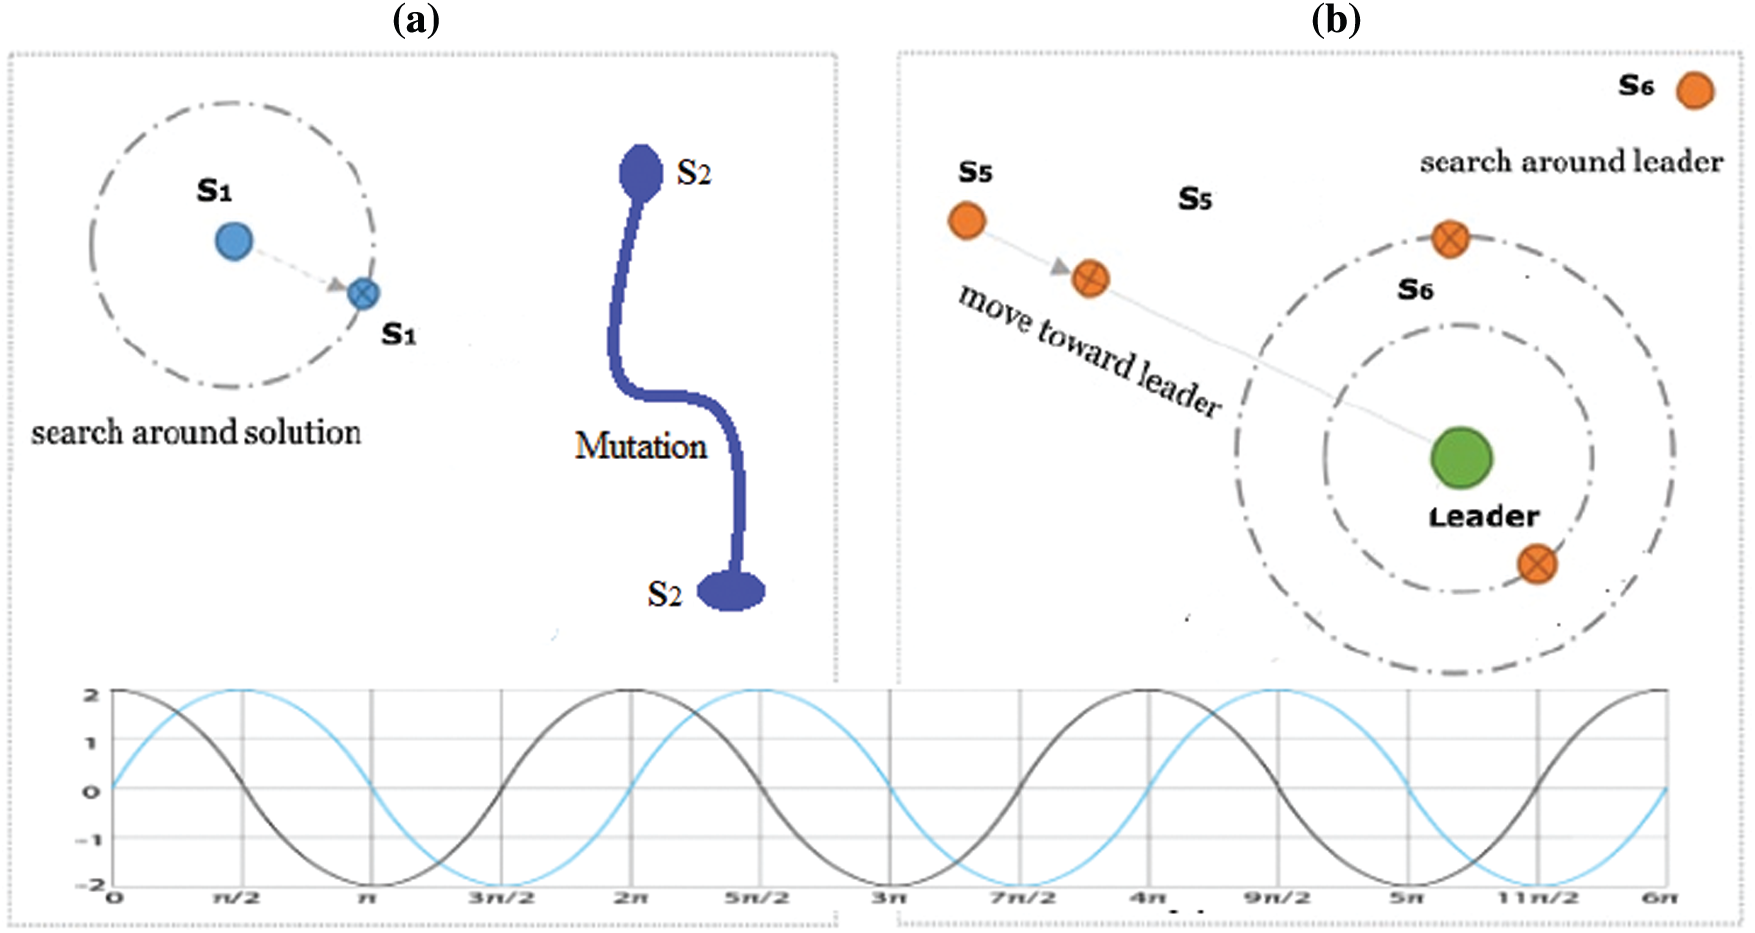
Figure 5: The proposed SCDG algorithm’s exploration and exploitation processes. (a) Exploration group, (b) Exploitation group
5.1 Metrics of Performance Evaluation
The AUC (area under the ROC curve) and MSE (Mean Square Error) metrics were employed in this experiment as performance metrics. AUC or balanced accuracy indicates the classification performance independently between class distribution [20]. For binary classification, AUC can be directly calculated as the average of sensitivity and specificity, resulting in binary predictions rather than scores. The balanced accuracy or AUC value is mathematically expressed as:
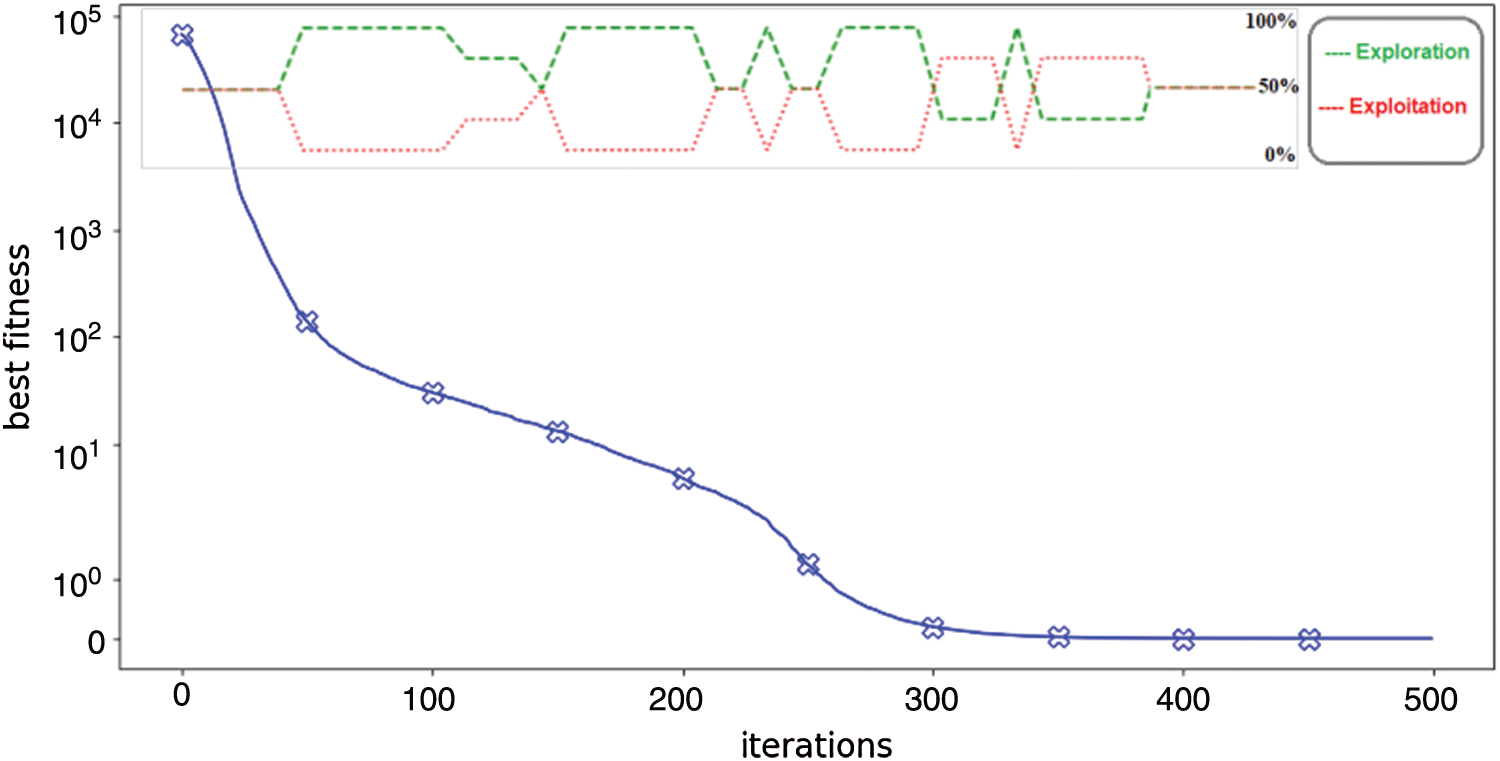
Figure 6: Balancing between exploitation and exploration in the proposed SCDG algorithm

Mean Square Error or MSE indicates the performance of the classifiers. The MSE value is mainly based on the difference between the actual and the required value of the classifier’ output using the following form:
where n is the number of outputs when the
In the first experiment, the output results for the single classifiers SVM, NN, KNN, and Random Forest (RF) are shown in Tab. 3. As the table shows, the single classifier of Random Forest achieved the AUC percentage of 0.823, which was the highest value among single classifiers, with the minimum MSE being 0.042853. However, this is not an acceptable percentage and can be improved based on ensemble techniques. The second experiment’s results comparing the proposed SCDG voting classifier with the bagging and majority-based ensemble learning methods are shown in Tab. 4. The proposed SCDG-based voting classifier achieved an AUC result of 0.989, which was much better than the compared ensemble techniques and the single classifiers. The MSE of the SCDG algorithm-based voting classifier (3.30E-06) was much better than the MSE of the bagging (0.0476) and the majority voting (0.007921) techniques.
The SCDG voting classifier was compared in the third experiment with the voting classifiers based on PSO, WOA, GWO, and GA, and the output results are mentioned in Tab. 5. The results show the superiority of the proposed SCDG voting classifier, with an AUC of 0.989 and MSE of 3.30E-06 compared to the voting PSO (AUC = 0.931), voting WOA (AUC = 0.913), voting GWO (AUC = 0.925), and voting GA (AUC = 0.872). To show the proposed SCDG optimization algorithm’s performance versus other optimization algorithms of PSO, WOA, GWO, and GA, Fig. 7 shows the algorithms’ convergence curves.


As seen from the results, the proposed algorithm obtains a better solution in minimum time. To confirm the proposed SCDG voting classifier’s effectiveness with other voting classifiers based on PSO, WOA, GWO, and GA algorithms through visualization, Fig. 8 shows the respective ROCs. Tab. 6 lists the results for this curve. As shown from the output results in Tab. 6, the proposed SCDG classifier achieved an area under the curve of about 1.0. Therefore, the proposed classifier has a performance that can distinguish the data in supply chain 4.0 with a high AUC.

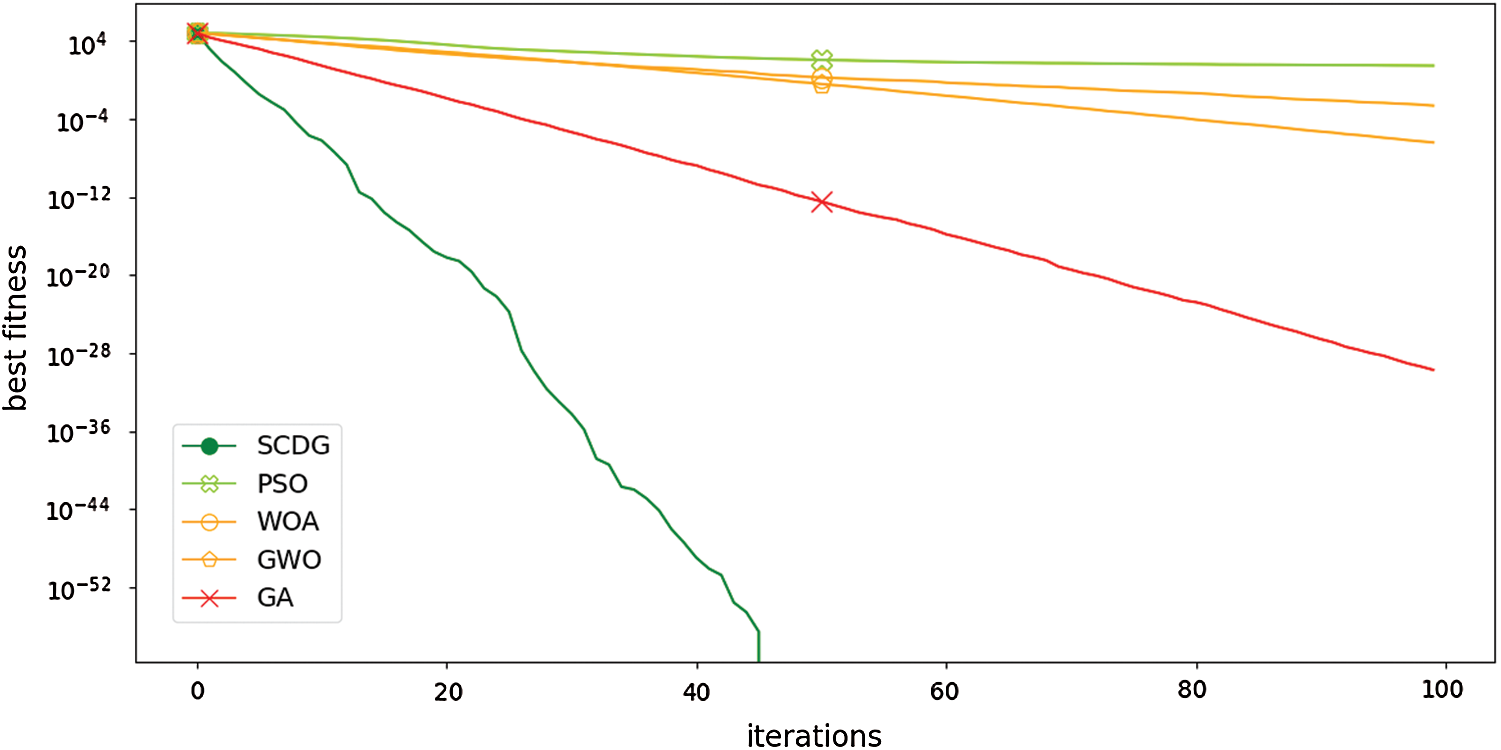
Figure 7: Convergence curve of the proposed SCDG algorithm vs. compared optimization algorithms
The ANOVA test was first applied to identify the statistical difference between the MSE of the proposed SCDG voting classifier and other compared classifiers. Two hypotheses, the null hypothesis and alternate hypothesis, were formulated. The null hypothesis was (
 ), and the alternate hypothesis was (H1: non-equal means). Tab. 7 shows the descriptive statistics of the data. The results of the ANOVA test are provided in Tab. 8. Fig. 8 also shows the ANOVA test results based on the proposed voting SCDG classifier’s objective function and the compared classifiers. The results show that the alternate hypothesis H1 was accepted.
Wilcoxon’s rank-sum test was then employed to obtain the p-values between the proposed SCDG voting classifier and other classifiers. The main aim of this test was to determine whether the results of the proposed SCDG voting classifier and different classifiers had a significant difference. p-value < 0.05 means significant superiority of the SCDG classifier. If the p-value ¿ 0.05, it means that there is no significant difference. Two hypotheses, the null hypothesis and alternate hypothesis, were formulated for this test also. The null hypothesis was 
 , and the alternate hypothesis was (H1: non-equal means). The p-value results are presented in Tab. 9. The p-values were less than 0.05. This was achieved for the results between the proposed SCDG classifier and other classifiers. The results showed superiority of the proposed classifier and the statistical significance of the classifier. The alternate hypothesis H1 was accepted.
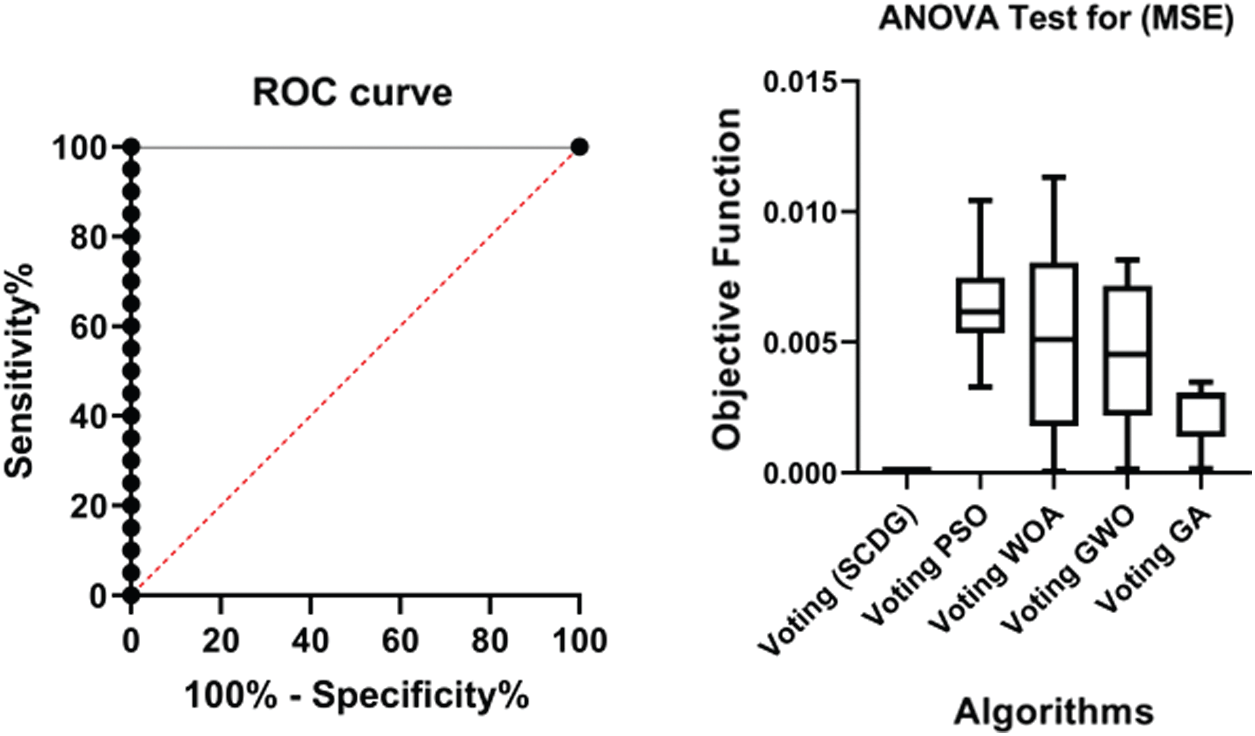
Figure 8: SCDG voting classifier vs. other voting classifiers

The possible issues could be observed from the recurring values as well as the residual plots as opposed to the original dataset plot. Some datasets are not good for classification. The ideal situation is attained if the residual values are equally randomly spaced around the horizontal axis. The residual value is calculated as (Real value - Predicted value), with the mean and sum of the residuals equal to zero. Fig. 9 shows the residual plot. The heteroscedasticity plot, also shown in Fig. 9, can help discover violations of assumptions, thus boosting the credibility of the research study’s findings.
Homoscedasticity describes a situation in which the error term (arbitrary disturbance in the connection between the dependent variable and the independent variables, or noise) is the same throughout the independent variables’ values. The quantile-quantile (QQ) plot, shown in Fig. 9, is known as a chance plot. It is mostly used by plotting the quantiles and comparing them to contrast two probability distributions. As the figure shows, the points’ distributions in the QQ approximately fit the line. Therefore, the actual and the forecasted residuals were linearly related, thus validating the recommended SCDG ballot classifier’s efficiency in identifying operational threats in the supply chain 4.0.


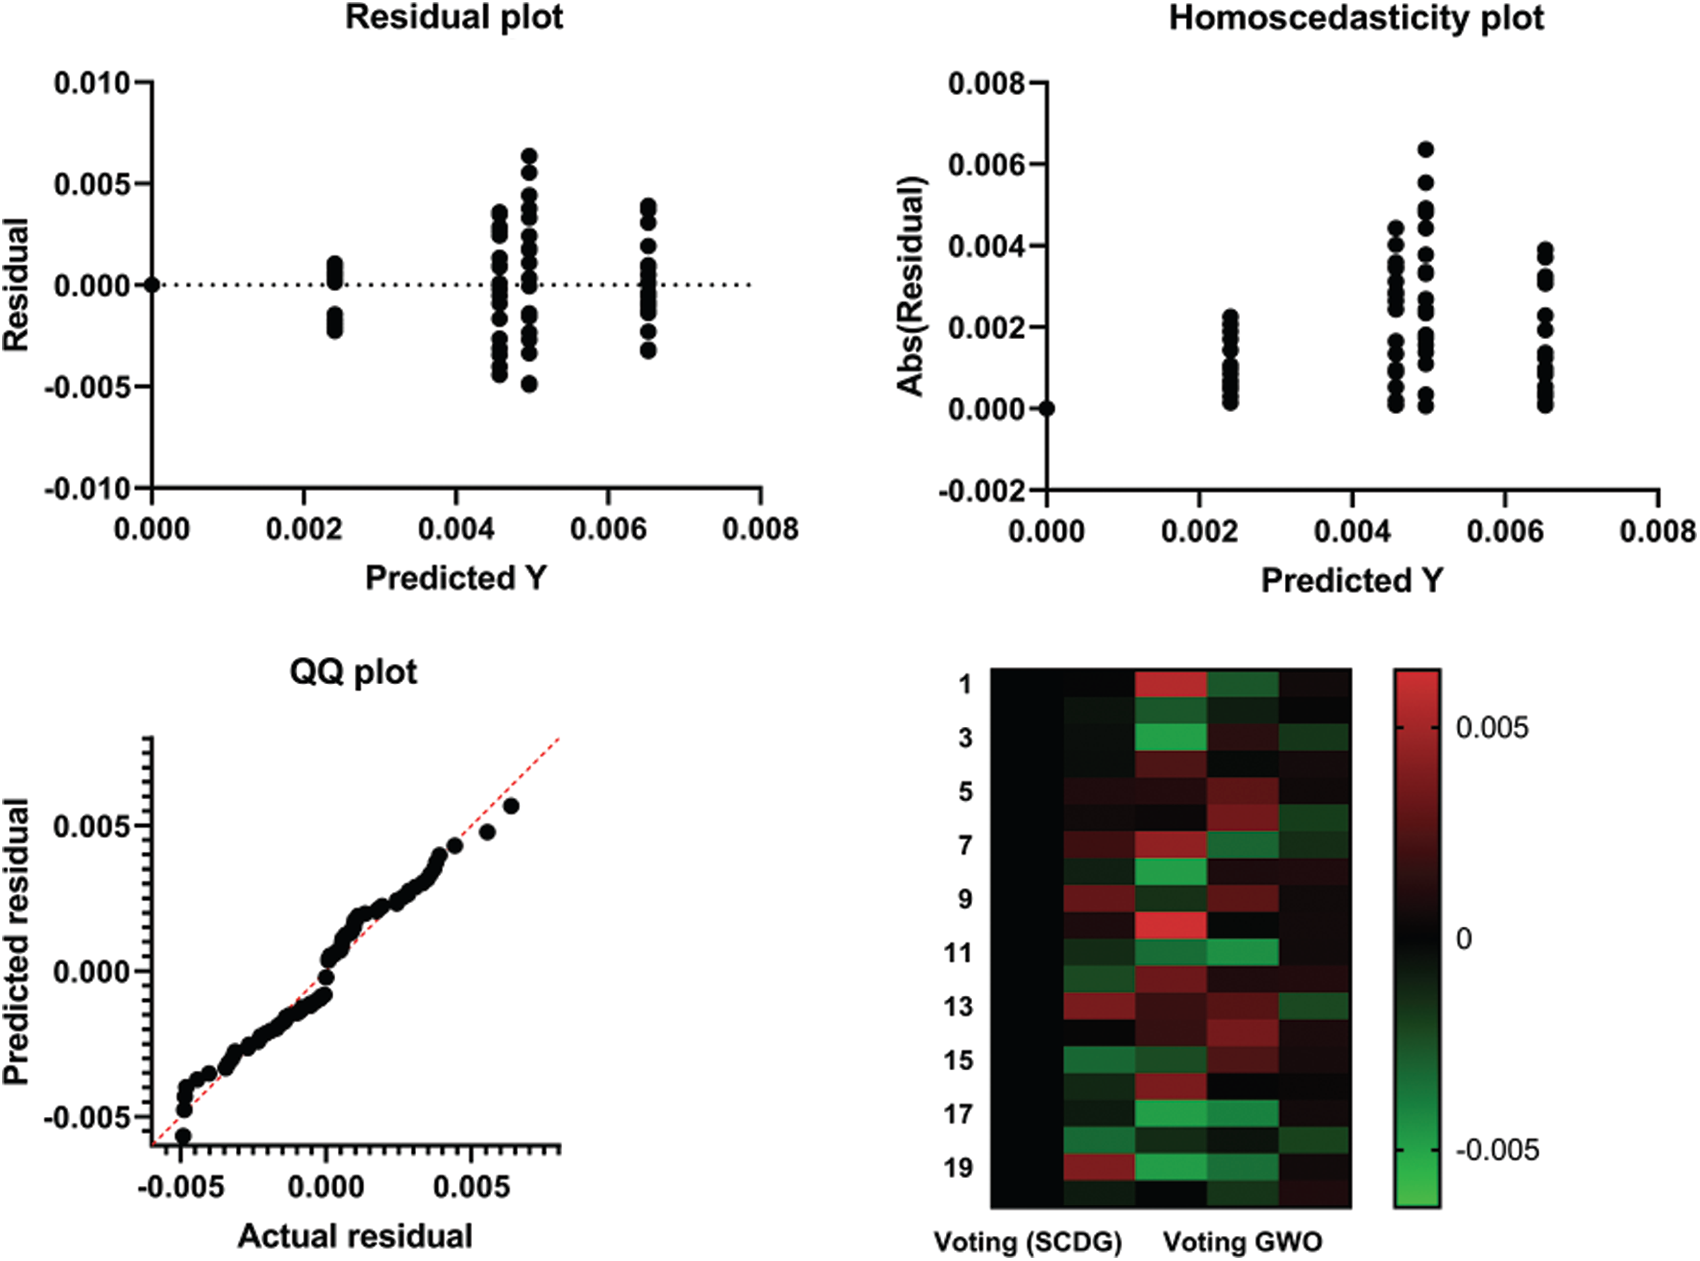
Figure 9: Residuals vs. Fits Plot
Supply chain management systems’ fourth revolution, called supply chain 4.0, integrates the manufacturing operations of the supply chain, telecommunication, and information technology processes. Supply chain 4.0 aims to improve supply chains’ production systems and profitability; however, it suffers from different operational and disruptive risks. A voting classifier based on a proposed optimization algorithm is proposed in this paper to identify the operational risks in the supply chain 4.0. The Sine Cosine Dynamic Group (SCDG) algorithm is proposed. The mechanisms of exploitation and exploration of the original Sine Cosine Algorithm (CSA) are adjusted by dynamic groups that are updated based on some conditions during the iterations. External and internal features were collected and analyzed from different data sources of service level agreements (SLAs) and various KSA firms’ transaction data to validate the proposed algorithm’s efficiency. A high balanced accuracy or AUC and a Minimum Mean Square Error (MSE) were achieved compared with other optimization-based classifiers. The ANOVA and Wilcoxon-rank-sum tests were performed, which showed the superiority of the proposed SCDG voting classifier. Thus, the experimental results indicate the effectiveness of the proposed SCDG algorithm-based voting classifier.
Acknowledgement: We thank LetPub (https://www.letpub.com) for its linguistic assistance during the preparation of this manuscript.
Funding Statement: The authors received no specific funding for this study.
Conflicts of Interest: The authors declare that they have no conflicts of interest to report regarding the present study.
1. G. A. Zsidisin, “A grounded definition of supply risk,” Journal of Purchasing and Supply Management, vol. 9, no. 5–6, pp. 217–224, 2003. [Google Scholar]
2. J. Reason, Managing the risks of organizational accidents, 1st ed., London: Routledge, 2016. [Google Scholar]
3. W. Ho, T. Zheng, H. Yildiz and S. Talluri, “Supply chain risk management: A literature review,” International Journal of Production Research, vol. 53, no. 16, pp. 5031–5069, 2015. [Google Scholar]
4. G. A. Zsidisin and L. M. Ellram, “An agency theory investigation of supply risk management,” The Journal of Supply Chain Management, vol. 39, no. 3, pp. 15–27, 2003. [Google Scholar]
5. A. Salamai, O. K. Hussain, M. Saberi, E. Chang and F. K. Hussain, “Highlighting the importance of considering the impacts of both external and internal risk factors on operational parameters to improve supply chain risk management,” IEEE Access, vol. 7, no. 1, pp. 49297–49315, 2019. [Google Scholar]
6. N. Slack and A. Brandon-Jones, Operations and process management: Principles and practice for strategic impact, 5th ed., Los Alamitos, CA, USA: Pearson, 2018. [Google Scholar]
7. J. Chen, A. S. Sohal and D. I. Prajogo, “Supply chain operational risk mitigation: A collaborative approach,” International Journal of Production Research, vol. 51, no. 7, pp. 2186–2199, 2013. [Google Scholar]
8. D. A. Rangel, T. K. de Oliveira and M. S. A. Leite, “Supply chain risk classification: Discussion and proposal,” International Journal of Production Research, vol. 53, no. 22, pp. 6868–6887, 2014. [Google Scholar]
9. R. Weijermars, A. Johnson, J. Denman, K. Salinas and G. Williams, “Creditworthiness of north american oil companies and minsky financing categories: Assessment of shifts due to the 2014–2016 oil price shock,” Journal of Functional Analysis, vol. 6, no. 6, pp. 162–180, 2019. [Google Scholar]
10. F. Aqlan and S. S. Lam, “A fuzzy-based integrated framework for supply chain risk assessment,” International Journal of Production Economics, vol. 161, no. 108, pp. 54–63, 2015. [Google Scholar]
11. N. Carbonara and R. Pellegrino, “Real options approach to evaluate postponement as supply chain disruptions mitigation strategy,” International Journal of Production Research, vol. 56, no. 15, pp. 5249–5271, 2017. [Google Scholar]
12. C. Colicchia and F. Strozzi, “Supply chain risk management: A new methodology for a systematic literature review,” Supply Chain Management An International Journal, vol. 17, no. 4, pp. 403–418, 2012. [Google Scholar]
13. R. Pellegrino, N. Costantino and D. Tauro, “Supply chain finance: a supply chain-oriented perspective to mitigate commodity risk and pricing volatility,” Journal of Purchasing and Supply Management, vol. 25, no. 2, pp. 118–133, 2019. [Google Scholar]
14. D. Ivanov, A. Dolgui and B. Sokolov, “The impact of digital technology and industry 4.0 on the ripple effect and supply chain risk analytics,” International Journal of Production Research, vol. 57, no. 3, pp. 829–846, 2018. [Google Scholar]
15. M. M. Parast and M. Shekarian, “The impact of supply chain disruptions on organizational performance: A literature review,” Springer Series in Supply Chain Management, vol. 7, pp. 367–389, 2018. [Google Scholar]
16. A. Salamai, M. Saberi, O. Hussain and E. Chang, “Risk identification-based association rule mining for supply chain big data,” in Security, Privacy, and Anonymity in Computation, Communication, and Storage, LNCS, vol. 11342, pp. 219–228, 2018. [Google Scholar]
17. R. Bello, Y. Gomez, A. Nowe and M. M. Garcia, “Two-step particle swarm optimization to solve the feature selection problem,” Proc. ISDA, vol. 1, pp. 691–696, 2007. [Google Scholar]
18. A. Ibrahim, M. Noshy, H. A. Ali and M. Badawy, “PAPSO: A poweraware VM placement technique based on particle swarm optimization,” IEEE Access, vol. 8, no. 1, pp. 81747–81764, 2020. [Google Scholar]
19. S. Mirjalili and A. Lewis, “The whale optimization algorithm,” Advances in Engineering Software, vol. 95, no. c, pp. 51–67, 2016. [Google Scholar]
20. E.-S. M. El-kenawy, A. Ibrahim, S. Mirjalili, M. M. Eid and S. E. Hussein, “Novel feature selection and voting classifier algorithms for COVID-19 classification in CT images,” IEEE Access, vol. 8, no. 1, pp. 179317–179335, 2020. [Google Scholar]
21. E.-S. M. El-kenawy and M. Eid, “Hybrid gray wolf and particle swarm optimization for feature selection,” International Journal of Innovative Computing, Information and Control, vol. 16, no. 3, pp. 831–844, 2020. [Google Scholar]
22. A. Ibrahim, A. Tharwat, T. Gaber and A. E. Hassanien, “Optimized superpixel and adaboost classifier for human thermal face recognition,” Signal, Image and Video Processing, vol. 12, pp. 711–719, 2018. [Google Scholar]
23. M. M. Kabir, M. Shahjahan and K. Murase, “A new local search-based hybrid genetic algorithm for feature selection,” Neurocomputing, vol. 74, no. 17, pp. 2914–2928, 2011. [Google Scholar]
24. E.-S. M. El-Kenawy, M. M. Eid, M. Saber and A. Ibrahim, “MbGWO-SFS: Modified binary grey wolf optimizer based on stochastic fractal search for feature selection,” IEEE Access, vol. 8, no. 1, pp. 107635–107649, 2020. [Google Scholar]
25. R. L. Kliem and I. S. Ludin, Reducing project risk, 1st ed., London, United Kingdom: Routledge, 2019. [Google Scholar]
26. L. Tchankova, “Risk identification-basic stage in risk management,” Environmental Management and Health, vol. 13, no. 3, pp. 290–297, 2002. [Google Scholar]
27. T. Aven, “Risk assessment and risk management: Review of recent advances on their foundation,” European Journal of Operational Research, vol. 253, no. 1, pp. 1–13, 2016. [Google Scholar]
28. N. J. Bahr, System safety engineering and risk assessment, 2nd ed., Boca Raton: CRC Press, 2018. [Google Scholar]
29. M. L. Brusseau, I. L. Pepper and C. P. Gerba, Environmental and pollution science, 3rd ed., London, United Kingdom: Academic Press, Elsevier, 2019. [Google Scholar]
30. K. P. Scheibe and J. Blackhurst, “Supply chain disruption propagation: A systemic risk and normal accident theory perspective,” International Journal of Production Research, vol. 56, no. 1–2, pp. 43–59, 2017. [Google Scholar]
31. G. Behzadi, M. J. O’Sullivan, T. L. Olsen and A. Zhang, “Agribusiness supply chain risk management: A review of quantitative decision models,” Omega, vol. 79, no. c, pp. 21–42, 2018. [Google Scholar]
32. Logic manager, Supply Chain Risk Management Software, 2021. [Online]. Available: https://www.logicmanager.com/erm-software/plugins/supply-chain-risk-management-software/, Accessed: 2021-3-21. [Google Scholar]
33. A. Ibrahim, S. Mohammed, H. A. Ali and S. E. Hussein, “Breast cancer segmentation from thermal images based on chaotic salp swarm algorithm,” IEEE Access, vol. 8, no. 1, pp. 122121–122134, 2020. [Google Scholar]
34. A. Ibrahim, H. A. Ali, M. M. Eid and E.-S. M. El-Kenawy, “Chaotic harris hawks optimization for unconstrained function optimization,” in 2020 16th Int. Computer Engineering Conf., Cairo, Egypt, IEEE, pp. 153–158, 2020. [Google Scholar]
35. M. M. Eid, E.-S. M. El-Kenawy and A. Ibrahim, “Anemia estimation for covid-19 patients using a machine learning model,” Journal of Computer Science and Information Systems, vol. 17, no. 11, pp. 1–7, 2021. [Google Scholar]
36. E. M. Hassib, A. I. El-Desouky, L. M. Labib and E.-S. M. T. El-Kenawy, “WOA + BRNN: An imbalanced big data classification framework using whale optimization and deep neural network,” Soft Computing, vol. 24, no. 8, pp. 5573–5592, 2020. [Google Scholar]
37. H. R. Hussien, E.-S. M. El-Kenawy and A. I. El-Desouky, “EEG channel selection using a modified grey wolf optimizer,” European Journal of Electrical Engineering and Computer Science, vol. 5, no. 1, pp. 17–24, 2021. [Google Scholar]
38. A. Elhosuieny, M. Salem, A. Thabet and A. Ibrahim, “ADOMC-NPR automatic decision-making offloading framework for mobile computation using nonlinear polynomial regression model,” International Journal of Web Services Research, vol. 16, no. 4, pp. 53–73, 2019. [Google Scholar]
39. A. Ibrahim, A. Ahmed, S. Hussein and A. E. Hassanien, “Fish image segmentation using salp swarm algorithm,” in Proc. Int. Conf. on Advanced Machine Learning Technologies and Applications, Advances in Intelligent Systems and Computing, vol. 723, Cham, Springer, 2018. [Google Scholar]
40. B. Tjahjono, C. Esplugues, E. Ares and G. Pelaez, “What does industry 4.0 mean to supply chain?,” Procedia Manufacturing, vol. 13, pp. 1175–1182, 2017. [Google Scholar]
41. H. Lasi, P. Fettke, H.-G. Kemper, T. Feld and M. Hoffmann, “Industry 4.0,” Business & Information Systems Engineering, vol. 6, no. 4, pp. 239–242, 2014. [Google Scholar]
42. A. Salamai, O. Hussain and M. Saberi, “Decision support system for risk assessment using fuzzy inference in supply chain big data,” in Proc. 2019 Int. Conf. on High Performance Big Data and Intelligent Systems, Shenzhen, China, pp. 248–253, 2019. [Google Scholar]
43. D. D. Wu, S.-H. Chen and D. L. Olson, “Business intelligence in risk management: Some recent progresses,” Information Sciences, vol. 256, pp. 1–7, 2014. [Google Scholar]
44. G. Kłosowski and A. Gola, “Risk-based estimation of manufacturing order costs with artificial intelligence,” in Proc. of the 2016 Federated Conf. on Computer Science and Information Systems, Gdansk, Poland, IEEE, vol. 8, pp. 729–732, 2016. [Google Scholar]
45. V. C. Müller and N. Bostrom, “Future progress in artificial intelligence: A survey of expert opinion,” in Fundamental Issues of Artificial Intelligence, vol. 376, Cham, Switzerland: Springer International Publishing, pp. 555–572, 2016. [Google Scholar]
46. G. Baryannis, S. Validi, S. Dani and G. Antoniou, “Supply chain risk management and artificial intelligence: State of the art and future research directions,” International Journal of Production Research, vol. 57, no. 7, pp. 2179–2202, 2018. [Google Scholar]
47. S. Mirjalili, “SCA: A sine cosine algorithm for solving optimization problems,” Knowledge-Based Systems, vol. 96, pp. 120–133, 2016. [Google Scholar]
48. A. Tharwat, “Parameter investigation of support vector machine classifier with kernel functions,” Knowledge and Information Systems, vol. 61, pp. 1269–1302, 2019. [Google Scholar]
49. E.-S. M. El-Kenawy, S. Mirjalili, A. Ibrahim, M. Alrahmawy and M. El-Said, “Advanced meta-heuristics, convolutional neural networks, and feature selectors for efficient COVID-19 X-ray chest image classification,” IEEE Access, vol. 9, pp. 36019–36037, 2021. [Google Scholar]
50. M. M. Fouad, A. I. El-Desouky, R. Al-Hajj and E.-S. M. El-Kenawy, “Dynamic group-based cooperative optimization algorithm,” IEEE Access, vol. 8, pp. 148378–148403, 2020. [Google Scholar]
51. L. Breiman, “Random forests,” Machine Learning, vol. 45, no. 1, pp. 5–32, 2001. [Google Scholar]
 | This work is licensed under a Creative Commons Attribution 4.0 International License, which permits unrestricted use, distribution, and reproduction in any medium, provided the original work is properly cited. |