DOI:10.32604/cmc.2021.017795
| Computers, Materials & Continua DOI:10.32604/cmc.2021.017795 | |
| Article |
An Intelligent Graph Edit Distance-Based Approach for Finding Business Process Similarities
1Department of Computer Science, COMSATS University Islamabad, Lahore, Pakistan
2Faculty of Information and Communication Technology, Universiti Tunku Abdul Rahman, Kampar, Perak, Malaysia
3Universiti Teknologi PETRONAS, Bandar Seri Iskandar, Tronoh Perak, Malaysia
4Punjab University College of Information Technology, University of the Punjab, Lahore, Pakistan
*Corresponding Author: Mobashar Rehman. Email: mobashar@utar.edu.my
Received: 11 February 2021; Accepted: 20 April 2021
Abstract: There are numerous application areas of computing similarity between process models. It includes finding similar models from a repository, controlling redundancy of process models, and finding corresponding activities between a pair of process models. The similarity between two process models is computed based on their similarity between labels, structures, and execution behaviors. Several attempts have been made to develop similarity techniques between activity labels, as well as their execution behavior. However, a notable problem with the process model similarity is that two process models can also be similar if there is a structural variation between them. However, neither a benchmark dataset exists for the structural similarity between process models nor there exist an effective technique to compute structural similarity. To that end, we have developed a large collection of process models in which structural changes are handcrafted while preserving the semantics of the models. Furthermore, we have used a machine learning-based approach to compute the similarity between a pair of process models having structural and label differences. Finally, we have evaluated the proposed approach using our generated collection of process models.
Keywords: Machine learning; intelligent data management; similarities of process models; structural metrics; dataset; graph edit distance; process matching; artificial intelligence
Business Process Management (BPM) is composed of different techniques and methods for analysis, enactment, design, and management of business processes [1]. To achieve a competitive edge, business processes and their process models are analyzed to identify the deficiencies. Subsequently, these processes are redesigned to develop effective techniques. The benefits of business process models are manifolds [2]. They are used to support communication, documenting projects, and train employees. Typically, large organizations have hundreds or thousands of process models [3]. To effectively these process models, these organizations maintain repositories of process models. The key features of process model repositories including controlling redundant models and querying process models. The accuracy of these features depends upon the effectiveness of the underlying techniques that compute the similarity between a pair of process models [4].
An established study has proposed that the similarity between a pair of process models can be computed in terms of label, behavioral, and structural similarity [5]. Where label similarity relies on the textual labels of process model elements. That is, two process models are considered equivalent if a certain percentage of their activities have similar labels. In contrast, behavioral similarity techniques also take into account the execution behavior of business process models, in addition to the label similarity. As opposed to the first two types, structural similarity techniques take into consideration the topology of process models, as well as their activity labels. However, there is no benchmark collection of process models that can be used to evaluate the effectiveness of structural similarity techniques. Furthermore, it is desirable to develop techniques for the effective evaluation of structural process similarity.
To that end, in this study, we have developed a large collection of business process models which is composed of a substantial amount of structurally different process model variants. Furthermore, we have developed a graph edit distance-based technique to compute the similarity between a pair of process models. Lastly, we have evaluated the effectiveness of the proposed technique for its ability to detect structural changes. The rest of the paper is organized as follows: Section 2 demonstrates the details of generating our process model collection having a sufficiently large number of process variations. The structural metrics measurements and results are presented in Section 3. Section 4 presents our proposed approach for computing similarity between a pair of process models. Section 5 presents the details of our evaluation, including evaluation measures, and experimental settings. The paper concludes in Section 6.
2 Generating Process Model Collection
The first contribution of this paper is to develop the first-ever and the largest-ever collection of business process models in which the structural changes are manually induced in such a way that the semantics of the process models are not changed significantly. The benefits of the collection are the following: a) the process model collection is freely available for the research community which will be useful for fostering BPM research. And, b) the collection contains multiple variations which stem from the established literature. Hence, we contend that the developed resources will be useful for the evaluation of process similarity techniques.
Below, we discuss the theoretical grounds for structural changes that exist in literature and thereafter use these operations for generating process model variations. In particular, we start with the process model changes from a notable study [6] and the process flexibility patterns presented in [7]. Both the model change operations were synthesized to elicit a key set of change patterns to be used in this study. A key finding of the synthesis is that we shortlisted only those patterns that do not change the semantics of the process. For instance, from the first study [8], if the C and F variants are applied to a process model, it is likely to change the semantics of the model. Similarly, the adaptive patterns referred to as AP1, AP2, and AP4 [7], are likely to transform the semantics of a process model. Therefore, both these patterns were not used for generating process model variants.
2.1 Generating Multi-Variant Dataset
In order to generate a large collection of business process models having structural variations we identified five types of changes based on a comprehensive literature review. The changes are the following: Type-1: Addition of gateways, Type-2: Adjusting trivial activities, Type-3: Inserting control edges, Type-4: Reordering activities, and Type-5: Changing labels of the activities.
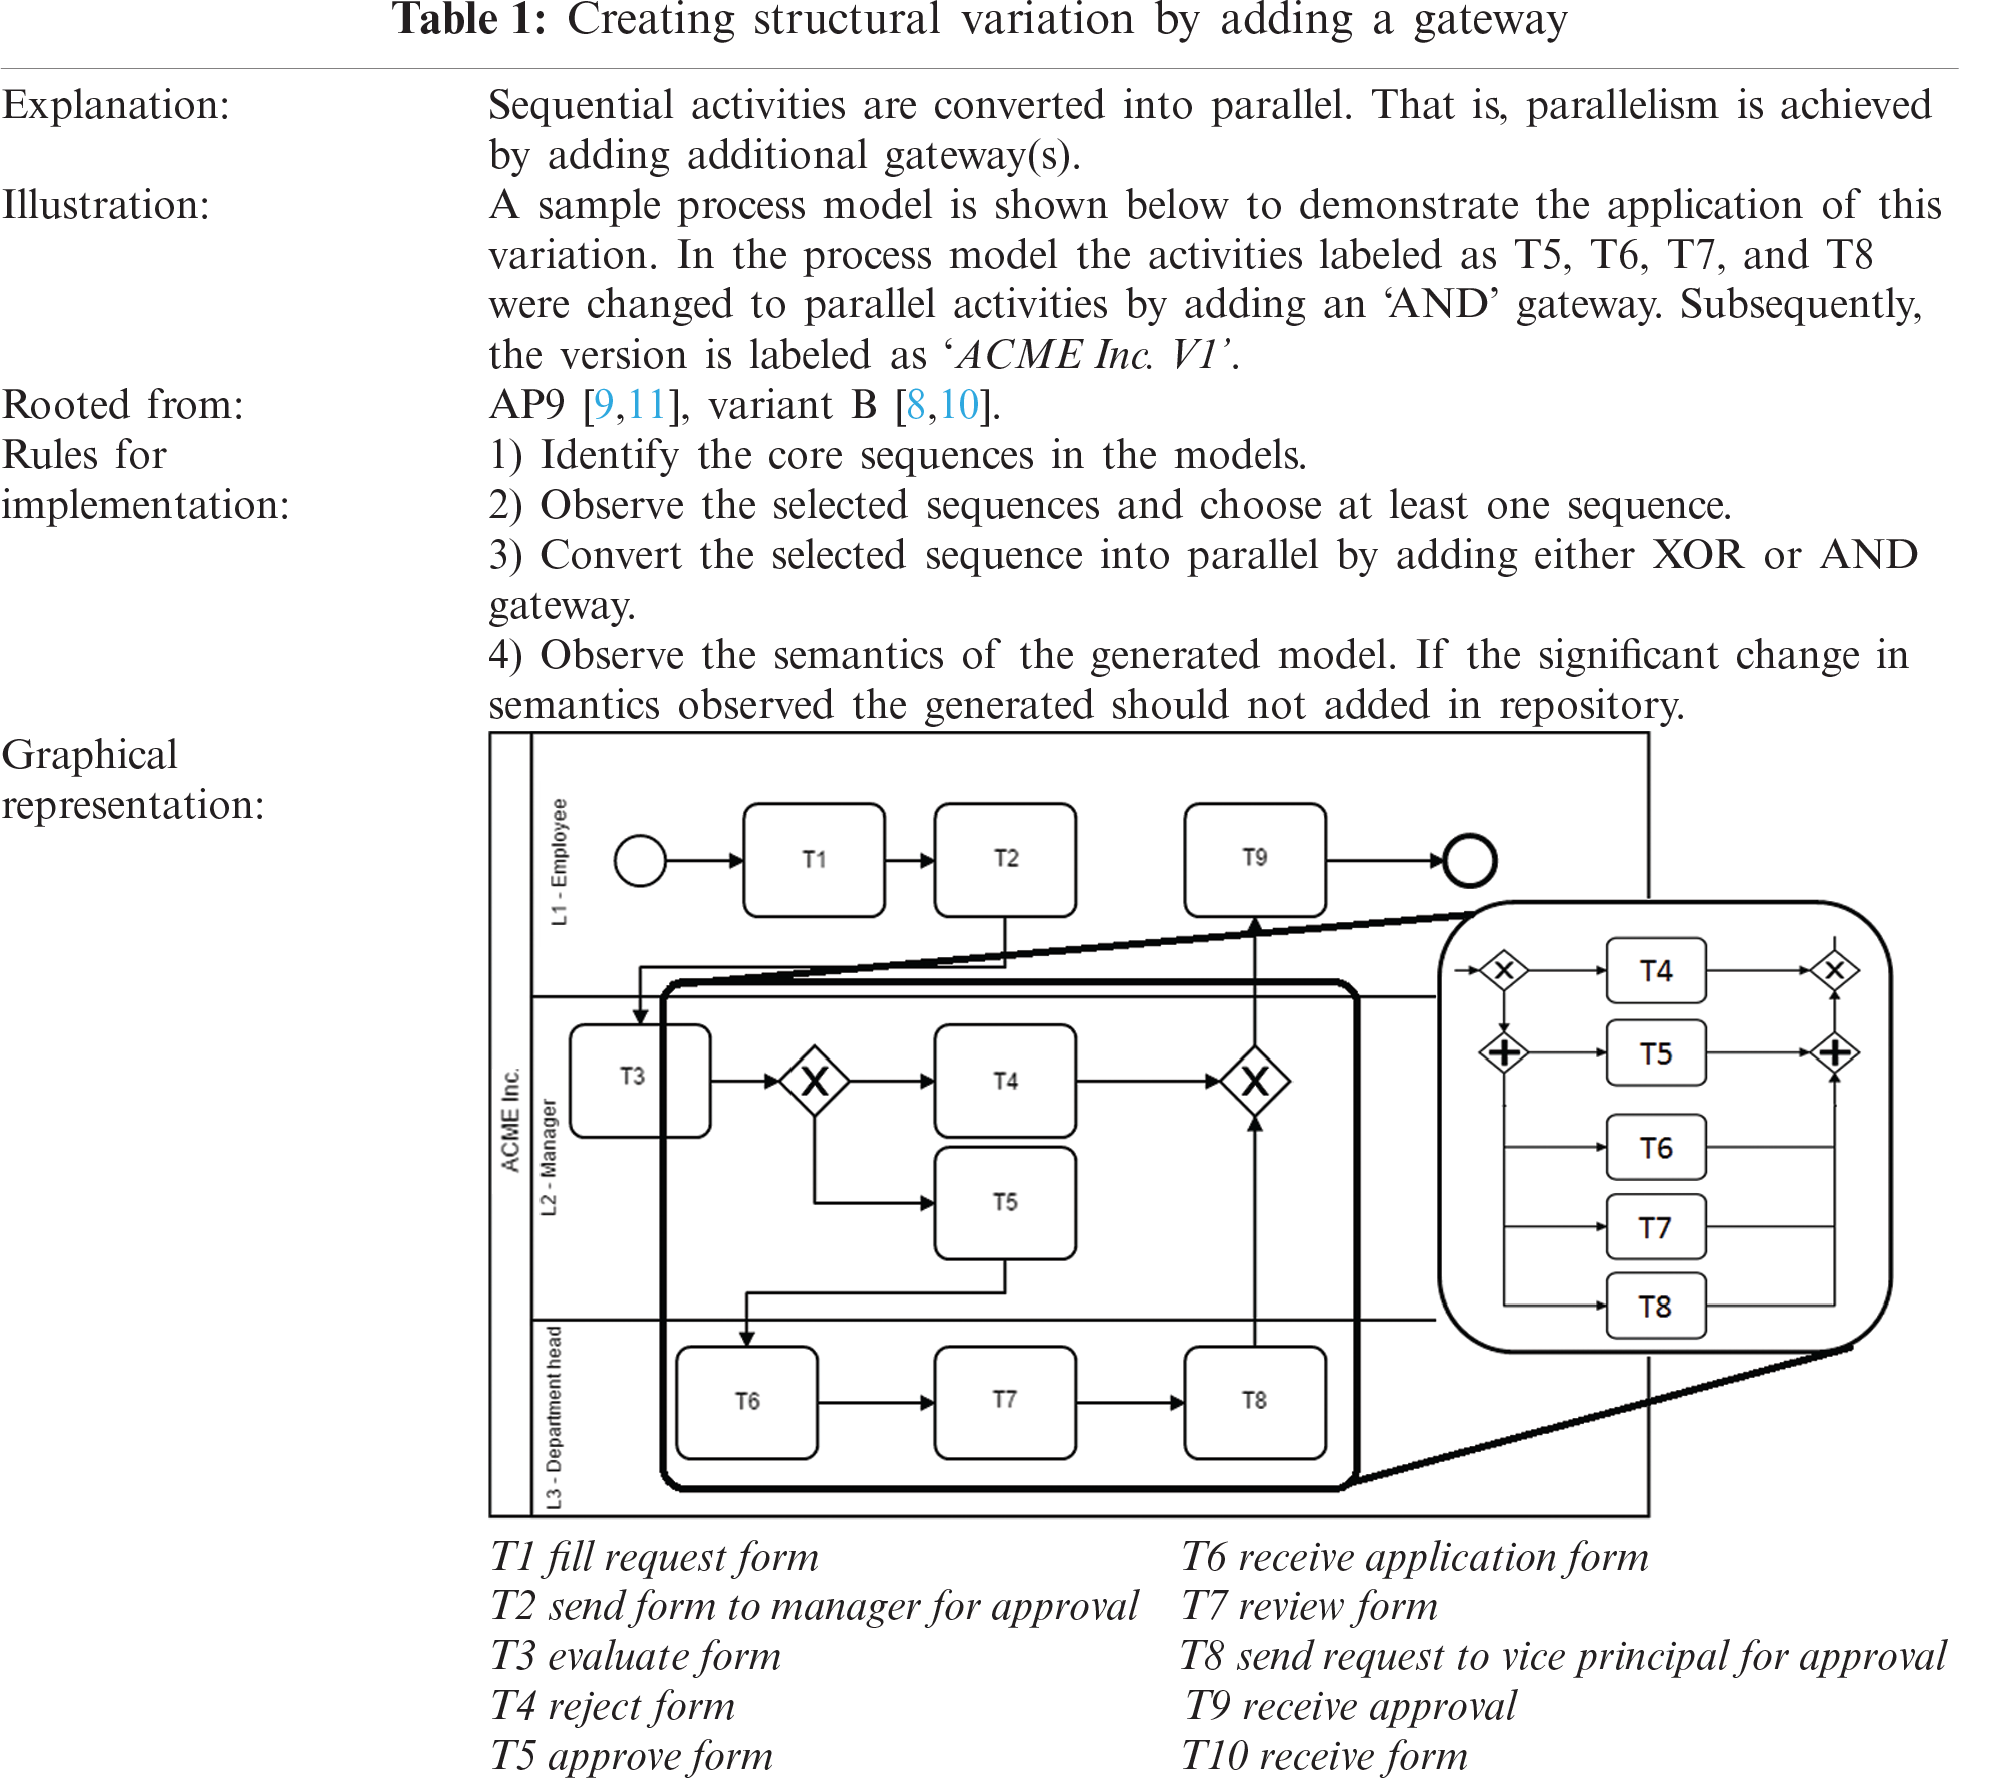
2.1.1 Type 1 Change: Addition of Gateways
The ‘Type-1’ change was proposed by multiple notable studies [6–11]. For inducing this type of change, the original process model the largest sequence of activities from the model is changed to parallel activities by adding an ‘AND’ gateway between them. The sequences which were not bounded in sequentially strict order were then converted to parallel. This change pattern is adopted from the Adaptive Pattern 9 (AP9) proposed in an existing study [11]. A similar change is also proposed in another study [8]. The details of this type and its implementation rules are explained in Tab. 1.
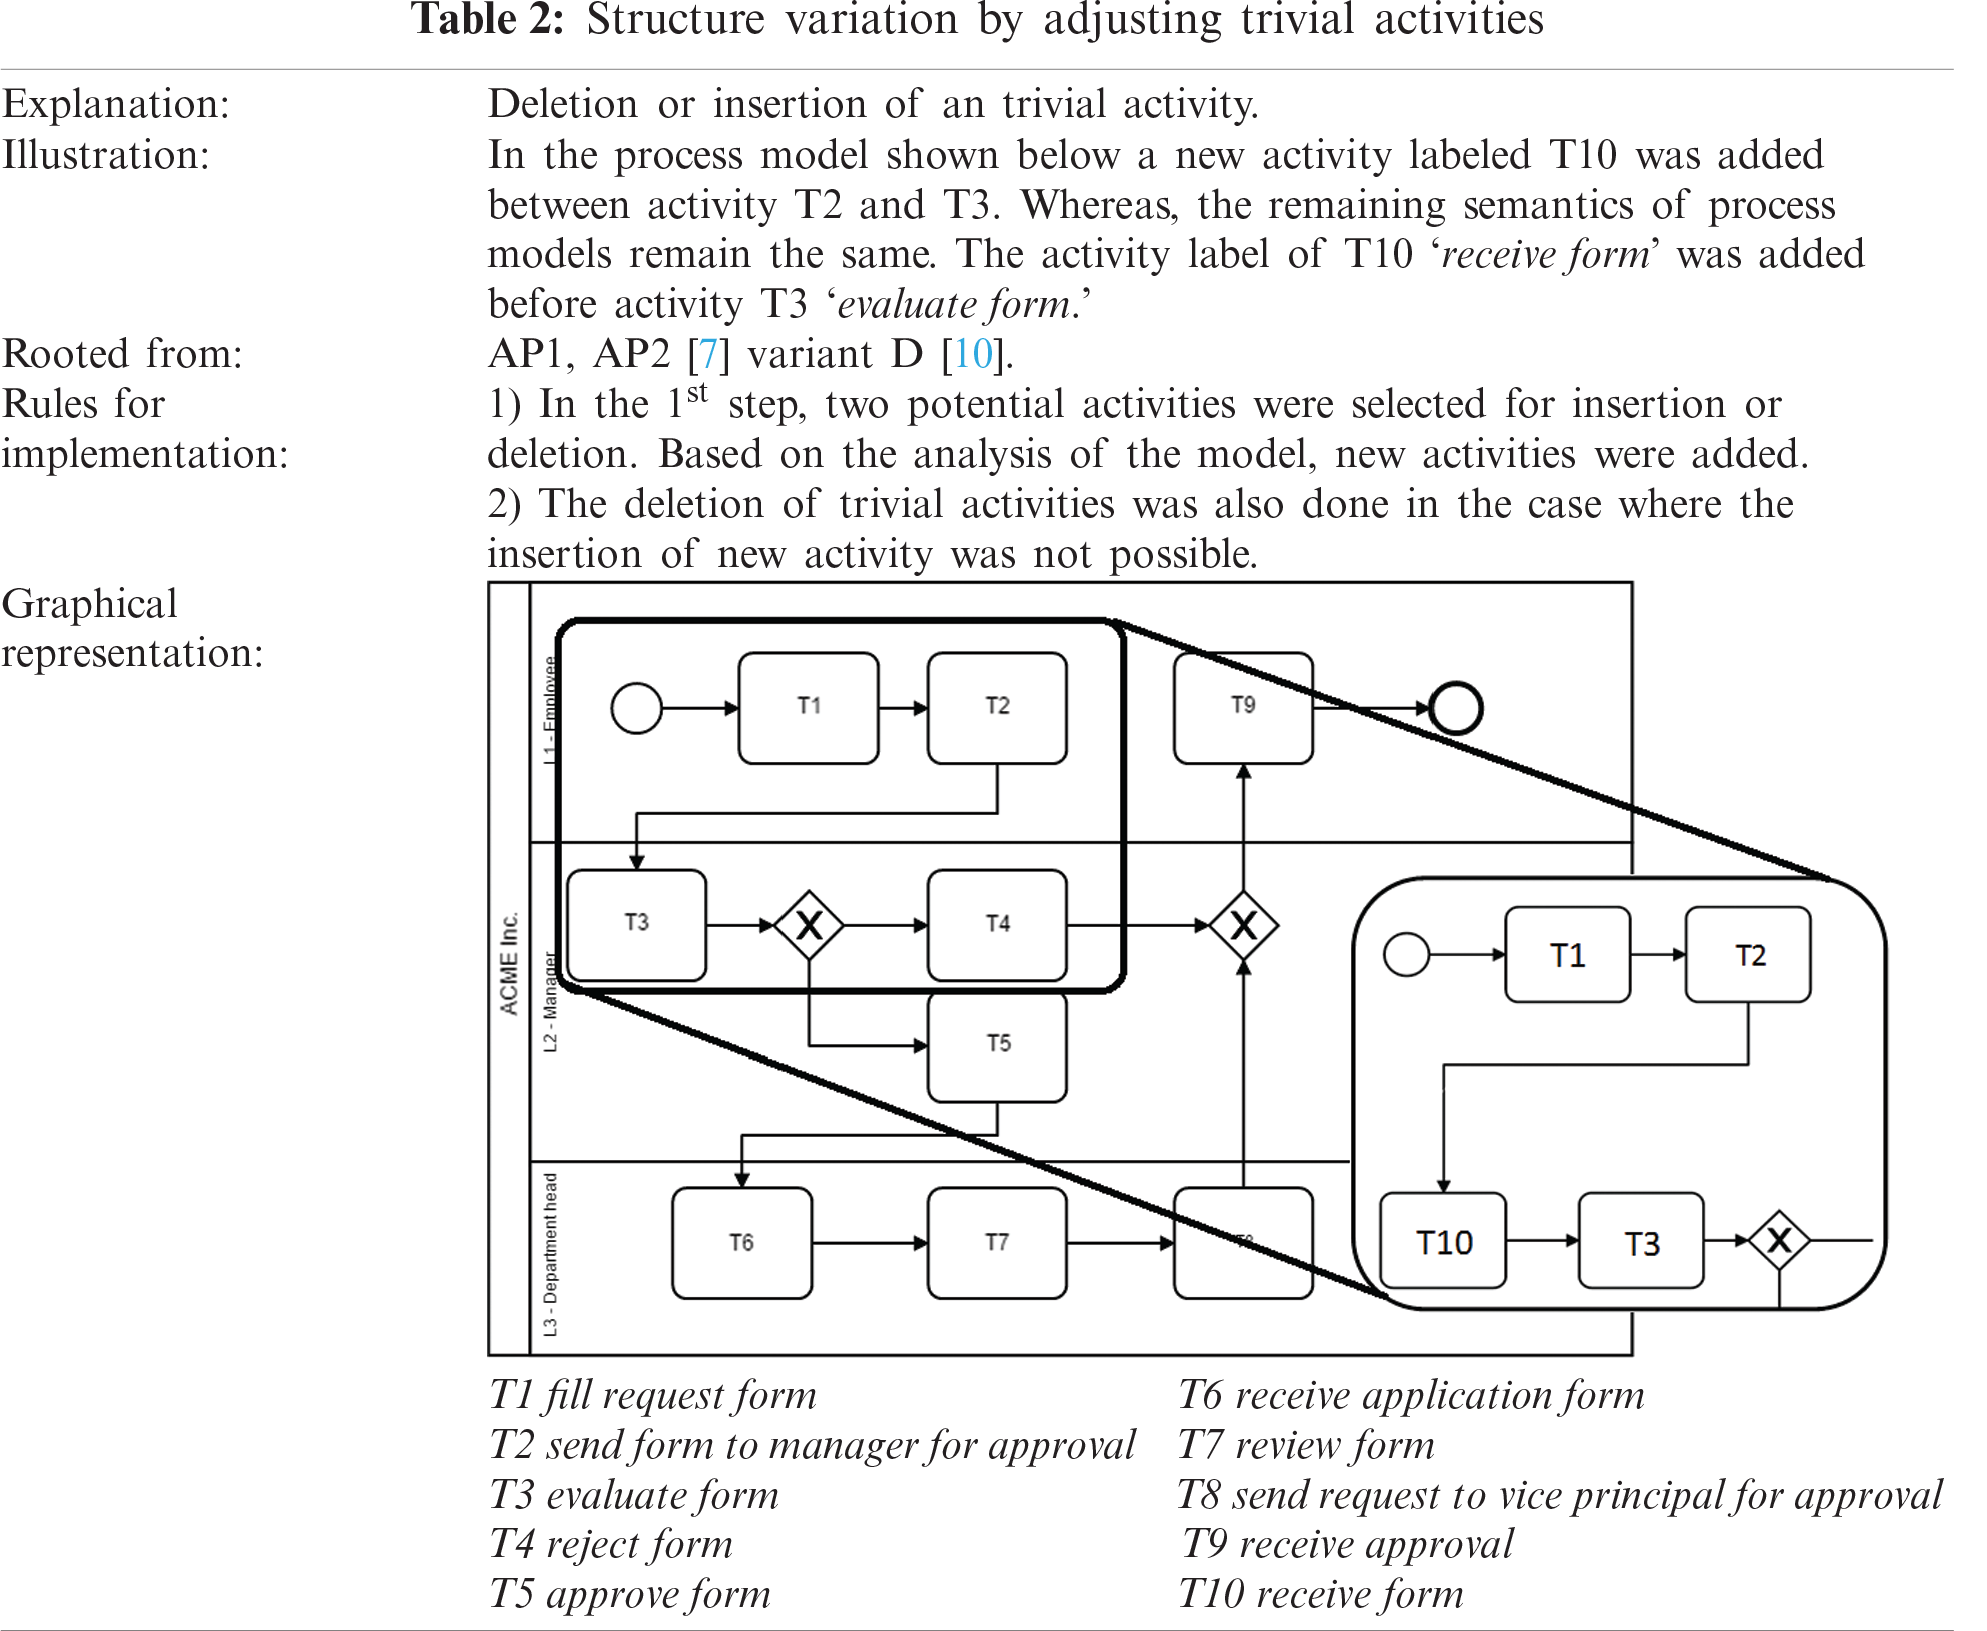
2.1.2 Type 2 Change: Adjusting Trivial Activities
The second type of variation is referred to as “Type-2” structural variation. This type of change stems from several notable studies [6–11]. A key feature of this change is that it involves inserting or deleting activities from process models. The complete representation of Type-2 change is shown in Tab. 2. At least one activity was deleted or inserted from the model given that the semantics of the original model remained unchanged. Trivial or unimportant activities were first selected and then only one activity was deleted. The Type-2 change pattern was adopted after combing the adaptive patterns AP1, AP2, and variation D proposed by [8,9].
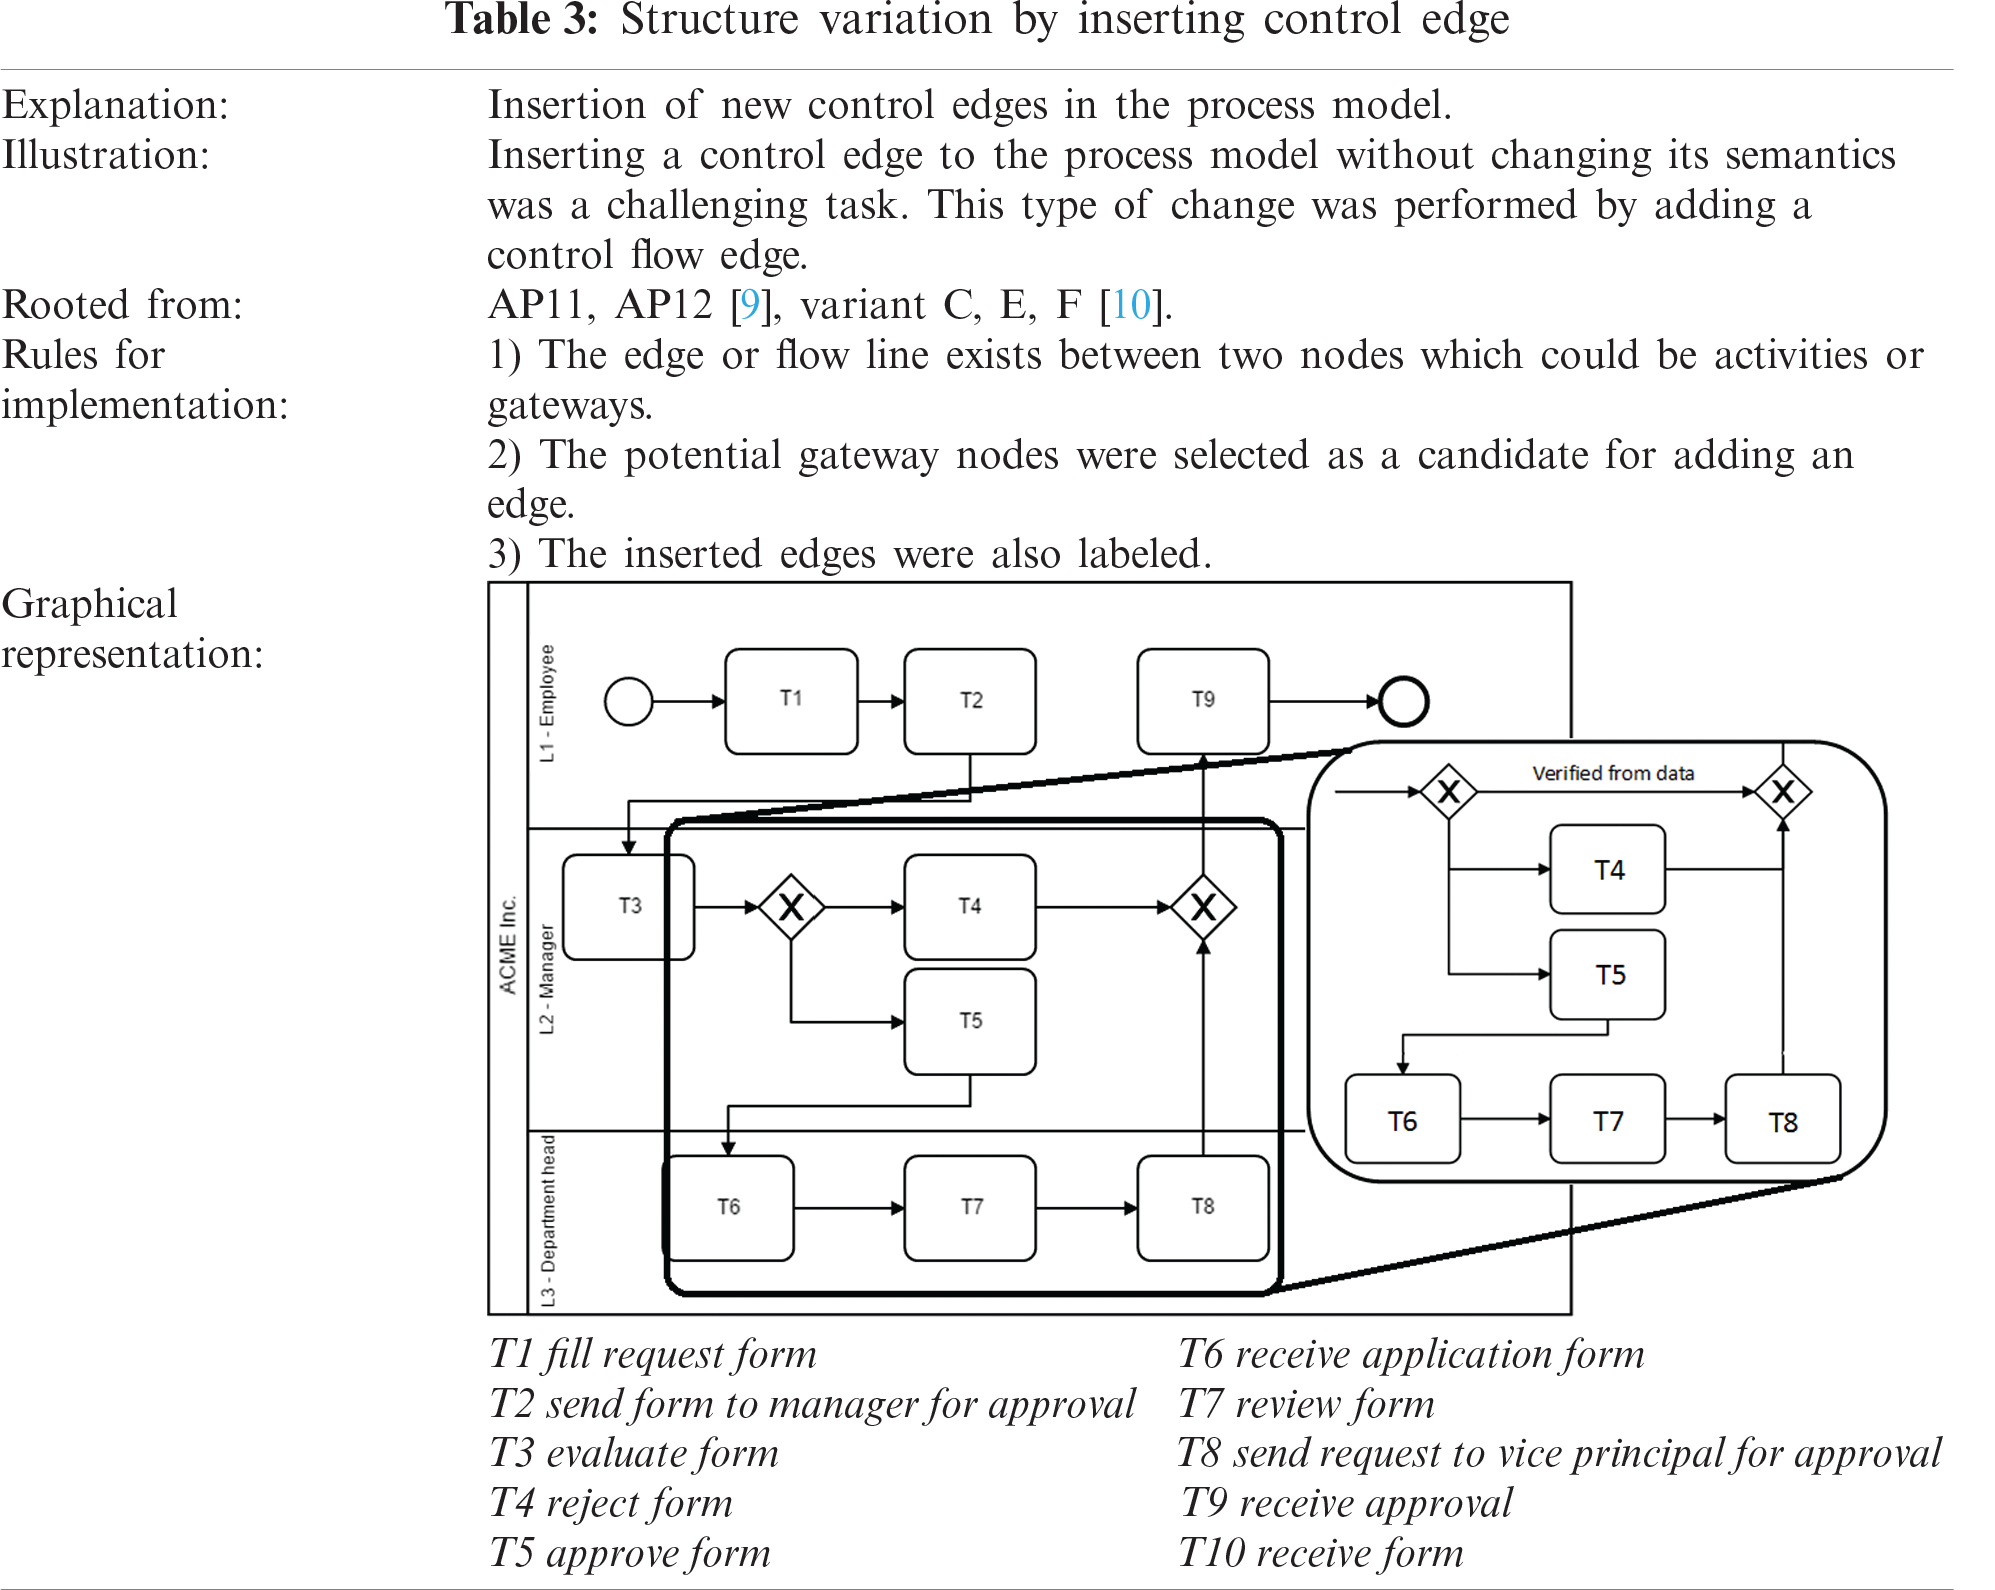
2.1.3 Type 3 Change: Inserting Control Edges
In Type-3 change, a control edge or control flow was inserted into the process model under consideration. This change is rooted in several existing studies [6–11]. More specifically, the AP11, AP12, variant C, variant E, and variant F, proposed in the studies were considered for the Type-3 change. The details of the Type-3 change are shown in Tab. 3.
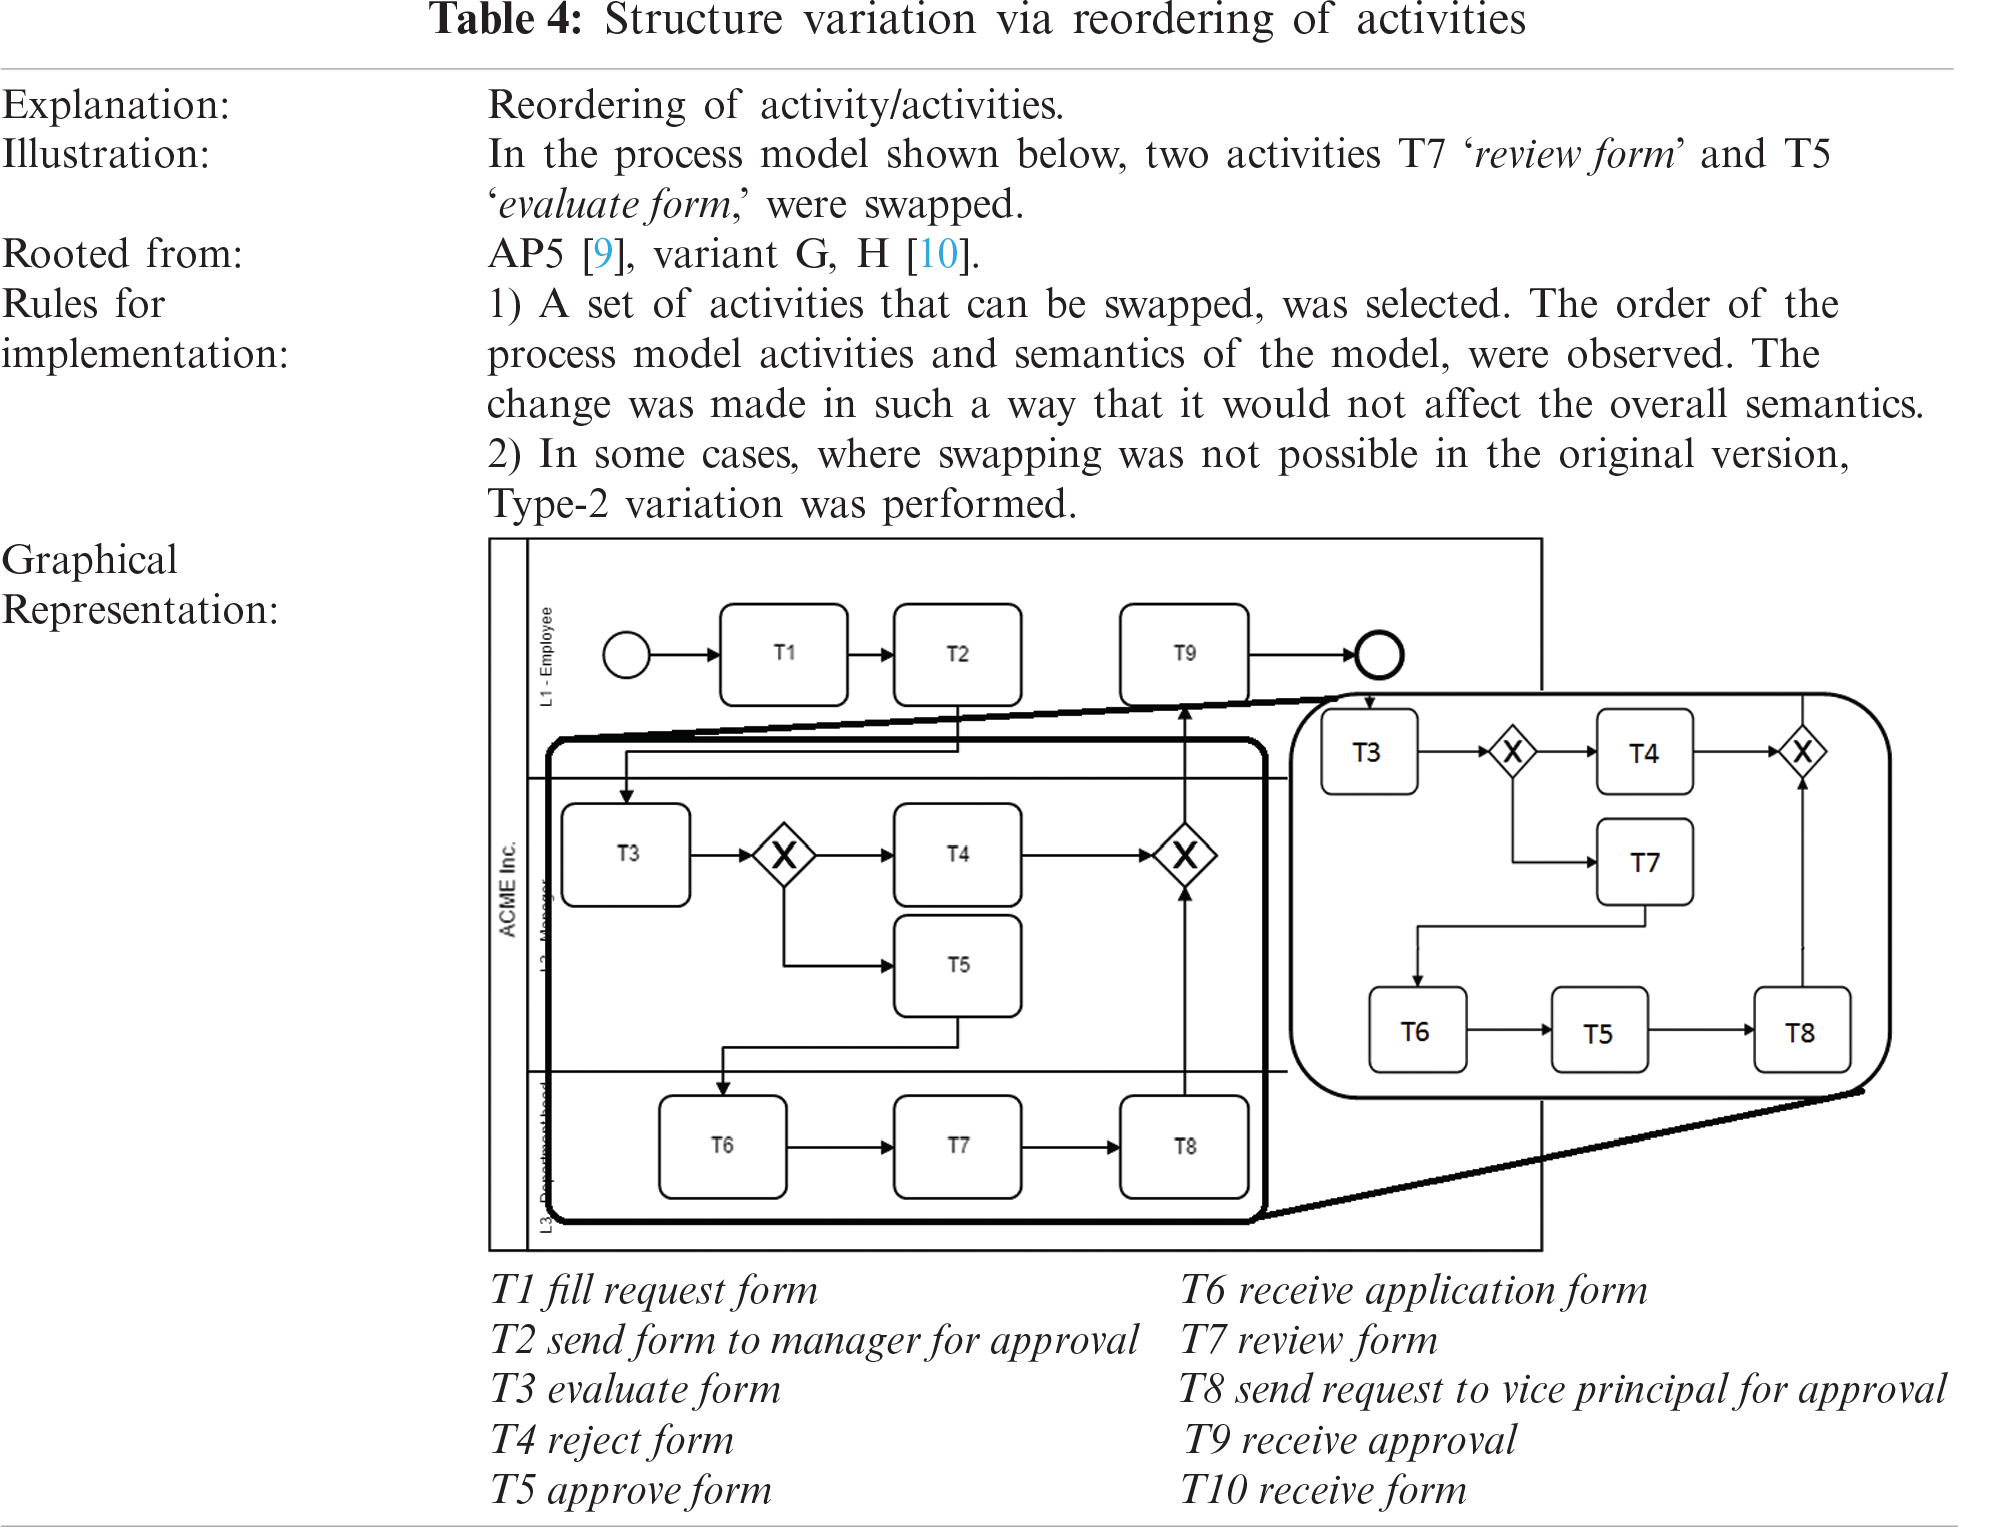
2.1.4 Type-4 Change: Reordering Activities
The Type-4 change is also rooted in studies [6–11] by mapping the Weber et. al. [7], adaptive patterns AP5, as well as in the two variants (G and H) proposed in [9]. The overall formation of Type-4 change is shown in Tab. 4. This type of change was achieved by reordering the activities. The Type-4 change was applied to all 150 models.
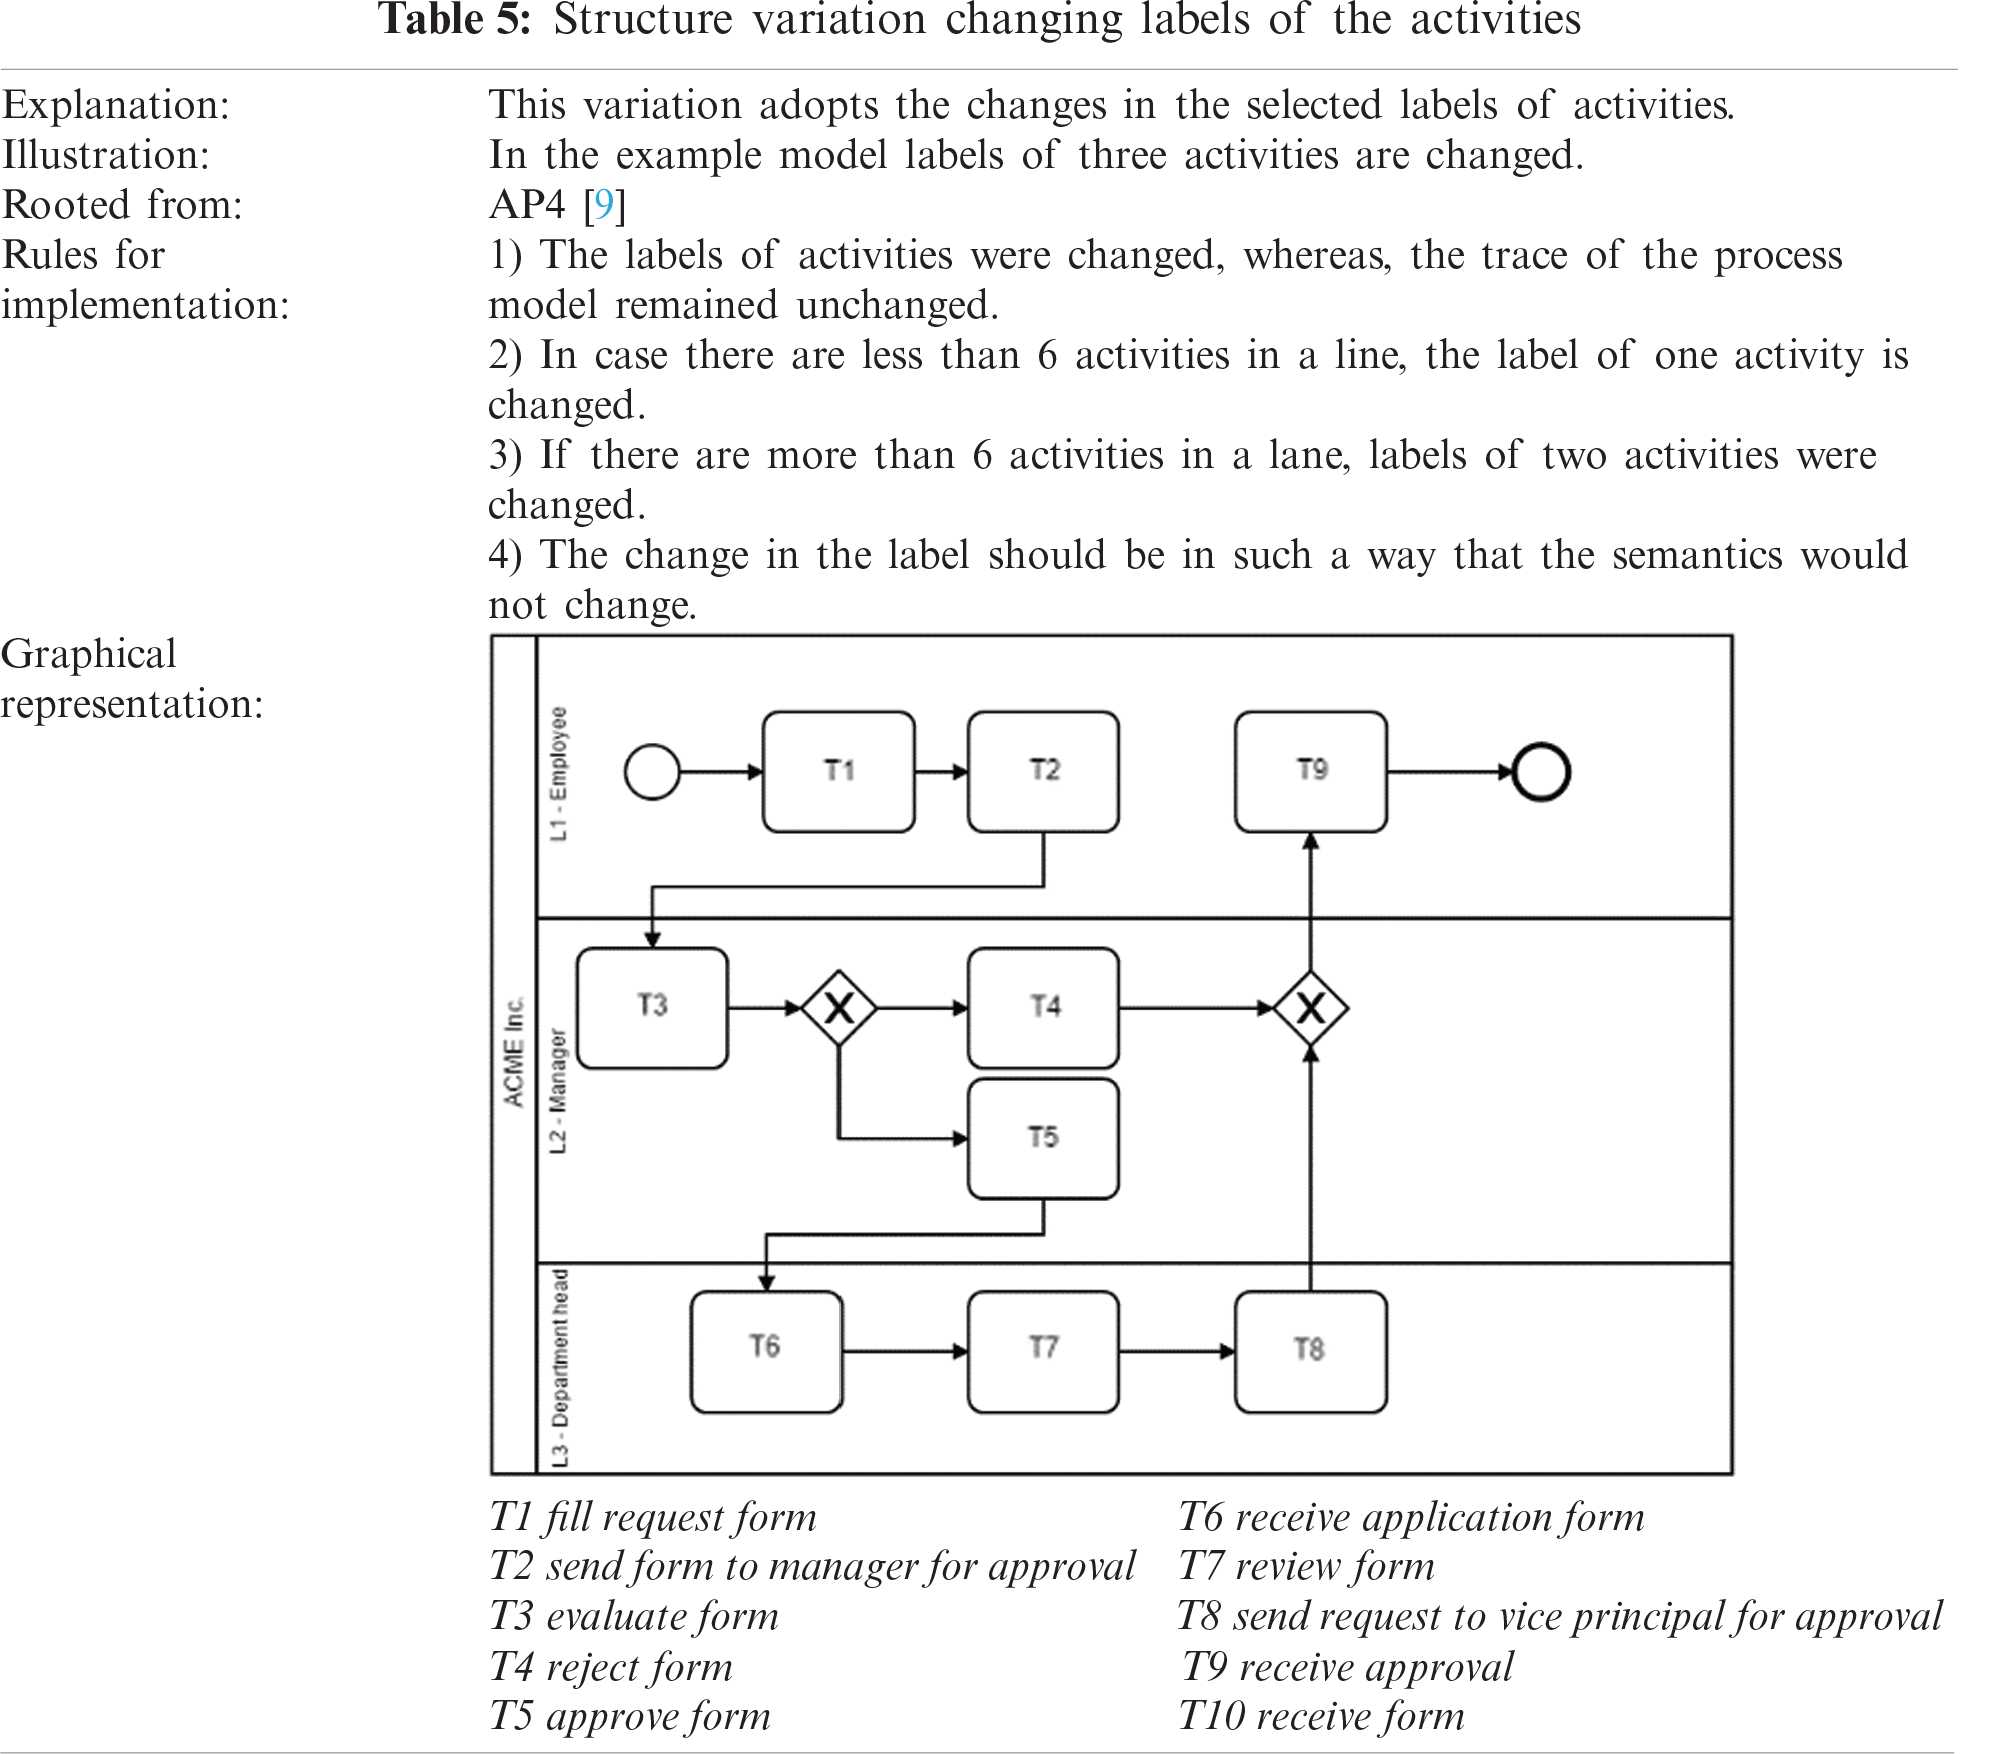
2.1.5 Type-5 Change: Changing Labels of the Activities
Type-5 involves changing labels for the process activities by replacing them with suitable synonyms in such a way that the meaning of the label remains the same. Change Type-5 which stems from adaptive pattern AP4 [7]. According to [7], the model could be different if its elements are labeled differently. Labels were changed by following some defined rules shown below in Tab. 5. The change was made in the original models while keeping in mind their semantics.
2.2 Creation of Repository for Process Model Similarities Multi-Variants
As a starting point for the development of the corpus, we used an existing collection of 150 process models [12]. The choice of the collection stems from the following reasons: a) the collection has limited propriety issues as it is freely and publicly available, b) the label-based variants have already been generated and used for the process model matching tasks. Therefore, extending the dataset with structural variants will be a valuable addition to the already usable collection, c) the collection includes process models from diverse genres, hence, providing enough diversity of process models, and d) the models in the collection comply with the widely used process modeling guidelines, which states that the process models in the collection do not contain any errors. For instance, there are no connector mismatches which resulted in no cyclic complexity, and all these models have a single start and an end node, which makes the model more structured.
In the second step of the development, a random sample of 10% of the models was refined by a team of three experts. Specifically, the process model collection was divided into two parts and two researchers were asked to generate variants of models, in such a way that each researcher generate at least two variants of each model. Note, generating these variations was a challenging and resource-intensive task due to several reasons. For instance, generating a process model variant based on Type-4 change was a challenging task as it involves changing the position of the activity which is likely to affect the semantics of the process. All five types of changes were made to create a repository of 900 process models. Where, Type-0 represents an original model, and Type-1, Type-2, Type-3, Type-4, and Type-5 represent the five variants of the original process models. All the models were designed in a widely used process modeling tool and stored in XML format. Also, PNG files of all the models were generated for visualization.
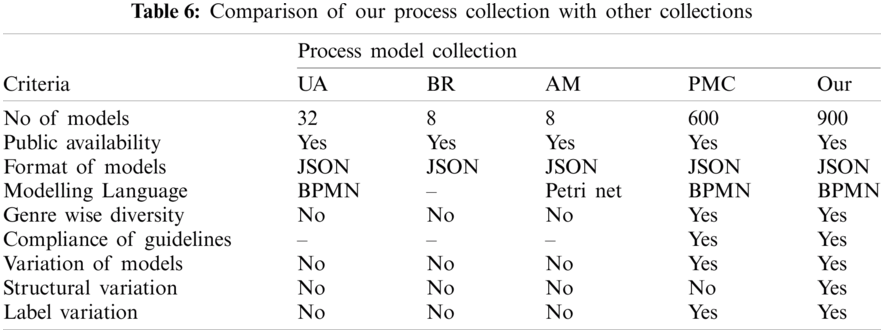
Tab. 6 provides a comparison of the newly developed process model collection with the existing collections that are publicly available. It includes three process model collections from the Process Model Matching Contest (PMMC’15) [13], a state-of-the-art collection of process models, and our newly developed collection. It can be observed from the table that the number of process models in our collection is significantly more than the number of models in any of the existing collections. Furthermore, similar to the existing collections, our collection is also publicly available, and the models are designed in BPMN, which is the de jure for process modeling. Also, our collection includes process models from multiple genres, meaning that the collection contains process models from different domains making it a representative sample of several genres. A notable observation is that most of the existing collections do not include variants of process models. The only exception is a recently developed collection of process models [13]. However, the variations of the models in those collections are limited to the paraphrasing of labels. In contrast to the existing collections, our collection contains variants of process models, including structural and label-based variants, making it the most comprehensive collection that is publicly available. Hence, we contend that the developed collection is a comprehensive resource for the evaluation of the process similarity techniques.
The models were saved in XML format along with the Portable Network Graphics (PNG) files. The compatible XML format was generated using Camunda, an open-source and established tool for designing process models. The 900 process models were stored after a comprehensive audit of XML codes and graphical models. The models in XML were passed as an input to the developed prototype. The whole collection of process models was passed to our developed prototype and the scores of 26 similarity metrics were computed.
3 Structural Metrics Measurements and Results
To provide an overview of the structural properties of the collection of our process model collection, we use structural metrics. These metrics have been widely used in literature for analyzing the structural properties of the process model collection. The metrics we used to evaluate our process models were extracted from studies [14–18]. The developed prototype is shown in Fig. 1. The 1
To provide an overview of the process model collection, we computed the values of structural metrics of each process model and exported them to a CSV file. The standard deviation of all the structural metrics is presented in Fig. 2. In the figure, the blue bars represent the mean score of structural metrics, whereas, the standard deviation is represented by red bars. Furthermore, the 26 metrics are along the x-axis, whereas, the values of these metrics are plotted along the y-axis. It can be observed from Fig. 2 that the mean values of metrics, such as Size, Diameter, S(N), and S(F), are comparatively higher than the other metrics. On the other hand, the mean and standard deviation values of metrics like Density, Connector Mismatch, Cyclicity, S(C)OR, S(J)OR, and S(S)OR is zero, from these values one cannot predict how one model is congruous to the other.
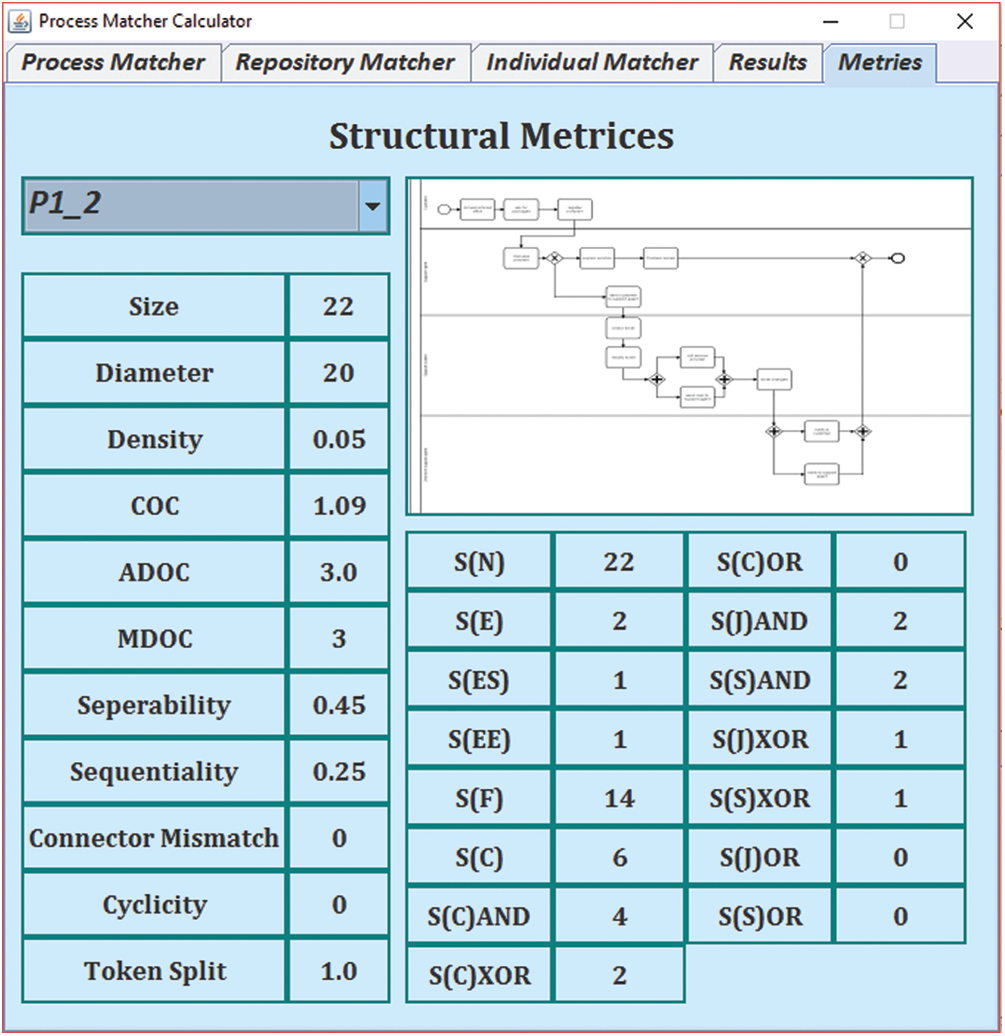
Figure 1: Structural metrics calculation tool
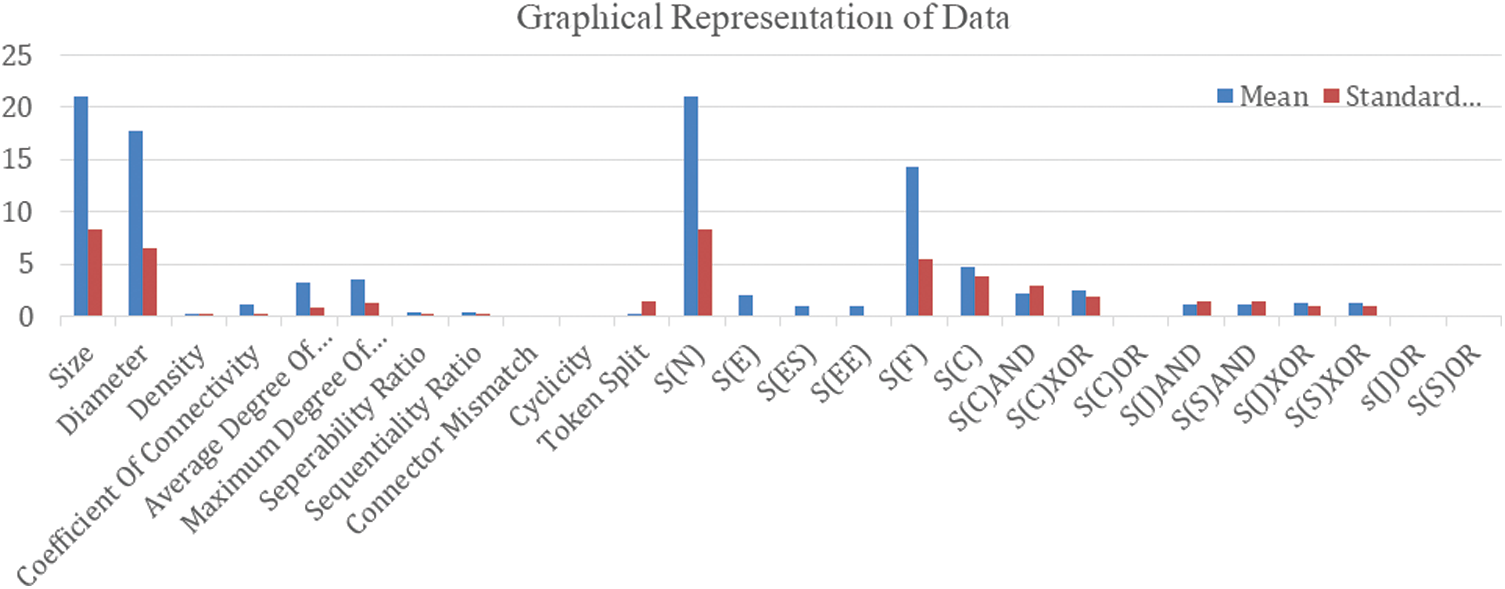
Figure 2: Mean and standard deviation of the results from structural metrics
4 The Proposed Approach for Structural Similarities Measurement
The scores of the structural metrics presented in the preceding section provide an overview of the process collection that we have generated. However, the values of the structural metrics cannot be used to compute the similarity between a pair of process models due to the following reasons: a) these metrics provide a macro view of the process structure and does not provide detailed insights about process models, b) these metrics do not provide a holistic view about the structure of two different process models. For instance, two process models having identical values of size, diameter, and other metrics, but at the same time their semantics can be different, whereas, the two process models having substantially different structural properties can have significantly similar semantics.
In this study, we have proposed a novel approach that relies on structural variation topology, as well as label-content of process models. The proposed approach stems from the notation of Graph Edit Distance (GED) [10]. To elaborate on the approach, firstly, we define a Business Process Graph (BPG) to omit the language-specific details. A BPG is composed of three elements, a finite set of nodes, a finite set of edges between these nodes, and labels associated with them.
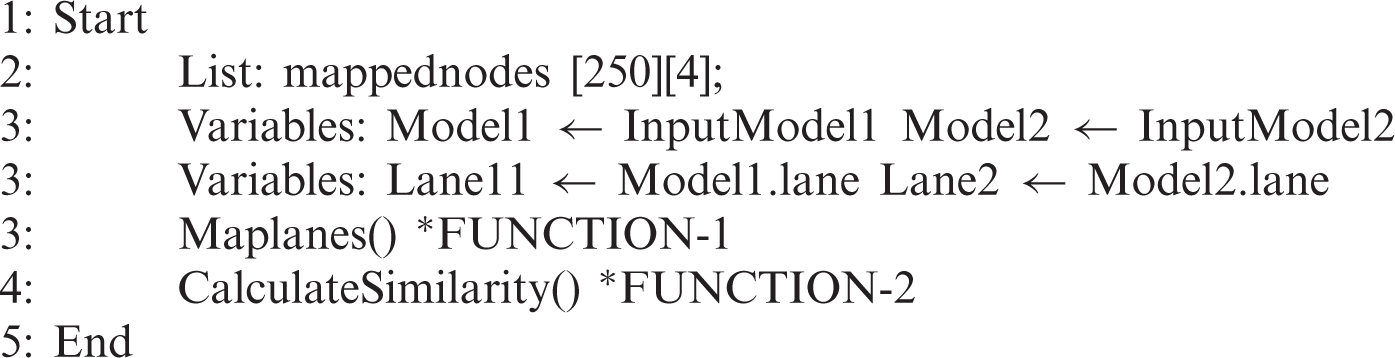
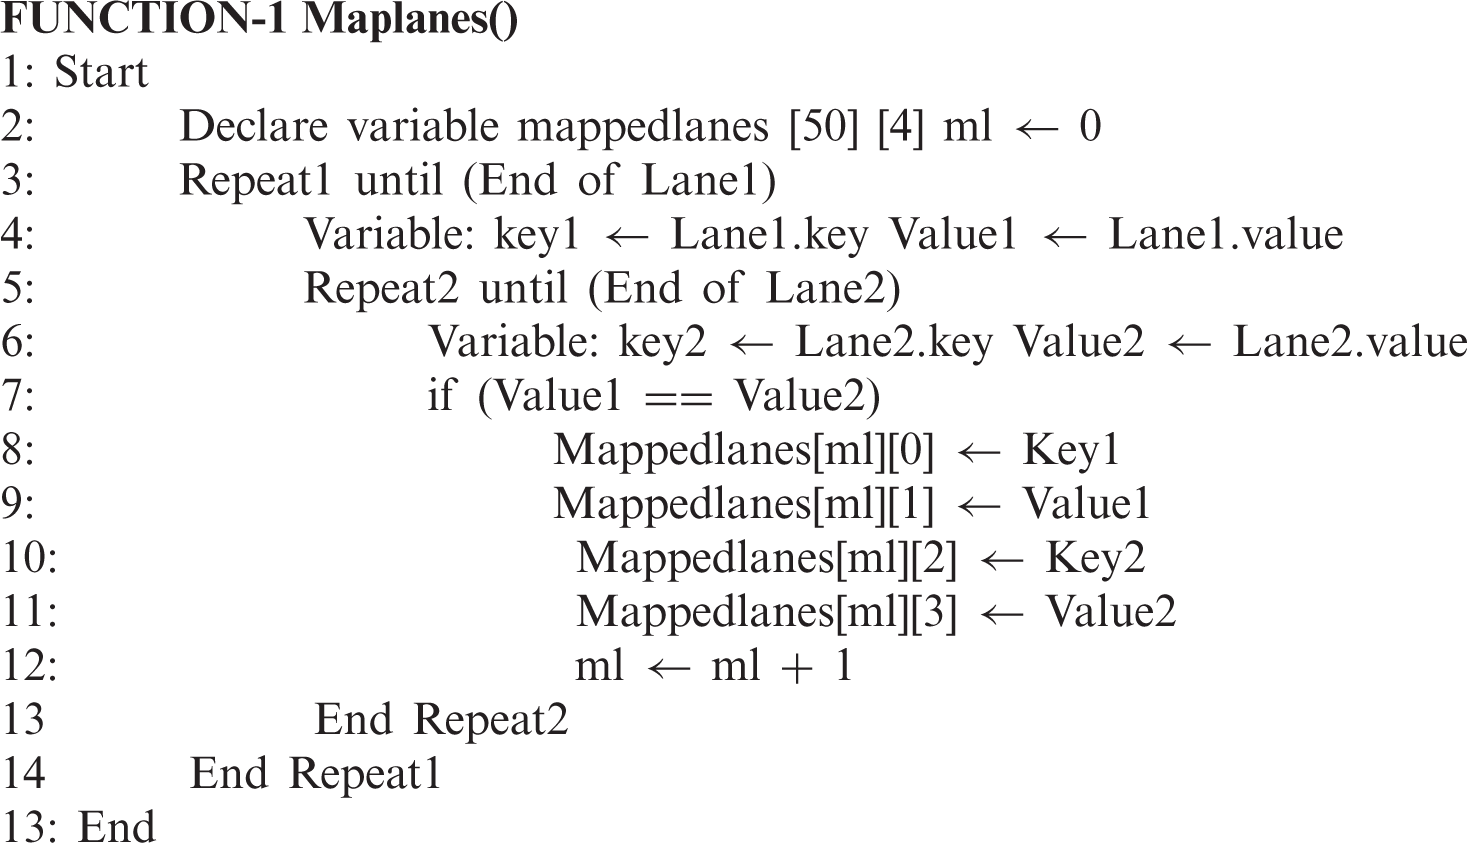
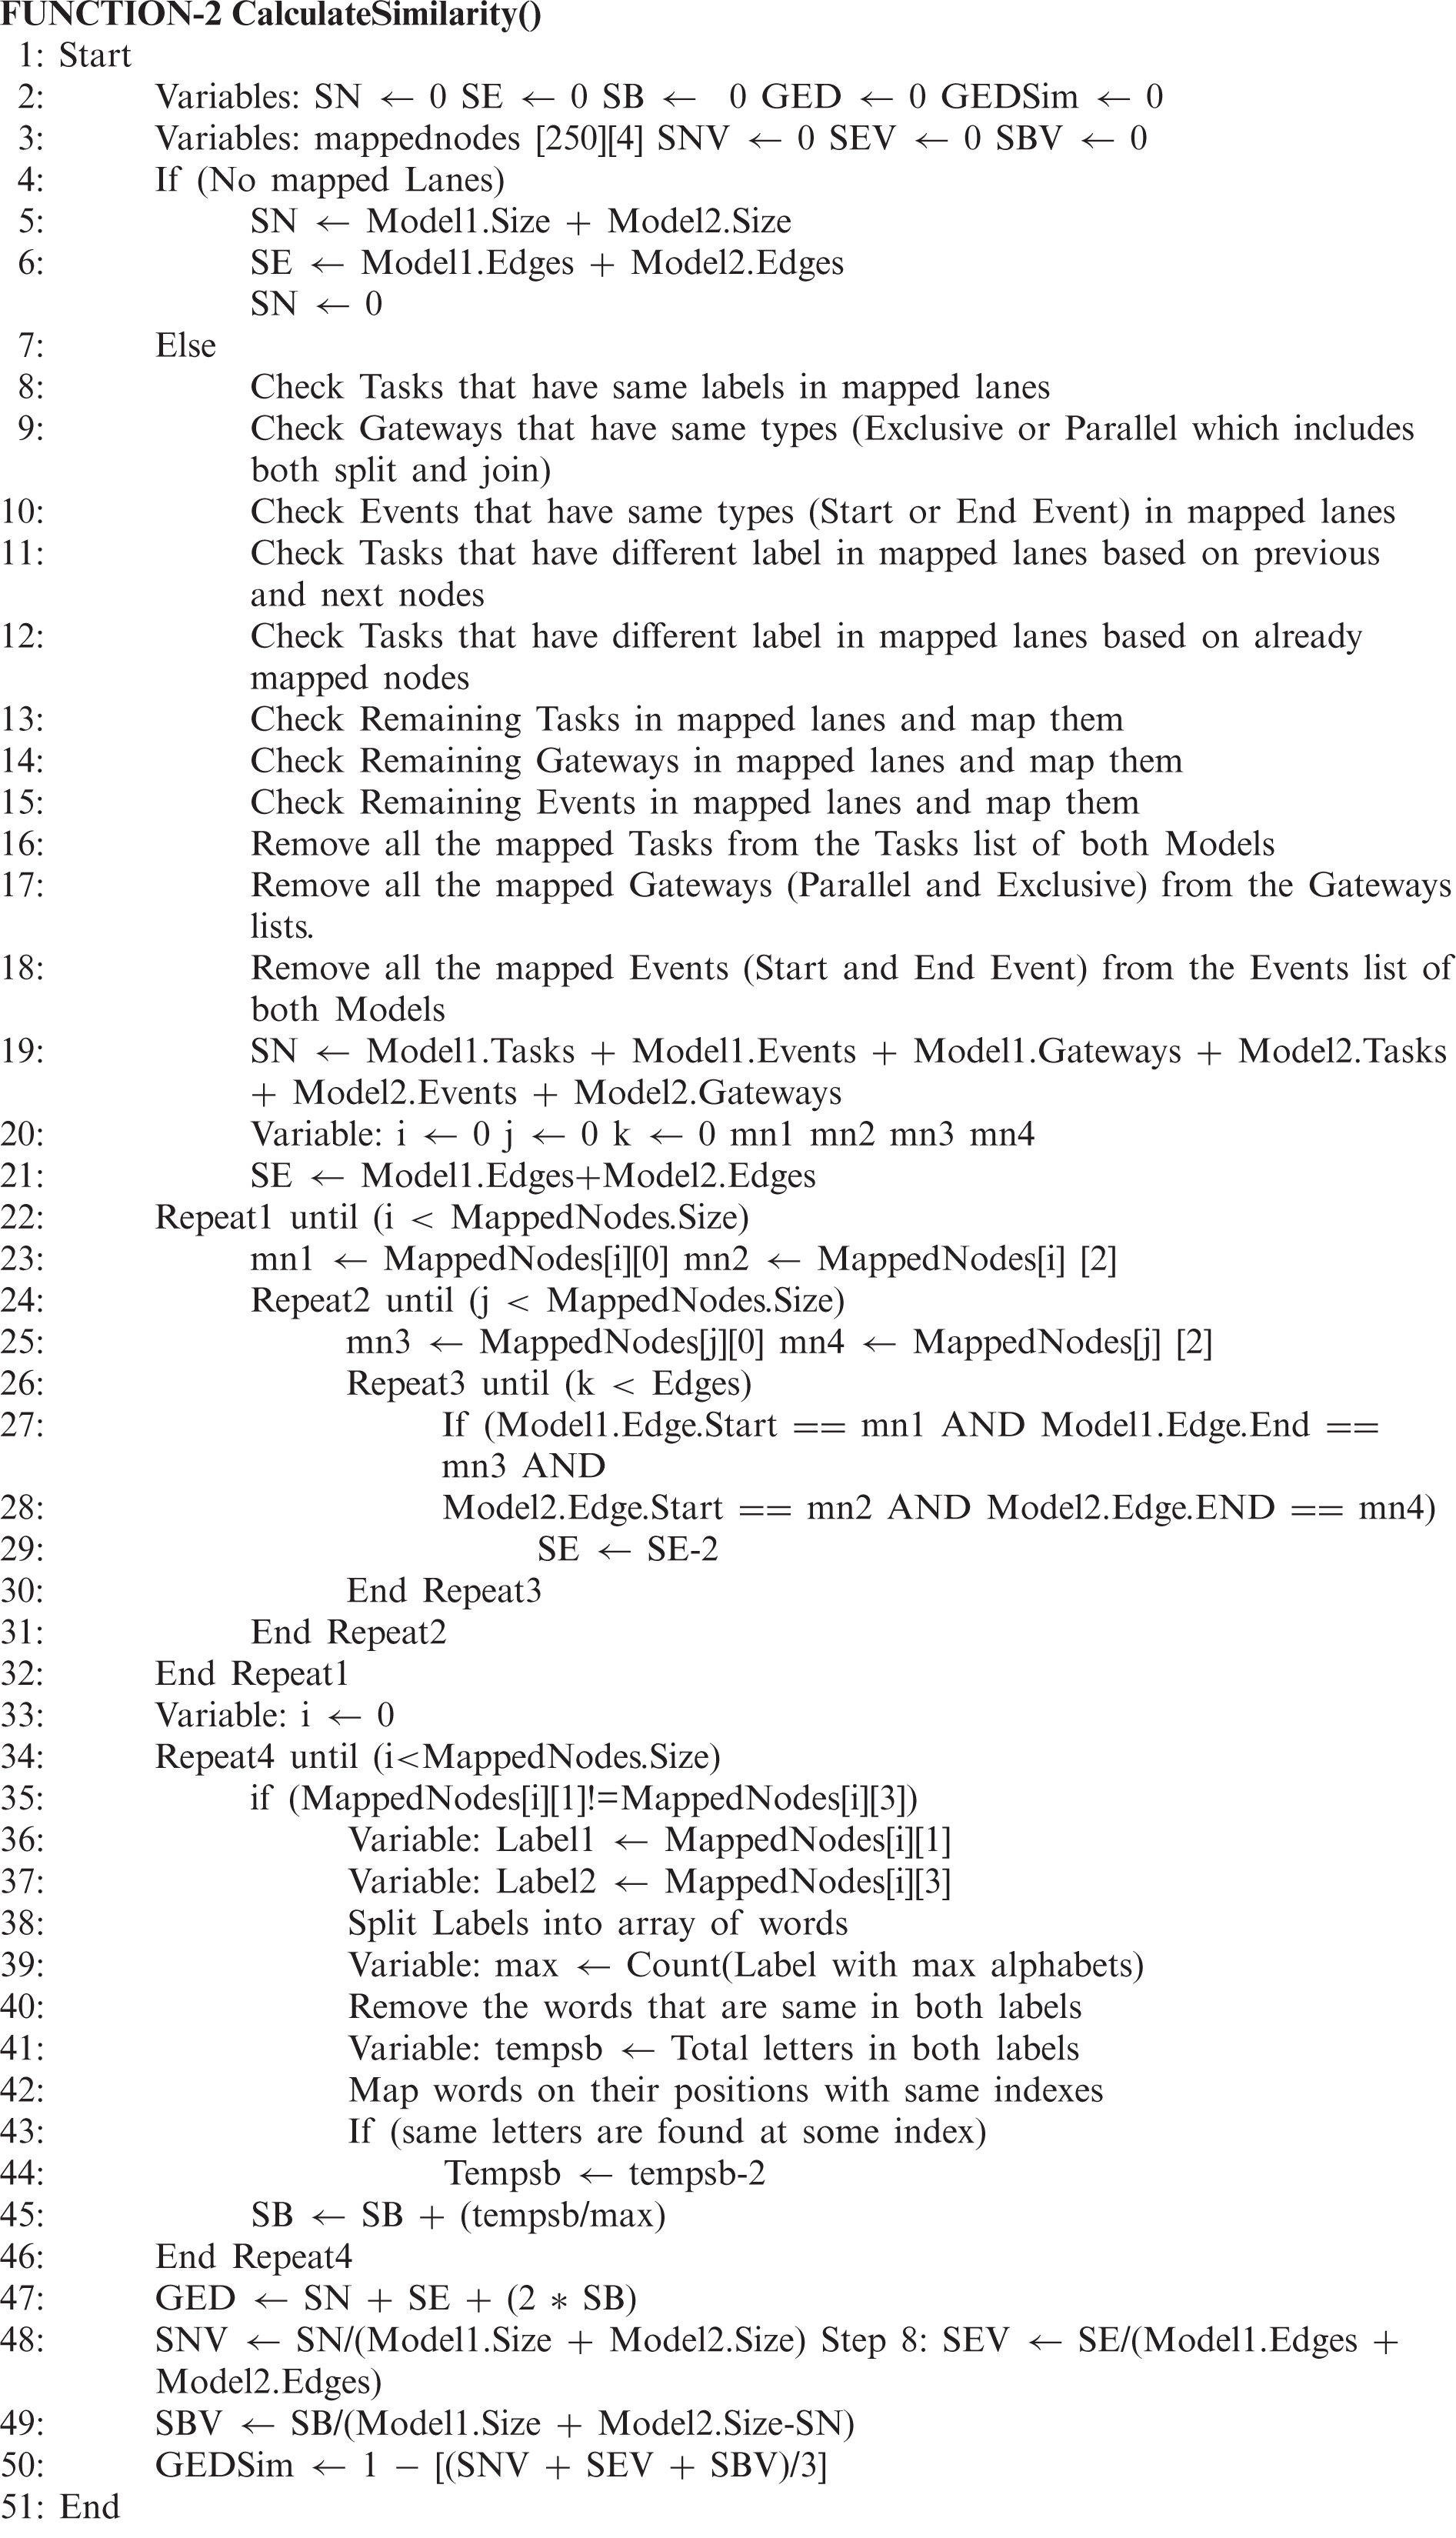
The pseudocode of the proposed approach is presented below. The algorithm is subdivided into two functions. The first function ‘FUNCTION-1 Maplanes()’ was developed to retrieve the activities, flow line, gateways, and pool lanes, of the model. Whereas, the second function ‘FUNCTION-2 CalculateSimilarity()’ computes the similarities of a model with a single model and with all 899 models from the dataset. The proposed approach is implemented in Java.
A screenshot of the implemented prototype is presented in Fig. 3. In essence, the lanes in the extracted process model are mapped based on the labels of the two models. Subsequently, the corresponding nodes of the mapped lanes are also be mapped. Finally, the overall similarity between the two process models is computed based on the mapped elements. Consider, while computing the similarity, the unmapped nodes are represented by SN, whereas, unmapped edges are represented SE. Furthermore, the edit distance SB value was computed. Using the three values, SN, SE, and SB, we calculate the SNV, SEV, and SBV. Where, SNV is the ratio between the unmapped nodes SN and the total number of nodes between the two models, and SEV is the ratio between the unmapped edges SE and the total number of edges in the two models. Furthermore, SBV calculates the betweenness of two mapped nodes in the models. A separate module contains the list of models to be used as a query, it provides a preview of the model that is selected. The lower part of the module contains the models that are similar to the query model, as well as the intermediate computation. The Precision and Recall of the selected model show how precise the results are for that specific model. In the following module, the similarity between a pair of process models is provided. The screenshot contains a preview of the pair of process models and the labels of the corresponding elements of the process model. Also, it contains the different scores, SN, SB, SE, SNV, SEV, and SBV, used to compute the similarity between a pair of models.
Fig. 4 shows the module to compute Precision and Recall scores of a proposed technique. The two measures, Precision and Recall, have been widely used for information retrieval, information matching, and similarity computing tasks. Precision is defined as the ratio between the number of process models that are correctly declared similar and the process models that are declared similar by the technique. The Recall is defined as the ratio between the numbers of process models that are correctly declared similar. Formally, the two measures are defined as follows.
Precision = |(similar process models)
Recall = |(similar process models)
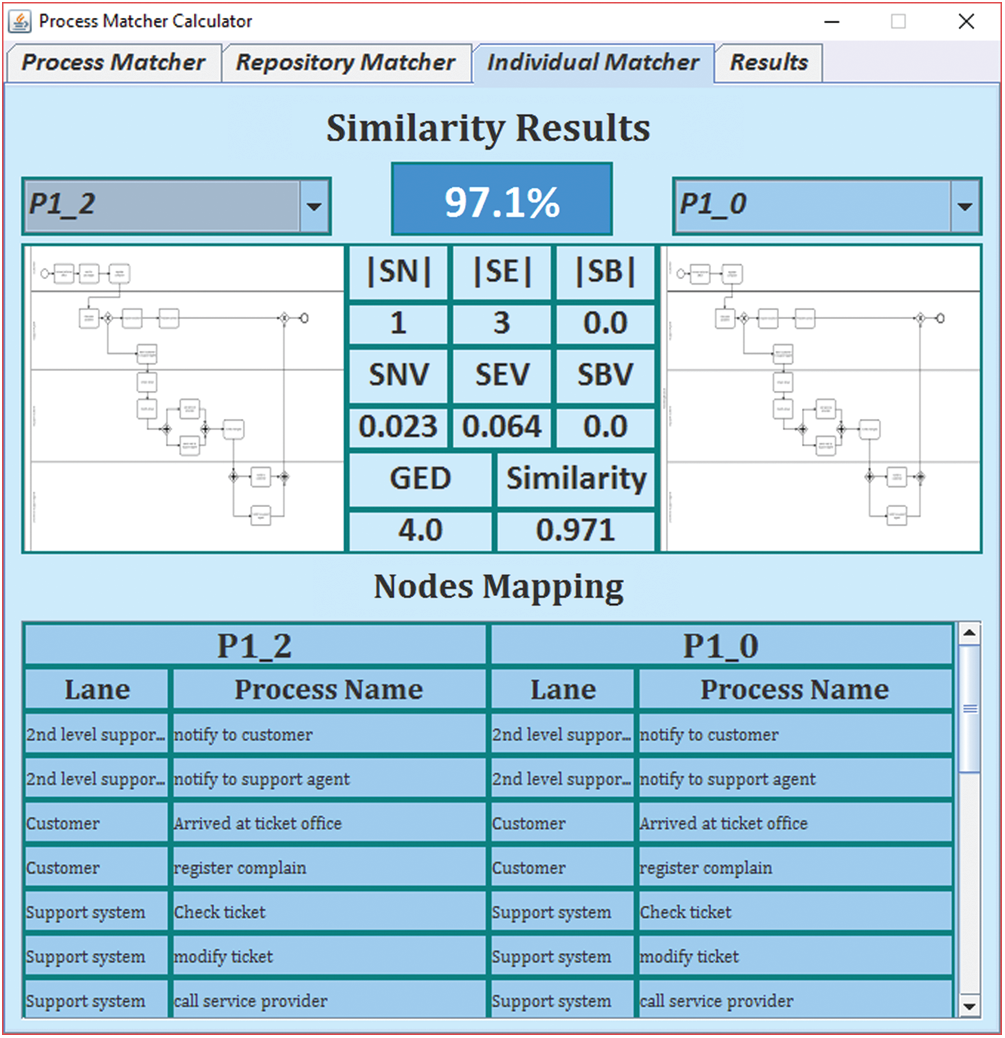
Figure 3: Individual matcher screen
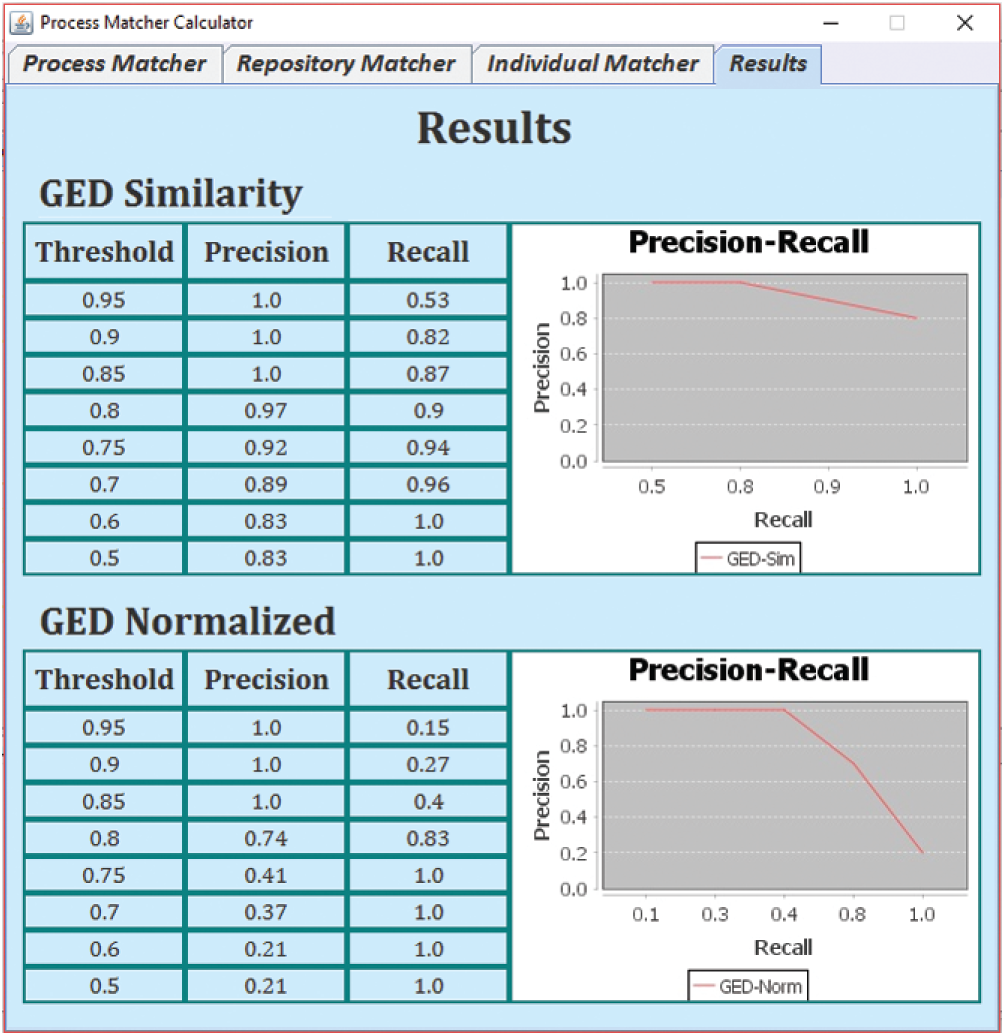
Figure 4: Results screen
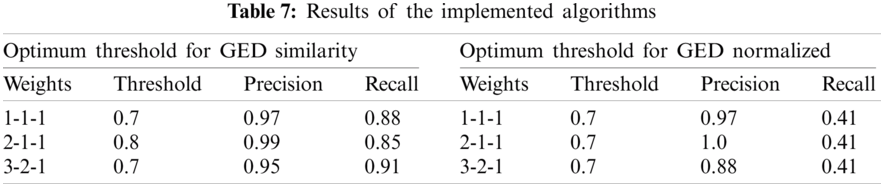
Experiments were performed using all the 900 process models. Based on the results we observed that as the precision increases the value of recall decreases in both cases (GED normalized and GED similarity). The optimum values for the thresholds are shown in Tab. 7. The higher precision and recall results were observed at the threshold of 0.7. Furthermore, to obtain the optimum value execution of the program was readjusted with different weights for SNV, SEV, and SEB, and values were recalculated. The precision results were observed high but the recall values were observed on the lower side in comparison of GED similarity to GED normalized. The weight value 1-1-1 means the variables SNV, SEV and SEB were treated equally. The optimal results were found at 2-1-1 where the precision and recall results were observed high for both cases.
Several attempts have been made to develop techniques for computing similarity between process models. However, a key challenge is that there is a scarcity of process model collections that can be used to evaluate the effectiveness of process similarity techniques. Furthermore, to the best of our knowledge, there is no publicly available collection of process models that can be used to evaluate the effectiveness of process similarity techniques between structurally different process models. To that end, in this study, we have developed a large collection of 900 process models having substantially different structures but at the same time having similar semantics. To demonstrate that we have contributed a valuable resource, we have compared the specification of our developed corpus with the existing collections. The results show that our newly developed collection includes diverse processes, and the specifications of our collection are superior than the existing ones. We have also developed a technique for computing similarity between a pair of process models. The technique relies on the use of graph edit distance and similarity between labels. To demonstrate the applicability of the proposed approach, we have implemented a prototype that is composed of several modules. It includes a module that can parse XML format, import a process model, and compute structural properties of the input model. Another module computes the similarity score between a query process model with all the models in the collection. Also, it computes Precision and Recall scores. Furthermore, a third module provides details of each process model pair i.e., it identifies the corresponding lanes, as well as their corresponding activities. Finally, we evaluated the effectiveness of the proposed approach using the developed collection. The results show that the proposed technique achieved a very high effectiveness score of 0.95.
Funding Statement: The authors received no specific funding for this study.
Conflicts of Interest: The authors declare that they have no conflicts of interest to report regarding the present study.
1. W. M. P. van der Aalst, “Business process management: A comprehensive survey,” ISRN Software Engineering, vol. 2013, no. 1, pp. 1–37. [Google Scholar]
2. M. Indulska, P. Green, J. Recker and M. Rosemann, “Business process modeling: Perceived benefits,” in Int. Conf. on Conceptual Modeling, pp. 458–471, 2009. [Google Scholar]
3. J. Polpinij, A. Ghose and H. K. Dam, “Mining business rules from business process model repositories,” Business Process Management Journal, vol. 21, no. 4, pp. 820–836, 2015. [Google Scholar]
4. E. Kuss, H. Leopold, H. van der Aa, H. Stuckenschmidt and H. A. Reijers, “A probabilistic evaluation procedure for process model matching techniques,” Data Knowledge Engineering, vol. 117, no. 4, pp. 393–406, 2018. [Google Scholar]
5. P. Fettke, P. Loos and J. Zwicker, “Business process reference models: Survey and classification,” in Proc. of Business Process Management Workshops, Berlin, Heidelberg, Springer, pp. 469–483, 2006. [Google Scholar]
6. M. Becker and S. Klingner, “A criteria catalogue for evaluating business process pattern approaches,” in Enterprise, Business-Process and Information Systems Modeling, Berlin, Heidelberg, Springer, pp. 257–271, 2014. [Google Scholar]
7. B. Weber, S. Rinderle and M. Reichert, “Change patterns and change support features in process-aware information systems,” Advanced Information Systems Engineering, vol. 4495, no. 3, pp. 574–588, 2007. [Google Scholar]
8. A. Armas-Cervantes, P. Baldan, M. Dumas and L. Garcia-Bañuelos, “Diagnosing behavioral differences between business process models: An approach based on event structures,” Information Systems, vol. 56, no. 2, pp. 304–325, 2016. [Google Scholar]
9. M. Becker, S. Klingner, B. Weber, M. Reichert and S. Rinderle-Ma, “Change patterns and change support features-enhancing flexibility in process-aware information systems,” in Proc. of Enterprise, Business-Process and Information Systems Modeling, Berlin, Heidelberg, Springer, vol. 66, pp. 438–466, 2008. [Google Scholar]
10. M. Becker and R. Laue, “A comparative survey of business process similarity measures,” Computers in Industry, vol. 63, no. 2, pp. 148–167, 2012. [Google Scholar]
11. M. Dumas, L. García-Bañuelos and R. M. Dijkman, “Similarity search of business process models,” Bulletin of the IEEE Computer Society Technical Committee on Data Engineering, vol. 32, no. 3, pp. 23–28, 2009. [Google Scholar]
12. K. Shahzad, R. M. A. Nawab, A. Abid, K. Sharif, F. Ali et al., “A process model collection and gold standard correspondences for process model matching,” IEEE Access, vol. 7, pp. 30708–30723, 2019. [Google Scholar]
13. G. Antunes, M. Bakhshandeh, J. Borbinha, J. Cardoso, S. Dadashnia et al., “The process model matching contest 2015,” in Proc. of the 6th Int. Workshop on Enterprise Modelling and Information Systems Architectures, Gesellschaft für Informatik Lecture Notes Informatics, Innsbruck, Austria, vol. 248, pp. 127–155, 2015. [Google Scholar]
14. I. Vanderfeesten, J. Cardoso, J. Mendling, H. A. Reijers and W. M. P. van der Aalst, “Quality metrics for business process models,” in BPM Workflow Handbook, Lecture Notes in Business Information Processing Book Series, vol. 144. Berlin, Heidelberg: Springer, pp. 179–190, 2007. [Google Scholar]
15. A. Sohail, K. Shahzad, P. D. Dominic, M. A. Butt, M. Arif et al., “On computing the suitability of non-human resources for business process analysis,” Computers, Materials & Continua, vol. 67, no. 1, pp. 303–319, 2021. [Google Scholar]
16. J. Mendling, “Metrics for business process models,” in Lecture Notes in Business Information Processing Book Series on Metrics for Process Models. vol. 6. Berlin, Heidelberg: Springer, pp. 103–133, 2008. [Google Scholar]
17. A. Sohail and R. Anum, “A structural variants process models collection for process similarities evaluations,” MS dissertation. COMSATS University Islamabad, Lahore Campus, Lahore, Pakistan, 2017. [Google Scholar]
18. A. sohail, A. Haseen, M. H. Arshad and M. H. Mansoor, “Style Guidelines for Final Year Project ReportsSimilarity of Business Process Models: A Structural Changes based Technique,” FYP dissertation. COMSATS University Islamabad, Lahore Campus, Lahore, Pakistan, 2018. [Google Scholar]
 | This work is licensed under a Creative Commons Attribution 4.0 International License, which permits unrestricted use, distribution, and reproduction in any medium, provided the original work is properly cited. |