DOI:10.32604/cmc.2021.019013

| Computers, Materials & Continua DOI:10.32604/cmc.2021.019013 |  |
| Article |
Data and Machine Learning Fusion Architecture for Cardiovascular Disease Prediction
1School of Computer Science, National College of Business Administration & Economics, Lahore, 54000, Pakistan
2College of Computer and Information Sciences, Jouf University, Sakaka, 72341, Saudi Arabia
3Department of Computer Science, Virtual University of Pakistan, Lahore, 54000, Pakistan
4Riphah School of Computing & Innovation, Riphah International University, Lahore Campus, Lahore, 54000, Pakistan
5Department of Computer Science, Lahore Garrison University, Lahore, 54000, Pakistan
6Department of Computer Science, Minhaj University Lahore, Lahore, 54000, Pakistan
7College of Engineering, Al Ain University, Abu Dhabi, 112612, UAE
8Department of Computer Science, Faculty of Computers and Artificial Intelligence, Cairo University, 12613, Egypt
*Corresponding Author: Muhammad Adnan Khan. Email: madnankhan@ncbae.edu.pk
Received: 28 March 2021; Accepted: 29 April 2021
Abstract: Heart disease, which is also known as cardiovascular disease, includes various conditions that affect the heart and has been considered a major cause of death over the past decades. Accurate and timely detection of heart disease is the single key factor for appropriate investigation, treatment, and prescription of medication. Emerging technologies such as fog, cloud, and mobile computing provide substantial support for the diagnosis and prediction of fatal diseases such as diabetes, cancer, and cardiovascular disease. Cloud computing provides a cost-efficient infrastructure for data processing, storage, and retrieval, with much of the extant research recommending machine learning (ML) algorithms for generating models for sample data. ML is considered best suited to explore hidden patterns, which is ultimately helpful for analysis and prediction. Accordingly, this study combines cloud computing with ML, collecting datasets from different geographical areas and applying fusion techniques to maintain data accuracy and consistency for the ML algorithms. Our recommended model considered three ML techniques: Artificial Neural Network, Decision Tree, and Naïve Bayes. Real-time patient data were extracted using the fuzzy-based model stored in the cloud.
Keywords: Machine learning fusion; cardiovascular disease; data fusion; fuzzy system; disease prediction
The clinical investigation of heart disease, which is also known as cardiovascular disease, constitutes a major topic of interest for medical research, both historically and in contemporary times. According to the World Health Organization, around 23 million cardiovascular disease patients die annually due to cardiac arrest and stroke [1], with a significant number of cases in developing countries. Heart diseases have a major influence not only on the life of an individual but also on the economies of countries. As such, heart health awareness programs significantly prevent disease by encouraging the adoption of a healthy lifestyle. Technology also provides remarkable support for the prevention of disease through medical applications of, for example, cloud computing and artificial intelligence. Cardiovascular diseases include all types of blood circulation problems and heart malfunctions.
Several underlying factors constitute the root causes of heart disease, including excessive intake of saturated fats, lack of exercise, and an imbalanced diet. In addition, genetic predisposition is increasingly recognized as a prominent cause [2]. Cloud computing provides applications and resources on an on-demand basis [3] and is compatible with modern tools and technologies. It can effectively support machine learning (ML) models and ultimately improve diagnostic analysis, as well as meet other needs of the healthcare industry [4]. Cloud-based applications are becoming the first choice for medical professionals and technicians, because they not only allow test reports to be updated instantly but also contribute to resolving the big data issues surrounding computerized tomography (CT) scans and radiology. However, this requires a tool to provide security, privacy and optimal accuracy along with enhancing the availability of information [5]. As a part of artificial intelligence, ML facilitates the accurate prediction of the likelihood of a particular event using the predefined dataset. In 2018, Khan et al. recommended a fuzzy inference system to predict the chances of heart disease [6], by examining examples from an array of research studies on heart health. For instance, in 2013, Kumar and Kaur conducted research on a heart disease diagnosis system using fuzzy logic and suggested that a fuzzy-based system could predict disease with 93.33% accuracy [7]. We proposed a cloud-based prediction model using ML techniques after considering the gravity of the problem and its fatal effects.
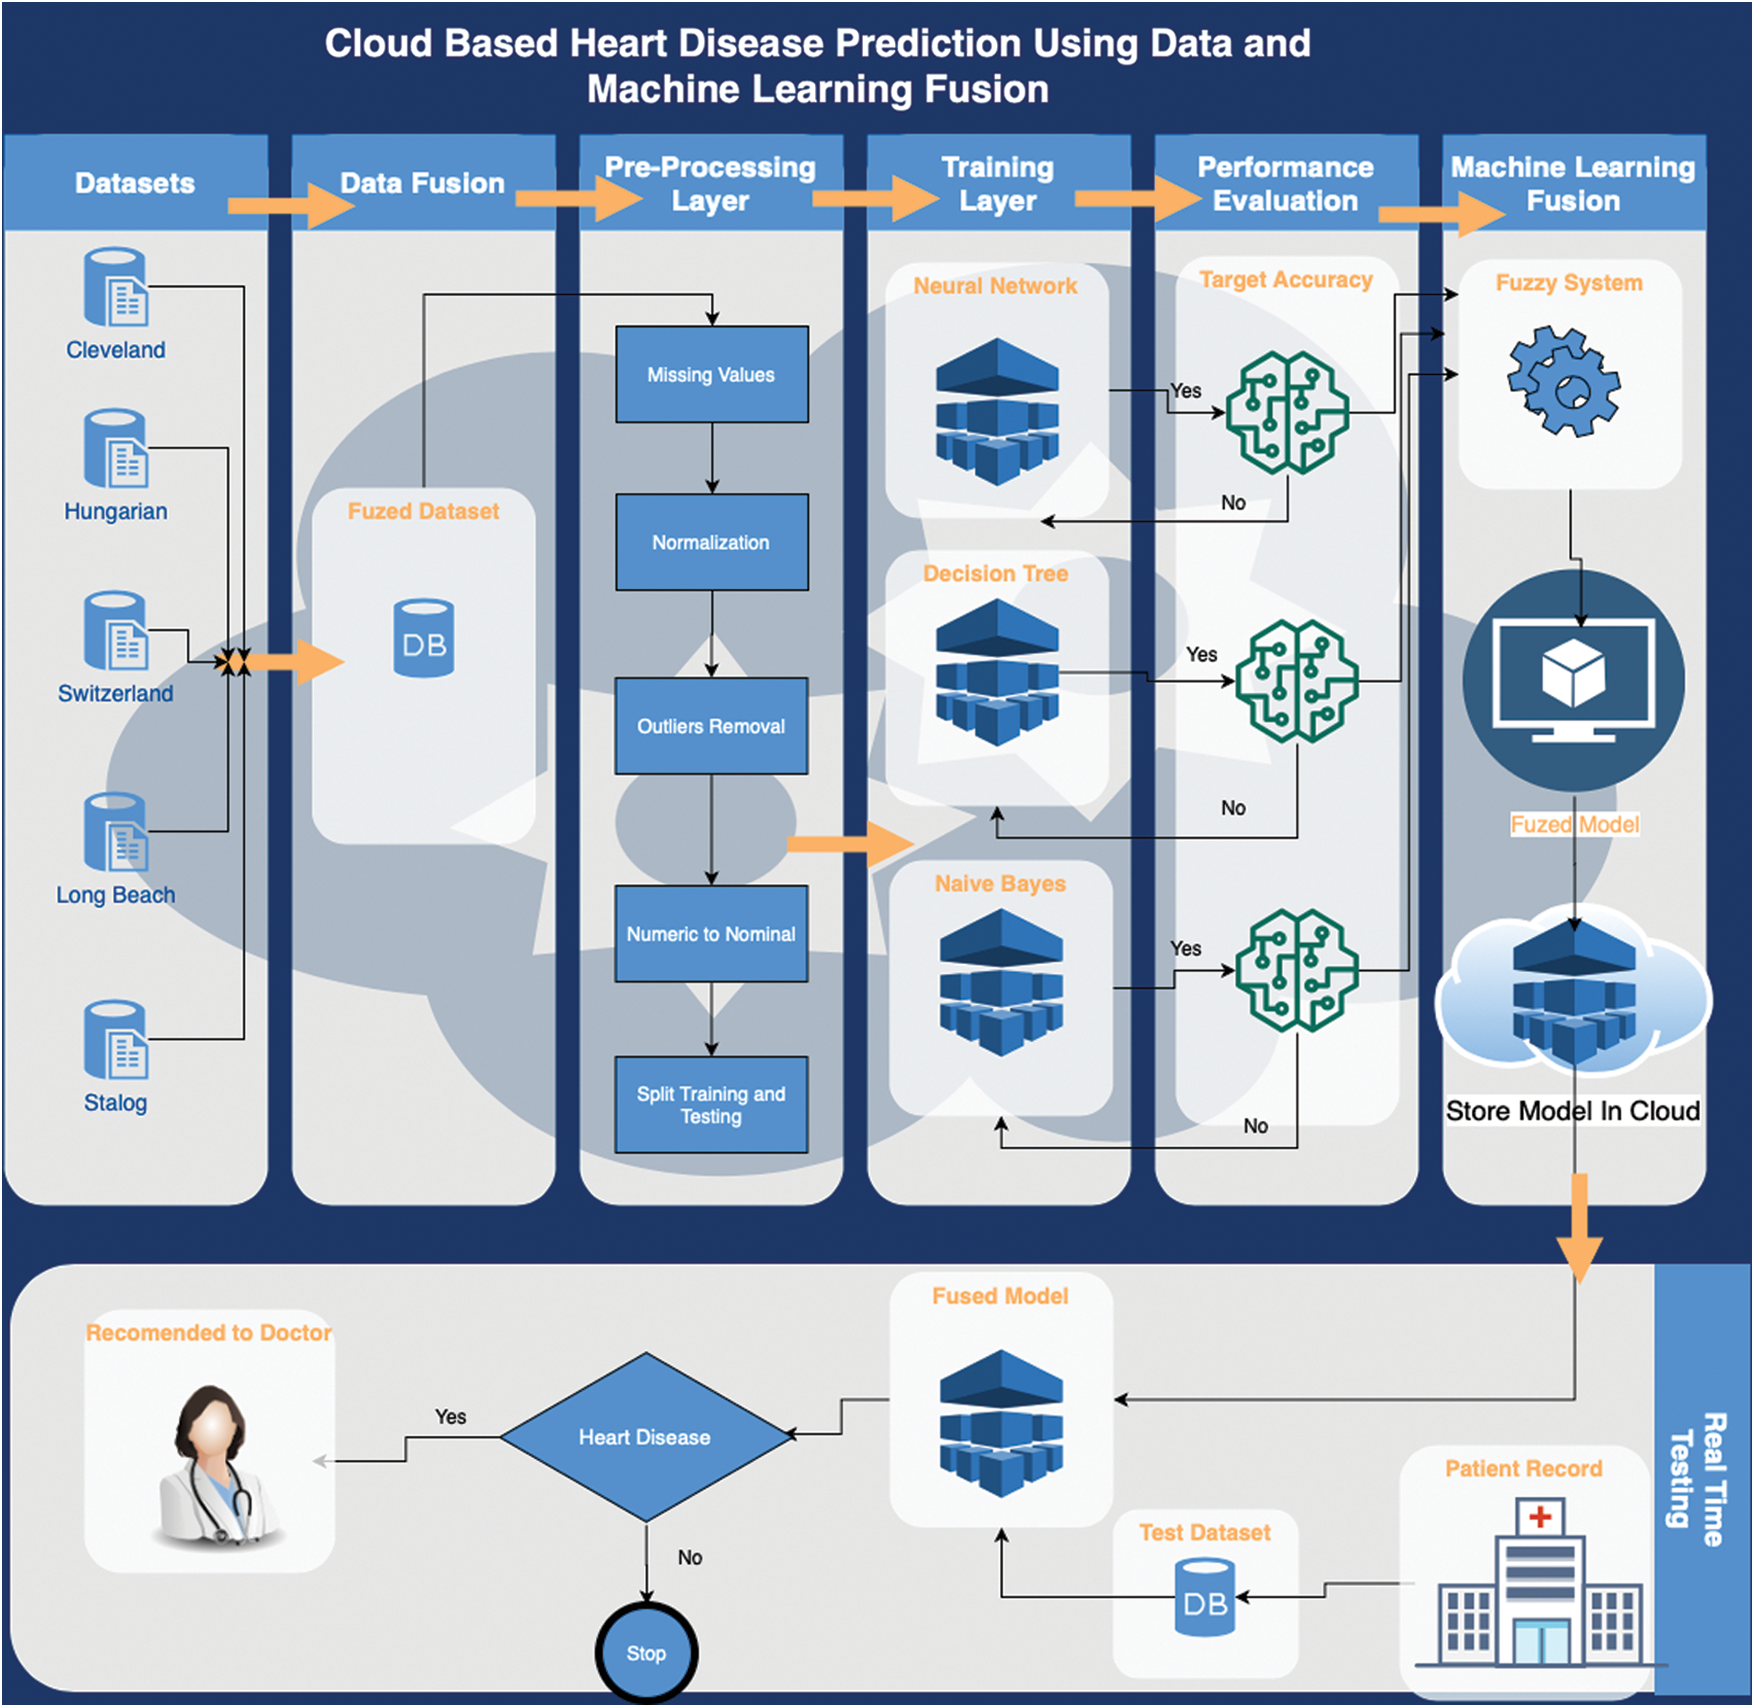
This paper organizes our approach into seven phases. Phase 1 concerns data collection. We collected datasets from geographically diffuse locations to ensure maximum coverage. Phase 2 consolidated all datasets into the fuzzy dataset. Phase 3 was a pre-processing layer involving the elimination of records with missing values; this included normalization and, ultimately, splitting training and testing data. Phase 4 concerned the training layer, in which we applied three algorithms: Artificial Neural Network (ANN), Decision Tree (DT), and Naïve Bayes (NB). Next, in Phase 5, we evaluated the data to obtain target accuracy. In the ML-fusion phase (Phase 6), the fuzzy-based system accepted data meeting our predefined criteria for two of three brains. Finally, in Phase 7, the fuzzy model was compared with the model stored in the cloud.
Researchers have explored various alternative techniques for identifying cardiovascular disease. For example, some researchers have applied the neural method, obtaining results with 83% accuracy [8]. Meanwhile, in 2017, Kim and Kang applied ML techniques to predict coronary heart disease, with the recommended model viewed as a single layer. After performing 4146 tests, 3031 cases were deemed low-risk and 1115 were considered high-risk. The proposed model had 81.09% accuracy [9]. Elsewhere, researchers conducted a study predicting cerebral infarction disease, by developing convolutional neural network models to predict vulnerability relevant to structured and unstructured data from various sources. This was a unique experiment for the use of big data analysis in the medical sciences field. The proposed algorithm attained a 94.8% accuracy level [10].
Meanwhile, ANN techniques have been widely used to predict heart disease. Generalized regression neural networks and radial basis functions have been widely used to investigate heart function problems, with experimental analysis proving that ANNs provide more accurate results than any other technique [11]. Recent medical research studies have also emphasized computational intelligence techniques for clinical investigation, developing models using deep extreme ML for diagnosing cardiovascular disease and concluding that more accurate and precise results can be achieved using these techniques [12]. Numerous techniques can probe the root causes of ailments, including fuzzy set, fuzzy deduction framework, and fuzzy connection. Research studies have highlighted the application of the latest approaches for therapeutic conclusions [13]. Many researchers have discussed ANN models and their relative importance for diagnosing heart disease at an early stage [14,15]. Meanwhile, multilayer perceptron and other data mining techniques have been successfully implemented for heart disease prediction, with one study using two distinct datasets featuring 303 and 270 cases. They identified 15 features for each patient that included smoking, body fat, hypertension, and gender. The accuracy of the DT was 99.62%, compared to 100% for multilayer perceptron [16].
Early-stage mild cardiovascular disease is curable through significant lifestyle changes, including adopting a more balanced diet [17]. However, this requires early identification of potential patients. Accordingly, this research considers cloud-based heart disease prediction using ML following the seven-phase methodology presented in Fig. 1.

Figure 1: Proposed cloud-based heart disease prediction using a data and ML fusion model
Dataset selection [18] provided the foundation of the training layer. This study used a pre-labelled dataset of heart disease patients [19] for the implementation of the proposed framework. The selected dataset comprised 1190 cases and considered 12 features. Eleven of the features were independent and 1 was dependent, which represented the output class. The pre-processing layer involved data normalization, data cleaning, and data splitting, with the mean imputation method used to remove missing values before the data normalization process synchronized the values of the various features. These activities enabled the classification process to perform better and more accurately.
After the cleaning and normalization process, the dataset was divided into training data (70%) and test data (30%). Next, the classification process was started, which first involved training for the three classification techniques: ANN, NB, and DT. The classification process generated three predictions that were based on algorithms optimized to achieve maximum accuracy. A hidden layer was used with 12 neurons during the configuration of the ANN, with the weight backpropagation technique used to fine-tune the hidden layer. This involved multiple steps, including initialization of weight, feedforward, backpropagation of error and weight updating. In addition to the input and output layers, a multilayer perceptron was also used for at least one hidden layer. The sigmoid function for input and the hidden layer of the proposed back propagation neural network was expressed as follows:
The input derived from the output layer is given by:
The output layer activation function is as follows:
where
After applying the chain rule method, this can be presented as:
By substituting the values in Eq. (7), the value of weight change can be obtained using Eq. (8):
where
Next, applying the chain rule for the updating of weights between input and hidden layers gives:
where
This can be presented as Eq. (9) after simplification:
where
Eq. (10) updates weights between hidden layers and outputs. Eq. (11) updates weights between the input and hidden layer:
In the DT, three optimizers were applied individually, including random search, Bayesian optimization, and grid search. The Bayesian optimization performed well and it was therefore selected for this framework:
The GINI index is provided by Eq. (13):
Information gain is provided by Eq. (14):
Here, f(z) demonstrates the aim of minimizing the error rate or the root mean square error, which is assessed as the validation set. z can take any value from domain Z and z* is the set of hyper-parameters that represent the lowest value of the score. This approach sought the model hyper-parameters that could deliver the best score for the validation set metric. This model, which is known as the “surrogate” model, is represented as
This is intended to optimize expected improvement with respect to the proposed set of hyperparameters n. Here, z* is an edge value of the objective function, z depicts the actual value of the function using the set of hyperparameters n, and
The hyperparameter does not expect to produce any improvement if
p (
There are two different distributions for the hyperparameters in this equation, one where the value of the objective function is less than l(n) and one where the objective function is greater than g(n):
For NB, the following three kernel types were used: box, Gaussian, and triangle:
The traditional NB classifier estimates probabilities by approximating the data through a function such as a Gaussian distribution:
where
The two-parameter Box-Cox transformation is defined as:
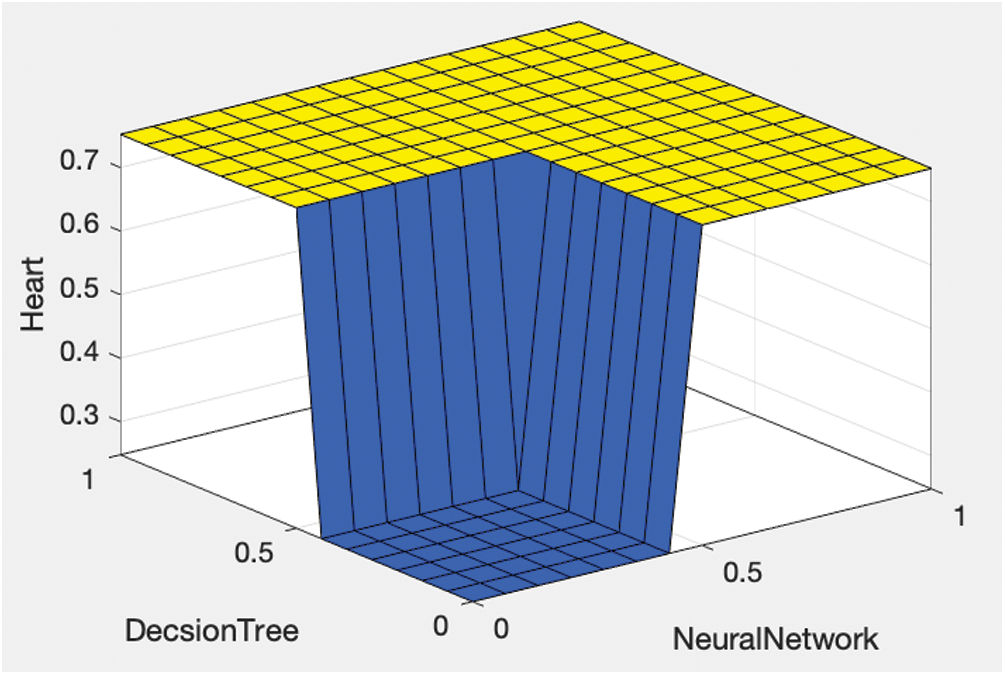
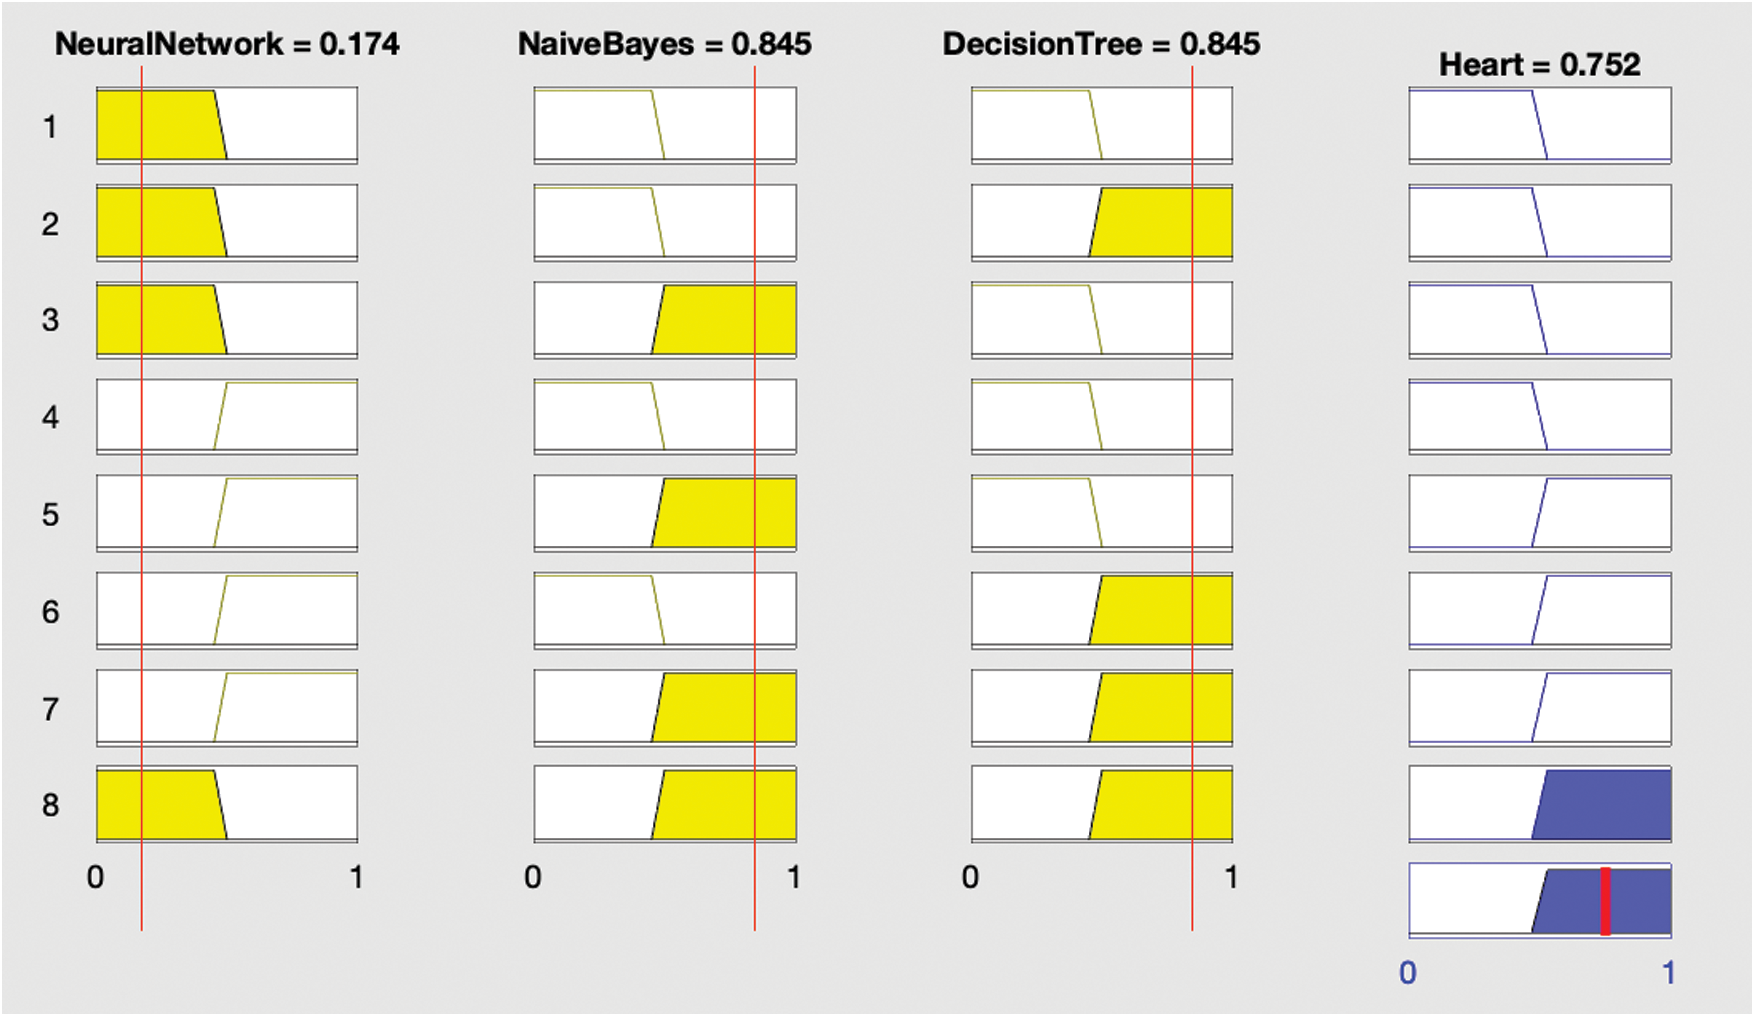
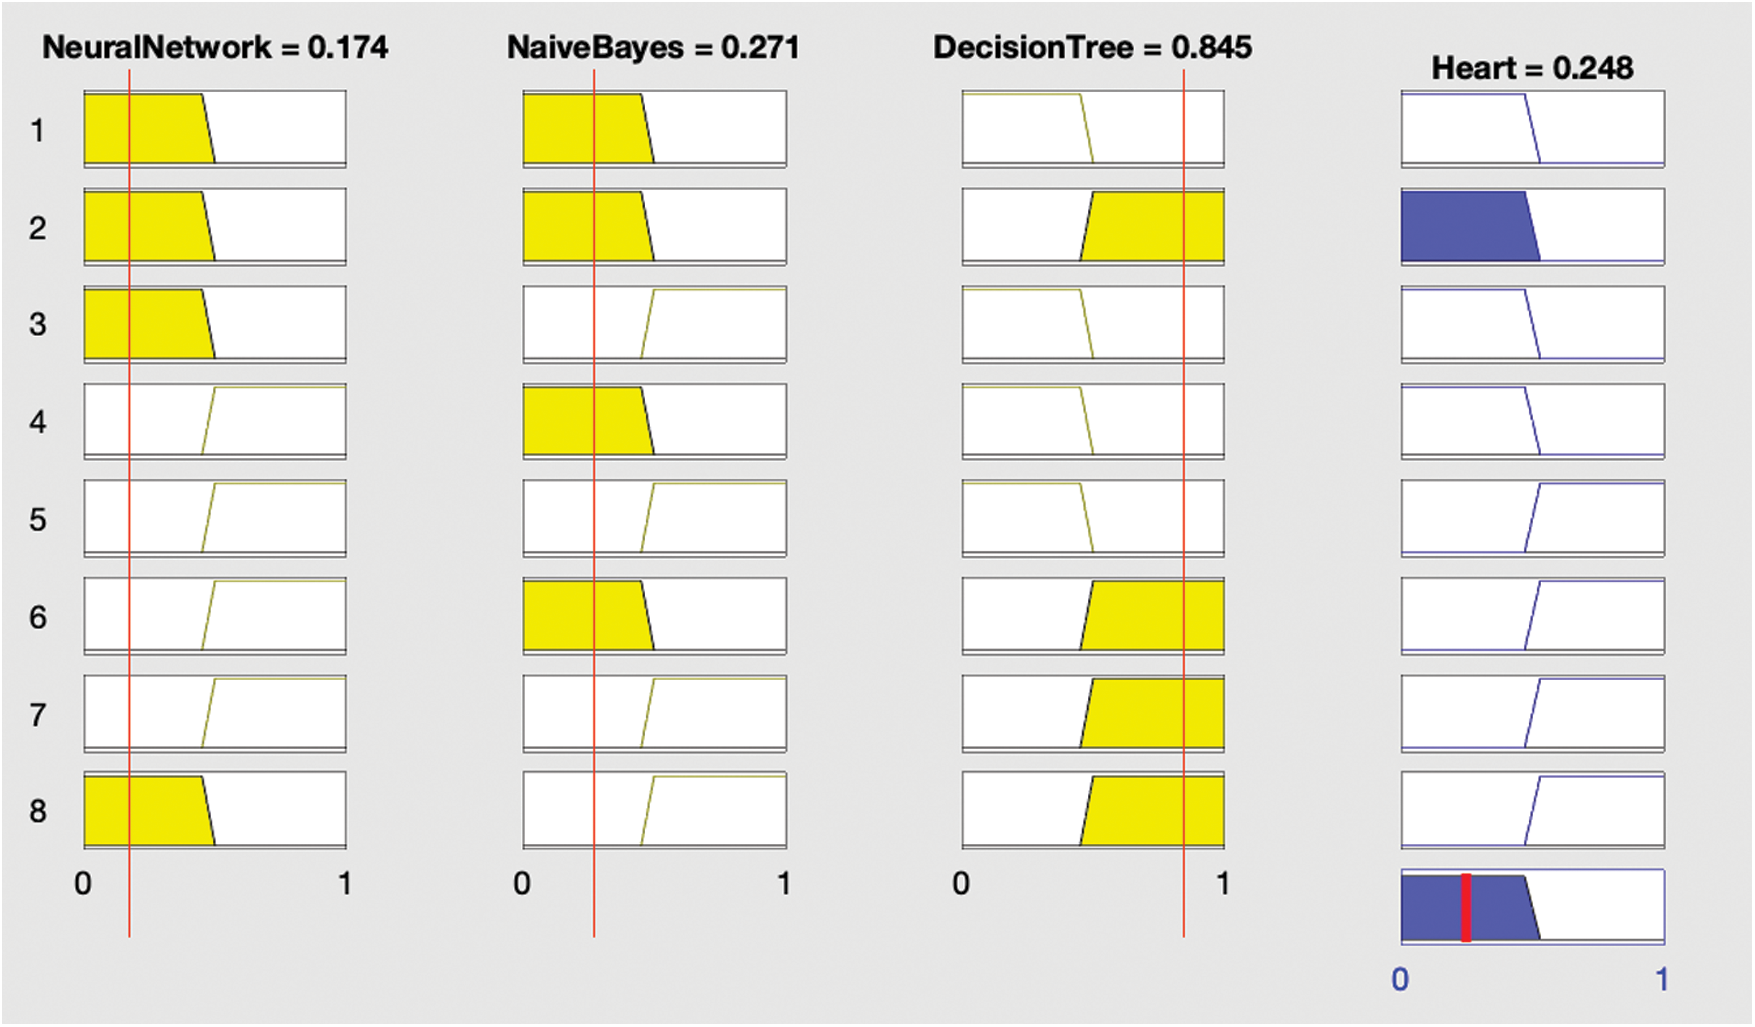
After each optimization, the optimized model was stored in the cloud before creating and implementing fuzzy logic on the results of the optimized classification algorithms as shown in Fig. 2. This involved using the results of the ANN, DT, and NB classifications to generate output using fuzzy rules as shown in Figs. 3 and 4; this output was again stored in the cloud.

Figure 2: Proposed fuzzy output using the decision tree and artificial neural network classifications

Figure 3: Results showing the presence of heart disease
Conditional (if–then) statements are used to construct fuzzy logic. Fuzzy rules are then constructed based on this logic. In these statements, HD represents heart disease:
IF (ANN is yes, and NB is yes, and DT is also yes) THEN (HD is yes).
IF (ANN is yes, and NB is yes, and DT is no) THEN (HD is yes).
IF (ANN is yes, and NB is no, and DT is yes) THEN (HD is yes).
IF (ANN is no, and NB is yes, and DT is yes) THEN (HD is yes).
IF (ANN is no, and NB is no, and DT is also no) THEN (HD is no).
IF (ANN is yes, and NB is no, and DT is no) THEN (HD is no).
IF (ANN is no, and NB is no, and DT is yes) THEN (HD is no).
IF (ANN is no, and NB is yes, and DT is no) THEN (HD is no).

Figure 4: Results showing absence of heart disease
The rules indicate that if any two of the three supervised classification techniques are true then heart disease is considered present; if not, heart disease is not present.
The second layer of the recommended framework concerns the real-time classification of heart disease. Real-time patient data were inputted into the ML-fused model; hypothetically, the results can then be used to schedule appointments. Patients predicted to have cardiovascular disease could be given appointments on an emergency basis; patients predicted to have non-cardiovascular disease could be given a regularly scheduled appointment.
Each stage systematically interacts with the next stage. We generated a dataset comprising five databases to initiate the model. For greater accuracy, we optimized geodemographic diffusion.
Our experiment comprised 1190 cases and considered 12 attributes shown in Tab. 1. We further refined the data by identifying distorted data, including conflicting records or missing values, after the consolidation of the dataset into a single fuzzy database. At this stage, we eliminated these data to achieve more accurate predictions. Refined data were then classified into two broad categories: testing and training. The training layer was initiated using the selected data, with the three most appropriate ML techniques implemented: ANN, DT, and NB.

The following mathematical equations were applied to obtain results:
First, we used a neural network to classify the data, which involved establishing an ANN structure using 70% of the cases for training data (833 of 1190) and the remaining 30% of cases (357) for testing data. As shown in Tab. 2, 393 of the records used for training were negative and 440 were positive; the training process classified 351 as negative and 400 as positive, which indicates an accuracy of 90.20% and a miss rate of 9.80%. For the testing data, 144 records were negative and 28 were positive, with the testing process producing an accuracy of 85.40% and a miss rate of 14.60%.

The NB classification shown in Tab. 3 classified 337 training records as negative and 366 as positive, which indicates an accuracy of 84.40% and a miss rate of 15.60%. For testing data, NB classified 142 records as negative and 158 as positive, which indicates 84.00% accuracy and a miss rate of 16.00%.

The DT classification shown in Tab. 4 classified 358 training records as negative and 399 as positive, which indicates 90.90% accuracy and a miss rate of 9.10%. For testing data, DT classified 141 records as negative and 174 as positive, which indicates 88.20% accuracy and a miss rate of 11.80%.

Subsequent test data records were used for the fuzzy-based system along with the output class to arrive at the final classification. The fuzzy-based system classified 150 records as negative and 176 records as positive (Tab. 5). A comparison of the output of the fuzzy-based system with the expected output revealed an accuracy of 89.30% and a miss rate of 10.70%.

The consolidated results of all classification techniques and the proposed model are presented in Tab. 6. The fuzzy model performed better based on accuracy measurements.

Further analysis of the model in relation to input parameters was provided by the decision support system. Accordingly, the specific predictions of the three classifiers along with the results derived from the fuzzy-based system are presented in Tab. 7.

Finally, the proposed framework is compared with frameworks described in previous research (Tab. 8). The results obtained from the proposed framework in this study is compared with Hybrid random forest linear model (HRFLM) [20], NB [20], DT [20], Support vector machine with the Radial basis function (SVM RBF) [21], Logistic Regression [9], and Framingham Risk Score [9]. The accuracy results of the proposed fuzzy framework are significantly higher than those obtained from previous research.

Accurately predicting heart disease using ML techniques is a challenge. This research paper proposed a cloud-based prediction model that used ML techniques. The approach features seven phases: dataset collection, data fusion, pre-processing, training, performance evolution, ML fusion, and real-time testing. Three widely used ML techniques were used: ANN, DT, and NB. The combined results of the ANN, NB, and DT classifications were tested using a fuzzy-based system. The ratio of training data to testing data was set to 70:30, which enabled accurate prediction. The classification process for all of the techniques was combined with results obtained by the fuzzy-based system, and the processes were conducted until accuracy levels could be observed. The results demonstrated that the proposed fuzzy-based model is 91.30% accurate.
Acknowledgement: We are grateful to our families and colleagues for their emotional support.
Funding Statement: The authors received no specific funding for this study.
Conflicts of Interest: The authors declare that they have no conflicts of interest to report regarding the present study.
1. I. Javid, A. K. Z. Alsaedi and R. Ghazali, “Enhanced accuracy of heart disease prediction using machine learning and recurrent neural networks ensemble majority voting method,” International Journal of Advanced Computer Science and Applications, vol. 11, no. 3, pp. 540–551, 2020. [Google Scholar]
2. M. E. Pierpont, M. Brueckner, W. K. Chung, V. Garg, R. V. Lacro et al., “Genetic basis for congenital heart disease: Revisited: A scientific statement from the American heart association,” Circulation, vol. 138, no. 21, pp. 1–12, 2018. [Google Scholar]
3. A. Prasanth, M. Bajpei, V. Shrivastava and R. G. Mishra, “Cloud computing: A survey of associated services,” Cloud Computing: Reviews, Surveys, Tools, Techniques and Applications, vol. 13, pp. 1–15, 2015. [Google Scholar]
4. N. C. Reddy, S. S. Nee, L. Zhi Min and C. Xin Ying, “Classification and feature selection approaches by machine learning techniques: Heart disease prediction,” International Journal of Innovative Computing, vol. 9, no. 1, pp. 10–17, 2019. [Google Scholar]
5. H. Xia, I. Asif and X. Zhao, “Cloud-ecg for real time ecg monitoring and analysis,” Computer Methods and Programs in Biomedicine, vol. 110, no. 3, pp. 253–259, 2013. [Google Scholar]
6. A. Hassan, H. M. Bilal, M. A. Khan, M. F. Khan, R. Hassan et al., “Enhanced fuzzy resolution appliance for identification of heart disease in teenagers,” in Int. Conf. on Information Technology and Applications, Bahawalpur, Pakistan, pp. 28–37, 2019. [Google Scholar]
7. S. Kumar and G. Kaur, “Detection of heart diseases using fuzzy logic,” International Journal of Engineering Trends and Technologies, vol. 4, no. 6, pp. 2694–2699, 2013. [Google Scholar]
8. I. P. Atamanyuk and Y. Kondratenko, “Calculation method for a computer’s diagnostics of cardiovascular diseases based on canonical decompositions of random sequences,” in Information and Communication Technologies in Education Conf., Lviv, Ukraine, pp. 108–120, 2015. [Google Scholar]
9. J. K. Kim and S. Kang, “Neural network-based coronary heart disease risk prediction using feature correlation analysis,” Journal of Healthcare Engineering, vol. 2017, pp. 1–11, 2017. [Google Scholar]
10. M. Chen, Y. Hao, K. Hwang, L. Wang and L. Wang, “Disease prediction by machine learning over big data from healthcare communities,” IEEE Access, vol. 5, no. 1, pp. 8869–8879, 2017. [Google Scholar]
11. R. R. Kouser, T. Manikandan and V. V. Kumar, “Heart disease prediction system using artificial neural network, radial basis function and case based reasoning,” Journal of Computational and Theoretical Nanoscience, vol. 15, no. 9, pp. 2810–2817, 2018. [Google Scholar]
12. S. Y. Siddiqui, A. Athar, M. A. Khan, S. Abbas, Y. Saeed et al., “Modelling, simulation and optimization of diagnosis cardiovascular disease using computational intelligence approaches,” EAI Endorsed Transactions on Internet of Things, vol. 5, no. 18, pp. 1–15, 2019. [Google Scholar]
13. A. Manimaran, V. M. Chandrasekaran and B. Praba, “A review of fuzzy environmental study in medical diagnosis system,” Research Journal of Pharmacy and Technology, vol. 9, no. 2, pp. 177–184, 2016. [Google Scholar]
14. O. W. Samuel, G. M. Asogbon, A. K. Sangaiah, P. Fang and G. Li, “An integrated decision support system based on ann and fuzzy_ahp for heart failure risk prediction,” Expert Systems with Applications, vol. 68, no. 10, pp. 163–172, 2017. [Google Scholar]
15. B. Zebardast, R. Rashidi, T. Hasanpour and F. S. Gharehchopogh, “Artificial neural network models for diagnosing heart disease: A brief review,” International Journal of Academic Research, vol. 6, no. 3, pp. 73–78, 2014. [Google Scholar]
16. C. S. Dangare and S. S. Apte, “Improved study of heart disease prediction system using data mining classification techniques,” International Journal of Computer Applications, vol. 47, no. 10, pp. 44–48, 2012. [Google Scholar]
17. J. H. O. Keefe, N. Bergman, P. Carrera-Bastos, M. F. Villalba, J. J. D. Nicolantonio et al., “Nutritional strategies for skeletal and cardiovascular health: Hard bones, soft arteries, rather than vice versa,” Open Heart, vol. 3, no. 1, pp. 1–8, 2016. [Google Scholar]
18. M. Siddhartha, “Heart disease dataset (Comprehensive)
19. F. Fernandez, “Diabetes from DAT263x lab01, predict who has and who doesn’t have diabetes from physical data,” Kaggle.com, 2018. [Online]. Available: https://www.kaggle.com/fmendes/diabetes-from-dat263x-lab01. [Google Scholar]
20. S. Mohan, C. Thirumalai and G. Srivastava, “Effective heart disease prediction using hybrid machine learning techniques,” IEEE Access, vol. 7, pp. 81542–81554, 2019. [Google Scholar]
21. A. U. Haq, J. P. Li, M. H. Memon, S. Nazir, R. Sun et al., “A hybrid intelligent system framework for the prediction of heart disease using machine learning algorithms,” Mobile Information System, vol. 2018, pp. 1–12, 2018. [Google Scholar]
 | This work is licensed under a Creative Commons Attribution 4.0 International License, which permits unrestricted use, distribution, and reproduction in any medium, provided the original work is properly cited. |