DOI:10.32604/cmc.2021.018593
| Computers, Materials & Continua DOI:10.32604/cmc.2021.018593 | |
| Article |
Optimization of Sentiment Analysis Using Teaching-Learning Based Algorithm
Center for Artificial Intelligence Technology, Faculty of Information Science & Technology, Universiti Kebangsaan, Kajang, 43000, Malaysia
*Corresponding Author: Nor Samsiah Sani. Email: norsamsiahsani@ukm.edu.my
Received: 12 March 2021; Accepted: 16 April 2021
Abstract: Feature selection and sentiment analysis are two common studies that are currently being conducted; consistent with the advancements in computing and growing the use of social media. High dimensional or large feature sets is a key issue in sentiment analysis as it can decrease the accuracy of sentiment classification and make it difficult to obtain the optimal subset of the features. Furthermore, most reviews from social media carry a lot of noise and irrelevant information. Therefore, this study proposes a new text-feature selection method that uses a combination of rough set theory (RST) and teaching-learning based optimization (TLBO), which is known as RSTLBO. The framework to develop the proposed RSTLBO includes numerous stages: (1) acquiring the standard datasets (user reviews of six major U.S. airlines) which are used to validate search result feature selection methods, (2) pre-processing of the dataset using text processing methods. This involves applying text processing methods from natural language processing techniques, combined with linguistic processing techniques to produce high classification results, (3) employing the RSTLBO method, and (4) using the selected features from the previous process for sentiment classification using the Support Vector Machine (SVM) technique. Results show an improvement in sentiment analysis when combining natural language processing with linguistic processing for text processing. More importantly, the proposed RSTLBO feature selection algorithm is able to produce an improved sentiment analysis.
Keywords: Feature selection; sentiment analysis; rough set theory; teaching-learning optimization algorithms; text processing
Sentiment analysis is a text-classification task aimed at evaluating the polarity (positive or negative) of the opinions expressed within a single document. It serves to analyze and identify the type of sentiments in text-based user reviews [1]. With the development of internet and social media, people use social sites, websites, blogs, and forums more often as the primary mediums for expressing their comments, views, opinions on services, issues, ideas, and various other things [2]. Thus, sentiment analysis plays an important role in analyzing reviews, views, and opinions presented by users in order to evaluate the feedback on a specific aspect [3]. The results of this analysis are very useful to service providers in improving the quality of their respective services. Indirectly, these results can also help service providers increase the profitability of their respective organizations.
Sentiment analysis originates from text mining technology, natural language processing, and text classification methods [4]. It helps classify text-shaped information such as customer reviews of services, politics, products, and others such as positive or negative sentiments [5–8]. Sentiment analysis can be divided into three techniques: lexicon-based techniques, machine learning-based techniques, and hybrid techniques [9]. Machine learning technique is one of the most popular methods for classifying sentiments. This technique is combined with language methods to identify the categories of sentiments present in a text [1]. Three main processes in sentiment analysis were implemented in this study, namely data processing, feature selection, and sentiment classification.
One of the key problems in the study of sentiments is managing user feedback on social media, websites, forums, and blog texts that contain noisy and unimportant details. Such data need to be managed and processed regularly before the performance of sentiment analysis can be carried out [10]. From a study conducted by [10], it was found that text-processing techniques play an important role in ensuring the accuracy of sentiment prediction and also in influencing the computation time during sentiment classification. Text processing was developed to analyze and prepare the text for sentiment classification [11].
In addition, the presence of large feature size is a common problem in sentiment analysis. Large feature size affects the performance of sentiment classification and its processing time. However, this problem can be overcome using machine learning methods that use appropriate feature set selection techniques to eliminate noisy and irrelevant features [1,5,12–16]. Feature selection is a volatile polynomial problem and requires efficient algorithms such as metaheuristic algorithms to assist [17–19].
According to [20], most of the existing feature selection algorithms require specific parameters. Algorithms that use specific parameters need to adjust the value of those parameters to an exact value in order to get good results. For example, genetic algorithms require specific parameters such as cross-probability, mutation rate, and selection method parameters. Accordingly, [20] introduced the teaching–learning-based optimization (TLBO) algorithm that does not require specific parameters to function properly.
Typically, the reviews in datasets containing user reviews have a lot of noise and irrelevant information that makes it difficult to process and analyze information accurately and in detail for identifying customer sentiments regarding service quality and the types of services preferred and disliked by customers. This information that is obtained from social sites and the internet is constantly evolving and changing over time, which renders the manual analysis of reviewing information to become ineffective, irrelevant, and one that requires a lot of effort, often resulting in inaccurate findings. This is a major problem faced by service providers in identifying customer sentiments towards the services and customer feedback provided as a whole. Therefore, a mechanism needs to be developed to analyze user reviews to identify customer sentiments. Therefore, in this study, we have identified a great opportunity to develop a feature selection and feature reduction algorithm for sentiment classification. For this, we used a combination of feature selection based on RST and TLBO, which is referred to as RSTLBO, to reduce the dimension size of features and select a subset of quality features for sentiment classification. The following contributions made by this paper have been summarized as follow.
• It has identified the effect of text-processing methods from natural language processing categories on the accuracy of sentiment analysis predictions.
• It has proposed an RSTLBO-based algorithm for feature selection and feature reduction in sentiment classification.
The following sections in this paper present the following aspects: Section 2 describes the studies conducted on the topics discussed. Section 3 describes the research methodology. Section 4 discusses the results of this study. Lastly, Section 5 summarizes the results of this study.
Text processing and feature selection are two very important processes in sentiment classification systems. Text processing involves preparing a dataset with user reviews that were obtained from social sites, websites, forums, and more. This dataset of reviews usually contains a lot of noise, irrelevant, and meaningless fragments such as HTML tags, scripts, advertising, and other such things. Therefore, these reviews need to be cleaned and converted into a dataset format to prepare them to be processed for feature selection and sentiment classification through text processing. The feature selection process helps reduce the dimensions of the dataset generated from text processing. Typically, this user review dataset contains features of various sizes and is relatively difficult to be processed manually. In order to tackle this difficulty, it is processed through computing operations using feature selection algorithms. These feature selection algorithms produce small-dimensional datasets that can be used in the sentiment-classification process. Various feature selection algorithms have been developed, but most of them are recommended for studies in the field of engineering and other fields. Very few studies have been conducted on sentiment analysis.
Manimekalai et al. [21] described sentiments as opinion mining, which is the field of studying customer reviews and opinions, ideas, evaluations, human emotions, or attitudes towards different aspects such as services, organizations, products, events, individuals, and so on. Reference [22] used the example of a dataset of text documents with user reviews on a topic and cited that the main purpose of sentiment analysis is to identify and evaluate the features of the comments on an object within a document. Reference [23] explained that sentiment analysis works by extracting sentiments or opinions from textual documents. It is based on text-mining technology, natural language processing, and text classification. It involves the study of the relationship between text-shaped data through text processing. It serves to categorize text-shaped information such as consumer reviews of services, politics, products, and others into positive or negative sentiments [5,6]. Sentiment analysis can be divided into three techniques–-lexicon-based sentiment analysis, machine learning-based sentiment analysis, and hybrid techniques, as shown in Fig. 1.
The machine learning technique is one of the most popular methods of classifying sentiments. This technique is combined with language methods to categorize sentiments within the text [1]. Three main processes in sentiment analysis were implemented in this study; namely data processing, feature selection, and sentiment classification. Each process plays an important function in improving the performance of sentiment classification and also helps to improve the accuracy of the results of the sentiment analysis. Before performing sentiment analysis, it is important to identify the data sources; whether they were obtained from social media, reports, documents, databases, or others. These data sources contain hidden information that needs to be analyzed to uncover information hidden in the information. Most data derived from social media contain noise and irrelevant data, as well as meaningless information [24]. These elements make the process of classifying sentiment on information obtained from social media very challenging. Accordingly, to enable the smooth processing of this information, it needs to undergo a transformation process, i.e., a process of purification and analysis called text processing [25]. The data that has gone through this process can then be used for the feature selection method, and then the sentiments with the information can be classified.
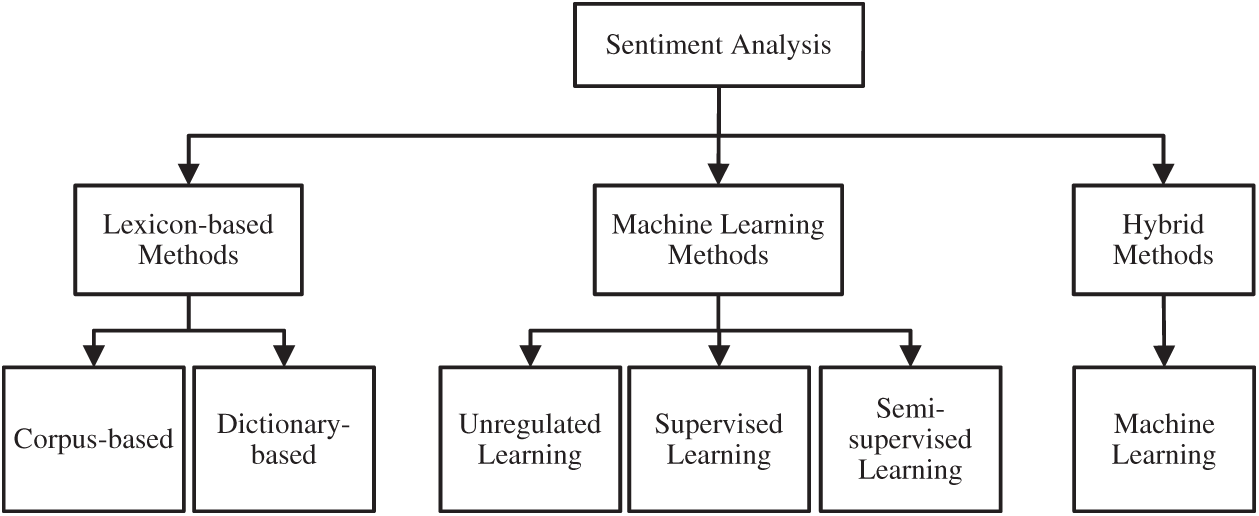
Figure 1: Category of sentiment analysis [7]
The rough set theory (RST) technique, which was introduced by [26], comes from simple model information. RST is considered a new mathematical tool for processing uncertain information after the uncertainty theory [27] and fuzzy set theory [28] for data analysis and data processing. RST has been identified as an effective mathematical method of minimizing data from information systems as well as a mathematical tool for solving uncertain problems [29]. RST has well-structured procedures, algorithms, and specialized tools to identify patterns and has the ability to find valid reductions, i.e., find the minimum set of features using the reduct function.
Teaching-learning-based optimization (TLBO) is similar to other algorithms inspired by natural situations in learning sessions within classrooms [20]. It is a population-based metaheuristic algorithm that uses population solutions to find global solutions. In TLBO, a population is a group of students or a full class. The process of TLBO can be divided into two sessions: the first session is the teaching phase, while the second session is the learning phase. The teaching session involves learning from the instructor, and the learning session is related to the learning process between students and students. This TLBO method is based on the effect of the teacher’s influence on student output; in this case, student outputs correspond to student results or performance. Instructors are generally considered to be highly educated individuals and will share their knowledge with their students. The quality of instructors will affect the quality of students’ performance. Thus, it can be said that quality teachers will produce quality students. TLBO is carried out to obtain a global solution without the need for burdensome computational efforts and high consistency [20].
There are three types of classification levels in sentiment analysis–-document, sentence, and feature levels. At the document sentiment classification level, each document is classified according to positive and negative groups [23,30]. Classification of sentiments at the sentence level categorizes sentences into positive or negative groups. Finally, the classification of sentiments at the feature level helps identify sentiments behind each word based on the elements and features found in the review sentence, for example, as per the studies conducted by [31,32]. One of the challenges in identifying the relationship of sentiment words with a feature is that a sentiment word can have different meanings depending on the circumstances and fields in which it has been used. The classification at the feature level is very complicated as it entails clear identification of the relationship between the feature and the sentiment word in the review sentence. Despite these challenges, the result of this classification is more accurate and complete as compared to the classification at the document and sentence levels [33].
The research methodology consists of four phases starting with text processing phase, feature selection algorithm development phase, classification of sentiment phase; and testing, evaluation, and analysis phase, as shown in Fig. 2. The benchmark dataset used in this study was obtained from the Kaggle website. The dataset includes user reviews of six major U.S. airlines obtained from Twiter in February 2015. It contains 14,640 reviews, 2,363 of which have been labeled positive, 3,099 as neutral, and the remaining 9,178 as negative.
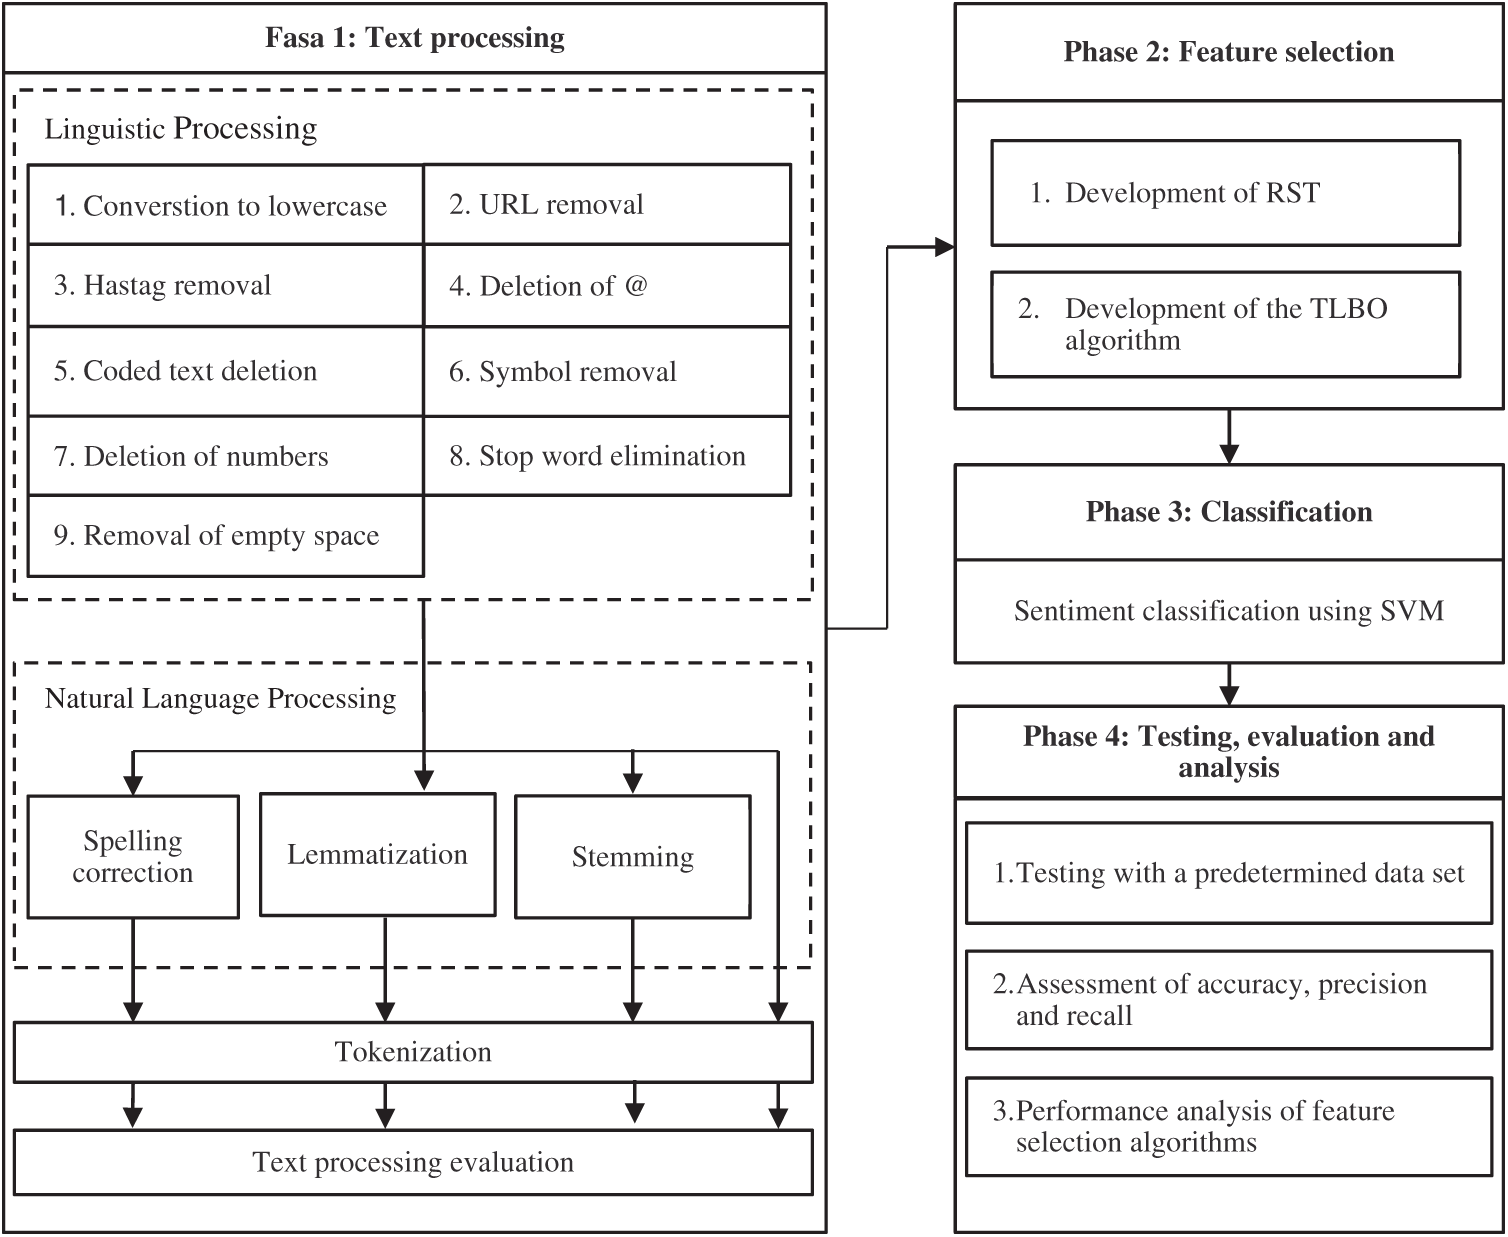
Figure 2: Research methodology
This process involves data cleaning and arranging the selected dataset into a format that would allow it to be processed through feature selection. The input in this phase is a benchmark dataset consisting of user reviews on Twitter that were labeled with sentiment information.
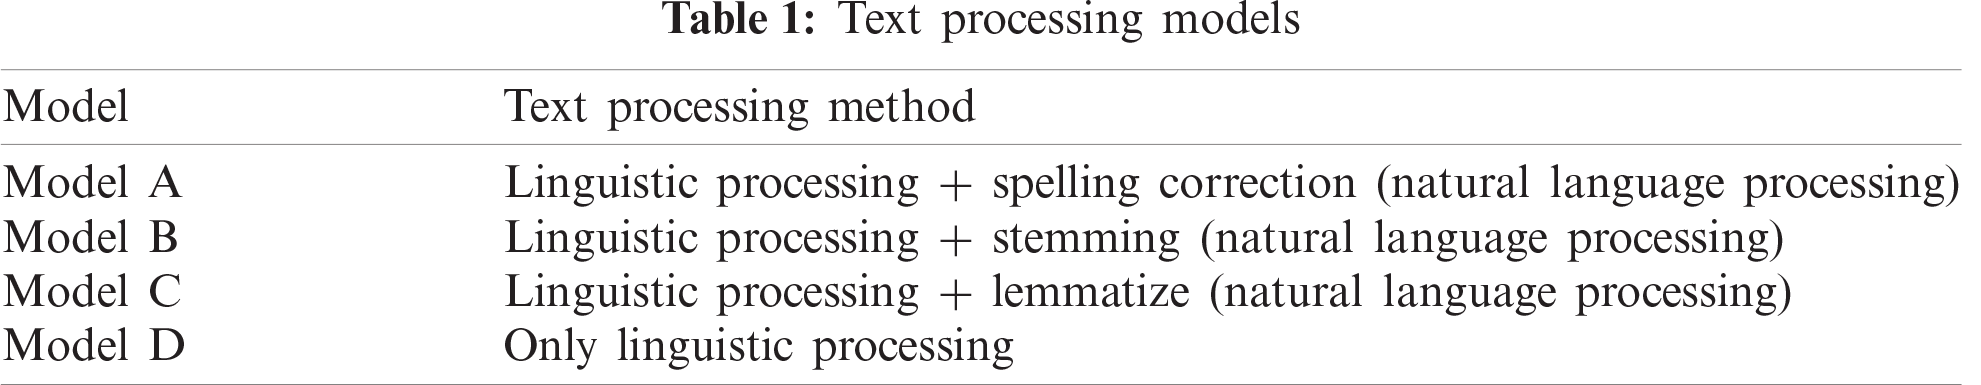
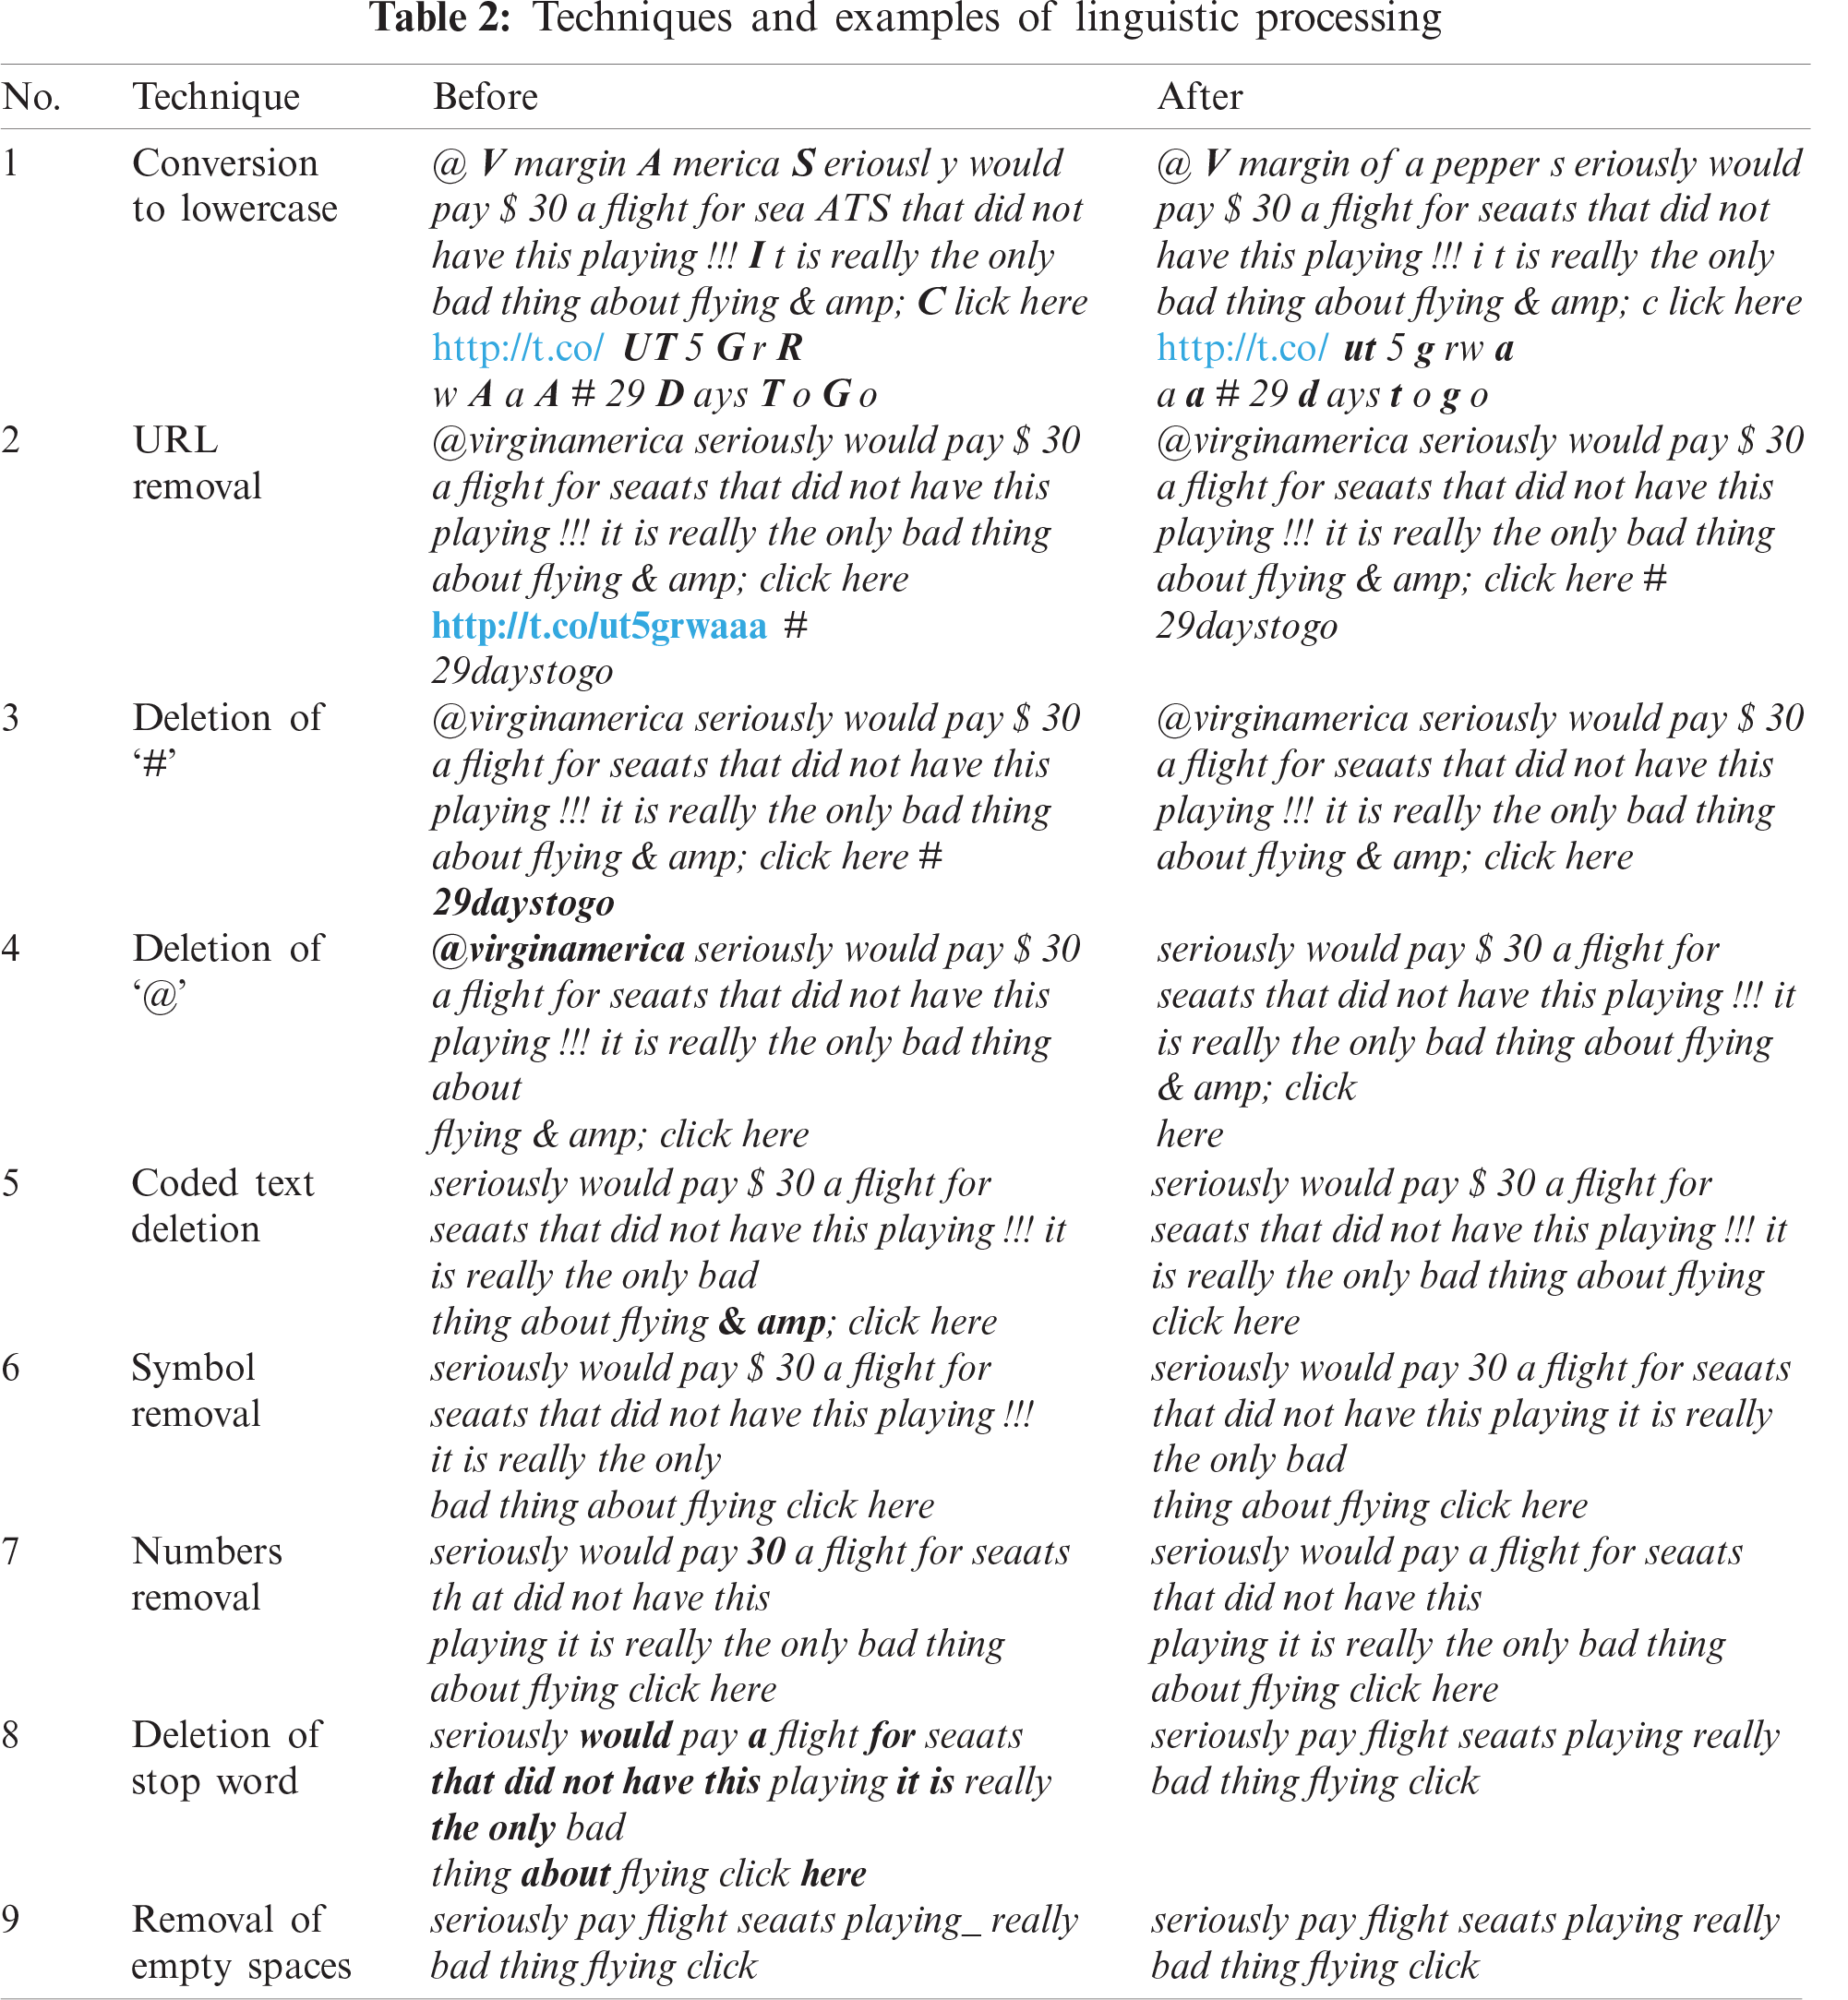
In this process, every sentence in user reviews is extracted and stored in the MySQL database. This dataset then goes through two types of text processing: linguistic processing and natural language processing. The linguistic processing used in this study consists of nine text processing techniques, including conversion to lowercase, URL removal, ‘#’ removal, ‘@’ removal, symbol removal, number removal, blank space removal, stop word removal and coded text removal. Tab. 1 presents four text processing models that were tested and evaluated. The model that produced the best sentiment classification results was selected as the text processing method to create a list of small-sized feature sets. For the latter, three techniques have been chosen: spelling correction, stemming, and lemmatization.
a) Linguistic Processing
Tab. 2 presents the techniques of linguistic processing along with examples performed in this study.
b) Natural Language Processing
Natural language processing consists of three text processing techniques: spelling correction, lemmatization, and stemming, as shown in Tab. 3.
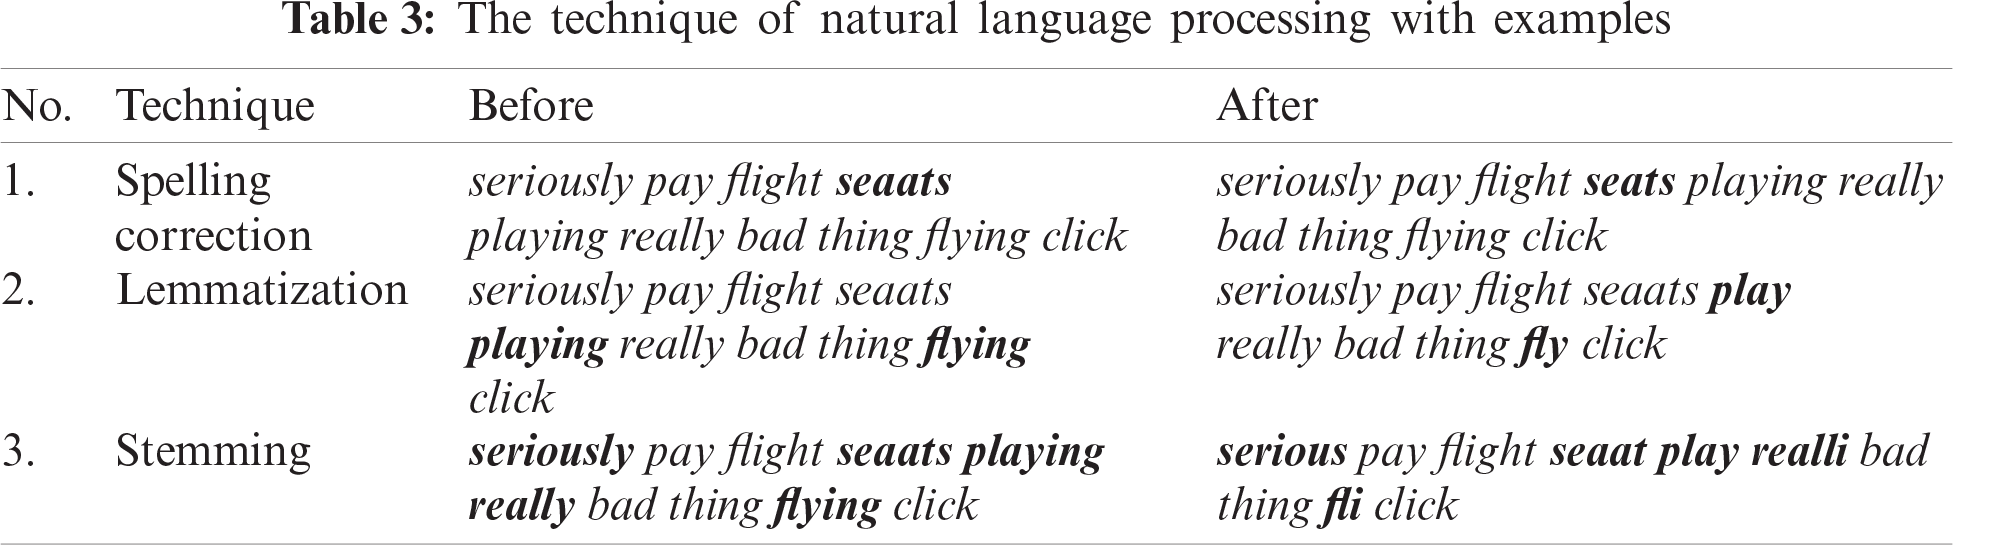
Tokenization is the process of breaking down a review sentence from a dataset into a series of features. For example, the sentence “seriously pay flight seats playing really bad thing flying click” is converted into a series of the following words–-“seriously,” “pay,” “flight,” “seats,” “playing,” “really,” “bad,” “thing,” “flying,” “click.” Each resultant word from this tokenization is considered a feature set, which will be used for text-classification steps in text processing methods.
3.1.3 Text Processing Evaluation
This evaluation process is performed using a set of features generated from the tokenization process, which are evaluated through the accuracy of sentiment classification. The classification algorithm used in this process is SVM. This evaluation is used to identify the combination of text processing methods that can produce the highest sentiment classification accuracy, which would then be selected and used in this study.
3.2 Phase 2: Development of Feature Selection Algorithm
This third phase is also the development of the RSTLBO feature selection algorithm that consists of RST and TLBO algorithm. It is developed using PHP programming and the MySQL database.
3.2.1 Development of Rough Set Theory (RST)
The technique rough set theory (RST), which was introduced by [26], was developed to reduce the dimensions of feature sets obtained from the text processing phase using the reduct function. This function evaluates and removes overlapping and irrelevant features in order to reduce the dimension size of the feature. For this process, the feature set is produced from the text processing method, as represented by the table of information system in Tab. 4. The value ‘1’ indicates the attribute of the selected feature, and ‘0’ indicates the attribute of the feature not selected.
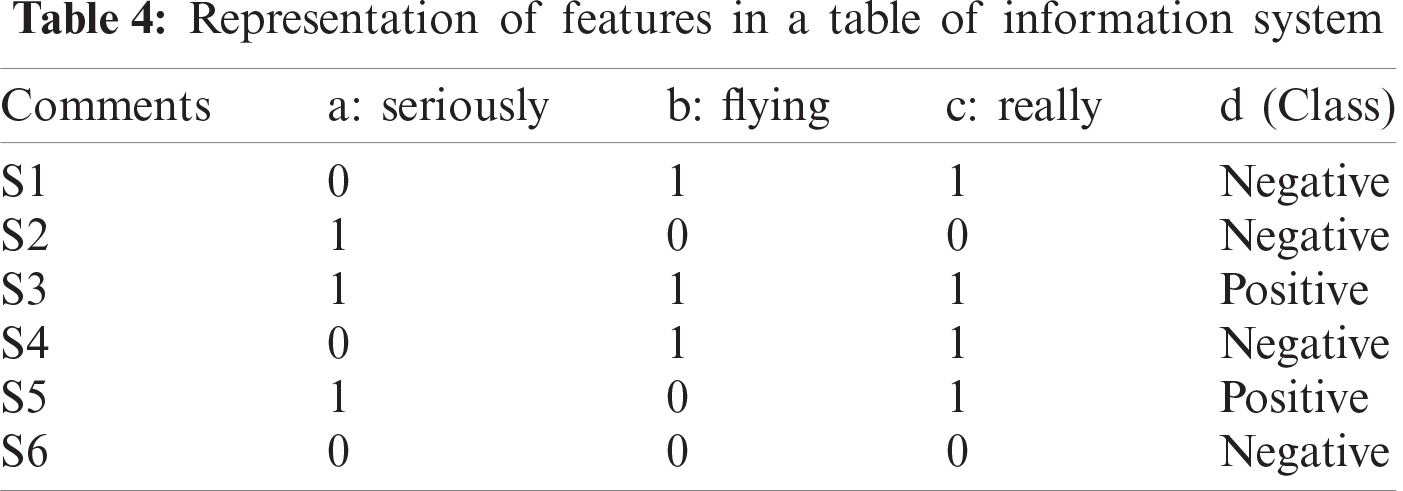
From the example in Tab. 4, there are three feature attributes, namely seriously (a), flying (b), and really (c) contained in the six user reviews (S1–S6) that have been given a class of (d) either positive or negative. Assuming
From the equation above, attribute {b} can be deleted because it does not have the value of dependency or the minimum dependency, i.e., it returns zero. The final results of the information are shown in Tab. 5.
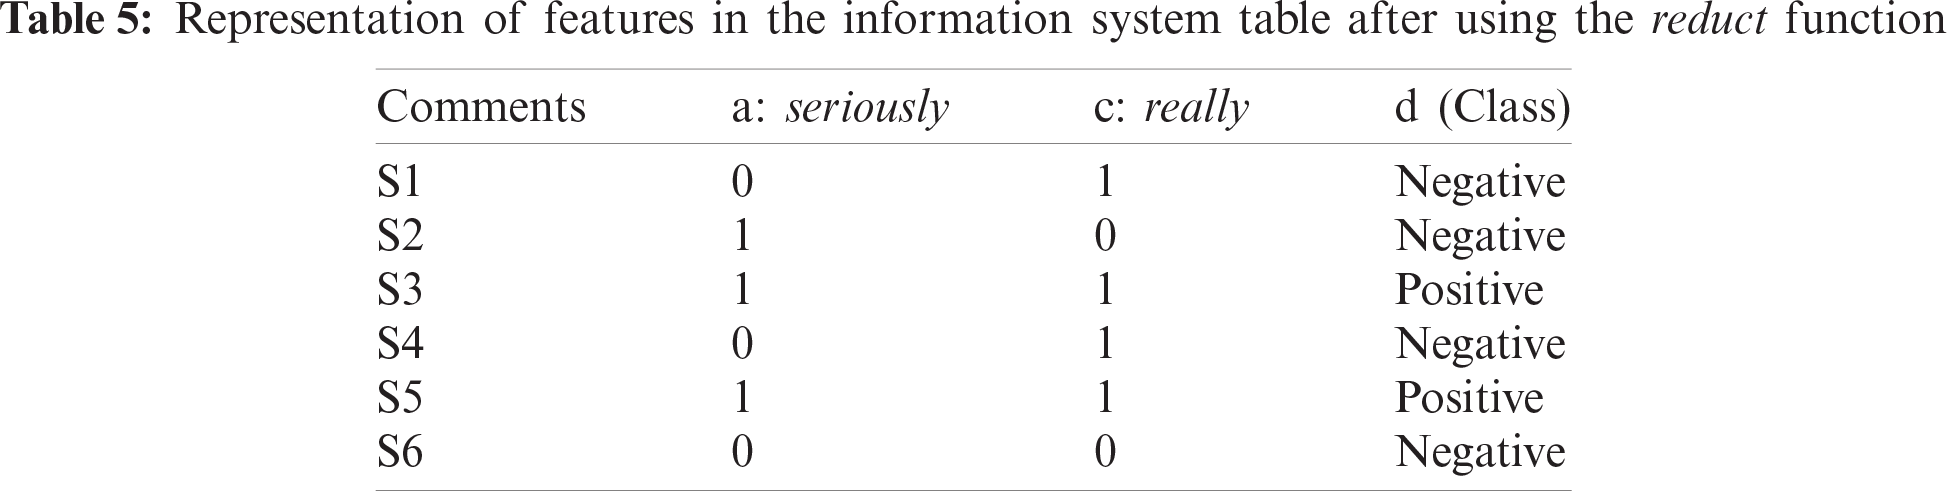
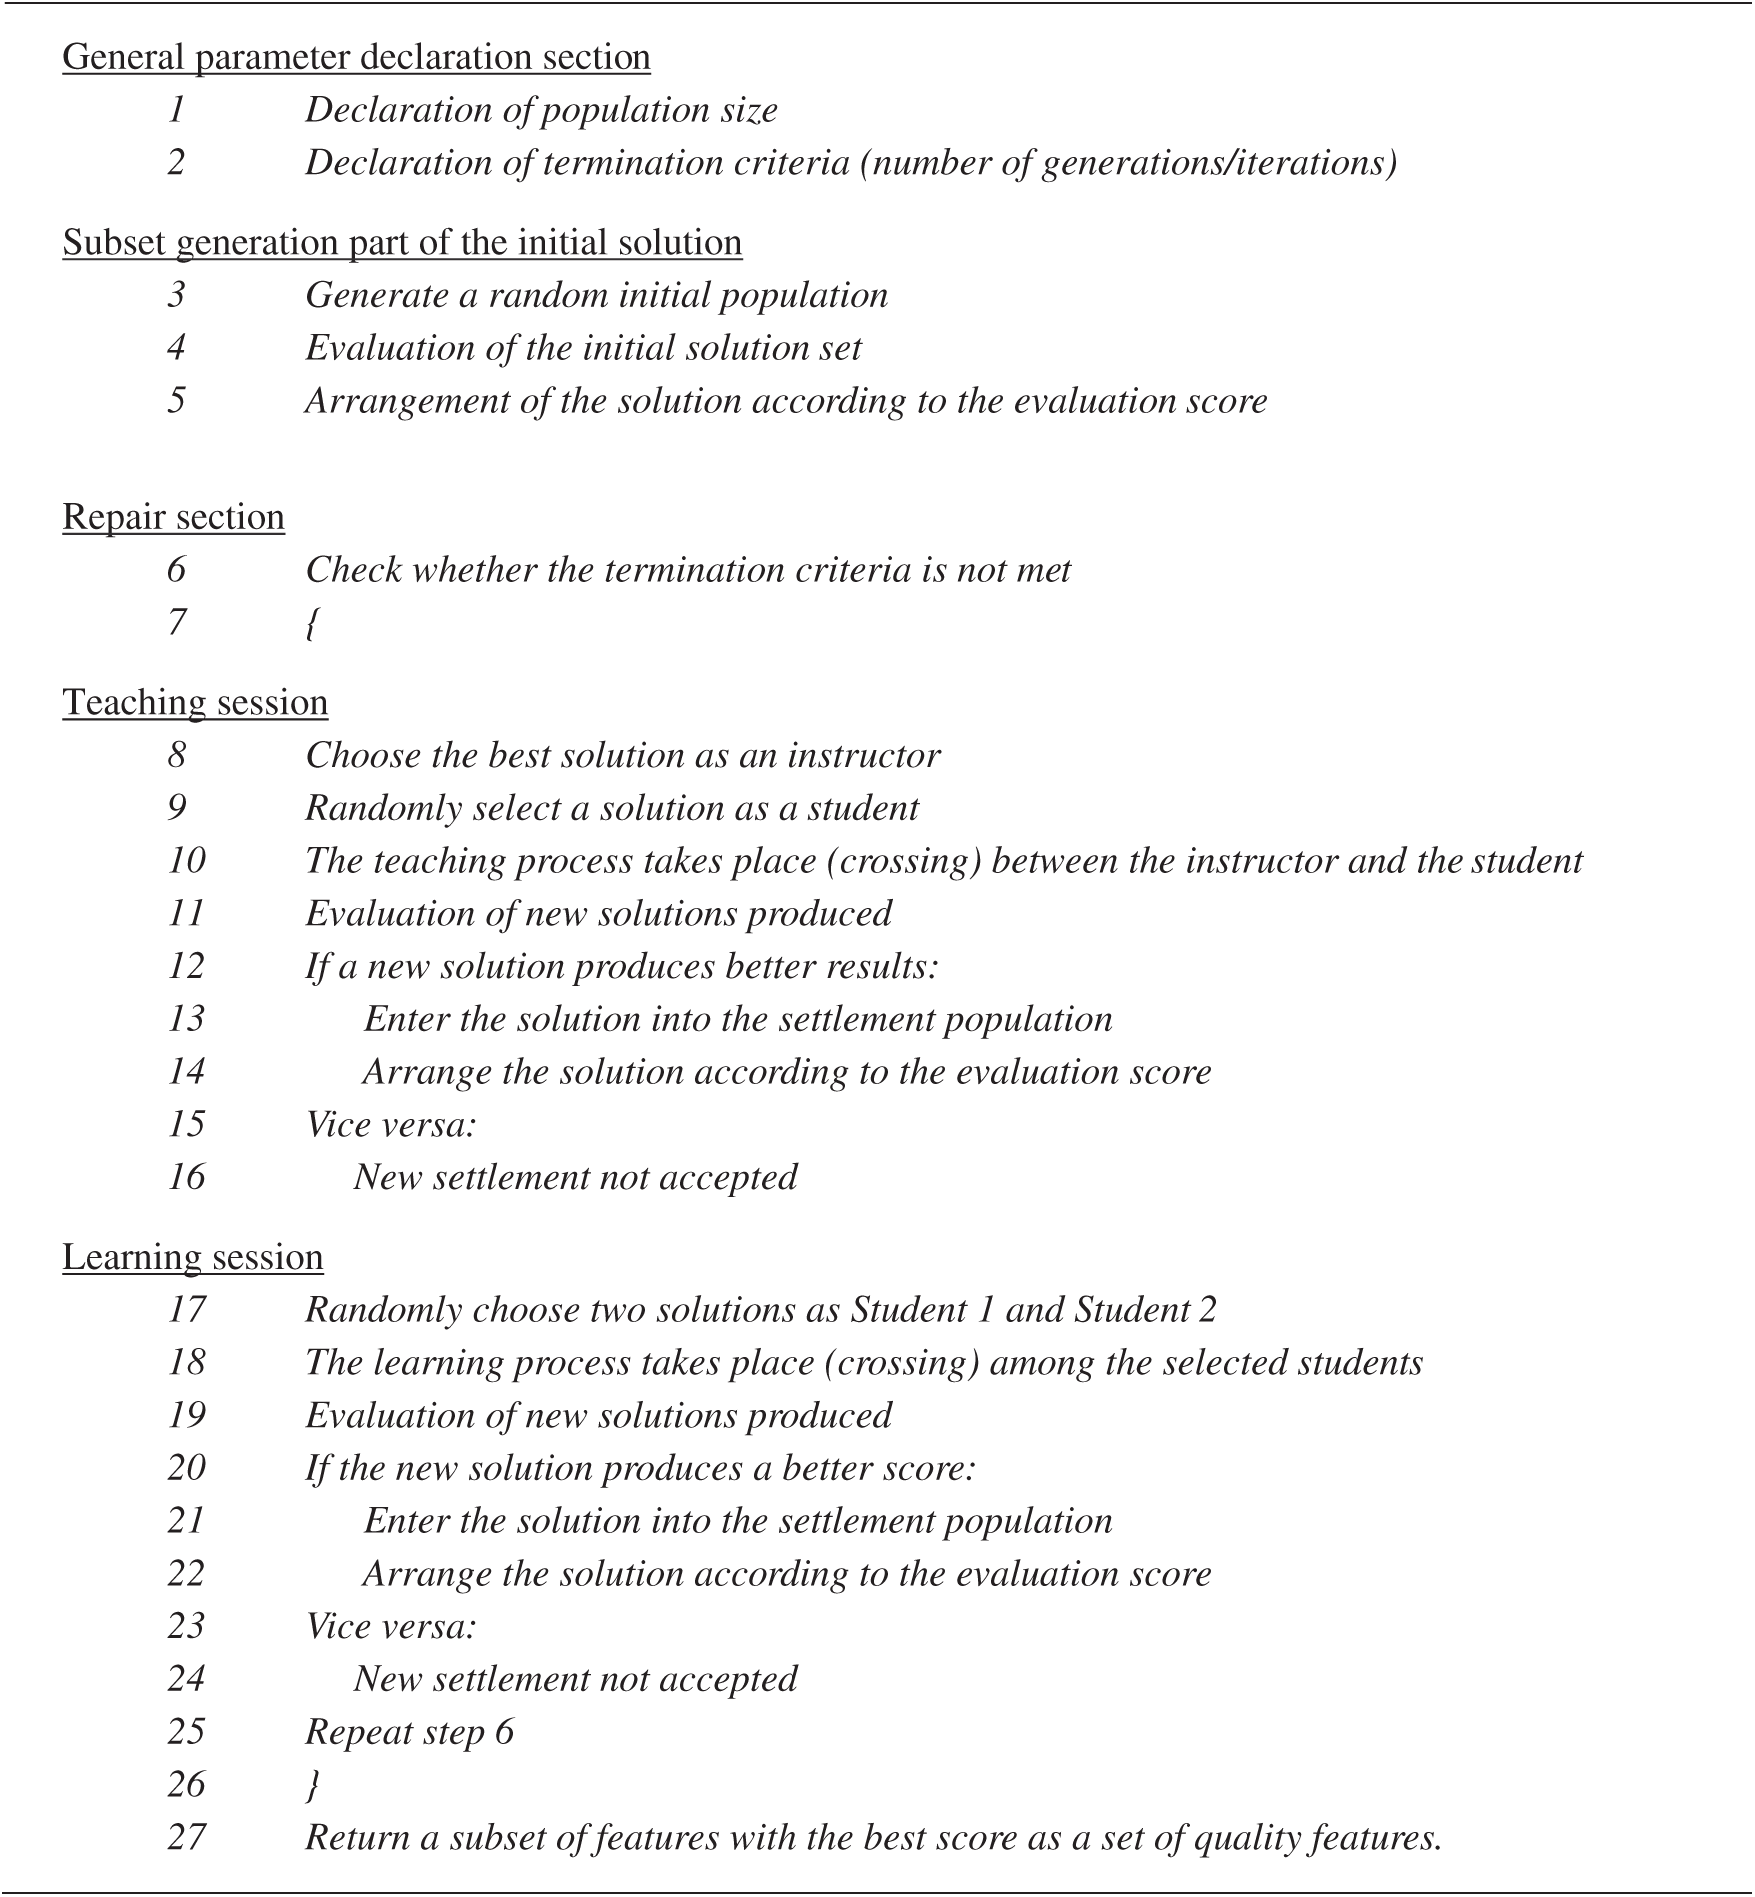
Figure 3: TLBO algorithm pseudo-code
3.2.2 Development of TLBO Algorithm
The development of the TLBO algorithm is based on the pseudocode shown in Fig. 3. In general, this algorithm’s development consists of three main parts: the declaration of general parameters, the generation of a subset of initial solution features, and improvements.
a) General Parameter Declaration Division
In the general parameter declaration section, there are two types of parameters that need to be set, namely the population size and the number of generations. In this study, the population parameter size is set to 30, and the number of generations is set to 100 [34].
b) Early Settlement Subset Generation Division
The initial solution subset is randomly generated and stored in one-dimensional-array form, as shown in Fig. 4. For example, a subset of solutions consists of six feature attributes, labeled from F1 to F6. Cells with a value of 1 represent the attributes of the selected feature, and cells with value a of 0 represent the attributes of the feature not selected.

Figure 4: Example of solution subset array
A population is considered a class, and each subset of solutions is considered a student. Meanwhile, feature attributes are considered as the subjects taken by the student. The score value is the average score for each subject taken by the student. Then, the position of the students in the class will be arranged according to the average score of the subjects taken in descending order.
Repair Division
In the repair section, this algorithm is divided into teaching and learning sessions. Before proceeding to these sessions, the termination criteria will be reviewed.
i. Teaching Session
In a teaching session, a subset of solutions with the best sentiment classification scores will be selected as instructors. Subsequently, a subset of solutions is randomly selected to be used as a student. In this example, the feature set is represented by F1, F2, F3, F4, F5, and F6. The teaching session between the instructor and the student takes place with the crossover method as shown in Fig. 5.
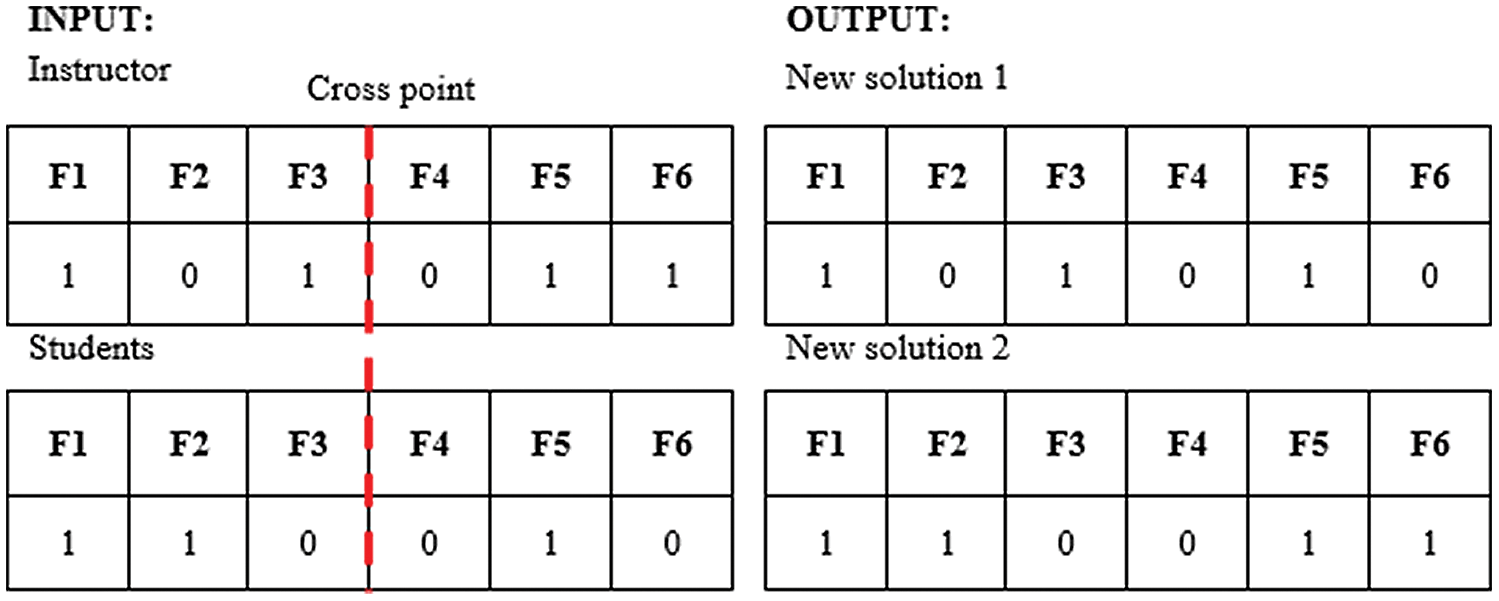
Figure 5: Teaching sessions
This teaching session will produce two new solutions, both of which will undergo the process of evaluating sentiment classification. Based on the results of this assessment, only those solutions that produce better scores than the student scores in the existing list is accepted into the population, and their position in the population will be sorted based on their scores.
ii. Learning Session
In the learning session, all students will study together to improve their scores. Therefore, in this session, two students will be randomly selected from the existing settlement population. Then, these two students will go through learning process together. In this algorithm, the learning process between the two students takes place through the crossover method, as shown in Fig. 6. The learning outcome produced two new solutions and will be evaluated based on sentiment classification performance. Then, based on the sentiment assessment scores, if the new solution is better than the original, it will be accepted, and its position in the population will be sorted according to the new score.
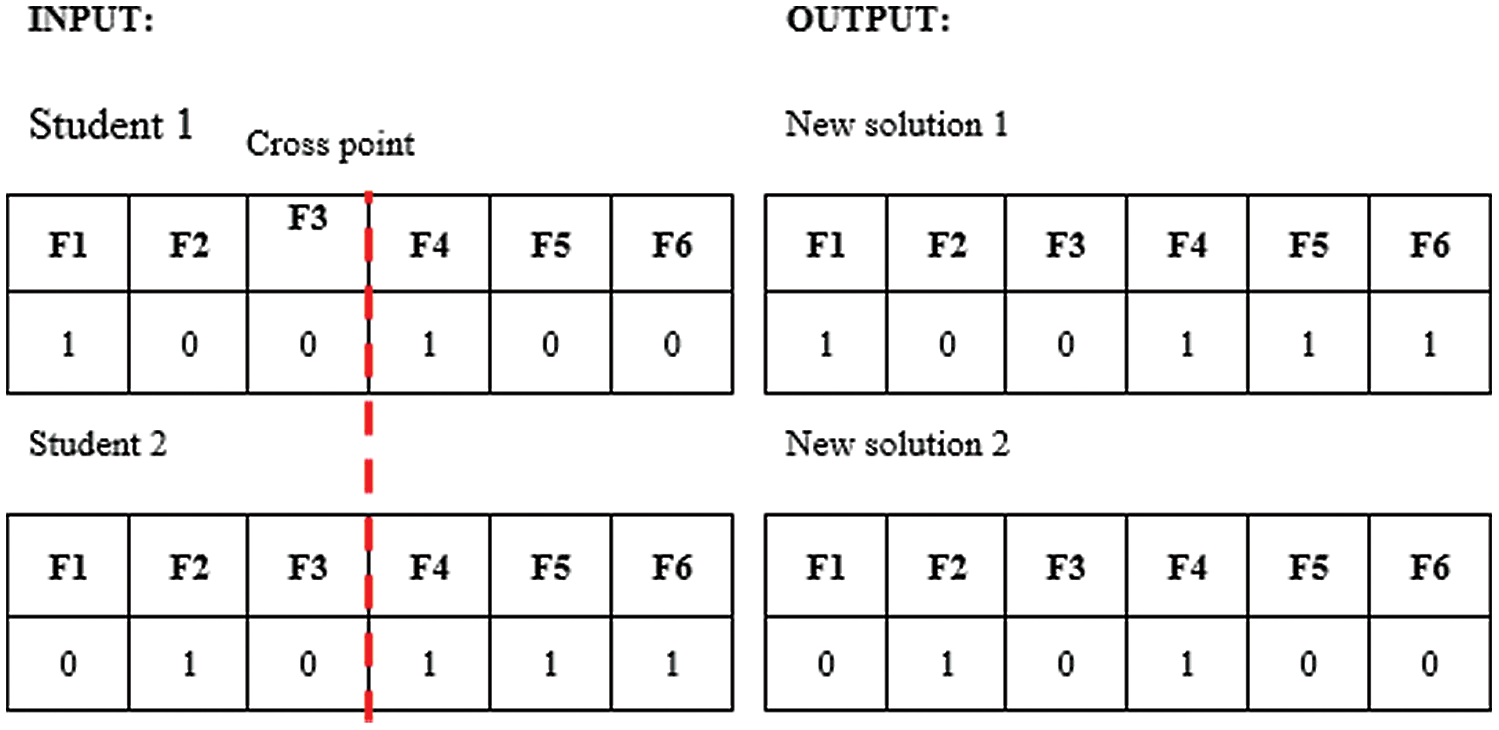
Figure 6: Learning session
Teaching and learning sessions will be repeated until the stop criteria are met. If the stop criteria are not met, then the entire repair process will be repeated. The output of this algorithm is a subset of quality small-sized features that will be used in the sentiment classification phase.
3.3 Phase 3: Classification of Sentiment
Phase 4 entails the classification of sentiments. In this phase, the sentiment classification method will be implemented through the SVM algorithm, using a set of features selected in the feature selection phase. SVM is also known as a support vector network. In the early stages, SVM was developed for binary classification, i.e., two-dimensional classification only. In line with the development of classification techniques, performance, and classification strategies, this SVM has become well-known in the field of sentiment classification. SVM is capable of creating boundary lines or hyperplanes that separate data by class. Support vector represents data closest to the hyperplane. The margin is the distance between the surface of the vector closest to the hyperplane.
A supervised SVM classifier requires a set of training data to calculate and produce an optimal hyperplane that separates and categorizes input data into two groups. When these SVMs are used for more classes than two-dimensional classes, these two-dimensional spaces are replaced with high-level multi-dimensional spaces, i.e., performing a combination of several two-dimensional SVM classifications. The implementation of this merger is done through the function of kernels. This function helps convert inseparable class problems into separable ones. It is especially significant for non-linear class separation. SVM is one of the most commonly used classifiers for text classification [30]. Accordingly, SVM was selected as the classification algorithm in this study.
This sentiment classification was carried out using the WEKA (Waikato Environment for Knowledge Analysis) version 3.8 software. In WEKA, the SVM algorithm is known as LibSVM. In this study, the parameters for SVM algorithm are as follow: parameter c is set to 1, the gamma function is set to 0, and the kernel parameter is set to linear and uses the ten-fold cross-validation method [35] which is being used by other baseline model to be compared with this study. Cross validation splitting can help in reducing the chances of overfitting of a model. It works by randomly shuffle and splitting the dataset into k number of groups. For each group, a part of the dataset will be used as a validation set while the other part will be used as a training set. The model will be learned from the training set and applied to the unseen validation set. The process is repeated for all groups and the accuracy produced will be combined and the mean accuracy will be chosen as the final accuracy.
3.4 Phase 4: Testing, Evaluation, and Analysis
Phase 5 consists of testing, evaluating, and analyzing, which was carried out based on the results of sentiment classification. The classification results were tested based on the confusion matrix obtained from those results. The confusion matrix presents information pertaining to the actual number of a class and the number of predictions generated by the classification algorithm.
Three performance testing criteria were used, namely accuracy, precision, and retrieval. For comparison and evaluation of the algorithms used in this study, the tests that were carried out by several studies have been selected. Finally, an analysis is performed on the experimental results to evaluate the performance of the combination of RST and TLBO algorithm known as RSTLBO for the selection of features in the sentiment-classification process.
This section describes the results of this study on the selection of text processing methods and the selection of features using the RSTLBO algorithm.
4.1 Selection of Text Processing Methods
From this study, it was found that Model A, which is a combination of linguistic processing and spelling correction, had the best accuracy, precision, and recall rates of 76.9%, 76.3, and 76.9%, respectively, as shown in Tab. 6.
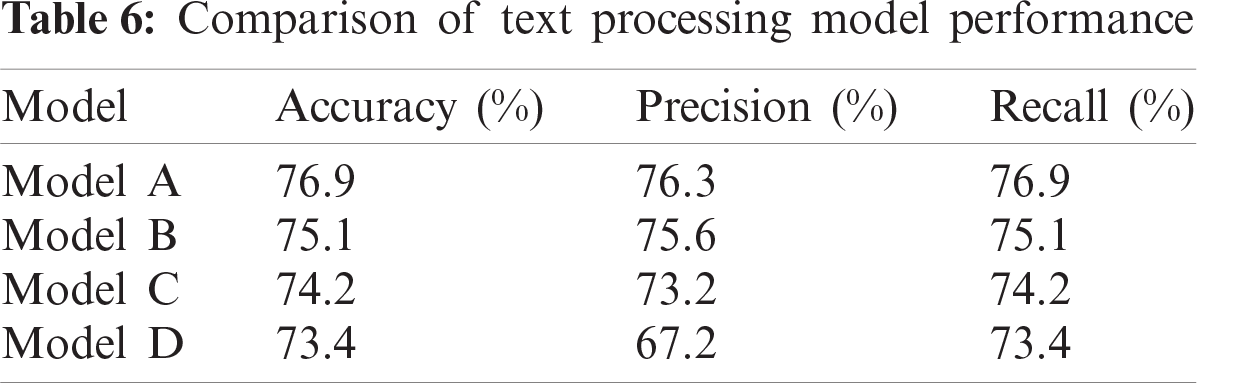
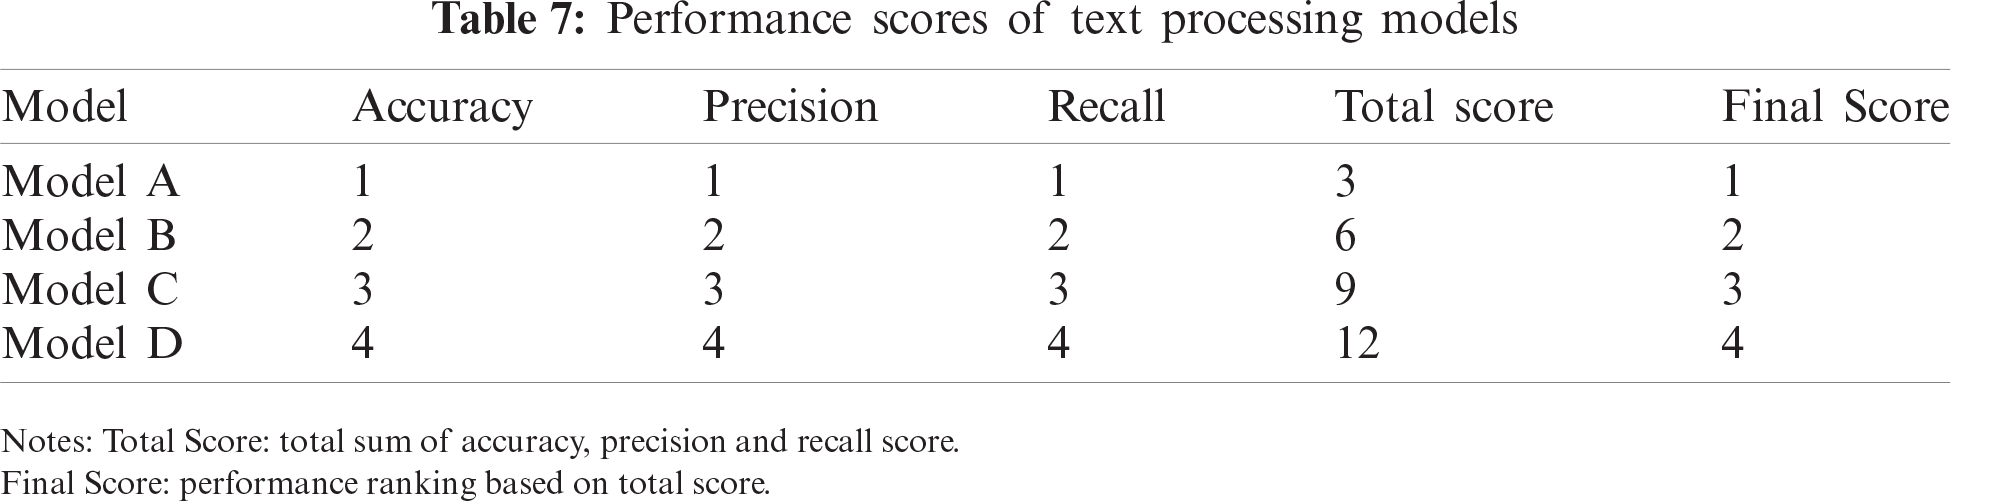
After the performance comparisons are made, the selection of the best model is determined based on the total position score for each model based on the evaluation metrics of accuracy, precision, and recall. Tab. 7 shows that Model A is in the best position with a score of 3 as compared to the other models. From the text processing of this model, a total of 8,424 features were identified.
4.2 Feature Selection Using RSTLBO
The confusion matrix of sentiment classification results using the RSTLBO algorithm is shown in Tab. 8. From this table, it is apparent that negative sentiments obtained the highest classification accuracy of 95%, followed by positive sentiments at 86%, with the last being neutral sentiments at 28%. This large gap in accuracy difference indicates that the dataset used in this study is unbalanced.
Tab. 9 shows the comparison of the results of this study with those of the others. From this table, it can be seen that RSTLBO, has the best accuracy of 80.2%, as compared to 63.1% for IG, 77.3% for TF and 72.0% for TF-IDF. Moreover, it is evident that this algorithm has a precision of 83.6% as compared to 77.0% for TF and 86.7% for TF-IDF. In terms of recall, it has the highest score of 80.2% as compared to 63.1% for IG, 70.0% for TF and 72.0% for TF-IDF, as shown in Fig. 7.
The number of features was successfully reduced by 98.9%, 95 features were selected from the original 8,424 features. These results show that the RSTLBO algorithm, as a feature selection algorithm, perform well and produce good results in sentiment classification. This high-quality function is driven by the fact that the RSTLBO algorithm does not require specific parameter adjustments to operate optimally.
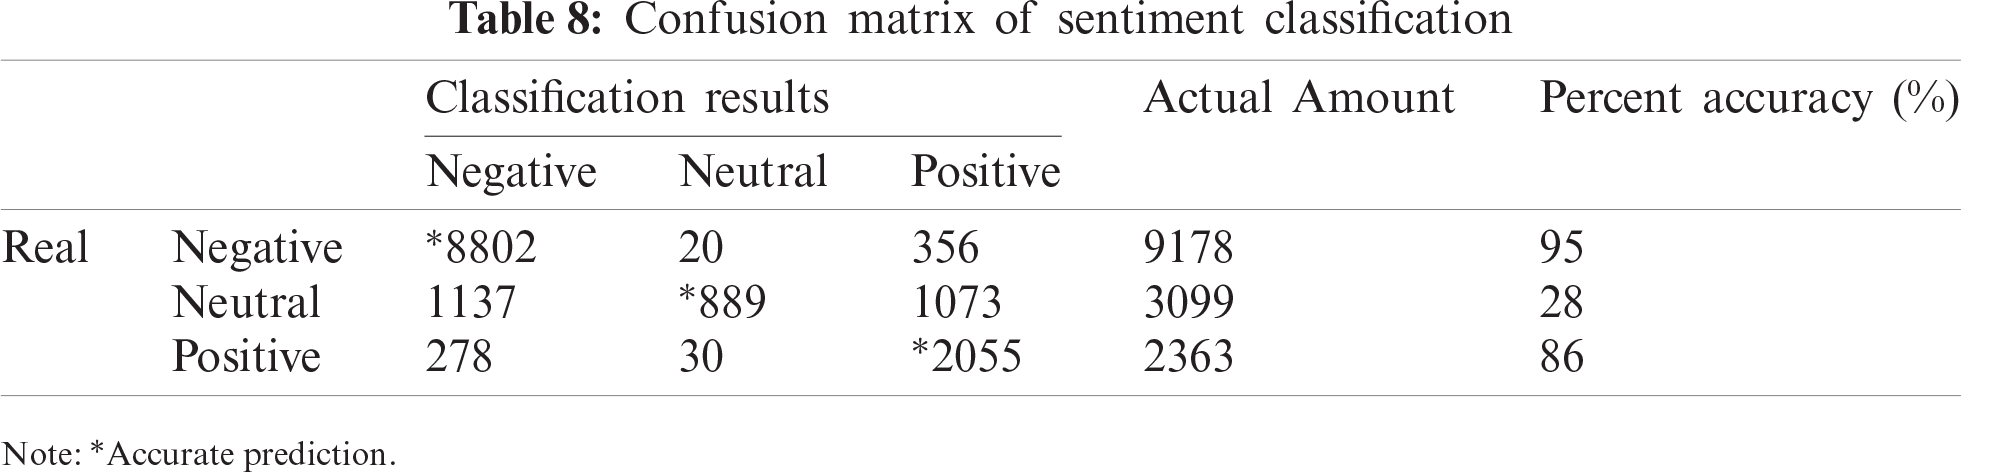
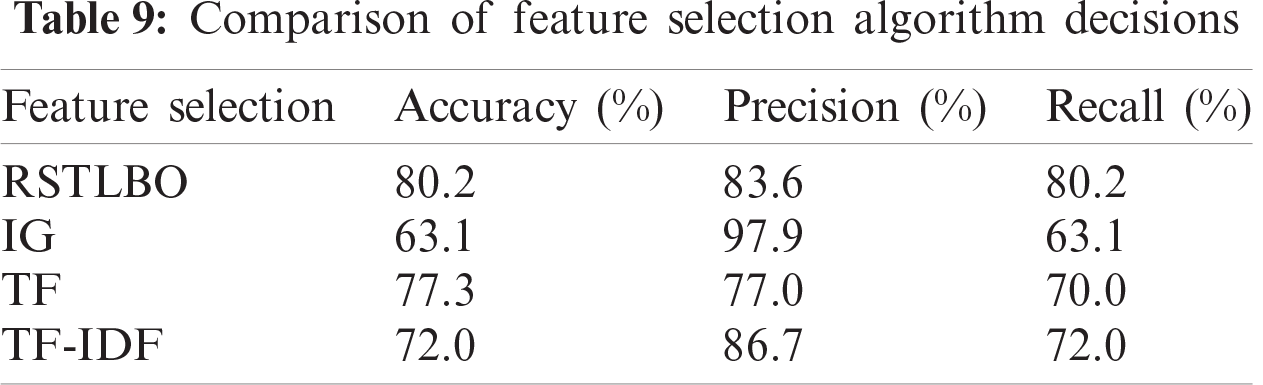
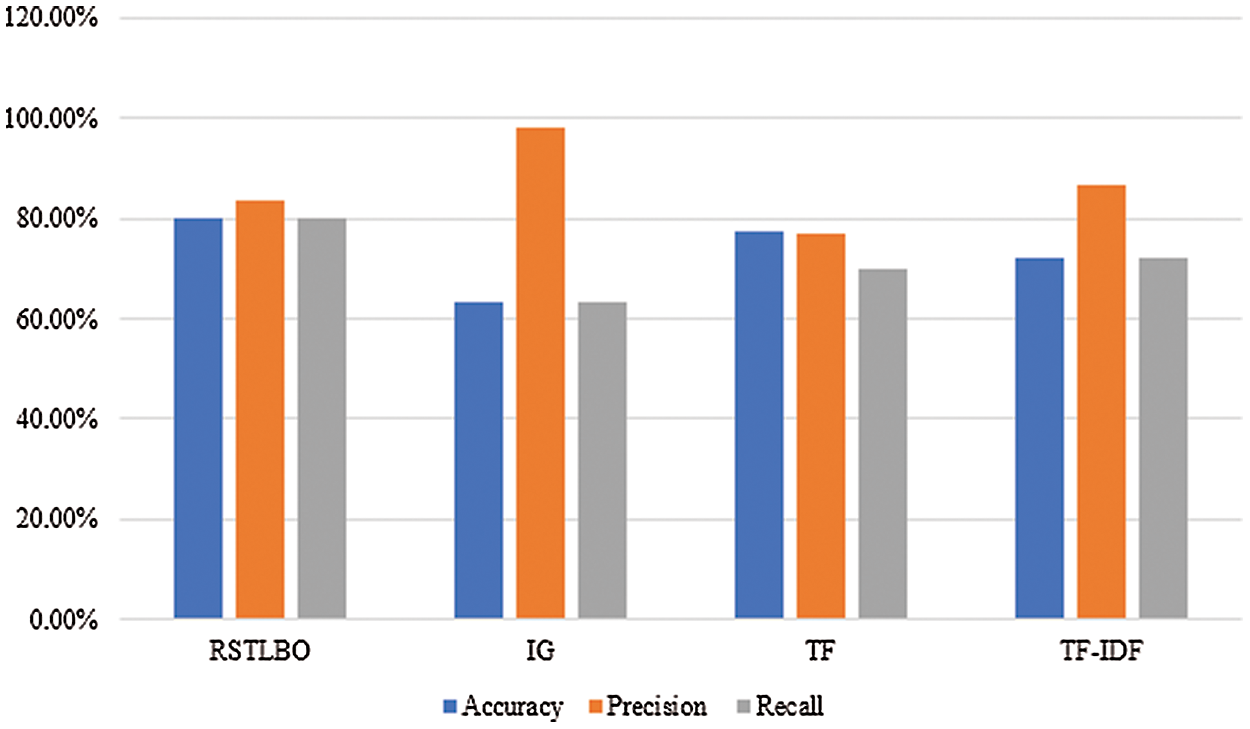
Figure 7: Comparison of feature selection algorithm
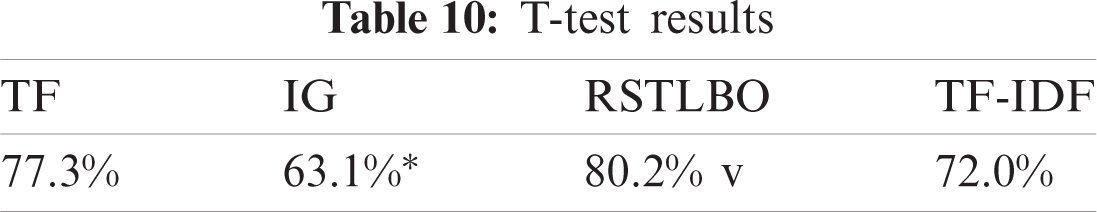
A statistical test was performed in this study to identify whether two machine learning models are statistically siginificantly different or whether one of them is better than the other. Specificially, the paired corrected t-test was perform to the data. RSTLBO, IG, TF and TF-IDF are evaluated against this dataset with a twin-tailed confidence of 0.05 (95%). In this experiment, RSTLBO served as the baseline using accuracy as the basis of comparison.
From Tab. 10, the TF is the base for comparison which has the accuracy of 77.3%. The result is compared to IG, TLBO and TF-IDF. The asterisk symbol (*) next to IG results indicates that the results are significantly different from the TF results. A small letter ‘v’ next to RSTLBO indicates that the results are significantly better than the TF result with 80.2% accuracy. This show that RSTLBO is the best performer and the result is statistically significant at the 0.05 level.
This study shows that the spelling correction through natural language processing in the text processing method, combined with natural linguistic processing technique, has a more significant effect on the accuracy of sentiment classification as compared to other natural language processing methods. Moreover, this study also shows that now the RSTLBO algorithm can perform feature selection for classification sentiment better or on par with the existing feature selection algorithms with a classification accuracy of 80.2%, precision of 83.6%, and retrieval rate of 80.2%. Furthermore, this algorithm managed to reduce the feature size by 98.9%, which is 95 features from the total of the original 8,424 features.
Furthermore, this study’s results highlight that the rate of classification accuracy using a combination of text processing methods and RSTLBO feature selection algorithm at 80.2% is higher than that of the sentiment classification with just text processing method resulting in 76.9% accuracy. This is because RSTLBO can reduce the dimensions of the feature set and select a feature set that has a good quality to be used in sentiment classification. Statistical relevance of the experimental results is determined by the paired t-test based on ten-fold cross-validation and the results demonstrate the RSTLBO is statistically significant and outperformed other method.
This study also demonstrates that the text processing methodology has a very significant effect on sentiment analysis, as text processing immensely helps in eliminating noisy and irrelevant information from the data and, as a result, can generate relatively good classification results. If this noisy and irrelevant information is not eliminated, the feature selection process will be difficult, requiring high processing resources and indirectly negatively affecting the accuracy of sentiment classification. Thus, the feature selection algorithm RSTLBO helps to improve the accuracy of sentiment classification, based on the results of text processing, to a higher level.
Funding Statement: This publication was supported by the Universiti Kebangsaan Malaysia (UKM) under the Research University Grant (Project Code: DIP-2016-024).
Conflicts of Interest: The authors declare that they have no conflicts of interest to report regarding the present study.
1. A. Dridi and D. R. Recupero, “Leveraging semantics for sentiment polarity detection in social media,” International Journal of Machine Learning and Cybernetics, vol. 10, no. 8, pp. 2045–2055, 2019. [Google Scholar]
2. M. Z. Asghare, I. Ullah, S. Shamshirband, F. M. Kundi and A. Habib, “Fuzzy-based sentiment analysis system for analyzing student feedback and satisfaction,” Preprints, vol. 62, no. 2, pp. 631–655, 2019. [Google Scholar]
3. X. Yan, W. Song, X. Zhao and A. Wang, “Tibetan sentiment classification method based on semi-supervised recursive autoencoders,” Computers, Materials & Continua, vol. 60, no. 2, pp. 707–719, 2019. [Google Scholar]
4. J. Sharma, G. Singh and A. Sharma, “Review paper on text mining and sentimental analysis,” International Journal of Engineering and Computer Science, vol. 6, no. 11, pp. 22854–22857, 2017. [Google Scholar]
5. Y. Zhang, Q. Wang, Y. Li and X. Wu, “Sentiment classification based on piecewise pooling convolutional neural network,” Computers, Materials & Continua, vol. 56, no. 2, pp. 285–297, 2018. [Google Scholar]
6. I. El Asri, N. Kerzazi, G. Uddin, F. Khomh and M. J. Idrissi, “An empirical study of sentiments in code reviews,” Information and Software Technology, vol. 114, no. 2019, pp. 37–54, 2019. [Google Scholar]
7. N. A. Osman, S. A. M. Noah and M. Darwich, “Contextual sentiment based recommender system to provide recommendation in the electronic products domain,” International Journal of Machine Learning and Computing, vol. 9, no. 4, pp. 425–431, 2019. [Google Scholar]
8. A. Banjar, Z. Ahmed, A. Daud, R. A. Abbasi and H. Dawood, “Aspect-based sentiment analysis for polarity estimation of customer reviews on twitter,” Computers, Materials & Continua, vol. 67, no. 2, pp. 2203–2225, 2021. [Google Scholar]
9. F. Rustam, I. Ashraf, A. Mehmood, S. Ullah and G. S. Choi, “Tweets classification on the base of sentiments for US airline companies,” Entropy, vol. 21, no. 11, pp. 1078, 2019. [Google Scholar]
10. S. Pradha, M. N. Halgamuge and N. T. Q. Vinh, “Effective text data preprocessing technique for sentiment analysis in social media data,” in Proc. of the 2019 11th Int. Conf. on Knowledge and Systems Engineering, Da Nang, Vietnam, pp. 1–8, 2019. [Google Scholar]
11. C. Hung and S. J. Chen, “Word sense disambiguation based sentiment lexicons for sentiment classification,” Knowledge-Based Systems, vol. 110, no. 2016, pp. 224–232, 2016. [Google Scholar]
12. S. Shabudin, N. S. Sani, K. A. Z. Ariffin and M. Aliff, “Feature selection for phishing website classification,” International Journal of Advanced Computer Science and Applications, vol. 11, no. 4, pp. 587–595, 2020. [Google Scholar]
13. A. A. Bakar, R. Hamdan and N. S. Sani, “Ensemble learning for multidimensional poverty classification,” Sains Malaysiana, vol. 49, no. 2, pp. 447–459, 2020. [Google Scholar]
14. Z. A. Othman, A. A. Bakar, N. S. Sani and J. Sallim, “Household overspending model amongst B40, M40 and T20 using classification algorithm,” International Journal of Advanced Computer Science and Applications, vol. 11, no. 7, pp. 392–399, 2020. [Google Scholar]
15. F. Xu, X. Zhang, Z. Xin and A. Yang, “Investigation on the Chinese text sentiment analysis based on convolutional neural networks in deep learning,” Computers, Materials & Continua, vol. 58, no. 3, pp. 697–709, 2019. [Google Scholar]
16. I. S. Ahmad, A. A. Bakar and M. R. Yaakub, “A review of feature selection in sentiment analysis using information gain and domain specific ontology,” International Journal of Advanced Computer Research, vol. 9, no. 44, pp. 283–292, 2019. [Google Scholar]
17. M. Mafarja and D. Eleyan, “Ant colony optimization based feature selection in rough set theory,” International Journal of Computer Science and Electronics Engineering, vol. 1, no. 2, pp. 244–247, 2013. [Google Scholar]
18. A. Unler and A. Murat, “A discrete particle swarm optimization method for feature selection in binary classification problems,” European Journal of Operational Research, vol. 206, no. 3, pp. 528–539, 2010. [Google Scholar]
19. S. C. Yusta, “Different metaheuristic strategies to solve the feature selection problem,” Pattern Recognition Letters, vol. 30, no. 5, pp. 525–534, 2009. [Google Scholar]
20. R. V. Rao, V. J. Savsani and D. P. Vakharia, “Teaching–learning-based optimization: A novel method for constrained mechanical design optimization problems,” Computer-Aided Design, vol. 43, no. 3, pp. 303–315, 2011. [Google Scholar]
21. V. Manimekalai and S. Gomathi, “Cross domain opinion mining using maximum entropy based classifier,” Journal of Physics: Conference Series, vol. 1362, no. 1, pp. 12065, 2019. [Google Scholar]
22. H. C. K. Lin, T. H. Wang, G. C. Lin, S. C. Cheng, H. R. Chen et al., “Applying sentiment analysis to automatically classify consumer comments concerning marketing 4Cs aspects,” Applied Soft Computing, vol. 97, no. Part A, pp. 106755, 2020. [Google Scholar]
23. B. Pang and L. Lee, “Opinion mining and sentiment analysis,” Foundations and Trends in Information Retrieval, vol. 2, no. 1–2, pp. 1–135, 2008. [Google Scholar]
24. E. Dritsas, G. Vonitsanos, I. E. Livieris, A. Kanavos, A. Ilias et al., “Pre-processing framework for twitter sentiment classification,” in Proc. of the IFIP Int. Conf. on Artificial Intelligence Applications and Innovations, Hersonissos, Crete, Greece, pp. 138–149, 2019. [Google Scholar]
25. M. Khader, A. Awajan and G. Al-Naymat, “The effects of natural language processing on big data analysis: Sentiment analysis case study,” in Int. Arab Conf. on Information Technology, Werdanye, Lebanon, pp. 1–7, 2018. [Google Scholar]
26. Z. Pawlak, “Rough sets,” International Journal of Computer & Information Sciences, vol. 11, no. 5, pp. 341–356, 1982. [Google Scholar]
27. Y. Cheng, F. Zhao, Q. Zhang and G. Wang, “A survey on granular computing and its uncertainty measure from the perspective of rough set theory,” Granular Computing, vol. 6, pp. 3–17, 2019. [Google Scholar]
28. H. J. Zimmermann, “Fuzzy set theory,” Wiley Interdisciplinary Reviews: Computational Statistics, vol. 2, no. 3, pp. 317–332, 2010. [Google Scholar]
29. Q. Zhang, Q. Xie and G. Wang, “A survey on rough set theory and its applications,” CAAI Transactions on Intelligence Technology, vol. 1, no. 4, pp. 323–333, 2016. [Google Scholar]
30. A. S. Manek, P. D. Shenoy, M. C. Mohan and K. R. Venugopal, “Aspect term extraction for sentiment analysis in large movie reviews using gini index feature selection method and SVM classifier,” World Wide Web, vol. 20, no. 2, pp. 135–154, 2017. [Google Scholar]
31. N. Liu and B. Shen, “Aspect-based sentiment analysis with gated alternate neural network,” Knowledge-Based Systems, vol. 188, pp. 105010, 2020. [Google Scholar]
32. N. M. K. Saeed, N. A. Helal, N. L. Badr and T. F. Gharib, “An enhanced feature-based sentiment analysis approach,” Wiley Interdisciplinary Reviews: Data Mining and Knowledge Discovery, vol. 10, no. 2, pp. e1347, 2020. [Google Scholar]
33. B. Liu, “Sentiment analysis and subjectivity,” in Handbook of Natural Language Processing, 2nd ed., vol. 2. N. Indurkhya and F. J. Damerau (Eds.Boca Raton, USA: CRC Press, pp. 627–666, 2010. [Google Scholar]
34. B. Amiri, “Application of teaching-learning-based optimization algorithm on cluster analysis,” Journal of Basic and Applied Scientific Research, vol. 2, no. 11, pp. 11795–11802, 2012. [Google Scholar]
35. M. Khalid, I. Ashraf, A. Mehmood, S. Ullah, M. Ahmad et al., “GBSVM: Sentiment classification from unstructured reviews using ensemble classifier,” Applied Sciences, vol. 10, no. 8, pp. 2788, 2020. [Google Scholar]
 | This work is licensed under a Creative Commons Attribution 4.0 International License, which permits unrestricted use, distribution, and reproduction in any medium, provided the original work is properly cited. |