DOI:10.32604/cmc.2021.018395
| Computers, Materials & Continua DOI:10.32604/cmc.2021.018395 | |
| Article |
Energy Optimization in Multi-UAV-Assisted Edge Data Collection System
1Nanjing University of Posts and Telecommunications, Nanjing, 210003, China
2Nanjing Pharmaceutical Co., Ltd., Nanjing, 210012, China
3Jiangsu Key Laboratory of Data Science and Smart Software, Jinling Institute of Technology, Nanjing, 211169, China
4Central Washington University, Ellensburg, 98926, United States
*Corresponding Author: Yanfei Sun. Email: sunyanfei@njupt.edu.cn
Received: 07 March 2021; Accepted: 17 April 2021
Abstract: In the IoT (Internet of Things) system, the introduction of UAV (Unmanned Aerial Vehicle) as a new data collection platform can solve the problem that IoT devices are unable to transmit data over long distances due to the limitation of their battery energy. However, the unreasonable distribution of UAVs will still lead to the problem of the high total energy consumption of the system. In this work, to deal with the problem, a deployment model of a mobile edge computing (MEC) system based on multi-UAV is proposed. The goal of the model is to minimize the energy consumption of the system in the process of data transmission by optimizing the deployment of UAVs. The DEVIPSK (differential evolution algorithm with variable population size based on a mutation strategy pool initialized by K-Means) is proposed to solve the model. In DEVIPSK, the population is initialized by K-Means to obtain better initial positions of UAVs. Besides, considering the limitation of the fixed mutation strategy in the traditional evolutionary algorithm, a mutation strategy pool is used to update the positions of UAVs. The experimental results show the superiority of the DEVIPSK and provide guidance for the deployment of UAVs in the field of edge data collection in the IoT system.
Keywords: UAV; mobile edge computing; differential evolution algorithm; K-Means; edge data collection
The Mobile Edge Computing (MEC) Model [1] was proposed to solve such problems as delay, high pressure on network bandwidth, high energy consumption, and insufficient caching capacity [2] caused by centralized data processing in cloud computing mode. In recent years, some studies on UAV (Unmanned Aerial Vehicle) in mobile edge computing environment have been carried out in academia. Kim et al. [3] proposed an optimal task-UAV-edge server matching algorithm that minimizes energy consumption and processing time. Du et al. [4] regarded a UAV as an edge cloud. They proposed an effective iterative algorithm to minimize the energy consumption of the UAV on the premise of meeting the quality of service (QoS) requirements of the IoT devices and the computing resources available to the UAV. A UAV communication system based on mobile edge computing was studied [5]. Under the condition of resource constraints, the path and task allocation of the UAV, and the computing speed of the CPU are jointly optimized to minimize the energy consumption of the whole system. Yang et al. [6] designed a multi-UAV deployment scheme for MEC enhanced IoT architecture, which provides computing offloading services for ground IoT devices with limited local processing capacity. Then they proposed a multi-UAV deployment mechanism based on a differential evolution algorithm to balance the load of UAVs. Mozaffari et al. [7] considered a UAV-enabled MEC system and established a game model to achieve lower energy consumption. Alzenad et al. [8] researched the optimal deployment of UAVs to cover the maximum number of ground users with minimum transmission power, and then studied deployment operation optimization under different QoS requirements [9]. Liu et al. [10] proposed a cooperative MEC network architecture that supports UAVs, in which UAV can help other UAVs to perform computing tasks. On this basis, a collaborative computing offloading scheme considering the interference suppression of UAVs to equipment was proposed. It should be noted that the positions and number of UAVs are not optimized or only the positions of UAVs are optimized in these papers. A variable population differential evolution algorithm was proposed [11], in which the positions and the number of UAVs are considered. In the whole optimization process, since the number of UAVs is a dynamic variable, a new coding mechanism [11] was introduced in the paper. So that each individual of the population is on behalf of a UAV, and the whole population represents the whole UAV group. That is, the size of the population represents the number of UAVs. Our paper makes some improvements to its model and algorithm on the basis of [11].
In the scenario of IoT, terminal IoT devices are usually unable to transmit over long distances because of their own energy limitations. Therefore, as a new data collection platform, the UAV was introduced into the IoT scene. To use UAVs in a highly efficient way, we need to optimize the deployment of UAVs to provide reliable and energy-saving data acquisition solutions for IoT devices. In this paper, a differential evolution algorithm with variable population size based on a mutation strategy pool initialized by K-Means [12] is proposed (DEVIPSK). Meanwhile, the number and the positions of UAVs are optimized.
The main contributions of this paper are as follows:
(1) A differential evolution algorithm with variable population size based on a mutation strategy pool initialized by K-Means is proposed to optimize the deployment of UAVs. It adopts the K-Means clustering algorithm to initialize the population. In addition, a control mechanism is also designed to dynamically change the parameter scaling factor F and crossover probability CR, to balance local search and global search. It also adopts a mutation strategy pool to help find the optimal mutation strategy.
(2) The results show that, compared with other algorithms on 8 different instances, DEVIPSK performs better. The experimental results indicate that DEVIPSK reduces effectively the energy consumption of the entire system while solving problems for its green characteristics.
The rest of this paper is arranged as follows. The second chapter details the system model. The third chapter introduces the algorithm and its innovation. The fourth chapter carries on the simulation contrast experiment and data analysis. The last chapter summarizes the full paper.
An IoT system, as shown in Fig. 1, contains a set of IoT devices deployed in a certain area, represented as N = \{1, 2, …, n\}, and some fixed-location base stations. Because there may be a long transmission distance or the base station used as an auxiliary calculation is too far away in the process of data transmission, a group of rotary-wing UAVs is used to collect data from these ground-based IoT devices to MEC servers. Here, we hypothesis that the set of the number of UAVs can be expressed as K = \{1, 2, …, k\}.

Figure 1: Scene diagram of multi-UAV-assisted Internet of Things
The distance between the IoT device i and the UAV j is expressed as Eq. (1):
where
Moreover, the constraint of ai,j is Eq. (3):
Each IoT device can only send data to one UAV. Moreover, taking into account the system bandwidth limitations, each UAV can receive data from up to M IoT devices at the same time. It can be expressed as Eq. (4):
To ensure that all the IoT devices can be served, Eq. (5) should be satisfied:
Each IoT device has a probability of establishing a line-of-sight relationship for a specific UAV. This probability depends on the environment of the IoT and the UAV, and the degree of elevation between the two. The probability of line-of-sight relationship [13] is Eq. (6):
Among them, ψ and β are the constants depending on environment types and carrier frequency. θ is elevation angle,
From Eq. (6), it can be seen that the probability of establishing a line-of-sight relationship will be increased by increasing the degree of elevation or the height of the UAV. Reference [14] indicates that only when PLoS is greater than a threshold, the two can be connected, so PLoS(θ) ≥ ɛ (ɛ is close to 1). Eq. (7) is derived from
From Eq. (7), it can be concluded that the maximum distance between a UAV and an IoT device is
In this model, the channel gain between the IoT device i and the UAV j [15] is expressed as Eq. (8):
According to Eq. (8), the shorter the distance between the IoT device i and the UAV j, the greater its channel gain. This coincides with Eq. (2) in which each IoT device always chooses the nearest UAV to send data.
The rate at which the IoT device sends data to the UAV is Eq. (9):
Among them, pi is the transmission energy; h0 indicates the channel power gain at reference distance d0 = 1m; σ2 is the noise power of white Gaussian noise and B is the system bandwidth. While the IoT device sends data volume Di to the UAV, the time of transmitting is given by Eq. (10):
Energy consumption is calculated using Eq. (11):
Thus, energy consumption for all IoT devices is Eq. (12):
The hover time of the UAV j is Eq. (13):
Further, the hover energy consumption of the UAV j is Eq. (14):
where ph represents the hover power of the UAV.
The distance between two UAVs should meet certain conditions so that there will be no collision [16]. The distance between the UAV j1 and the UAV j2 should be greater than dmin, as shown in Eq. (15):
In the model in this paper, the UAV serves as the data transfer station, and the data of the IoT device is finally sent to the edge server for processing. The volume of data received by the UAV j is shown in Eq. (16):
The time Tj of the UAV j sending data to the edge server is expressed as Eq. (17):
According to Eq. (9), rj represents the rate at which the UAV j transmits data to the edge server.
The transmission energy of the UAV j is Eq. (18):
where pu represents the UAV's transmission power.
The total energy consumption of the UAVs is Eq. (19):
The energy consumption of the whole system consists of the energy consumption of the UAVs and the energy consumption of the IoT devices. Thus, the problem can be expressed as Eq. (20):
where ϕ ≥ 0 is the weight of energy consumption of the IoT devices; di,j represents the distance between the IoT device i and the UAV j; dj1, j2 represents the distance between the two UAVs, and dmin is the shortest distance. Xmax and Xmin are the maximum and minimum values of Xj; Ymax and Ymin are the maximum and minimum values of Yj; kmax and kmin are the maximum and minimum values of k; kmin and kmax are
DEVIPSK is proposed to optimize the deployment of UAVs, in which K-Means is used for population initialization, and a mutation strategy pool is proposed to help find the optimal mutation strategy. A control mechanism is also designed to dynamically change the parameter scaling factor F and crossover probability CR, to balance local search and global search.
The overall frame of the deployment optimization algorithm for UAVs is shown in Tab. 1.
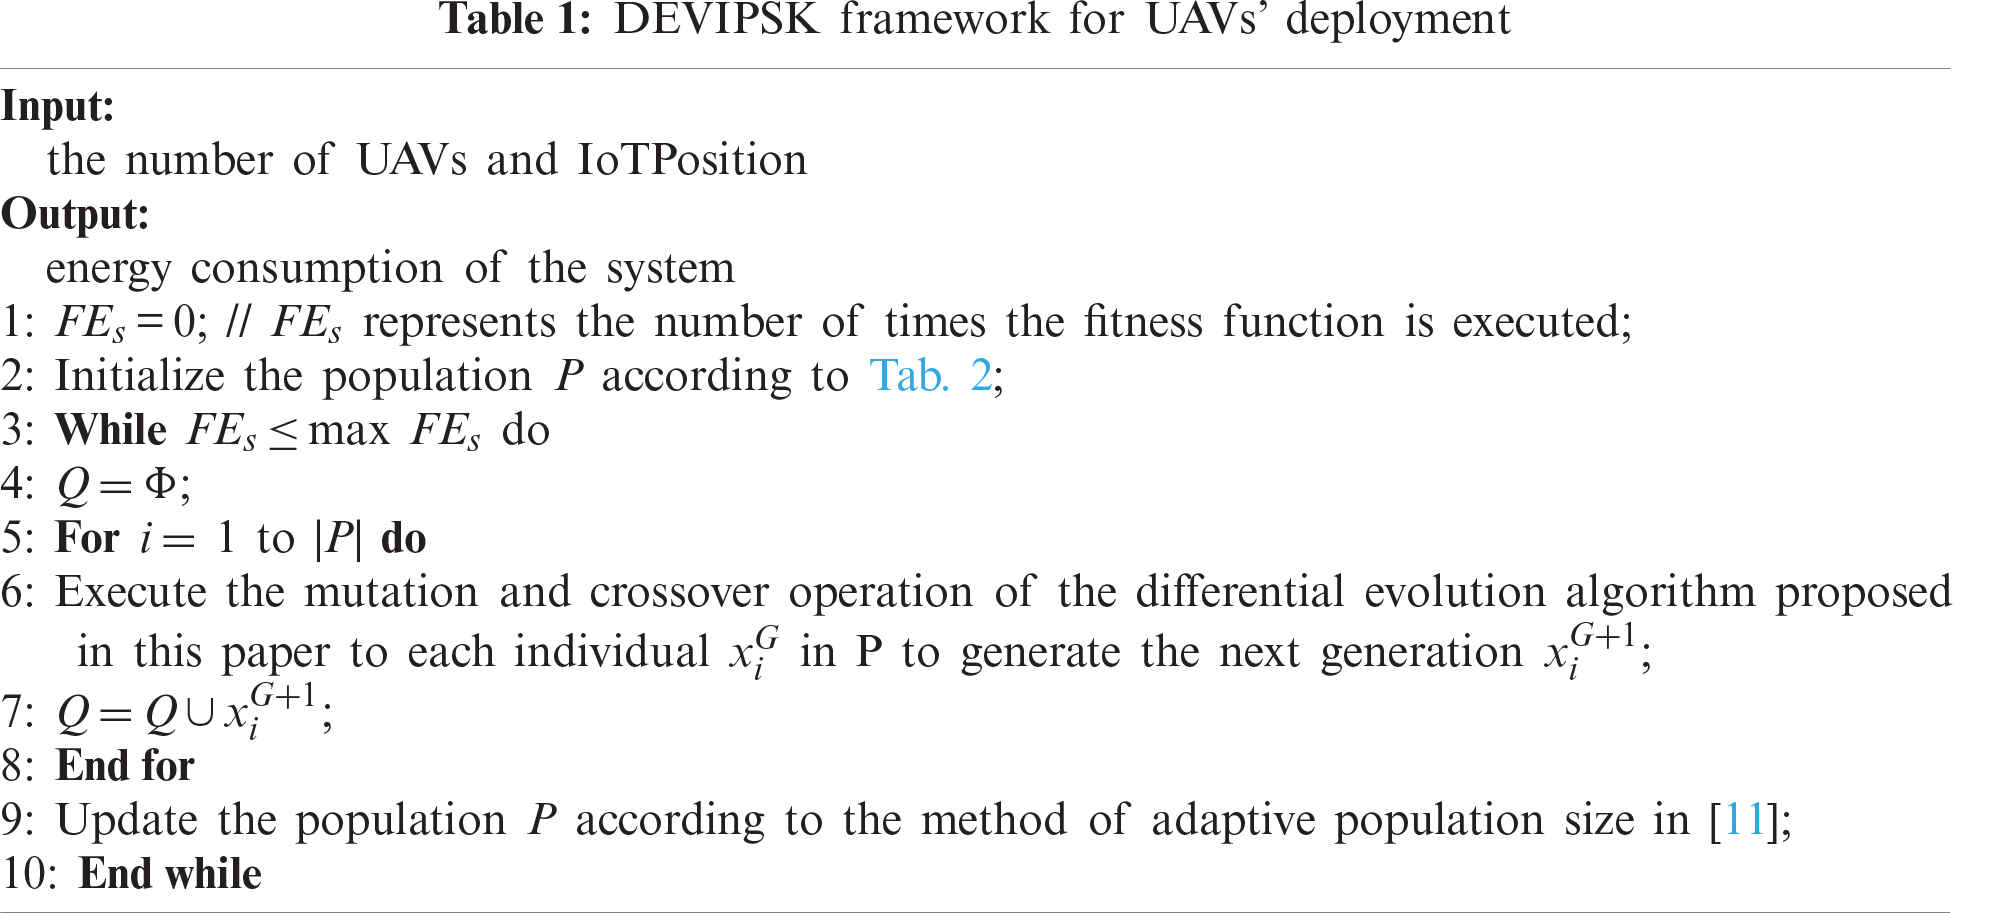
The population P is initialized according to Tab. 2. In the whole process of evolution, the UAV deployment optimization algorithm is based on the mutation strategy pool. The mutation and crossover operations of dynamic parameters generate the progeny population Q. Then the adaptive population size strategy in [11] is used to update the population P. In this adaptive mechanism, a population update includes inserting, replacing, and deleting at most one individual, so as to ensure that the change of population size will not be too large. By comparing the fitness value of the population after inserting, replacing or deleting an individual, the population with the highest fitness value replaces the current population P. If the fitness value of the three has not improved, and the fitness value of the population after deleting the individual is equal to the fitness value of the current population P, then the current population will be replaced with the population after deleting the individual. For the mutation and crossover operation of the differential evolution algorithm, the method based on the mutation strategy pool and binomial crossover is adopted.
Generally speaking, a UAV can serve multiple IoT devices. When the number of UAVs is initialized, it does not have to be directly set to the maximum value. The initial value k of UAVs is set to a value between
We solve this problem by setting the number of UAVs to a cluster value. The K-Means is used to initialize the positions of the UAVs. The center of each cluster is the initial position of the UAV. As can be seen from Eq. (8), the shorter the distance between the IoT device and the UAV, the greater the channel gain.
The effect diagram executed with the K-Means algorithm is shown in Fig. 2, where the dots of different colors represent the positions of the IoT devices. The asterisk indicates the centroid of each cluster, which is the initial position of the UAVs.

Figure 2: The distribution map of UAVs in the IoT devices through K-Means
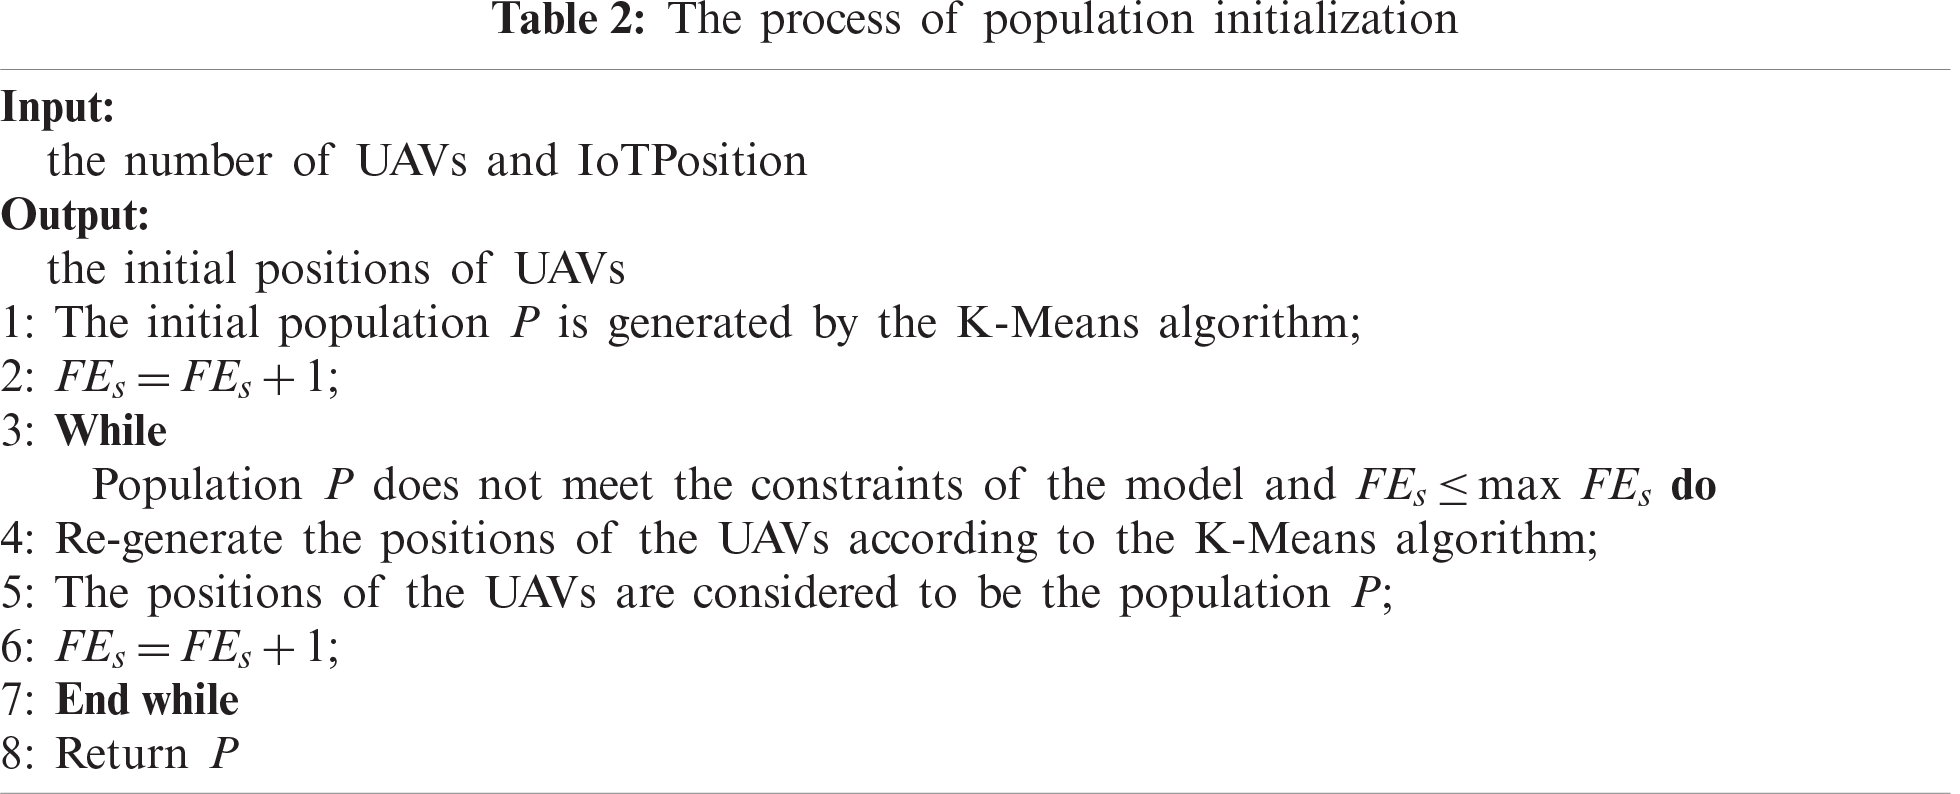
The process of population initialization is shown in Tab. 2.
In the process of initialization, the original data can be divided into k non-intersecting clusters by using the clustering algorithm. That is, the position of the UAV is the center of each cluster, making the UAV the closest to each IoT device in the cluster. Then check whether the population P satisfies all the constraints of the model. If so, a feasible initial population P is successfully generated. If not, repeat the operation.
3.2 Update Population Based on Variation Pool Strategy and Dynamically Changing Parameters
In this paper, a method of mutation strategy candidate pool is proposed, which includes several effective mutation strategies with different characteristics. In the process of evolution, for each individual in the current population, a probability will be selected according to previous experience to select a strategy from the candidate pool to perform the mutation operation. We have studied several effective mutation strategies commonly used in DE literature, and selected the following three strategies as a candidate pool for mutation strategies.
(1) The “DE/rand/1” strategy converges slowly, but has a strong search ability. So it is suitable to solve multimodal problems, rather than relying on the optimal solution currently found.
(2) The “DE/rand/2” strategy based on two difference vectors may produce better disturbance than the strategy based on one difference vector. Under the background of particle swarm optimization, Storn [17] proved that all statistical distributions based on two difference vectors are better perturbation modes.
(3) “DE/current-to-rand/1” is a rotation invariant strategy, and it is mainly applied to solving multi-objective optimization problems.
It is found that a control mechanism can be used to dynamically change the parameter scaling factor F and crossover probability CR, to make the evolution algorithm perform better. The whole process is described in detail below.
According to the study by Brest et al. [18], the calculation method of scaling factor F is defined as Eq. (21), and the calculation method of crossover probability CR is defined as Eq. (22):
where randj, j ∈ \{1, 2, 3, 4\} is the random number between [0, 1]. τ1 and τ2 are the probability to dynamically adjust F and CR. Fl and Fu are the range of F,
The algorithm flowchart of the whole system is shown in Fig. 3.

Figure 3: The framework of DEVIPSK
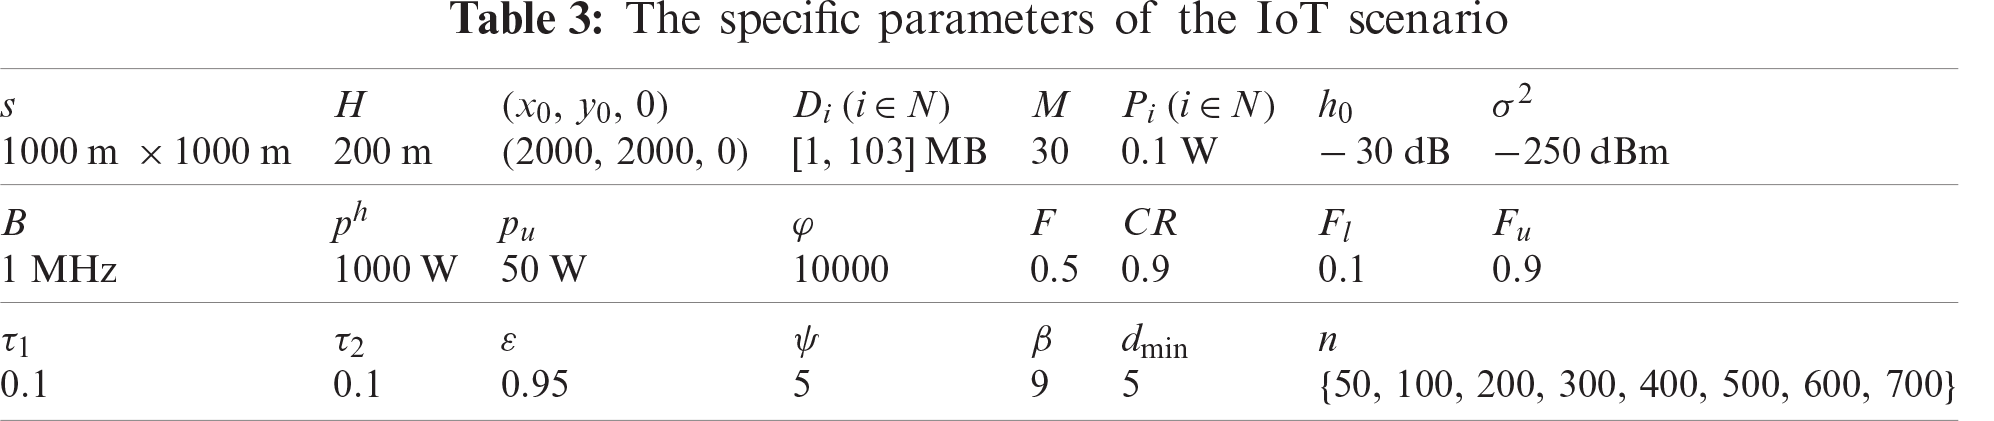
In the experiments, all the IoT devices are randomly deployed in a square area, and the size s is
To test the statistical significance of the proposed algorithm and other algorithms, the Wilcoxon test is performed when the significant level is 0.05. In this paper, “+” and “−” are used to indicate how good or bad the DEVIPK algorithm is compared with other algorithms respectively.
4.1 The First Group of Experiments
For the sake of verifying the significance of the initial population by K-Means in DEVIPSK, DEVIPSK and DEVIPSK-K are compared under the same conditions in the first group of experiments. DEVIPSK-K does not use K-Means when initializing the population P. That is to say, DEVIPSK adds K-Means to initialize the population P on the basis of DEVIPSK-K.
As shown in Fig. 4, we can clearly see that in each different example, DEVIPSK generally keeps better results in the whole evolution process compared with DEVIPSK-K. Since the position of the UAV is the center of each cluster, it can make the UAV have the closest distance to each IoT device in this cluster compared with randomly generating the position of the UAV. According to Eq. (8), the smaller the distance between the two devices, the greater the channel gain. When the channel gain increases, the performance will also improve.

Figure 4: Comparison of EC(J) obtained by DEVIPSK and DEVIPSK-K when n is 50, 100, 200, 300, 400, 500, 600, 700, respectively
4.2 The Second Group of Experiments
In the second group of experiments, DEVIPSK was tested as a new variant of the differential evolution algorithm. We compared DEVIPSK with DEVIPSK-DE and DEVIPSK-jDE.
(1) DEVIPSK-DE [19] is the traditional differential evolution algorithm adopting the mutation and crossover operation of “DE/rand/1”.
(2) DEVIPSK-jDE [18] is a differential evolution algorithm with dynamically changing parameters, which can dynamically change mutation factor F and crossover factor CR, to make the algorithm perform better.
(3) DEVIPSK adds a mutation strategy pool on the basis of DEVIPSK-jDE.
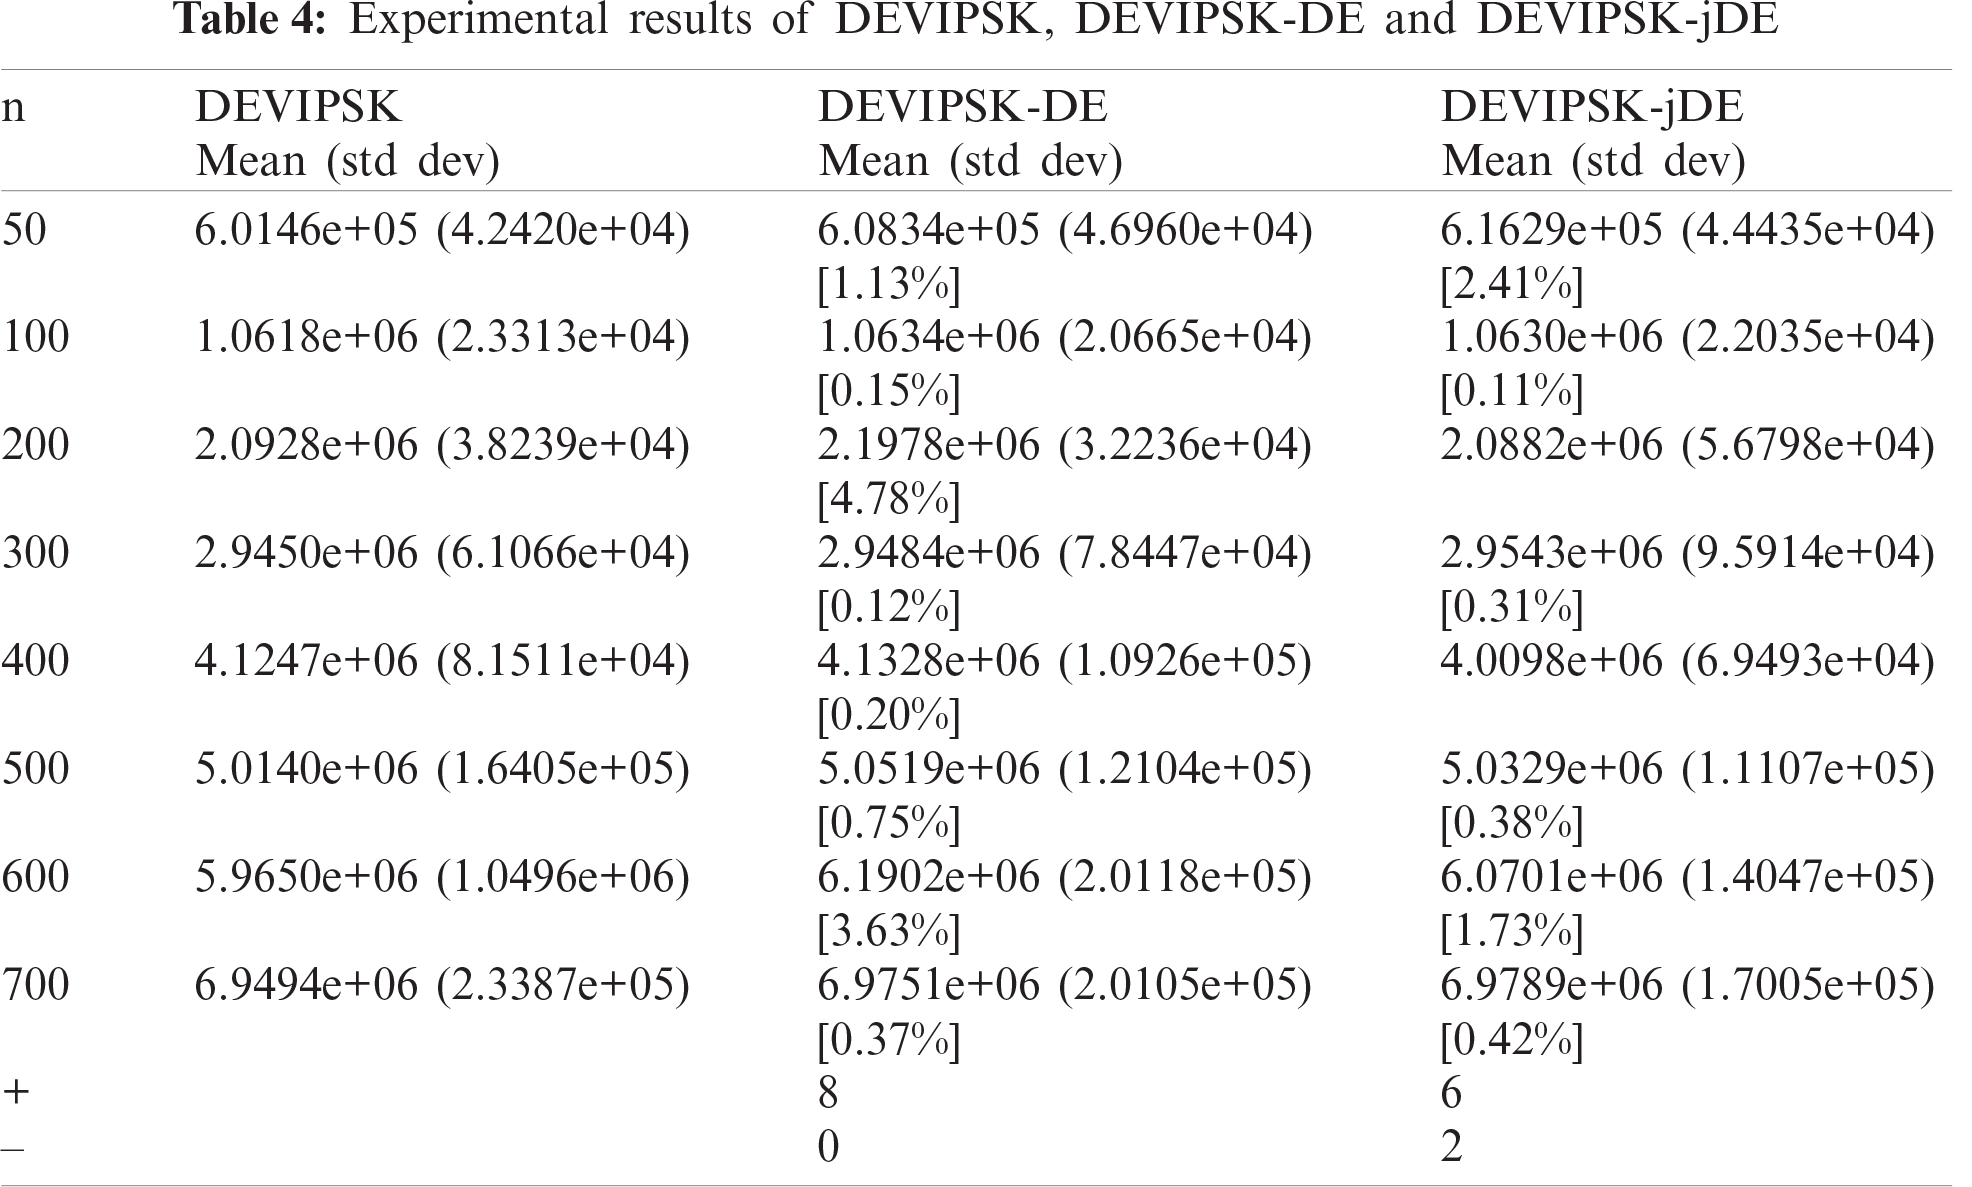
Tab. 4 shows the statistical test results. It represents the average and standard deviation of the energy of the whole system for 20 runs, and the percentage of performance improvement is shown in square brackets. Specifically, when n = 200, the most improvement was made with an increase of 4.78%. Compared with the differential evolution algorithm with dynamically changing parameters, in 6 out of 8 different examples, DEVIPSK obtained better performance. When n = 50, the most improvement was made, with an increase of 2.41%. But the differential evolution algorithm with dynamically changing parameters had better performance in the cases of n = 200 and n = 400.
4.3 The Third Group of Experiments
DEVIPS [11], DEEM [20] and DEVPISM are compared with DEVIPSK in the third group experiments. The purpose is to reflect the superiority of DEVIPSK in energy consumption for the UAV model. The following is an introduction to three comparing algorithms.
(1) The coding mechanism adopted by DEVIPS is similar to that in this paper, but the number of kmax of UAVs is randomly generated when the population P is initialized. The mutation strategy pool and dynamic parameter mechanism are not used in DEVIPS.
(2) The coding mechanism adopted by DEEM is similar to that of this paper, but the number of UAVs needs to be preset and does not change in the whole running process of the algorithm. The mutation strategy pool and dynamic parameter mechanism are not used in DEEM.
(3) DEVPISM adopts the same coding mechanism as DEVIPSK and adopts the K-Means to initialize the population. The mutation strategy pool and dynamic parameter mechanism are used in the DEVPISM. But when updating the population, it performs replacement and removal to generate offspring population.
Fig. 5 shows that in each different example, the convergence rate of DEVIPSK and DEVPISM is better than that of DEVIPS and DEEM in the early stage, and keeps better results in the whole process of evolution. The position of the UAV is the center of each cluster. So compared with randomly generating the position of the UAV, the initialization of the K-Means can make the UAV have the closest distance to each IoT device in this cluster. According to Eq. (8), the smaller the distance between the two devices, the greater the channel gain, so the performance will be better.

Figure 5: Comparison of EC(J) obtained by DEVIPSK, DEVPISM, DEVIPS, and DEEM when n is 50, 100, 200, 300, 400, 500, 600, 700, respectively
Since DEVIPSK adopts an adaptive mechanism to update the population, the energy consumption of DEVPISM and DEVIPSK in the process of evolution is very similar. In this adaptive mechanism, a population update includes inserting, replacing and deleting at most one individual. This can ensure that the change of population size will not be too large, so it will not have a great impact on the overall performance.
The statistical test results of different algorithms are shown in Tab. 5. It represents the average value and standard deviation of the energy consumption of the entire system for 20 runs, and the percentage of performance improvement in square brackets.
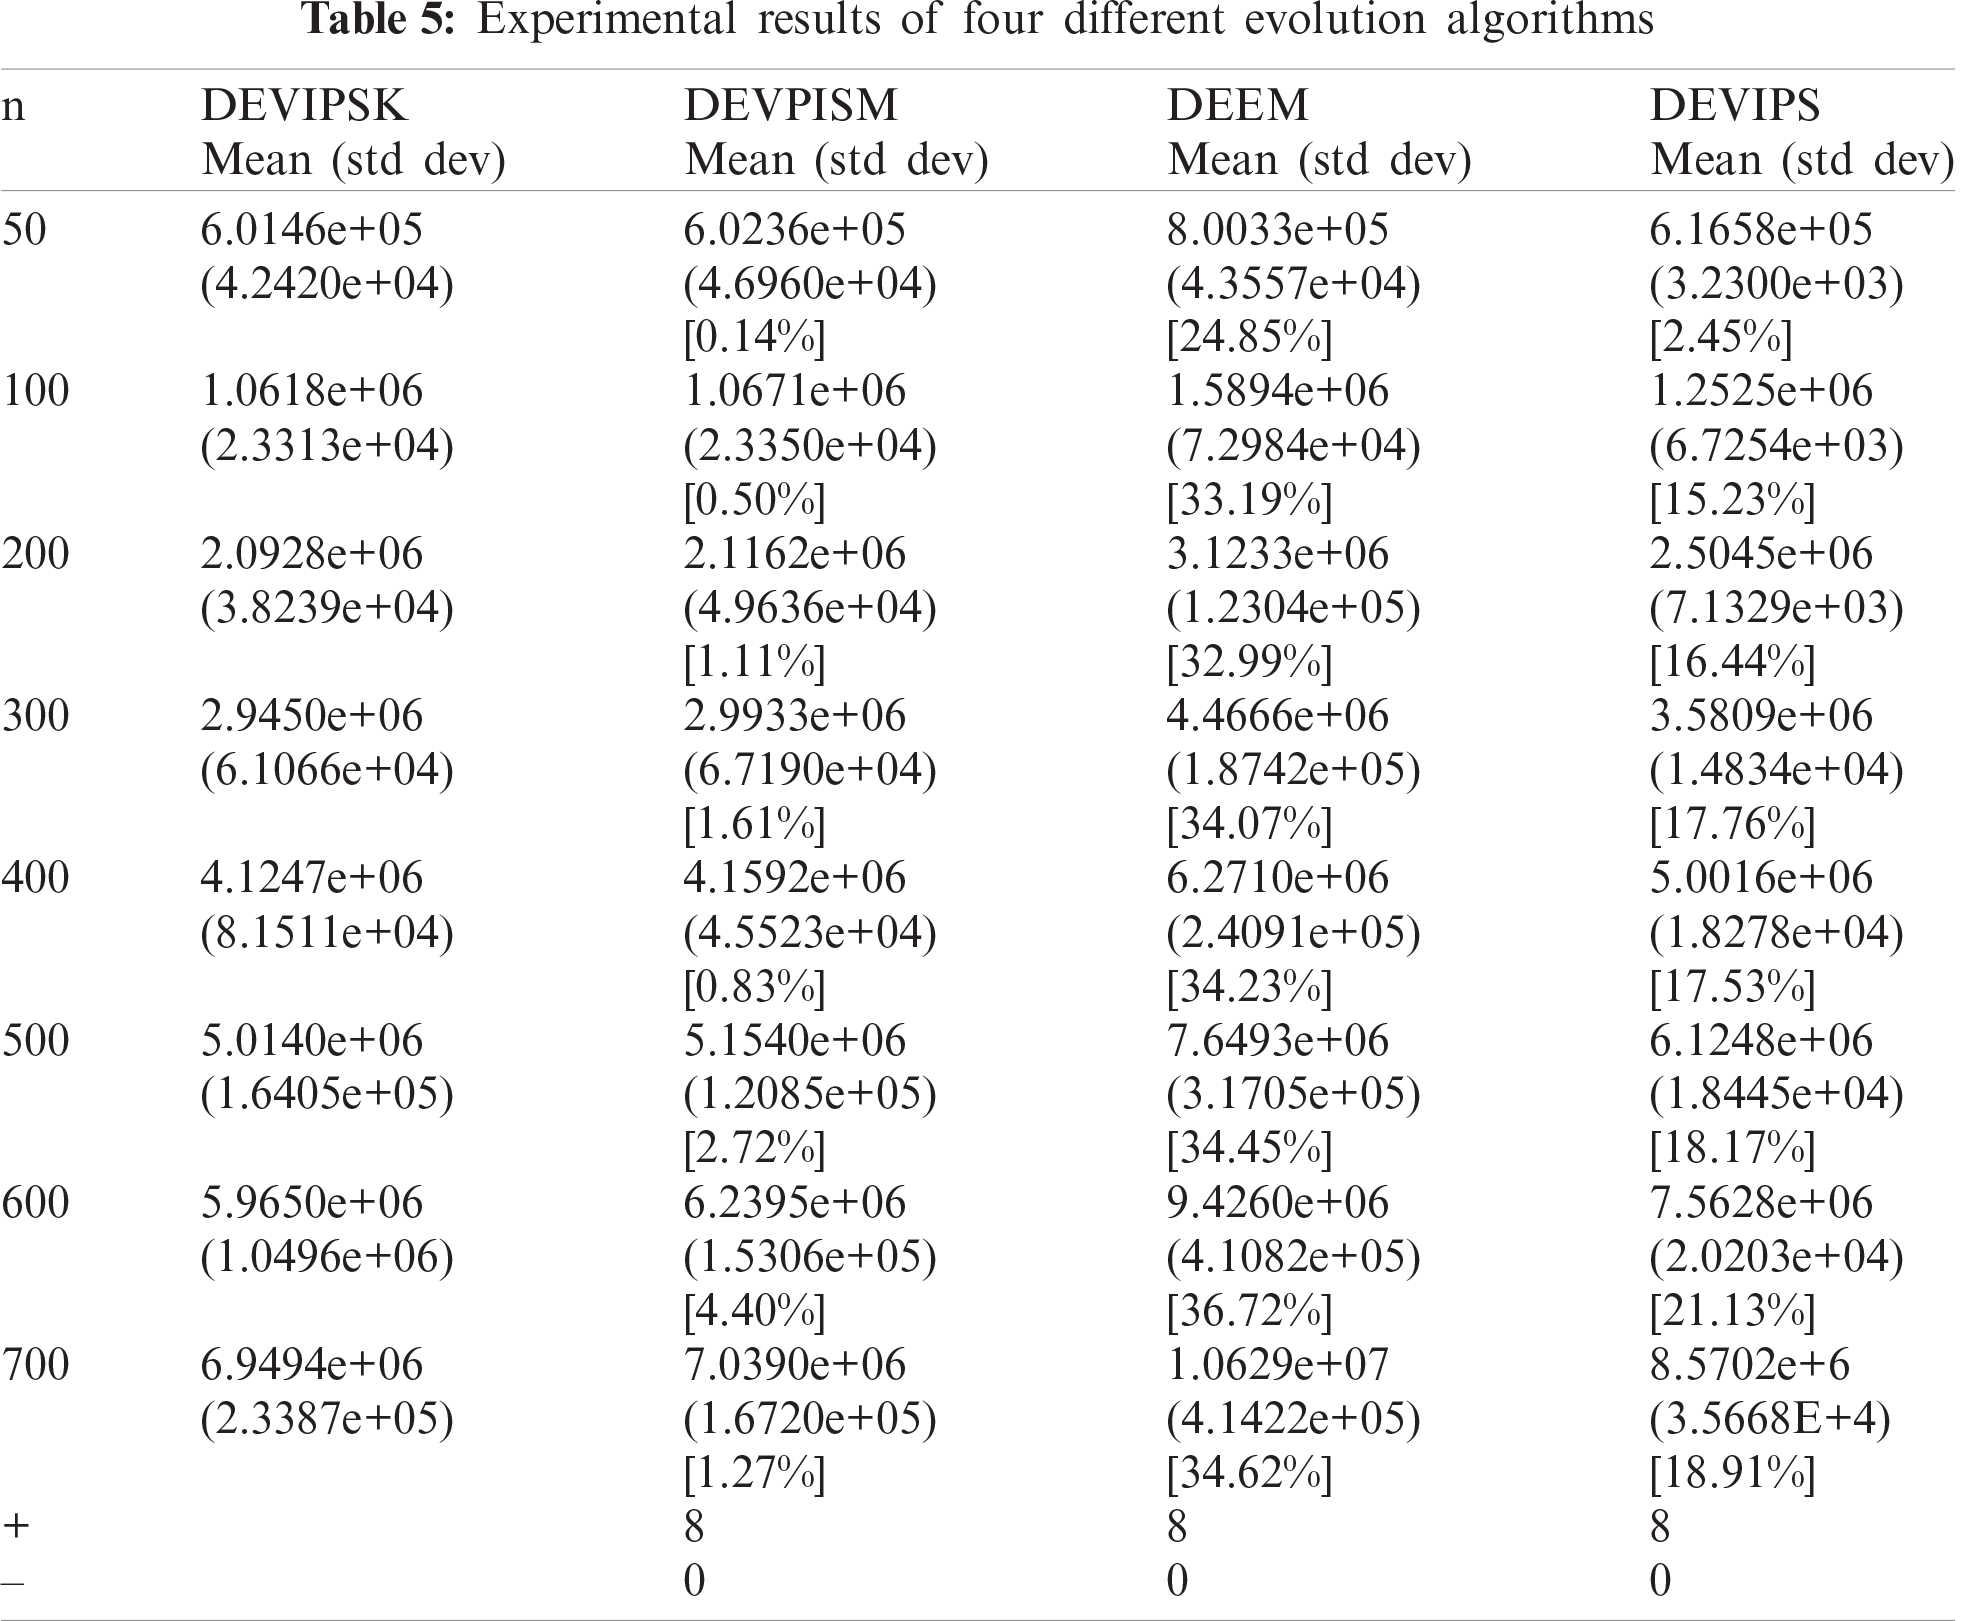
It can be seen that the DEVIPSK has good performance on each different instance. Compared to DEEM, DEVIPSK has the biggest performance improvement. When n = 600, DEEM consumed 9.4260e + 06 J energy, whereas DEVIPSK consumed 5.9650e + 06 J energy, which is 36.72% less. DEEM only randomly generates the positions of UAVs during initialization, and the number of UAVs remains the same throughout the process. Compared to DEVIPS, when n = 600, the improvement of DEVIPSK is the most, increasing 21.13%. Since DEVIPS only randomly generates the position of the UAV during initialization, it is effective to introduce the K-Means clustering algorithm when initializing the population. Compared to DEVIPSM, DEVIPSK also improves the performance of the whole system to a certain extent, but the improvement is the least. When n = 600, the performance improved the most, with a promotion of 4.40%.
Considering that the terminal IoT devices are usually unable to transmit over long distance due to the limitation of its battery energy, we try to solve this problem by combining multi-UAV deployment with mobile edge computing. Besides, a differential evolution algorithm with variable population size based on a mutation strategy pool initialized by K-Means is proposed to optimize the positions and number of UAVs. In a series of different examples, each instance has a different number of IoT devices. Through the comparison between DEVIPSK and other algorithms, the experimental results show the effectiveness of the algorithm. In the future, we will study the problem of task scheduling in a mobile edge computing system.
Funding Statement: This paper was supported in part by Project funded by China Postdoctoral Science Foundation under Grant 2020M671552, in part by Jiangsu Planned Projects for Postdoctoral Research Funds under Grant 2019K233, in part by NUPTSF (NY220060), in part by the Opening Project of Jiangsu Key Laboratory of Data Science and Smart Software (No. 2020DS301), in part by Natural Science Foundation of Jiangsu Province of China under Grant BK20191381.
Conflicts of Interest: The authors declare that they have no conflicts of interest to report regarding the present study.
1. R. Amin, M. Hussain, M. Alhameed, S. M. Raza, F. Jeribi et al., “Edge-computing with graph computation: A novel mechanism to handle network intrusion and address spoofing in SDN,” Computers, Materials & Continua, vol. 65, no. 3, pp. 1869–1890, 2020. [Google Scholar]
2. X. L. Wei, J. W. Liu, Y. G. Wang, C. G. Tang and Y. Y. Hu, “Wireless edge caching based on content similarity in dynamic environments,” Journal of Systems Architecture, vol. 115, pp. 102000–102007, 2021. [Google Scholar]
3. K. Kim and C. S. Hong, “Optimal task-UAV-egde matching for computation offloading in UAV assisted mobile edge computing,” in 2019 20th Asia-Pacific Network Operations and Management Symp., Matsue, Japan, pp. 1–4, 2019. [Google Scholar]
4. Y. Du, K. Wang, K. Yang and G. Zhang, “Energy-efficient resource allocation in UAV based MEC system for IoT devices,” in 2018 IEEE Global Communications Conf., Abu Dhabi, United Arab Emirates, pp. 1–6, 2018. [Google Scholar]
5. L. Fan, W. Yan, X. Chen, Z. Chen and Q. Shi, “An energy efficient design for UAV communication with mobile edge computing,” China Communications, vol. 16, no. 1, pp. 26–36, 2019. [Google Scholar]
6. M. Yang, H. Yao, X. Zhang, J. Wang and Y. Liu, “Multi-UAV deployment for MEC enhanced IoT networks,” in 2020 IEEE/CIC Int. Conf. on Communications in China, Chongqing, China, pp. 436–441, 2020. [Google Scholar]
7. M. Mozaffari, W. Saad, M. Bennis and M. Debbah, “Mobile unmanned aerial vehicles (UAVs) for energy-efficient internet of things communications,” IEEE Transactions on Wireless Communications, vol. 16, no. 11, pp. 7574–7589, 2017. [Google Scholar]
8. M. Alzenad, A. El-Keyi, F. Lagum and H. Yanikomeroglu, “3D placement of an unmanned aerial vehicle base station (UAV-bS) for energy-efficient maximal coverage,” IEEE Wireless Communication Letters, vol. 6, no. 4, pp. 434–437, 2017. [Google Scholar]
9. M. Alzenad, A. El-Keyi and H. Yanikomeroglu, “3-D placement of an unmanned aerial vehicle base station for maximum coverage of users with different QoS requirements,” IEEE Wireless Communications Letters, vol. 7, no. 1, pp. 38–41, 2018. [Google Scholar]
10. Y. Liu, S. Xie and Y. Zhang, “Cooperative offloading and resource management for UAV-enabled mobile edge computing in power IoT system,” IEEE Transactions on Vehicular Technology, vol. 69, no. 10, pp. 12229–12239, 2020. [Google Scholar]
11. P. Huang, Y. Wang, K. Wang and K. Yang, “Differential evolution with a variable population size for deployment optimization in a UAV-assisted IoT data collection system,” IEEE Transactions on Emerging Topics in Computational Intelligence, vol. 4, no. 3, pp. 324–335, 2020. [Google Scholar]
12. S. Wu, Y. Liu, J. Wang and Q. Li, “Sentiment analysis method based on kmeans and online transfer learning” Computers, Materials & Continua, vol. 60, no. 3, pp. 1207–1222, 2019. [Google Scholar]
13. A. Hourani, S. Kandeepan and A. Jamalipour, “Modeling air-to-ground path loss for low altitude platforms in urban environments,” in 2014 IEEE Global Communications Conf., Austin, TX, USA, pp. 2898–2904, 2014. [Google Scholar]
14. M. Mozaffari, W. Saad, M. Bennis and M. Debbah, “Mobile internet of things: can UAVs provide an energy-efficient mobile architecture,” in 2016 IEEE Global Communications Conf., Washington, DC, pp. 1–6, 2016. [Google Scholar]
15. Q. Wu, Y. Zeng, and R. Zhang, “Joint trajectory and communication design for multi-UAV enabled wireless networks,” IEEE Transactions on Wireless Communications, vol. 17, no. 3, pp. 2109–2121, 2018. [Google Scholar]
16. Y. Wang, Z. Ru, K. Wang and P. Huang, “Joint deployment and task scheduling optimization for large-scale mobile users in multi-UAV-enabled mobile edge computing,” IEEE Transactions on Cybernetics, vol. 50, no. 9, pp. 3984–3997, 2020. [Google Scholar]
17. R. Storn, “On the usage of differential evolution for function optimization,” in Biennial Conf. of the North American Fuzzy Information Processing Society, Berkeley, CA, USA, pp. 519–523, 1996. [Google Scholar]
18. J. Brest, S. Greiner, B. Boskovic and V. Zumer, “Self-adapting control parameters in differential evolution: A comparative study on numerical benchmark problems,” IEEE Transactions on Evolutionary Computation, vol. 10, no. 6, pp. 646–657, 2006. [Google Scholar]
19. R. Storn and K. Price, “Differential evolution-a simple and efficient heuristic for global optimization over continuous spaces,” Journal of Global Optimization, vol. 11, no. 4, pp. 341–359, 1997. [Google Scholar]
20. Y. Wang, H. Liu, H. Huang and P. N. Suganthan, “Differential evolution with a new encoding mechanism for optimizing wind farm layout,” IEEE Transaction on Industrial Informatics, vol. 14, no. 3, pp. 1040–1054, 2018. [Google Scholar]
 | This work is licensed under a Creative Commons Attribution 4.0 International License, which permits unrestricted use, distribution, and reproduction in any medium, provided the original work is properly cited. |