DOI:10.32604/cmc.2021.018155
| Computers, Materials & Continua DOI:10.32604/cmc.2021.018155 | |
| Article |
Predicting the Need for ICU Admission in COVID-19 Patients Using XGBoost
1College of Computer and Information Sciences, Jouf University, Sakaka, KSA
2Faculty of Engineering, Al Azhar University, Cairo, Egypt
3Faculty of Mathematical and Computer Sciences, University of Gezira, Wad Madani, Sudan
4Faculty of Medicine, Al Azhar University, Cairo, Egypt
5College of Medicine, Shaqra University, KSA
*Corresponding Author: Mohamed Ezz. Email: maismail@ju.edu.sa
Received: 27 February 2021; Accepted: 19 April 2021
Abstract: It is important to determine early on which patients require ICU admissions in managing COVID-19 especially when medical resources are limited. Delay in ICU admissions is associated with negative outcomes such as mortality and cost. Therefore, early identification of patients with a high risk of respiratory failure can prevent complications, enhance risk stratification, and improve the outcomes of severely-ill hospitalized patients. In this paper, we develop a model that uses the characteristics and information collected at the time of patients’ admissions and during their early period of hospitalization to accurately predict whether they will need ICU admissions. We use the data explained and organized in a window-based manner by the Sírio-Libanês hospital team (published on Kaggle). Preprocessing is applied, including imputation, cleaning, and feature selection. In the cleaning process, we remove zero-variance, redundant, and/or highly correlated (measured by the Pearson correlation coefficient) features. We use Extreme Gradient Boosting (XGBoost) with early stopping as a predictor in our developed model. We run the experiment in four stages starting from the features of Window 1 in Stage 1 and then incrementally add the features of Windows 2–4 in Stages 2–4 respectively. We achieve AUCs of 0.73, 0.92, 0.95, and 0.97 in those four stages.
Keywords: COVID-19; ICU admission; XGBoost
Coronavirus disease (COVID-19) is an infectious disease that first outbroke in Wuhan, the provincial capital of Hubei province, and spread very quickly across the world. Since its first appearance, COVID-19 has caused a global pandemic in a short period of time [1]. It is caused by the Severe Acute Respiratory Syndrome Coronavirus 2 (SARS-CoV-2) [1]. The number of confirmed cases exceeds 27 million while the death cases exceeded 800,000 by the ninth month of its discovery (as of September 2020) as it continues to infect people worldwide [2]. The main transmission medium of COVID-19 is respiratory droplets. Studies show that the surfaces touched by infected individuals can be a route of transmission among individuals since the virus can persist on these surfaces, therefore, its spread is described as being exponential [2]. COVID-19 is associated with a higher mortality rate than that of seasonal influenza. According to the World Health Organization (WHO), about 80% of the infections are mild or symptomatic, 15% are severe and require oxygen, and 5% are critical and require ventilation. People with coexisting health conditions (such as hypertension, diabetes, heart disease, and obesity), elderly individuals, and those who are in nursing homes are most likely to be infected by COVID-19, resulting in a large number of hospitalization and deaths [3–5].
To deal with deadly diseases that affect people with underlying conditions (which have increased globally in recent years), timely admission to the ICU becomes increasingly important [6,7]. For deadly diseases such as community-acquired pneumonia (CAP) and emphysematous pyelonephritis, guidelines and scores for ICU admission recommendations are developed. These guidelines stipulate specific criteria of septic shock with a need for vasopressors or mechanical ventilation for a patient to be admitted. They have been recommended by the American Thoracic Society (ATS) and the Infectious Diseases Society of America (IDSA) since 2007, and are meant for managing people infected with CAP [8,9]. To define the severity of CAP, different assessment tools and several criteria have been proposed to properly determine the cases that require ICU admissions and early intervention [10–12]. Delaying intensive care admissions will hinder timely intervention and increase the mortality rate [13,14]. Many research works have been conducted following the introduction of the ICU admission guidelines for CAP disease and introduced diverse useful and validation results. They include the work of James D Chalmers et al. which conducted a study on adult patients with CAP [15]. They excluded those who met ATS and IDSA major criteria on admission and those who were not suitable for intensive care because of major comorbid illnesses or derivations. Their results showed that the ATS and IDSA criteria obtained an area under the curve (AUC) of 0.85 when predicting the needs for mechanical ventilation or vasopressor support and ICU admission. Paschalina Kontou MD et al. studied the patients with pneumococcal and recorded laboratory and clinical features at the emergency department to calculate the ATS and IDSA criteria [16]. They obtained a sensitivity of 0.90 and a negative predictive value of 0.97 when predicting ICU admission. Phua et al. [17] reviewed retrospectively the patients admitted to National University Hospital in Singapore and excluded those who met ATS and IDSA major criteria for severe CAP at the emergency department. For ATS and IDSA minor criteria, they obtained AUCs of 0.88 and 0.85 for predicting hospital mortality and ICU admission respectively. For emphysematous pyelonephritis, there are warning scores that predict the need for admission to ICU [18]. These scores include quick sepsis-related organ failure assessment, national early warning score, and modified early warning score. Since COVID-19 has been considered life-threatening for many individuals, approaches need to be devised to help in managing ICUs in hospitals. They can help in managing existing beds to sustain the lives of those at risk of imminent death by predicting who requires critical care.
In this paper, we propose a methodology that can be used in managing ICUs to sustain the lives of at-risk COVID-19 patients by predicting who requires ICU admission during their stay in hospitals (in the first 12 h). This methodology can help to prepare healthcare systems and avoid a collapse that can happen due to the need for ICU beds which is above the capacity, assuming that human resources, personal protective equipment, and ICU professionals are available. We use a dataset that contains anonymized data from Hospital Sírio-Libanês, São Paulo, and Brasilia, following the best international practices and recommendations. The dataset is cleaned and its values are scaled to the range from −1 to 1. Our model is built based on XGBoost using the early stopping mechanism, where we utilize a validation set to avoid over-fitting. Since the dataset is organized in windows of events (see Fig. 1), we run the experiment in four stages starting from the features of Window 1 in Stage 1 and then incrementally adding the features of Windows 2–4 in Stages 2–4 respectively. We achieve AUCs of 0.73, 0.92, 0.95, and 0.97 in the four stages respectively.
The dataset is downloaded from Kaggle (https://www.kaggle.com/S%C3%ADrio-Libanes/ https://covid19). This dataset is considered to be the first one of its kind available for researchers about detailed COVID-19 patients’ measures that can be used to determine ICU needs. It is organized in a window-based manner and explained by the Sírio-Libanês hospital team (see Fig. 1). It contains anonymized data from Hospital Sírio-Libanês, São Paulo, and Brasilia, following the best international practices and recommendations. The dataset has 54 features categorized as follows: three features represent the patients’ demographic information, nine features represent the patients’ previous comorbidities diseases, 36 features obtained from the results of laboratory tests for blood, urine, nasal sample, etc., and six features represent the of vital signs. Other calculated features are added to the abovementioned features in each time window, including the means, medians, maximums, minimums, and differences (max-min) of vital signs and laboratory tests in each time window. This leads to 180 features for laboratory tests and 36 features for vital signs. Therefore, the total number of features (laboratory tests + vital signs + demographic information + patients’ previous comorbidities diseases) becomes 228.

Figure 1: Patients’ data are aggregated by time windows. The figure is downloaded from https://www.kaggle.com/S%C3%ADrio-Libanes/COVID19
Some of the laboratory tests and vital signs features are not guaranteed to be available in all the time points because these features may not have measurements within the time window and their values will be Null. Therefore, we use a special imputation technique to handle the missing values in these features. The used imputation technique fills the missing values based on a time window. If a patient has no measurement recorded in a time window, it is reasonable to assume that his condition is clinically stable. Therefore, his laboratory tests and vital signs will be similar to the neighboring windows’ and the missing values can be filled using the previous or the next entry based on availability. The imputation technique using this process is depicted in Fig. 2.

Figure 2: Imputation based on time windows
After filling up missing values, a data cleaning process is applied as follows. First, all the features with zero variance are removed from the dataset, because zero variance means that all the cases have the same value. In the dataset that we are using, the difference between the minimum and the maximum is always zero, which means that the measures on the patient are done once per time window. In this process, 36 features are removed from the dataset and 192 features remain. Second, redundant features with identical values or duplicated columns are removed. The measurements of some features are taken once per time window, which indicates that the minimum and maximum values are the same. This process removes 108 features and remains 84 features. Third, correlated features with a Pearson correlation score over 0.7 are removed from the dataset. The heat map of the correlation between features is depicted in Fig. 3. In this process, 45 features are removed and 39 remain. Some of these remaining features and their statistics are shown in Tab. 1.

Figure 3: Feature correlation heat map
2.2 Preliminary Feature Analysis
After the feature selection process in the previous subsection, we conduct a preliminary statistical analysis for the selected 39 features to understand the statistical relationship of these features with patient ICU admission status. The results of this analysis are presented in Tab. 1. We calculate the p-value of the regression model for each feature to determine the relationship between the features and ICU admission. Using a significance level of 0.05, a p-value less than 0.05 indicates a significant relationship between the feature and ICU admission. According to the p-value, the features LACTATE_MEDIAN, OXYGEN_SATURATION_MIN, PLATELETS_MEDIAN, BE_VENOUS_MEDIAN, PCR_MEDIAN, and UREA_MEDIAN have a significant impact on determining the admission to ICU.
As shown in Fig. 1, a patient’s period of hospitalization is divided into five windows and each window has a duration of 2 h. The patient is admitted to the hospital at time 0 and his health conditions are followed in the subsequent windows. Fig. 4 shows that the patient can be admitted to ICU at the time of admission to the hospital (as shown in PATIENT_VISIT_IDENTIFIER 17) or at any time window, also the patient may not need an ICU admission throughout his hospitalization (as shown in PATIENT_VISIT_IDENTIFIER 16). PATIENT_VISIT_IDENTIFIER 15 and 18 show that the patient can be admitted to ICU in Windows 5 and 3, respectively.
To prepare data for modeling, we need to determine the covariates (predictors) and the response [19]. The response y is always the status of the patient in the last window (Window 5). It is a binary variable that indicates if the patient is admitted to ICU (y = 1) or not (y = 0). We need to know as early as possible whether the patient will be admitted to the ICU; therefore, the data of Window 1 shown in Fig. 5a is preferred to be predicted. Because the first window data only generates 353 valid instances for prediction, which is not sufficient to obtain high accuracy, we augment these instances by adding the data from the other windows in three stages. In the first stage, we add the second window data as depicted in Fig. 5b. By this addition, the number of instances increases to 679. In the second and third stages, we incrementally add the third window data and the fourth window data as shown in Figs. 5c and 5d separately. The numbers of available instances in the second and third stages are 965 and 1220, respectively.
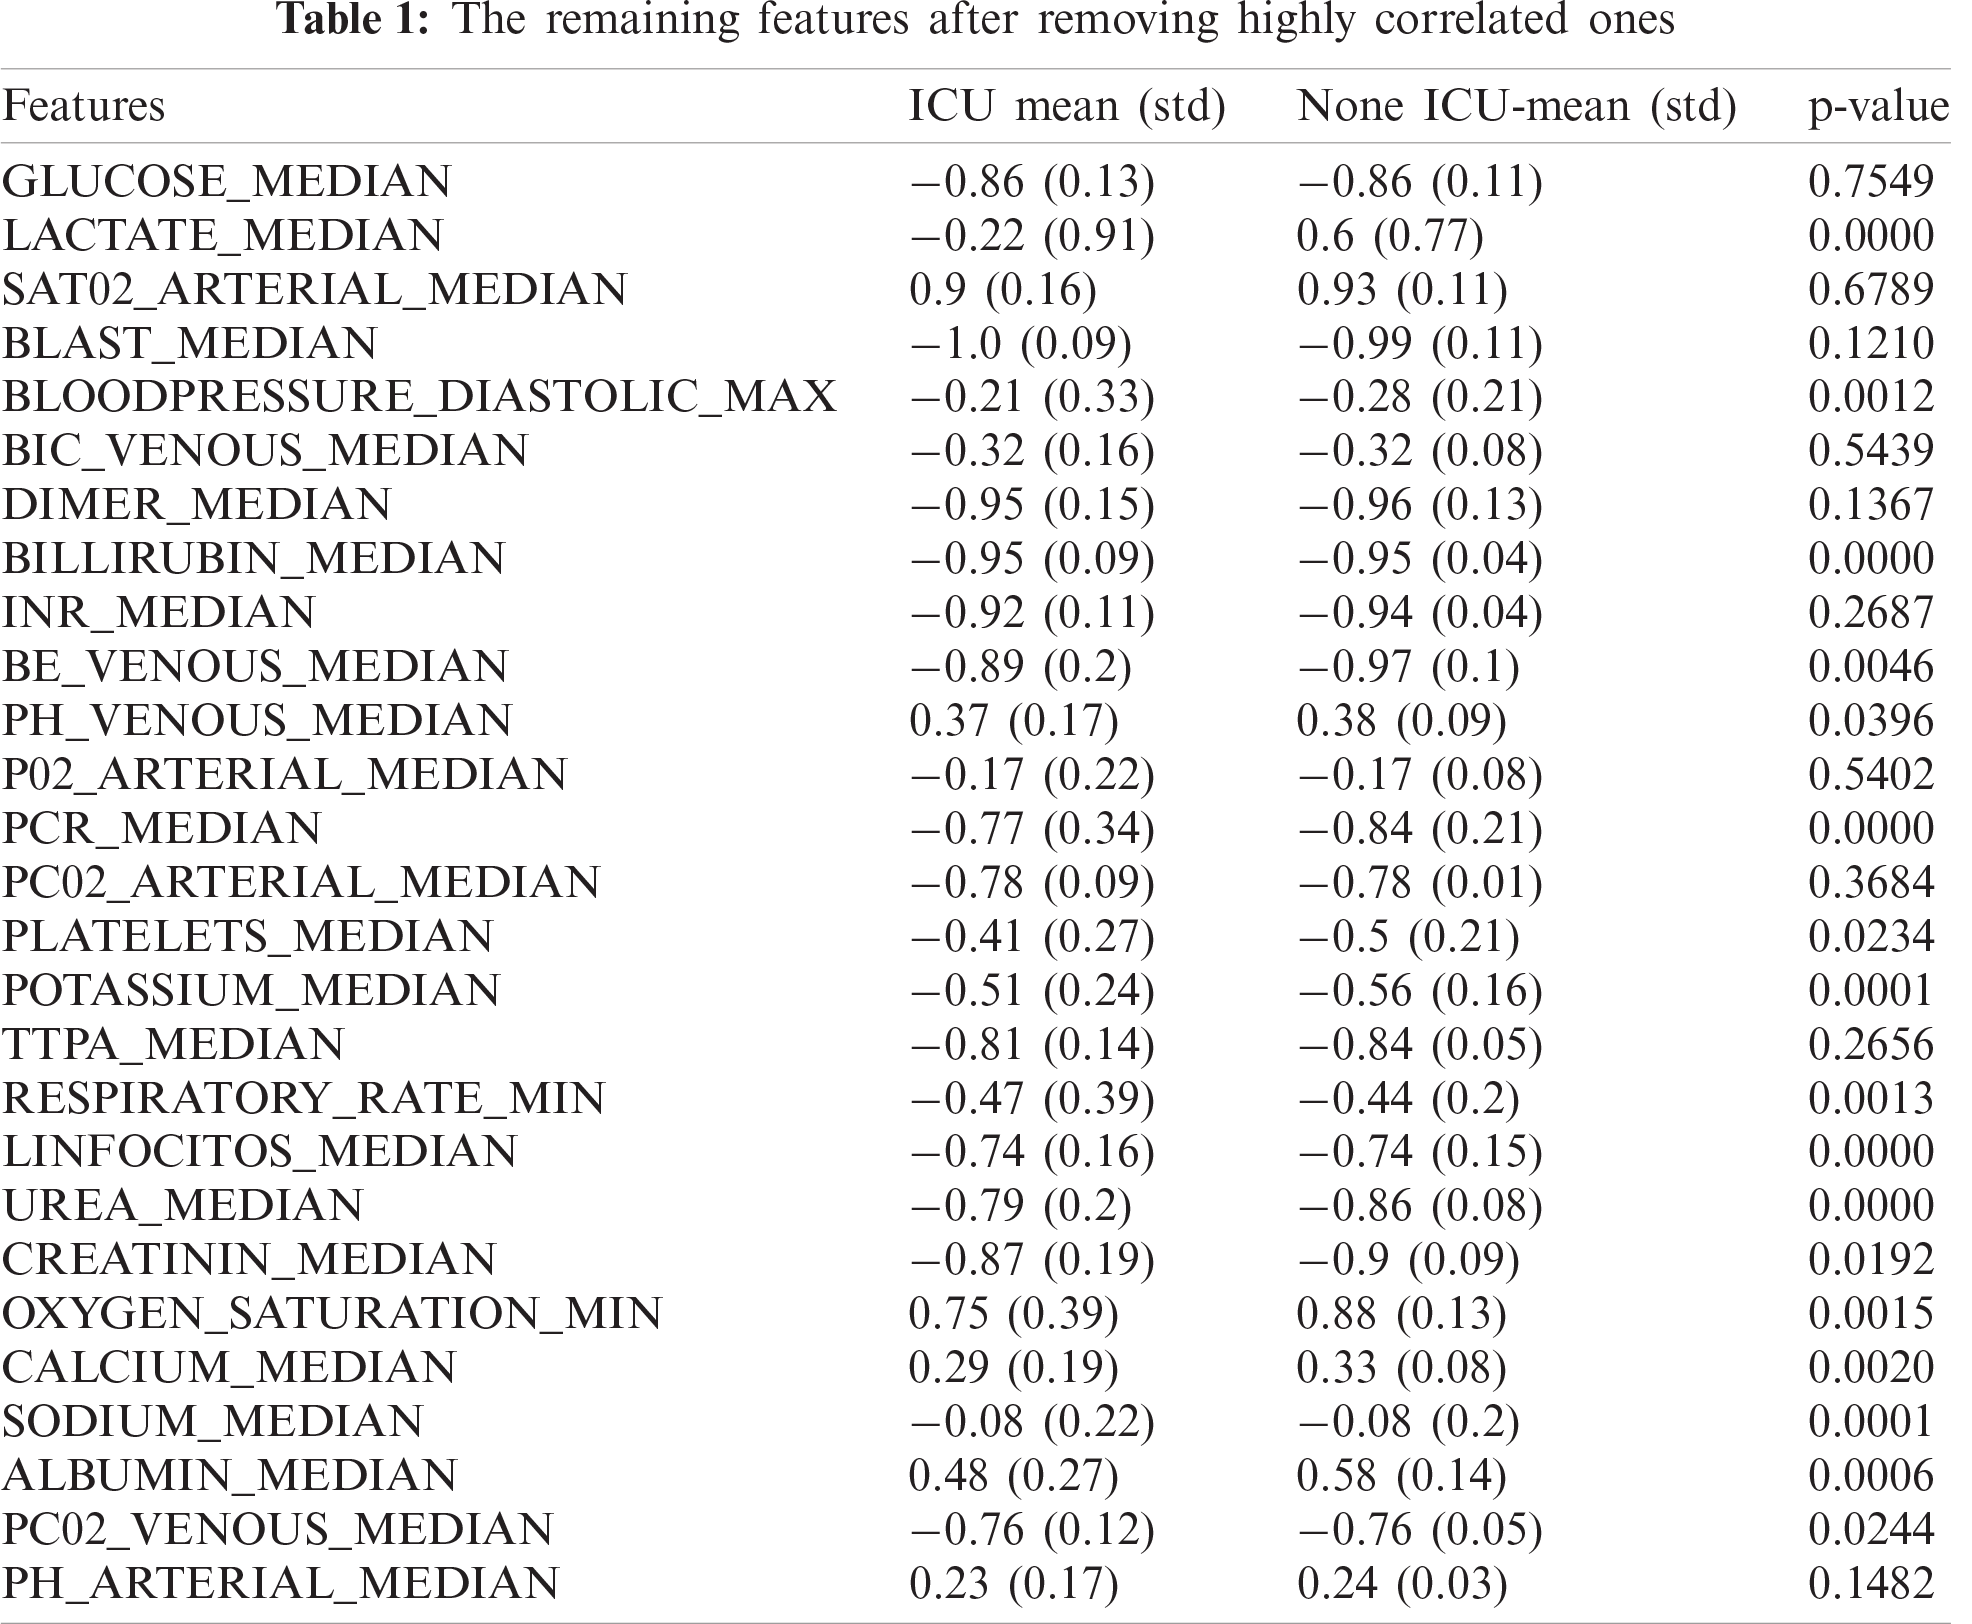

Figure 4: Patient admissions to ICU (0 not in ICU, 1 in ICU)

Figure 5: The data of different windows: (a) using the first window data for predictions, (b) Using the first two windows for predictions, (c) Using the first three windows for predictions, (d) Using the first four windows for predictions. Meanwhile, Wi refers to Window i
We build our model as a binary classifier where single-window or combined-window data (medical measures) starting from Window 1 up to Window 4 is denoted by X = x1, x2,…, xn which represents the predictors for the response Yi, the state of the patient in the last window. We intend to develop a model that can be used as a function F: X → Y that maximizes the AUC based on n training samples associated with labels Yi, i = 1,…, n. We adopt Extreme Gradient Boosting (XGBoost), a boosted tree algorithm, to build the model, because it can control overfitting by following the principle of gradient boosting and using more regularized-model formalization, which gives it an enhanced performance [20]. It is designed for portability, performance, and efficiency, which makes it a state-of-the-art machine learning method for tabular data [21]. Therefore, it is used by many machine learning researchers in recent years. Fig. 6 shows our proposed model that splits the data into a development set (80%) and a testing set (20%). The predictors or the features are the measurements obtained according to the experiment setup, i.e., Window 1 features, Windows 1 and 2 features, etc.
The development set is also split into a training set (80%) and a validation set (20%), as shown in Fig. 6. Using the training set, we rank the features based on their significance using Pearson correlation and χ2 statistics. Then we select the top two most important features and calculate the performance on the validation set. We iterate through the rest of the features by adding one feature at a time according to their rank. Based on the obtained AUC performance of each iteration, we determine the top-ranked features that give the highest performance in Stages 1–4 respectively. We repeat the model validation on each set of features five times, and based on the average performance of each set, we select the best number of features. The numbers of features that give the highest performance are 32, 26, 33, and 25 for Stages 1–4 respectively. The process of feature selection is depicted in Algorithm 1.

Figure 6: The proposed model for predicting the need for ICU admission

2.4 Training Extreme Gradient Boosting (XGBoost)
We use the development set for building our model based on XGBoost with the early stopping mechanism, where we utilize a validation set to avoid overfitting. A major challenge in training XGBoost is to determine the flection point at which the model performance on validation data starts to decrease while the performance on the training set continues to increase. We use early stopping to automatically monitor the performance of the XGBoost model on our data by testing it on the validation set during the training process and stop the training process when there is no improvement in performance. We use AUC as a performance measure for deciding the early stopping. We tune four XGBoost hyperparameters: max_depth, subsample, colsample_bytree, and early_stopping_rounds. The max_depth represents the depth of each tree, which is the maximum number of different features used in each tree. It is recommended to go from a low value of max_depth (3 for instance) and then increase it incrementally by one and stop when there is no enhancement in performance. In our experiment, we set max_depth to 5 because the max_depth of 3 makes the model biased and the max_depth of 7 causes overfitting. The subsample parameter indicates the percentage of rows that should be taken to build the tree. We set the value of the subsample to 0.8 because we do not want to take many rows that cause the performance to drop significantly. The colsample_bytree refers to the number of columns used by each tree to prevent domination of some columns on prediction. Since we have few columns (39), we set the value of colsample_bytree to 0.8. The early_stopping_rounds parameter is set to 100 so that it can tolerate small changes in performance. The rest of the parameters are set to default values.
The performance of our prediction model is evaluated by accuracy, recall, precision, and F1 score. These measures are among the frequently used ones to evaluate prediction methods. Four values are used to calculate these measures: (i) true positive (TP), the number of positive cases correctly classified as positive; (ii) true negative (TN), the number of negative cases correctly classified as negative, (iii) false positive (FP); the number of negative cases incorrectly classified as positive; and (iv) false negative (FN), the number of the positive cases incorrectly classified as negative.
Accuracy refers to the percentage of correctly classified cases:
Recall is the proportion of positive cases that are correctly predicted:
Precision measures the percentage of actual positive cases among those predicted as positive:
F1 score is a measure that balances recall and precision:
We adopt the receiver operating characteristic (ROC) curve as a threshold-independent measure to evaluate the effectiveness of our ICU admission prediction model. The prediction reliability is reflected by the area under the ROC curve (AUC). An area close to 1 indicates a good classifier while a random classifier normally has an area of 0.5.
In this paper, we propose a model for predicting COVID-19 patients’ admission to ICU during their hospitalization using their medical data collected in the first 12 h in four stages according to time windows. Fig. 7 shows the average scores on ten different test sets. Fig. 7a shows that the first stage achieves an AUC of 0.73, which is not the best performance because it only has a small number of instances relative to the other stages (Stages 2–4). We observe that when the number of instances increases, the performance improves, as reflected in Stages 2–4, which achieve AUCs of 0.92, 0.95, and 0.97 respectively. These results are shown in Figs. 7b–7d for Stages 2–4 respectively.

Figure 7: The ROC curves and AUCs for Stages 1–4 are depicted in (a–d), respectively
To determine the optimal threshold or cut-off value, we compare the measures sensitivity, specificity, and AUC together. We select the threshold point on which the values of sensitivity (recall) and specificity are close to the value of AUC, and the absolute difference between the sensitivity and specificity is minimum. This is inspired by the work of Unal [22], who devises a method that determines the threshold based on the highest sensitivity and specificity starting from finding the highest value of AUC and then finds the values of sensitivity and specificity simultaneously close to the AUC, i.e., the value that minimizes the following equation.
In our experiments, we determine the cut-off value using Eq. (5) on the training set and use this value in the testing process to calculate the other performance measures (accuracy, precision, recall, and F1 score). The performance measures obtained by minimizing Eq. (5) are shown in Fig. 8, where the bars show the average results of all experimental runs in specific stages. Fig. 8 shows that Stages 1–4 obtain corresponding accuracies of 0.73, 0.93, 0.95, and 0.97, respectively. Also, Fig. 8 shows that the precision values for Stages 1–4 are 0.70, 0.94, 0.94, and 0.97, respectively. High precision means that we can accurately predict the patients who need ICU, i.e., low precision means identifying those who do not need ICU as ICU patients, and this can result in wasting ICU resources that may be needed for actual ICU patients. It is noticeable that the precision improves significantly when we add more features by combining windows of medical measures. On the other hand, Stage 1 that uses the medical measures of the first window stands out for the lowest performance as measured by AUC, accuracy, precision, recall, and F1 score, while Stage 4, in which we combine the medical measures of Windows 1 to 4 achieves the best performance in these measures. The recall is also an important measure. A high recall can help in avoiding the risk in identifying the patients who need ICU as no-ICU patients and decrease the mortality rate. The recalls obtained in Stages 1–4 are 0.74, 0.89, 0.94, and 0.96 respectively. Both precision and recall can reach the highest value of 1.0 when we have a categorical response variable that can be perfectly separated by covariates, but in a practical situation, the covariates may not separate the response variable perfectly; therefore, an increase in the recall can lead to a decrease in precision, and this is known as a precision-recall tradeoff. Selecting the perfect threshold value (as we did by using Eq. (5)) can help in adjusting the precision and recall at a high value. F1 score is also needed to balance the precision and recall and verify the performance of our model, especially when there is an imbalanced class distribution, which is the case in Stages 2–4 that have a large number of actual negative cases. Fig. 8 shows that our model achieves F1 scores of 0.72, 0.91, 0.94, and 0.95 in Stages 1–4, respectively.
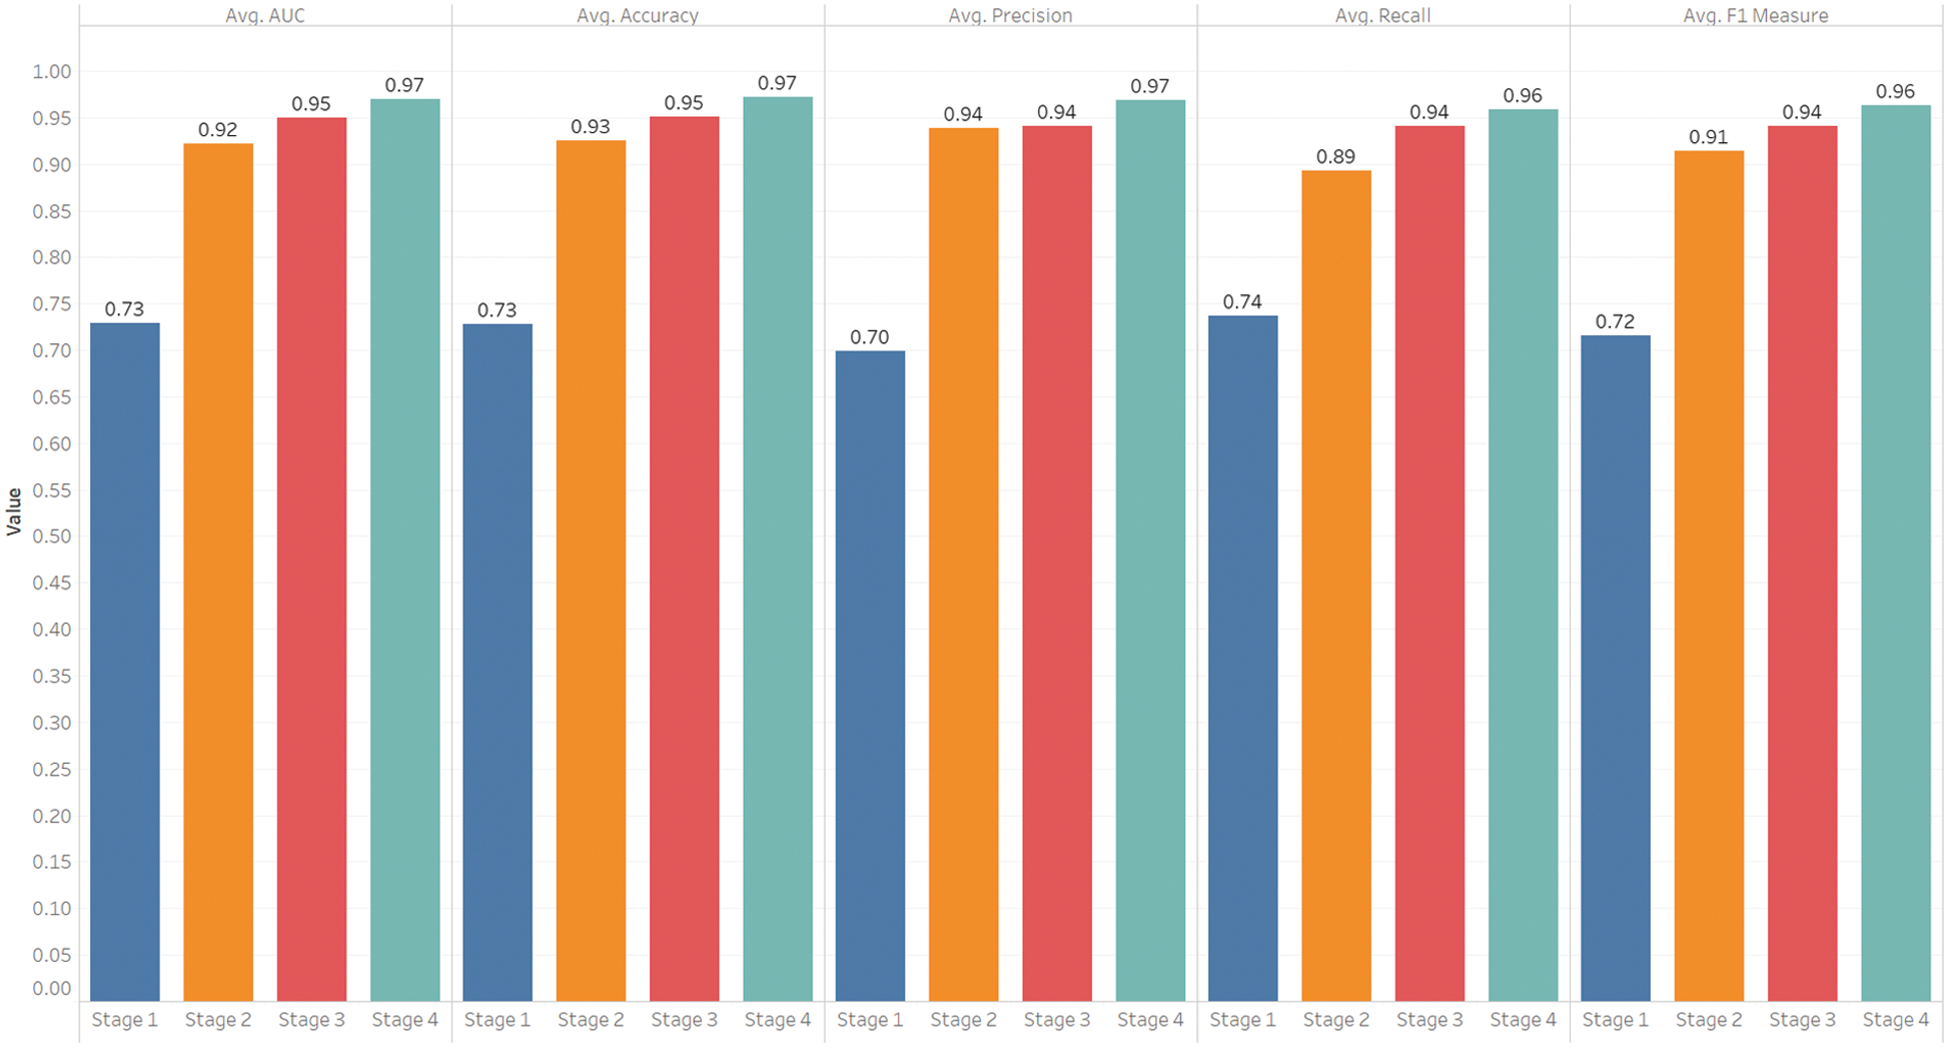
Figure 8: Performance by stages (mean results of the proposed model across all stages)

Figure 9: The important features associated with patient admissions to ICU for Stages 1–4
The important features associated with either patient admission to ICU or mortality are shown in Figs. 9a–9d for Stages 1–4, respectively. These features are selected during our model development process, where we rank the features according to their importance and then select the features that contribute most to the prediction of ICU admission. These features include the decrease in lymphocyte which is known as lymphocytopenia (in Spanish Linfocitions), comorbidities, patients with an impaired immune system (Immunocompromised), blood hypertension (HTN), the quantity (viral load) of COVID-19 PCR, the percentage of LDH or lactate dehydrogenase, sodium, low O2 saturation, and age percentile. The lymphocytopenia is among the most important predictors of ICU admission [23,24]. Lymphocytes are a common characteristic of infection caused by the reaction of the body due to a cytokine storm, where the levels of CD4 + T and CD8 + T cells enhance virus survival [25]. It has been observed that the decrease in the total number of lymphocytes (lymphocytopenia) increases the risk of death and significantly affects the patient’s need for ICU admission. Some clinical results indicate that the comorbidities associated with aging, such as diabetics and impaired kidney function in addition to HTN, are among the important factors that determine the need for ICU admission [26]. The quantity of virus that can be found through PCR analysis directly affects the acute inflammatory process that occurs in different tissues, especially the tissues of the lungs, blood vessels, and kidneys, which contributes to the deterioration of the patient’s condition [26]. The percentage of LDH or lactate dehydrogenase, which is an enzyme in lactic acid that the body sends to repair damaged tissues, is common in patients with COVID-19 where tissues are damaged, and thus the rates of LDH increases [27]. Sodium is an important mineral for the body and helps regulate the amount of water in and around cells. The level of sodium in the blood is one of the important factors in predicting the probability of ICU admission [28]. Hyponatremia is a condition that occurs when the level of sodium in the blood is lower than normal. Two factors, 1) underlying medical condition and 2) drinking a lot of water, may cause sodium to decrease in the body. When this happens, the level of water in the body rises, and its cells begin to swell, which can cause many health problems, ranging from mild to life-threatening. Thus, the excessive or severe decrease in the level of sodium in the blood is one of the important predictive factors in determining the need for ICU admission to treat hyponatremia and solve underlying causes. Also, D-DIMER is considered an important factor that contributes to suspicion of pulmonary embolism as a complication of coagulopathy in COVID-19 patients. It is among the treatment of COVID-19 protocols in most countries [29], when it is elevated to some extent and degrees, an anticoagulant is recommended. In our study, the p-value of D-DIMER is not significant and that may be because the patients in the dataset do not develop any degree of pulmonary embolism and they recover rapidly.
The limitations that need to be acknowledged in this research are: First, the dataset of Hospital Sírio-Libanês, São Paulo, and Brasilia published on Kaggle hides some attributes that may have a great influence on results such as comorbidities diseases (Disease Grouping Features) used in model building. Having these features can enhance the model analysis and explanation. Second, some of the important lab tests, such as the ferritin test and the C-reactive protein test, are not among the features of the dataset.
In this article, we developed a model to predict ICU admission, which is considered a hard task since several features derived from critical care and medical measures have an impact on the outcome. We used the data organized in a window-based approach by Sírio-Libanês hospital depending on the patients’ period of stay in the hospital. This period was divided into five windows, and each window had a duration of 2 h. We assumed that the data collected in the first four windows impact the prediction of ICU admission. We implemented the experiment in four stages, where only the features of Window 1 were used in the first stage, and then we incrementally added the features of Windows 2–4 in the second, third, and fourth stages, respectively. Our dataset was divided into development and test sets, and we utilized the development set for building our model based on XGBoost with the early stopping mechanism. We split 80% of the development set for training and 20% for validation to avoid over-fitting. Finally, we evaluated our model on the test set. The feature selection process is applied using the training set, where we rank the features according to their importance, and then the most important features were selected based on their obtained performance. The results confirmed our hypothesis as the clinical data recorded in the first four windows can predict ICU admission with high performance, where the achieved accuracy, recalls, precisions, and F1 score are 0.97, 0.96, 0.97, and 0.95, respectively.
Acknowledgement: The authors extend their appreciation to the Deanship of Scientific Research at Jouf University for funding this work through Research Grant No. (CV-33-41).
Funding Statement: This work is supported by the Deanship of Scientific Research at Jouf University under Grant No. (CV-33-41).
Conflicts of Interest: The authors declare that they have no conflicts of interest to report regarding the present study.
1. D. Das, K. C. Santosh and U. Pal, “Truncated inception net: COVID-19 outbreak screening using chest X-rays,” Physical and Engineering Sciences in Medicine, vol. 43, no. 3, pp. 915–925, 2020. [Google Scholar]
2. W. H. Organization, Weekly operational update on COVID-19 report, 2020. [Online]. Available: https://www.who.int/publications/m/item/weekly-update-on-covid-19---25-september. [Google Scholar]
3. J. Solis, C. Franco-Paredes, A. F. Henao-Martínez, M. Krsak and S. M. Zimmer, “Structural vulnerability in the us revealed in three waves of covid-19,” The American Journal of Tropical Medicine and Hygiene, vol. 103, no. 1, pp. 25–27, 2020. [Google Scholar]
4. CDC, Interim clinical guidance for management of patients with confirmed coronavirus disease (COVID-192020. [Online]. Available: https://stacks.cdc.gov/view/cdc/89980. [Google Scholar]
5. W. C. Koff and M. A. Williams, “Covid-19 and immunity in aging populations—A new research agenda,” New England Journal of Medicine, vol. 383, no. 9, pp. 804–805, 2020. [Google Scholar]
6. S. A. Angelo, E. F. Arruda, R. Goldwasser, M. S. C. Lobo, A. Salles et al., “Demand forecast and optimal planning of intensive care unit (ICU) capacity,” Pesquisa Operacional Journal, vol. 37, no. 2, pp. 229–245, 2017. [Google Scholar]
7. D. C. Angus, M. A. Kelley, R. J. Schmitz, A. White and J. Popovich, “Current and projected workforce requirements for care of the critically ill and patients with pulmonary disease: Can we meet the requirements of an aging population?,” JAMA Journal, vol. 284, no. 21, pp. 2762–2770, 2000. [Google Scholar]
8. J. A. Ramirez, T. L. Wiemken, P. Peyrani, F. W. Arnold, R. Kelley et al., “Adults hospitalized with pneumonia in the united states: Incidence, epidemiology, and mortality,” Clinical Infectious Diseases Journal, vol. 65, no. 11, pp. 1806–1812, 2017. [Google Scholar]
9. F. T.M. Jr and T. J. Marrie, “Burden of community-acquired pneumonia in north american adults,” Postgraduate Medicine, vol. 122, no. 2, pp. 130–141, 2010. [Google Scholar]
10. T. Wiemken, R. Kelley and J. Ramirez, “Clinical scoring tools: Which is best to predict clinical response and long-term outcomes?,” Infectious Disease Clinics, vol. 27, no. 1, pp. 33–48, 2013. [Google Scholar]
11. J. D. Chalmers, P. Mandal, A. Singanayagam, A. R. Akram, G. Choudhury et al., “Severity assessment tools to guide ICU admission in community-acquired pneumonia: Systematic review and meta-analysis,” Intensive Care Medicine, vol. 37, no. 9, pp. 1409–1420, 2011. [Google Scholar]
12. P. G. Charles, R. Wolfe, M. Whitby, M. J. Fine, A. J. Fuller et al., “SMART-COP: A tool for predicting the need for intensive respiratory or vasopressor support in community-acquired pneumonia,” Clinical Infectious Diseases, vol. 47, no. 3, pp. 375–384, 2008. [Google Scholar]
13. O. Leroy, C. Santre, C. Beuscart, H. Georges, B. Guery et al., “A five-year study of severe community-acquired pneumonia with emphasis on prognosis in patients admitted to an intensive care unit,” Intensive Care Medicine, vol. 21, no. 1, pp. 24–31, 1995. [Google Scholar]
14. M. I. Restrepo, E. M. Mortensen, J. Rello, J. Brody and A. Anzueto, “Late admission to the ICU in patients with community-acquired pneumonia is associated with higher mortality,” Chest Journal, vol. 137, no. 3, pp. 552–557, 2010. [Google Scholar]
15. J. D. Chalmers, J. K. Taylor, P. Mandal, G. Choudhury, A. Singanayagam et al., “Validation of the infectious diseases society of america/american thoratic society minor criteria for intensive care unit admission in community-acquired pneumonia patients without major criteria or contraindications to intensive care unit care,” Clinical Infectious Diseases, vol. 53, no. 6, pp. 503–511, 2011. [Google Scholar]
16. P. Kontou, J. L. Kuti and D. P. Nicolau, “Validation of the infectious diseases society of america/american thoracic society criteria to predict severe community-acquired pneumonia caused by streptococcus pneumoniae,” The American Journal of Emergency Medicine, vol. 27, no. 8, pp. 968–974, 2009. [Google Scholar]
17. J. Phua, K. C. See, Y. H. Chan, L. S. Widjaja, N. W. Aung et al., “Validation and clinical implications of the IDSA/ATS minor criteria for severe community acquired pneumonia,” Thorax, vol. 64, no. 7, pp. 598–603, 2009. [Google Scholar]
18. X. Yap, C. Ng, K. Hsu, C. Chien, Z. N. L. Goh et al., “Predicting need for intensive care unit admission in adult emphysematous pyelonephritis patients at emergency departments: Comparison of five scoring systems,” Scientific Reports, vol. 9, no. 1, pp. 1–7, 2019. [Google Scholar]
19. S. M. Abd El-Salam, M. M. Ezz, S. Hashem, W. Elakel, R. Salama et al., “Performance of machine learning approaches on prediction of esophageal varices for Egyptian chronic hepatitis C patients,” Informatics in Medicine Unlocked, vol. 17, pp. 100267, 2019. [Google Scholar]
20. J. H. Friedman, “Greedy function approximation: A gradient boosting machine,” Annals of statistics, vol. 29, no. 5, pp. 1189–1232, 2001. [Google Scholar]
21. T. Chen and C. Guestrin, “Xgboost: A scalable tree boosting system,” in The 22nd ACM SIGKDD Int. Conf. 2016, San Francisco, California, USA, pp. 785–794, 2016. [Google Scholar]
22. I. Unal, “Defining an optimal cut-point value in roc analysis: An alternative approach,” Computational and Mathematical Methods in Medicine, vol. 2017, no. 4, pp. 1–14, 2017. [Google Scholar]
23. C. Huang, Y. Wang, X. Li, L. Ren, J. Zhao et al., “Clinical features of patients infected with 2019 novel coronavirus in Wuhan, China,” The Lancet, vol. 395, no. 10223, pp. 497–506, 2020. [Google Scholar]
24. D. Wang, B. Hu, C. Hu, F. Zhu, X. Liu et al., “Clinical characteristics of 138 hospitalized patients with 2019 novel coronavirus–infected pneumonia in Wuhan, China,” JAMA Journal, vol. 323, no. 11, pp. 1061–1069, 2020. [Google Scholar]
25. H. Hou, B. Zhang, H. Huang, Y. Luo, S. Wu et al., “Using IL-2R/lymphocyte for predicting the clinical progression of patients with covid-19,” Clinical & Experimental Immunology, vol. 201, no. 1, pp. 76–84, 2020. [Google Scholar]
26. N. Martini, C. Piccinni, A. Pedrini and A. Maggioni, “Covid-19 and chronic diseases: Current knowledge, future steps and the MaCroScopio project,” Recenti Prog. Med., vol. 111, no. 4, pp. 198–201, 2020. [Google Scholar]
27. C. Chen, C. Lee, C. Liu, J. Wang, L. Wang et al., “Clinical features and outcomes of severe acute respiratory syndrome and predictive factors for acute respiratory distress syndrome,” Journal of the Chinese Medical Association, vol. 68, no. 1, pp. 4–10, 2005. [Google Scholar]
28. G. Lippi, A. M. South and B. M. Henry, “Electrolyte imbalances in patients with severe coronavirus disease 2019 (covid19),” Annals of Clinical Biochemistry, vol. 57, no. 3, pp. 262–265, 2020. [Google Scholar]
29. Y. Yao, J. Cao, Q. Wang, Q. Shi, K. Liu et al., “D-dimer as a biomarker for disease severity and mortality in covid-19 patients: A case control study,” Journal of Intensive Care, vol. 8, no. 1, pp. 1–11, 2020. [Google Scholar]
 | This work is licensed under a Creative Commons Attribution 4.0 International License, which permits unrestricted use, distribution, and reproduction in any medium, provided the original work is properly cited. |