DOI:10.32604/cmc.2021.017779
| Computers, Materials & Continua DOI:10.32604/cmc.2021.017779 | |
| Article |
Risk Prediction of Aortic Dissection Operation Based on Boosting Trees
1The Second Xiangya Hospital of Central South University, Changsha, 410011, Hunan, China
2Central South University of Forestry & Technology, Changsha, 410004, Hunan, China
3Northeastern State University, Tahlequah, 74464, OK, USA
*Corresponding Author: Hao Tang. Email: dr.tanghao@csu.edu.cn
Received: 10 February 2021; Accepted: 11 May 2021
Abstract: During the COVID-19 pandemic, the treatment of aortic dissection has faced additional challenges. The necessary medical resources are in serious shortage, and the preoperative waiting time has been significantly prolonged due to the requirement to test for COVID-19 infection. In this work, we focus on the risk prediction of aortic dissection surgery under the influence of the COVID-19 pandemic. A general scheme of medical data processing is proposed, which includes five modules, namely problem definition, data preprocessing, data mining, result analysis, and knowledge application. Based on effective data preprocessing, feature analysis and boosting trees, our proposed fusion decision model can obtain 100% accuracy for early postoperative mortality prediction, which outperforms machine learning methods based on a single model such as LightGBM, XGBoost, and CatBoost. The results reveal the critical factors related to the postoperative mortality of aortic dissection, which can provide a theoretical basis for the formulation of clinical operation plans and help to effectively avoid risks in advance.
Keywords: Risk prediction; aortic dissection; COVID-19; postoperative mortality; boosting tree
With the rapid development of information technology, huge amounts of medical data have been generated and preserved, which have various sources, diverse types, and potential information. It is difficult to use the traditional data analysis methods to process them. The algorithms and models based on machine learning are needed to mine valuable information.
Most medical data are obtained in the process of the diagnosis and treatment of patients, including the records of talking with patients, physical parameters, laboratory results and medical device inspection results. In general, the four main characteristics of medical data are as follows:
1) Polymorphism: There are multiple forms of medical data, including numerical data, text and images. The data obtained from the physical examination of patients are usually numerical, computed tomography (CT) and ultrasonography generate images, and in diagnostic records, there is mainly text. In order to process polymorphic data, we need to consider the different characteristics and adopt corresponding methods. For example, the statistical characteristics and topics are usually considered for text processing [1–3].
2) Timeliness: Most medical data come from the records of medical activities at a certain time, which may change over time. For example, the results of electrocardiogram and tomography are typically relative to time. The changes of patients’ vital signs and laboratory results have an important impact on diagnosis.
3) Incompleteness: It is impossible to completely record all the physical conditions of the examinees. In addition, the differences of subjective judgment, improper operation and other factors may also cause incompleteness [4].
4) High dimensionality: Due to the complexity of inspection items and medical information, medical data generally have high dimensionality. For example, routine blood and urine examinations usually include dozens of examination sub-items, which will produce multiple attribute dimensions.
Therefore, the specific characteristics of medical data make the mining procedure different from other data mining. The goal is to find the important factors that can improve diagnosis accuracy and inform disease treatment, potentially leading to a better prognosis. In recent years, researchers have carried out some studies in this field and made numerous improvements. Tayefi et al. [5] established a coronary heart disease prediction model based on a decision tree and found that serum hs-CRP was strongly associated with coronary heart disease. Gu et al. [6] proposed a method based on GeoDetector and long short-term memory neural network to predict hand-foot-mouth disease with good performance. Ricciardi et al. [7] tested several data mining and machine learning tools, including random forests and gradient boosting trees, on a dataset consisting of patients with suspected or known coronary artery disease, and the tools showed high accuracy. With the rapid development of machine learning, methods based on deep learning have been widely used in image clustering and target recognition [8,9]. Convolutional neural networks have been widely used in the field of medical image processing, and have surpassed traditional methods in terms of accuracy [10]. An aortic dissection detection method based on morphology and deep learning was proposed by Tan et al. [11] and achieved good performance.
Since the beginning of 2020, with the spread of COVID-19 across the world, the use of medical data analysis and mining to assist with diagnosis, prognosis and other medical predictions has become more prominent. Ayyoubzadeh et al. [12] predicted COVID-19 incidence based on linear regression and a long short-term memory (LSTM) model, which used data from the Google Trend website. Keshavarzi [13] used decision trees, random forests, logistic model trees and naive Bayes classifiers to model the development of COVID-19, from which evidence of geographical signals was found. Jibril et al. [14] proposed an algorithm to predict the recovery possibility of COVID-19 patients. The data mining of prescription records could help to protect infected individuals from severe COVID-19 symptoms and identify potential effective drugs [15]. Marhl et al. [16] revealed three diabetic factors related to COVID-19. Through meta-regression and analysis based on decision trees, Toraih et al. [17] revealed that cardiac biomarkers and comorbidities might lead to increased mortality, severity, and cardiac injury among COVID-19 patients, which was expected to improve the identification rate of high-risk patients.
Acute type A aortic dissection is a rare but dangerous disease. The incidence is 5–30 cases per million persons every year. The aortic wall of the human body needs to bear the pressure of arterial blood and the impact of blood flow. In patients with aortic dissection, the quality of the aortic wall is decreased. Under the pressure of blood flow, the vascular wall is torn into two layers, and the breach spreads rapidly. Once the vessel wall is completely ruptured, massive hemorrhaging occurs, which is fatal. The mortality is as high as 50% in 24 h and 60%–70% in 48 h. Therefore, timely life-saving surgery is usually required. Even after surgical treatment, the mortality is still 10% in 24 h and nearly 20% in one month.
During the outbreak of COVID-19, the treatment of aortic dissection has faced more challenges than usual. One challenge is that medical resources are in serious shortage, which can prevent patients from being treated in time. Another challenge is that the medical staff face the risk of COVID-19 infection. Hence, traditional treatments must be implemented differently, such as by increasing the preoperative preparation time to exclude COVID-19 infection or adjusting the operation procedure for aortic dissection patients with COVID-19 infection. Therefore, a scientific and effective method is required to predict the surgery risk, which can help to guide the surgical process. However, the traditional statistical methods are still widely used at present, which have deficiencies in accuracy and efficiency [18,19].
In this work, based on data obtained from medical institutions, we focus on the risk prediction of aortic dissection surgery. The main contributions of this paper are as follows. First, we propose a general scheme of medical data processing, which includes five modules: problem definition, data preprocessing, data mining, result analysis and knowledge application. Second, according to the characteristics of medical data, we propose a reasonable data supplement and feature selection method. Finally, we propose a model for risk prediction of aortic dissection surgery. The experimental results show that our proposed model can obtain 100% accuracy to predict the risk of early postoperative death. It also reveals the critical factors related to the postoperative mortality, which can provide an effective basis for the formulation of clinical operation.
Decision tree is a classical machine learning algorithm. Its main idea is to establish a set of trees to judge the decision conditions according to the input characteristics of the training set. Every leaf node only stores one category, whereas non-leaf nodes may contain multiple categories. The decision process divides the samples into small sets according to attribute values. The goal of splitting attributes is to make as many subsets of classification as possible belong to the same category. Therefore, the key problem is how to select the root node and determine the next branch direction. According to the discreteness or continuity of the output variables, decision trees can be divided into classification trees and regression trees.
The steps of decision tree construction are as follows:
Step 1: Set all the data as the root node.
Step 2: According to the rule of feature selection, select an input feature that can reduce data impurity to a branch and generate sub nodes.
Step 3: Judge every child node, and if the preset stop condition is met, continue to Step 4. Otherwise, return to Step 2.
Step 4: Set the node as a leaf node. If the output variable is discrete, the value with the largest proportion is the output result of the node. Otherwise, the average, maximum or median value can be used for output.
A decision tree can be used as the base learner in an ensemble algorithm, and the strong learning model can be generated by a certain combination strategy. “Bagging” and “boosting” are two types of ensemble learning algorithms, which differ in the combination methods of weak learners. The former usually generates strong learners by connecting multiple weak learners in parallel, causing the weak learners to be independent of each other. The latter generates strong learners by connecting multiple weak learners in series, causing the weak learners to be strongly dependent on each other. The base learner is trained on the initial training set. The weights of training samples are adjusted according to the performance of the base learner, so the wrong training samples will receive more attention in the subsequent learners. Then the next learner is trained based on the adjusted samples. The algorithm iterates in this way until the preset conditions are reached, at which time the final result is a strong learner.
XGBoost is a gradient lifting integrated learning method [20] that has the abilities of a tree learning algorithm and a linear model solver. Parallel computing on a single machine improves the speed greatly.
If the model consists of K base trees, then the predicted value of the ith sample can be expressed as follows:
where
where M is the number of samples.
To reduce the complexity of the model, the regular term
In (3),
where Tk is the number of leaves, wk is the score of the ith leaf, and
where
LightGBM is a highly efficient gradient boosting tree [21] that has the characteristics of fast training speed and low memory consumption. Compared with XGBoost, the main improvements of LightGBM are as follows:
1) The strategies of splitting trees are different. XGBoost is based on a level-wise strategy, which splits all nodes in every layer without any difference. Even nodes with very small gain are split, which will bring some unnecessary expense. However, LightGBM uses the leaf-wise strategy, which selects the leaf node with the most current loss reduction to split every time. Therefore, the loss of the overall model can decrease efficiently.
2) The strategies of processing features are different. XGBoost presorts the features, which requires a lot of memory to store the sorted matrices of features. Since the orders of multiple features are generally different, the splitting node of every feature needs to be calculated and compared to determine the best splitting node. However, LightGBM uses a histogram-based algorithm. The splitting is based on the bins of features, which can greatly simplify the process of searching for the best splitting nodes.
3) The strategies of parallel processing are different. Feature parallelism and data parallelism are introduced into LightGBM. Every worker has the complete data of the training set in LightGBM. Therefore, the best partition can be identified locally, and the cost of communication can be significantly reduced. When the amount of data is large and the features are relatively fewer, the data parallelism strategy can be adopted. In addition, LightGBM uses the reduced scatter method to merge the histograms of different workers without crossing. Then it finds the local optimal splitting point and finally synchronizes to the global optimal splitting point.
CatBoost is an improved algorithm under the framework of gradient boosting tree [22]. It can deal with categorical features efficiently and reasonably based on the following improvements:
1) It automatically processes categorical features statistically. After calculating the frequency of a category, super parameters are added to generate some new numerical features.
2) It makes use of the relationship between features and greatly enriches the dimensions of features.
3) It is based on symmetric tree with fewer parameters and optimizes the algorithm of leaf value calculation, which can prevent the model from overfitting.
We construct a general scheme of medical data processing, shown in Fig. 1, which includes five modules as follows:
1) Problem definition: Based on full communication with medical experts of clinical diagnosis and surgical treatment, the problem and requirements will be defined. It is necessary to determine the goal of data mining and the evaluation criteria in this module.
2) Data preprocessing: The data of clinical diagnosis and surgical treatment constitute the raw database, which usually contains fuzzy, incomplete, and redundant information. Therefore, data preprocessing is needed. It will clean the information to ensure the certainty, fill in missing data to ensure the integrity, and convert the data into a suitable form for further mining.
3) Data mining: It mainly includes model construction, model training and model evaluation. The commonly used data mining algorithms include artificial neural network, rough set, decision tree, genetic algorithm, nearest neighbor technology and rule induction. The knowledge, relevance and rules implied in the data are expected to be mined. The rationality of mining results needs to be verified by repeated experiments.
4) Result analysis: For the results discovered by data mining, it is necessary to judge their correctness and comprehensibility. In the medical field, we need to evaluate whether the knowledge mined is reliable and valuable.
5) Knowledge application: It is necessary to make a detailed plan for the implementation and control of the conclusion so that it can be further applied to clinical diagnosis, surgical treatment, and prognosis prediction. At the same time, the algorithms and conclusions will be continuously improved in practice.
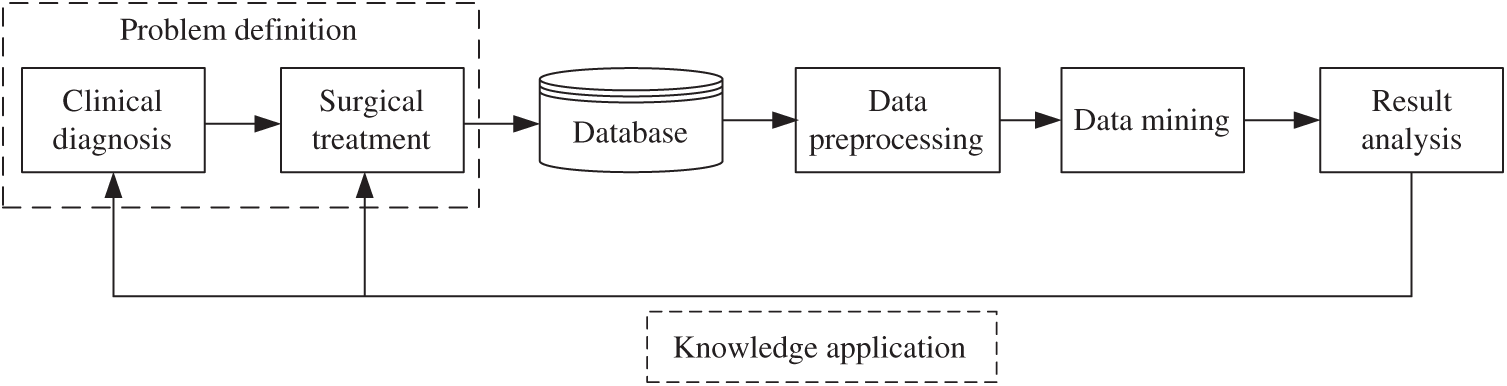
Figure 1: Scheme of medical data processing
Clinical data are usually disorganized, so they need to be preprocessed and converted to meet the quality requirement of data mining. For the unstructured and non-numerical data, we have finished the work of structuring and digitizing the data during our preliminary work.
Missing data is a common problem of medical data. Especially in the early period of insufficient information equipment, or when the diagnoses and treatments involve multiple departments, this problem is even more acute.
According to the distribution of missing values, the data loss can be divided into three types: missing completely at random (MCAR), missing at random (MAR) and missing not at random (MNAR). MCAR means that the missing data are random and do not depend on any other variables. MAR means that the missing data are not completely random and are partially dependent on other complete variables. MNAR means that the missing data depend on the incomplete variables themselves. According to the attributes, the missing values may be single value loss or arbitrary loss. The former means that all the missing values have the same attribute, and the latter means that the missing values have different attributes.
There are two main methods to deal with missing values: deleting the cases with missing values or imputing the missing values. For subjective data, since imputation will affect the authenticity and reliability of data, it is generally recommended to delete the cases with missing values. If the type of missing values is MAR or MANR, the deviation can be reduced by giving different weights to the complete data and incomplete data. During data mining, the database usually has dozens of attributes, so case deletion will lead to many other attribute values being discarded, which is a great waste of information. Therefore, the idea of imputation with possible values is produced.
For continuous variables, such as time, mean value imputation is frequently used. In our dataset, the waiting time before operation (WTBO) is a time variable. The value of WTBO depends on the complexity of the admission process and preoperative preparation as well the adequacy of medical resources. Therefore, we can fill the missing value with the average of the remaining data in the same period by
where
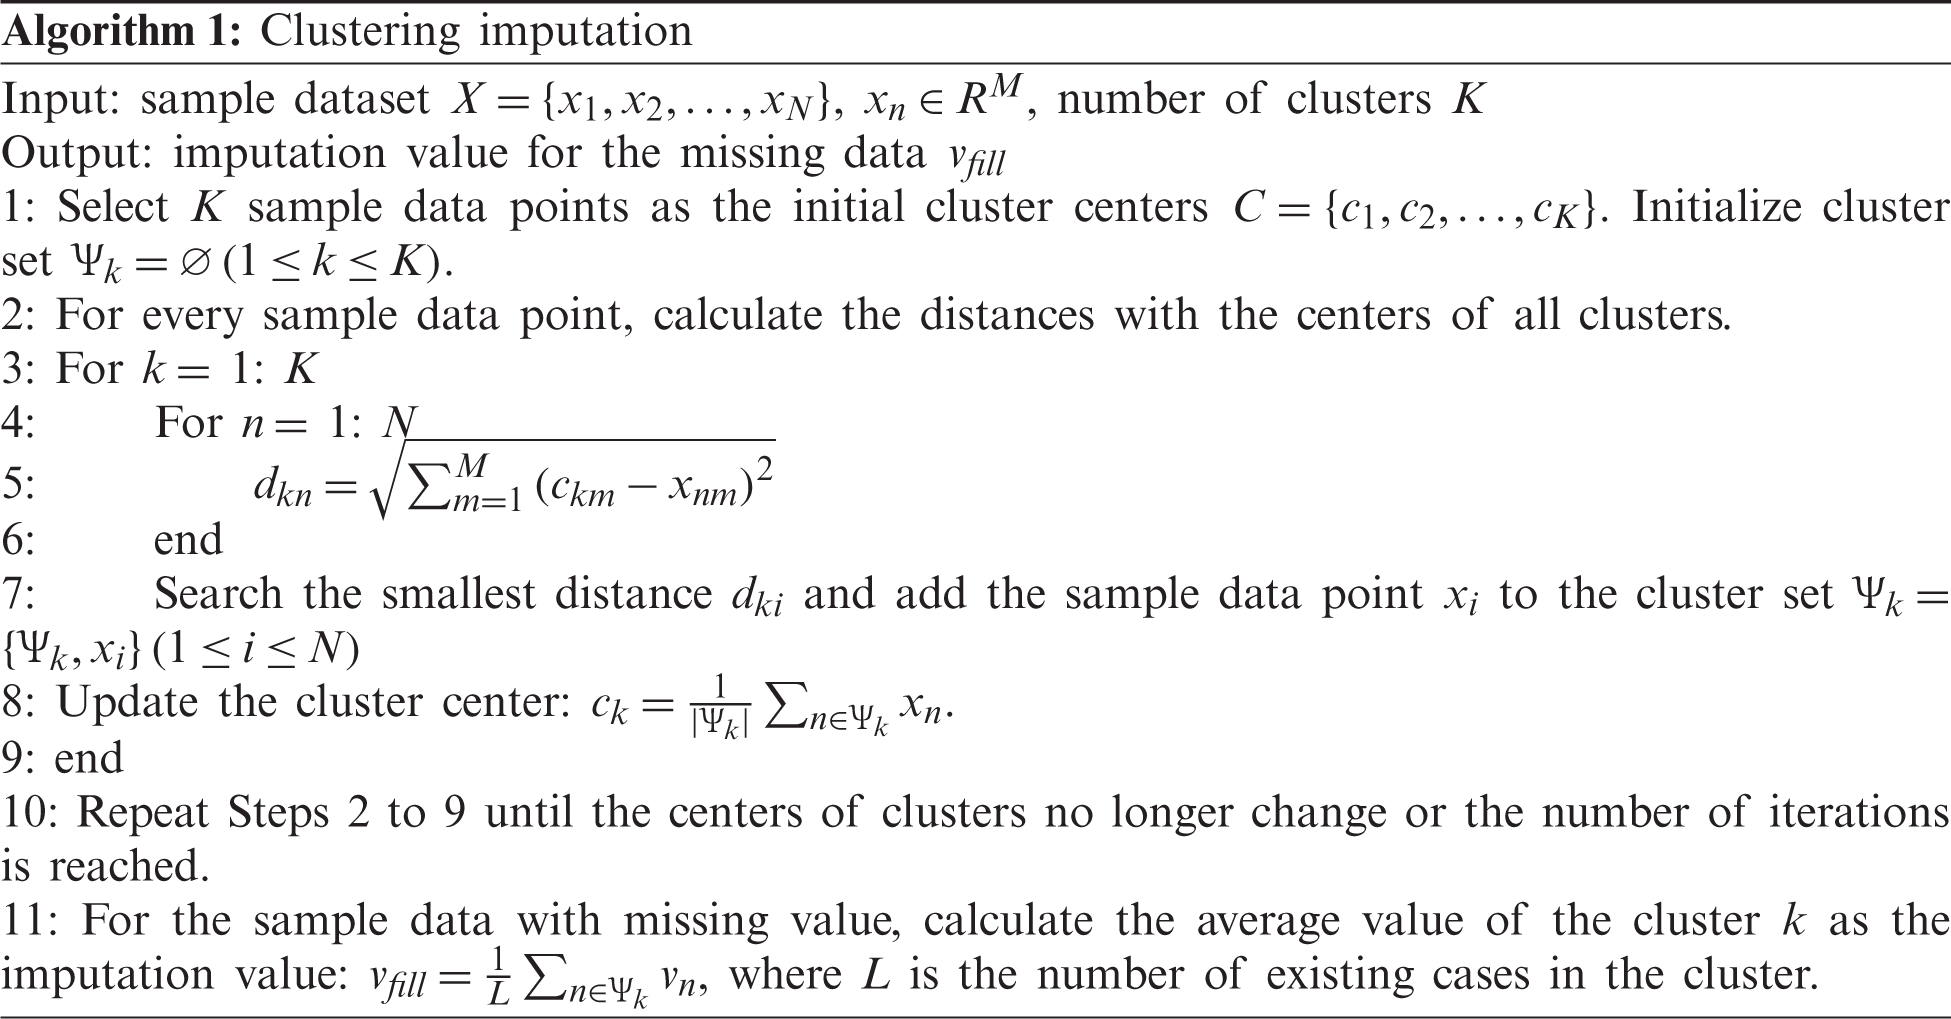
For discontinuous variables without a limited range, such as the units of platelet transfusion and the units of red blood cell transfusion, it is not reasonable to fill them with the average of all samples. Instead, the missing values can be filled based on the clustering imputation algorithm. First, the cases will be clustered. Then the average value of clusters will be calculated and used to fill the corresponding missing data. The specific steps are described in Algorithm 1.
Feature engineering is the first step of data mining, which aims to extract good features from the original data. Statistically, it is demonstrated that there should be an optimal number of features when performing a machine learning task. If more features than necessary are added, the performance of model will be degraded because of the added noise. Therefore, we need to determine which features are the best, which depends on the size of the provided dataset and the complexity of the task. We can obtain benefits by feature engineering based on the following aspects:
1) Too many features may cause dimensional disasters and excessive complexity of the model. Fewer redundant features mean fewer opportunities to make decisions based on noises. Thus, it will reduce the overfitting risk of the model.
2) Irrelevant and redundant features may mislead model training. By reducing misleading data, the accuracy and quality of the model can be improved.
3) The complexity of the algorithm will be reduced if less data are involved. The training speed will also be accelerated.
4) By feature analysis and selection, the interpretability of model can be increased and the data visualization can be improved.
The process of feature engineering in our method is shown in Fig. 2. First, the data values are analyzed. If there is one unique value for one feature, it indicates that the feature does not contribute to the prediction and can be deleted. Second, the correlations between features are analyzed to further eliminate redundant features. Finally, the importance of each feature is calculated, and the important features are selected for prediction.

Figure 2: Process of feature engineering
Medical data often contain a variety of attributes, some of which are associated with others. Data correlation describes the relationship between multiple variables and attributes in a dataset. For example, one attribute may depend on another attribute, or it may influence another attribute. The correlation characteristics can help to predict one attribute from another attribute. Therefore, correlation analysis is a fundamental procedure for modeling.
Generally, there are three types of feature correlation:
1) Positive correlation: One feature increases with the increase of another feature. These two features are synchronous, and there is a relationship between them.
2) Negative correlation: One feature increases when another feature decreases, and vice versa. There is a negative effect between these two features.
3) No correlation: There is no relationship between the features, which means that the variation of one feature will not affect the other features.
The correlation coefficient of features X and Y can be obtained by
where M is the dimension of features. The range of r is [−1, 1]. Based on the analysis of feature correlation, the features are selected. If the correlation coefficient is close to 1, it indicates that there is a clear linear relationship between the two variables. For the features with high correlation, the redundant features can be discarded.
Feature importance represents the usefulness or value of every feature in building a decision tree. If an attribute is used for a key decision, its importance is relatively high. The importance of a feature is usually assessed in three ways:
1) Gain: Gain indicates the relative contribution of the feature in the model. A higher value of this metric means the feature is more important for prediction than other features.
2) Cover: Cover refers to the relative number of observations associated with the feature.
3) Frequency: Frequency is the percentage of instances in which this feature occurs in the model tree.
Gain is the most important attribute related to feature importance. For the objective function represented by Eq. (5), the gain can be evaluated by
where
Our prediction is implemented by fusion decision based on boosting trees, which include LightGBM, XGBoost, and CatBoost, as shown in Fig. 3. Assuming the output of boosting trees is
where N is the number of base models. The final prediction labels are judged according to the fusion results by
where i is the ID number of the predicted case, and threshold is the judge condition.
4 Experimental Results and Analysis
Intel (R) Core i7-6500X CPU@2.5 GHz is used for the experiments. The algorithm is simulated by PyCharm 2018.1.5.
Our dataset includes 206 cases of patients with acute type A aortic dissection who underwent total arch replacement and frozen elephant trunk treatment by a single surgeon in the Second Xiangya Hospital of Central South University. Among them, 195 cases were from 2014 through 2018, and 11 cases were from Jan. through Mar. 2020 during the COVID-19 epidemic in China. We train the model based on the previous clinical data and identify the key factors related to postoperative 30-day mortality. Then the risk of postoperative 30-day mortality is predicted.
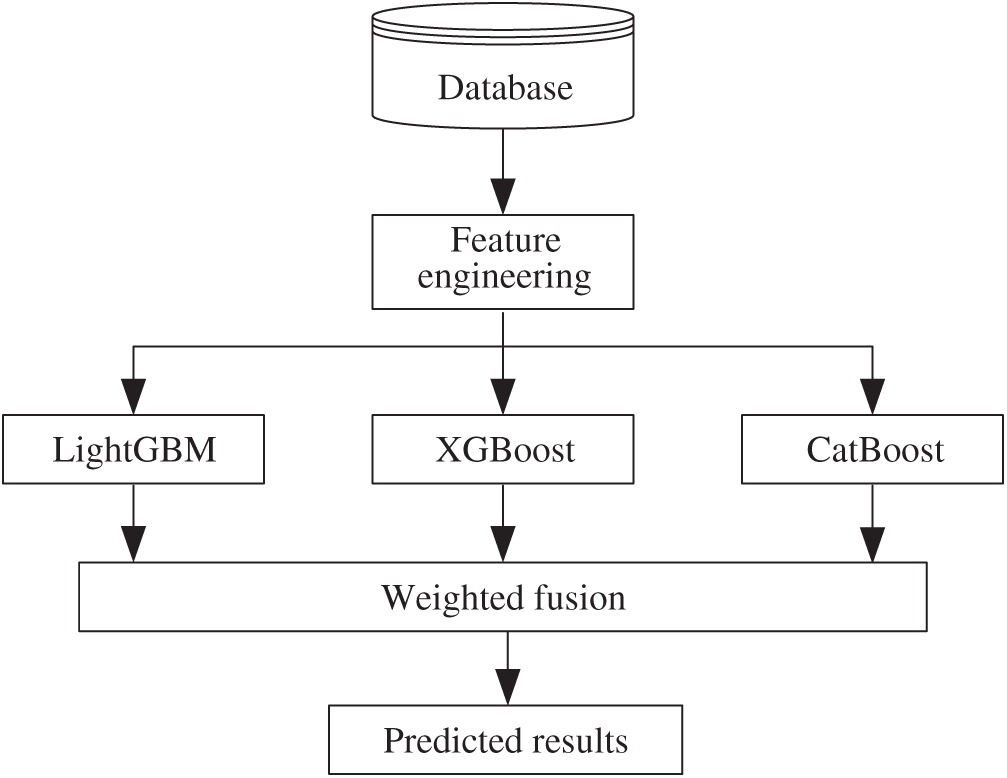
Figure 3: Process of fusion decision
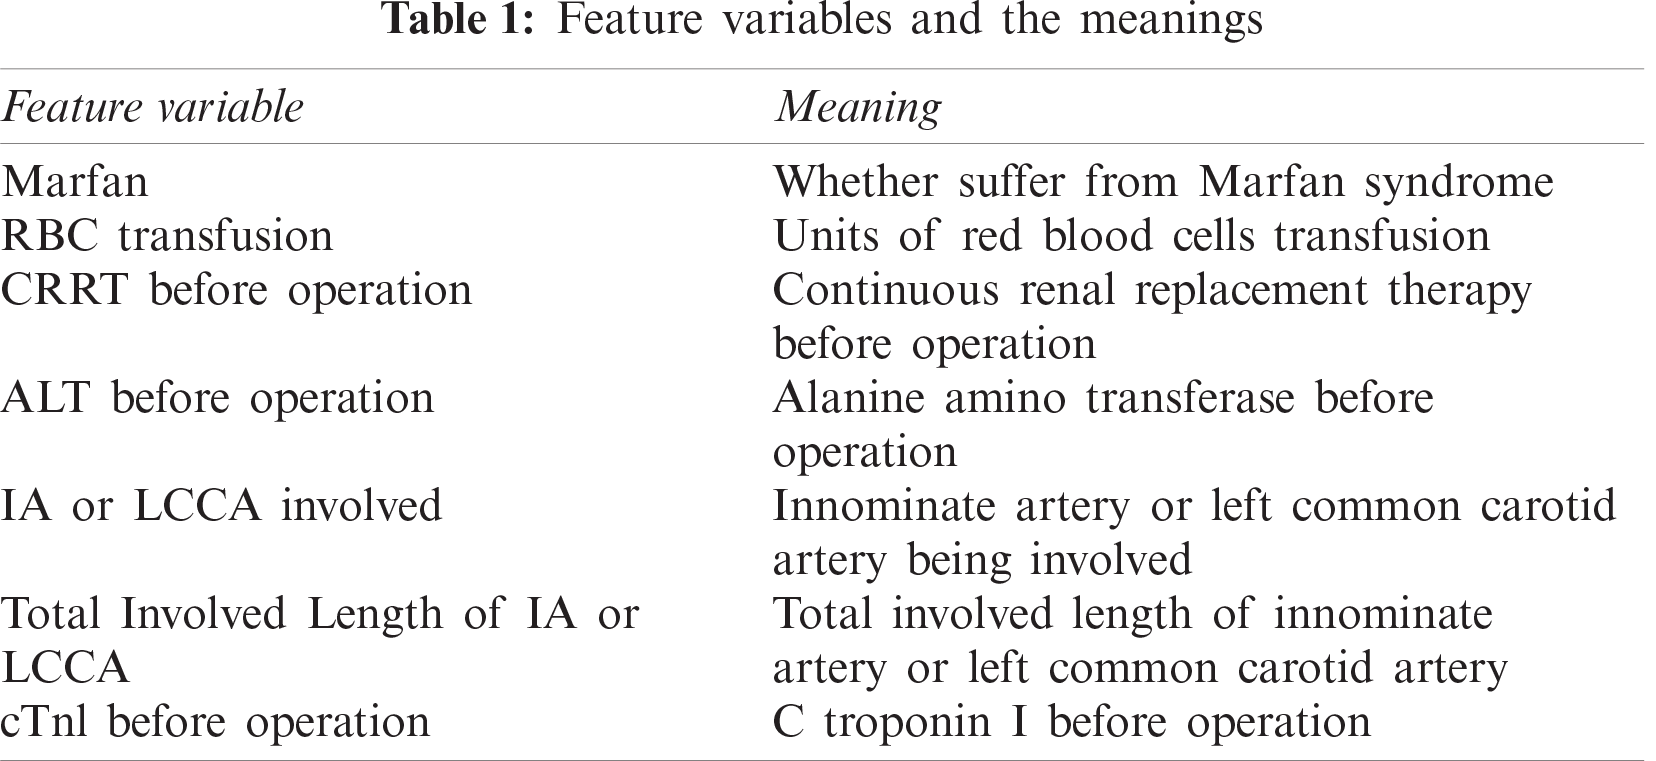
For convenience and simplification, some feature variables use abbreviations, and their meanings are listed in Tab. 1.
From unique value analysis, we find one feature with a single value. This feature is removed since it does not contribute to the model. The histogram of unique values is shown in Fig. 4.
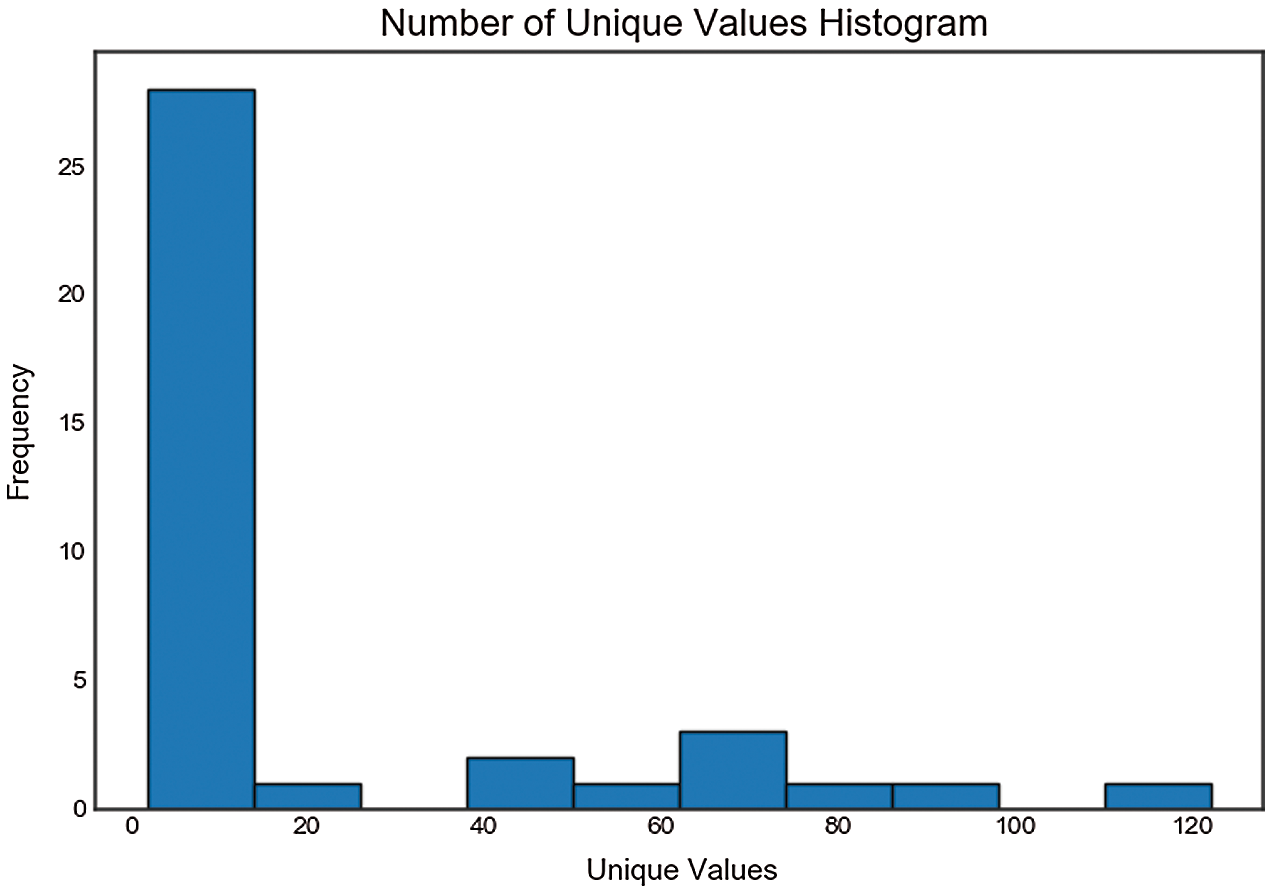
Figure 4: Unique value analysis
4.2 Feature Correlation Analysis
The correlation matrix, shown in Fig. 5, is constructed by correlation coefficients, which represent the correlations between pairs of features. Different colors represent different correlation values, which can be used as a basis for subsequent feature selection. As can be seen from Fig. 5, the correlations between the selected features are not high, which benefits the effective data cleaning in the data preprocessing stage.
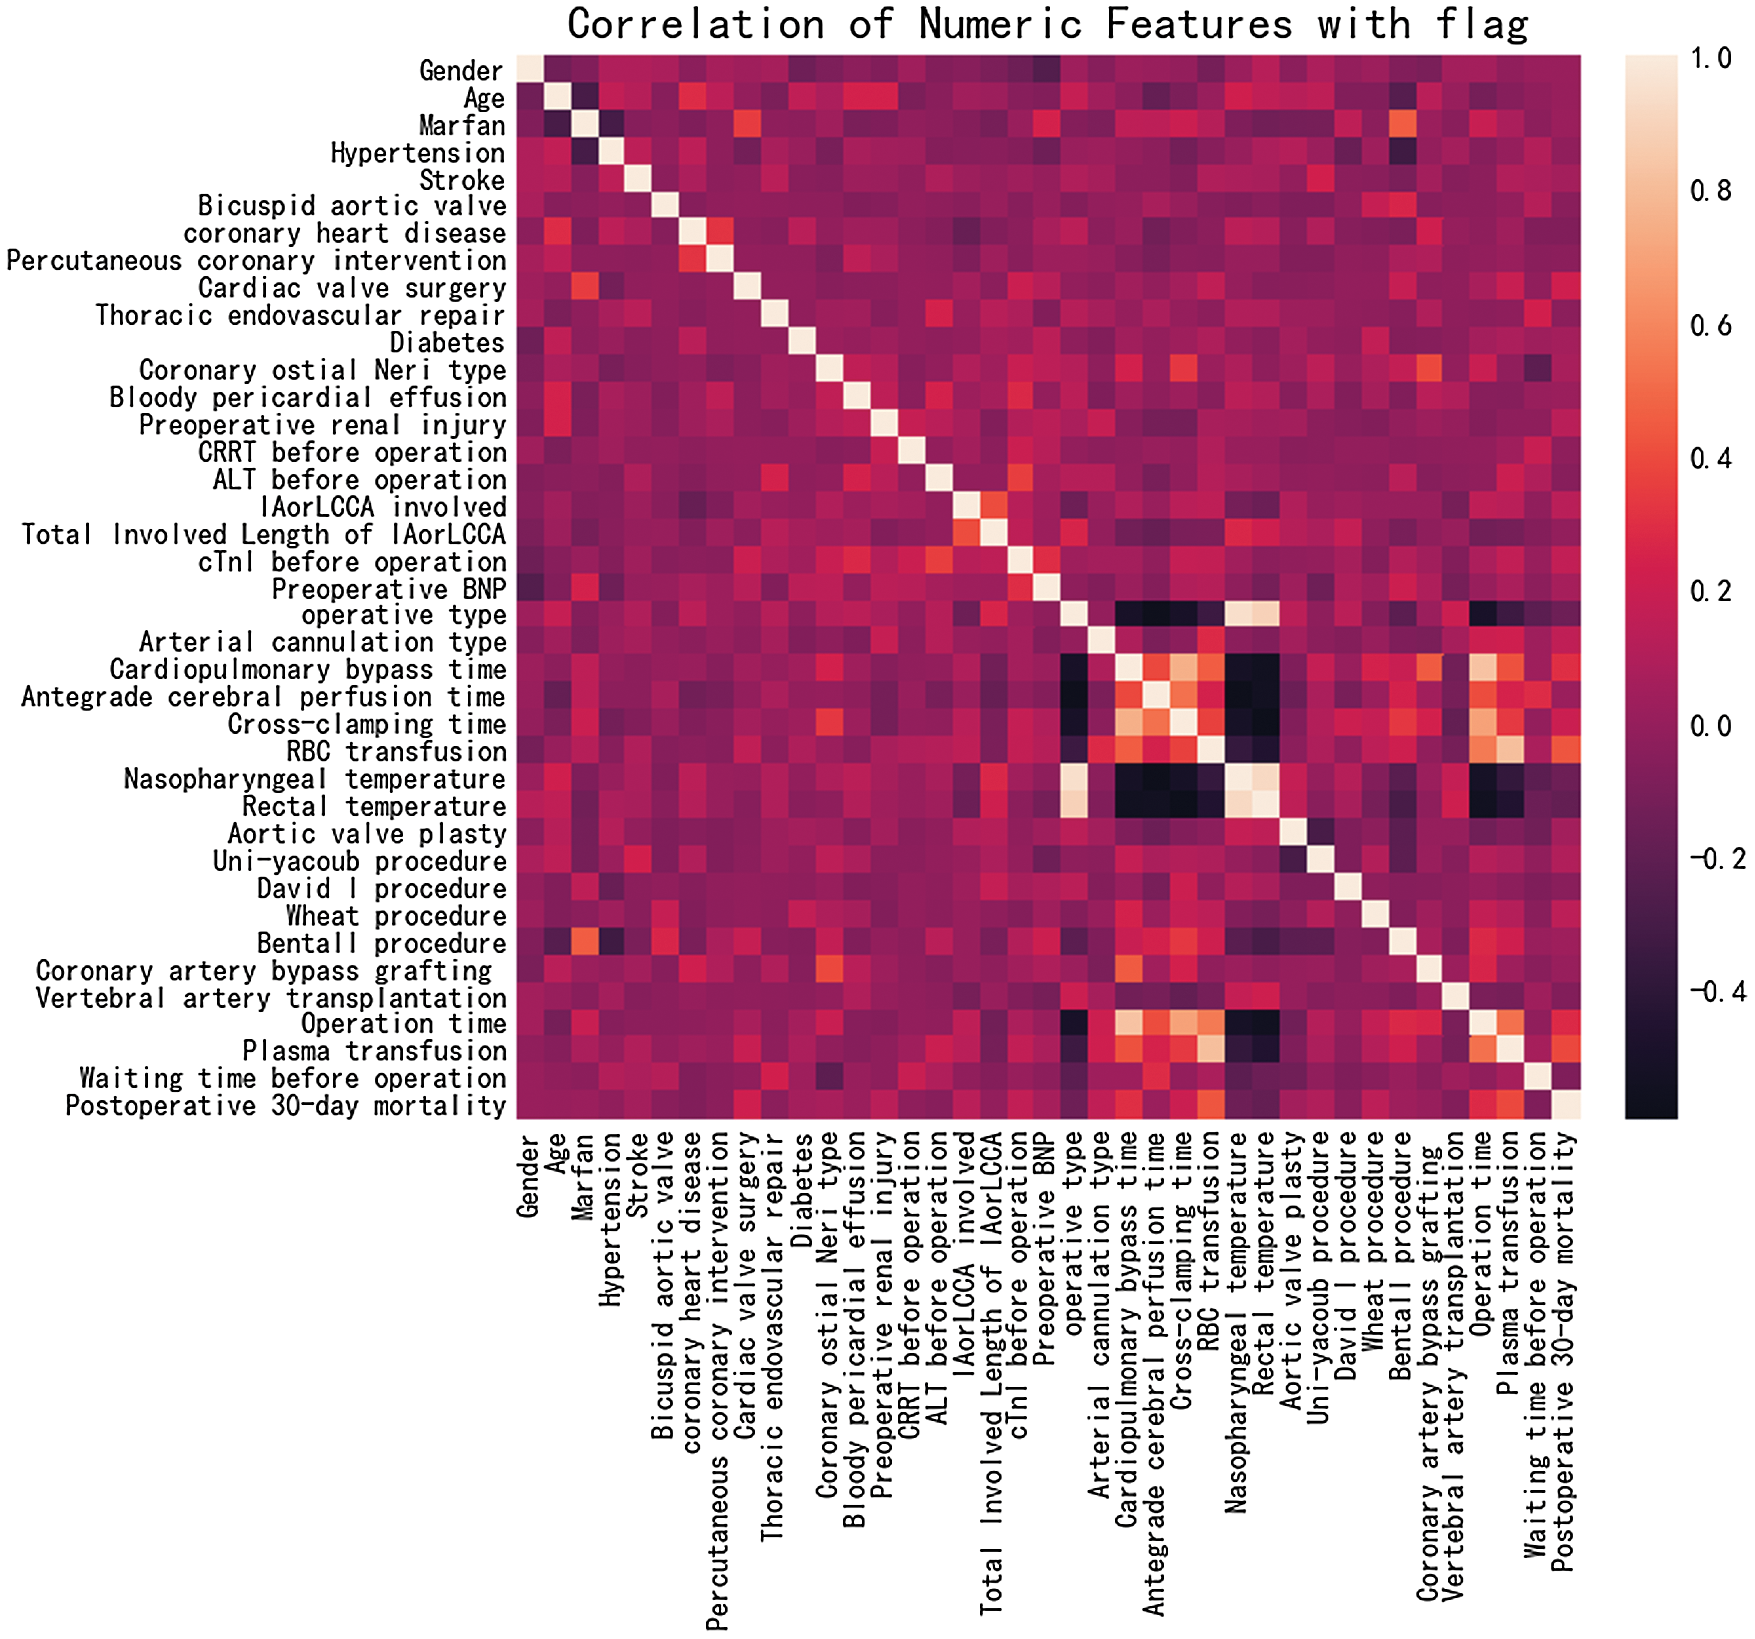
Figure 5: Feature correlation analysis
From Fig. 6, it can be seen that more than 10 features have a positive correlation with postoperative 30-day mortality, including RBC transfusion, plasma transfusion and cardiopulmonary bypass time. The risk of early death increases with the growth of these positively correlated features. As shown in Fig. 7, other features have a negative correlation with postoperative 30-day mortality, including rectal temperature, nasopharyngeal temperature, and operative type. The risk of early death decreases with the growth of these negatively correlated features, which provides an effective theoretical basis for the formulation of clinical operation plans.
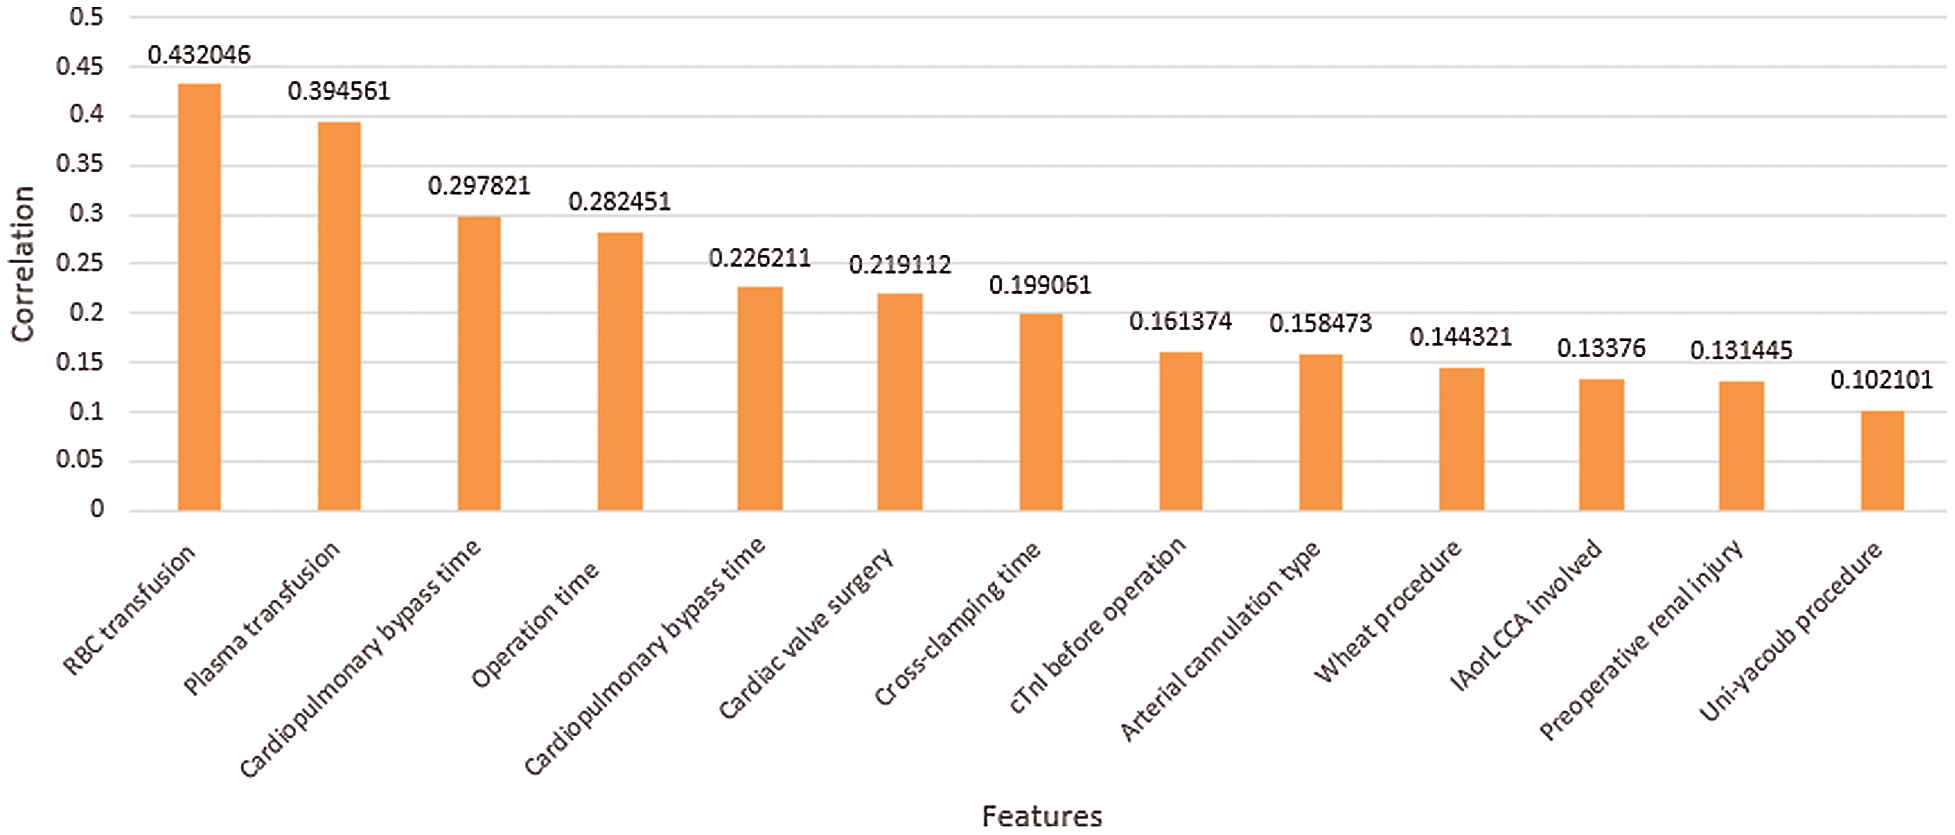
Figure 6: Positive correlation with postoperative 30-day mortality
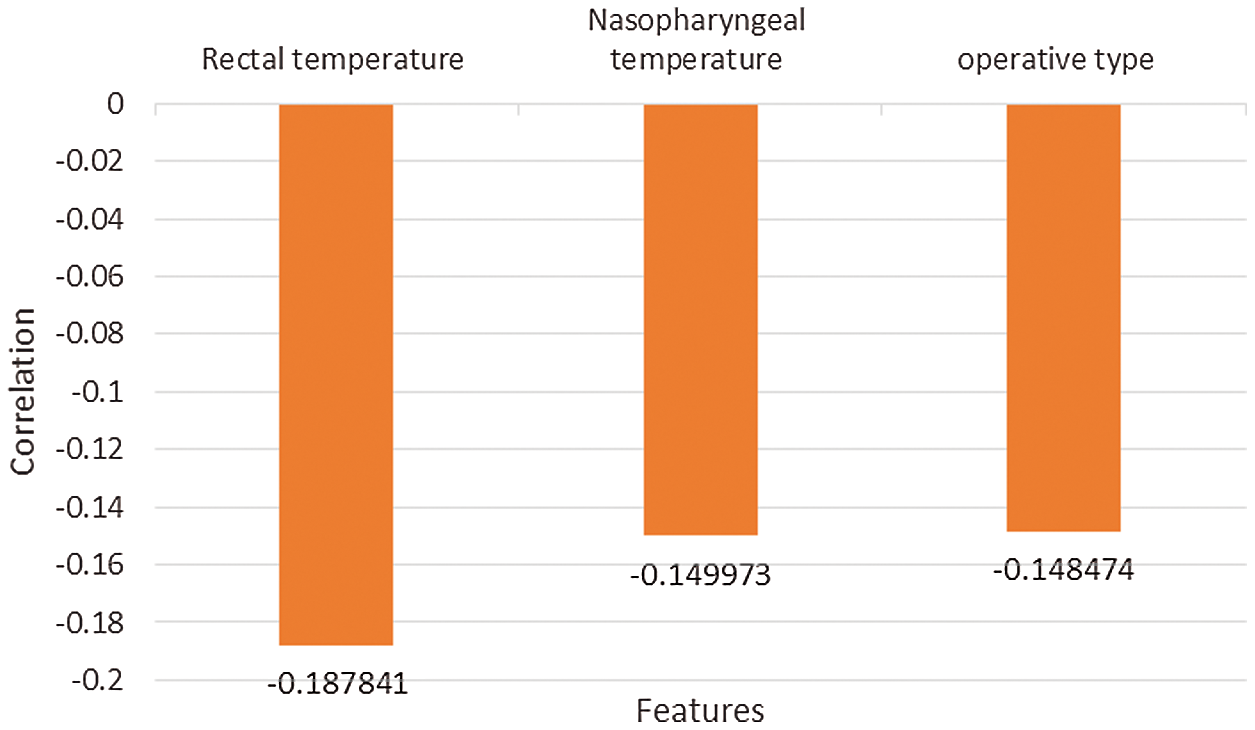
Figure 7: Negative correlation with postoperative 30-day mortality
4.3 Feature Importance Analysis
The feature importance analysis is performed for feature selection. The 10 features with the highest contributions to early postoperative death are shown in Fig. 8 in order of importance. RBC transfusion, cardiopulmonary bypass time and rectal temperature are the three most important factors that affect early mortality, which is consistent with our clinical experience and provides an effective basis for surgeons to develop the operation strategy. During the worldwide COVID-19 pandemic, the waiting time before operation is the factor that has been most directly affected. From Fig. 8, we can conclude that the COVID-19 pandemic has increased the health risks to aortic dissection patients.
The cumulative feature importance is shown in Fig. 9. With the increment of feature number, the cumulative importance also increases. A total of 13 features are required to achieve the cumulative importance of 0.99, which should be used for later prediction. Additionally, 25 features have no contribution and are excluded from prediction.
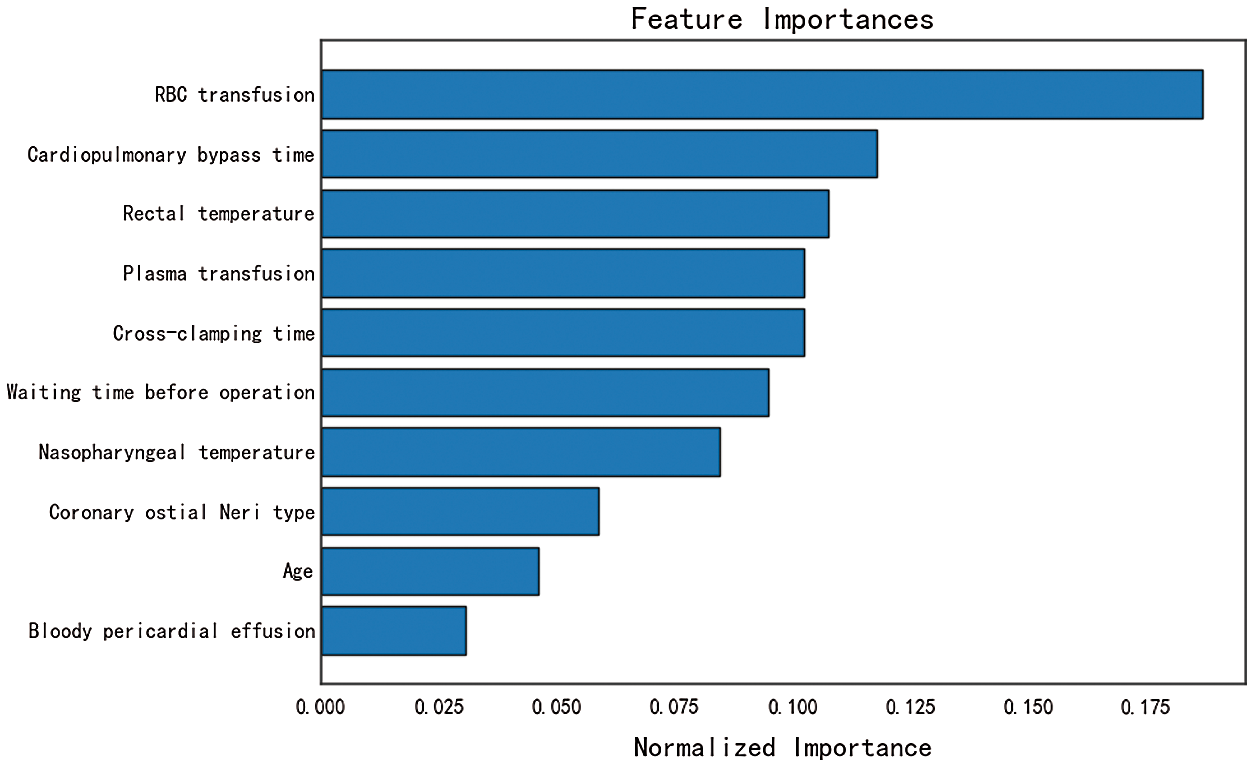
Figure 8: Feature importance analysis
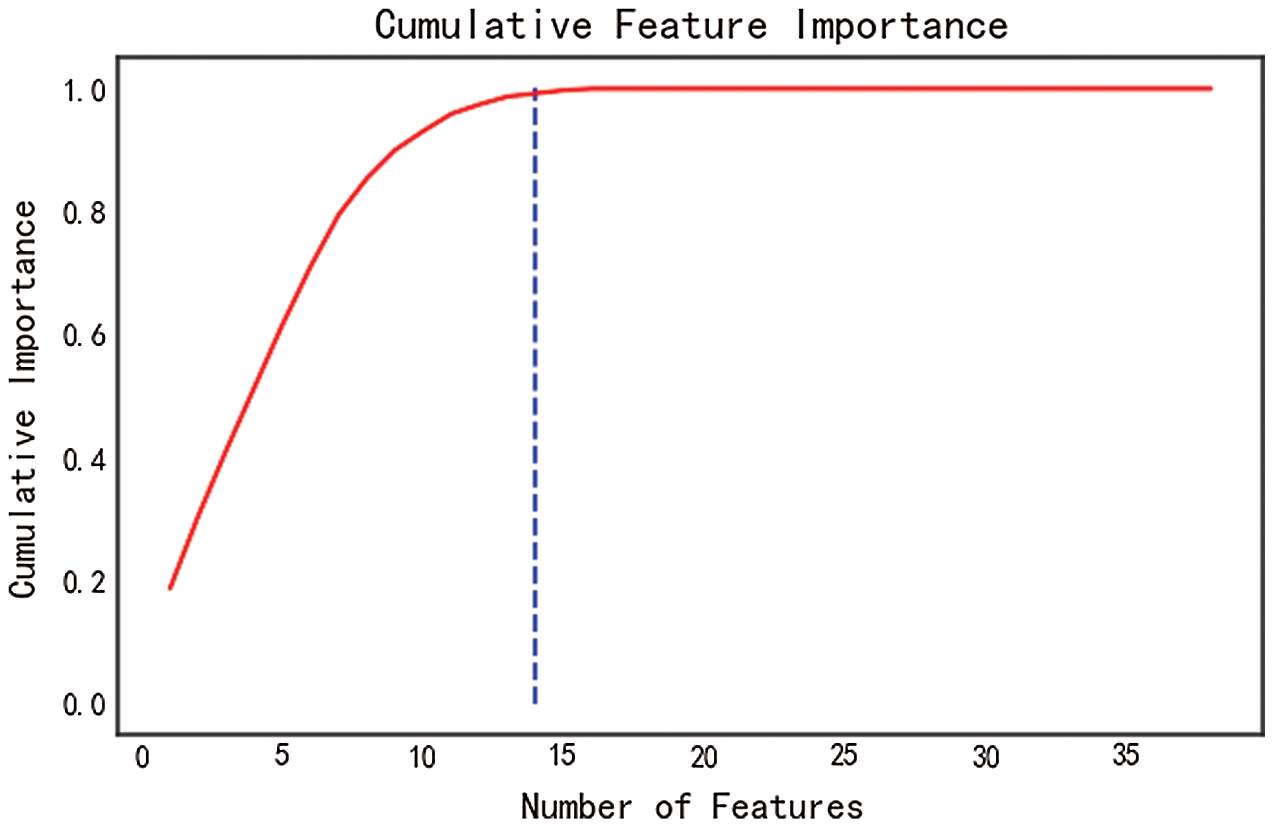
Figure 9: Cumulative feature importance
We use the trained model to predict the postoperative death risk of patients with aortic dissection under the influence of the COVID-19 pandemic. During this period, we perform surgical treatment on 11 patients. Data records show that the average waiting time before operation has been increased by 4–20 h during the COVID-19 pandemic.
We use 146 cases for model training and 60 cases for testing. In the test set, 49 cases occurred between 2014 and 2018, and 11 cases occurred in the pandemic period.
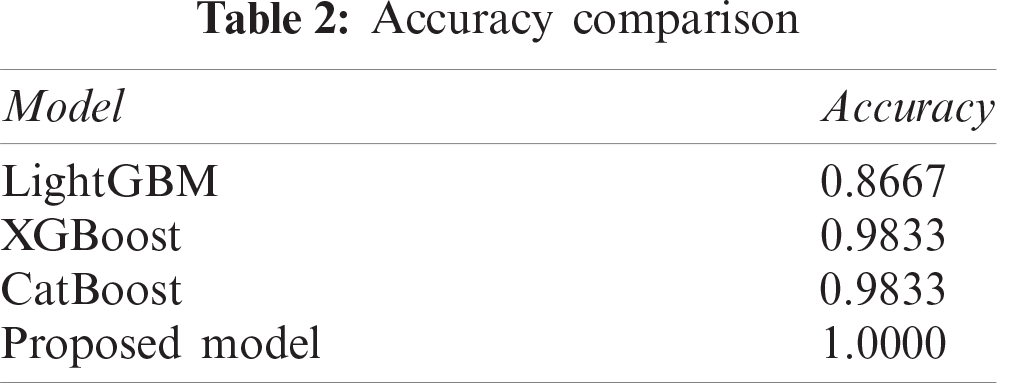
The accuracy of prediction results is listed in the Tab. 2. It can be seen that our proposed model can obtain the prediction accuracy of 100%, which is more accurate than any other single model, such as LightGBM, XGBoost, or CatBoost.
We have successfully used this model to predict the postoperative death of patients with aortic dissection during the COVID-19 pandemic, which has effectively helped us to allocate medical resources reasonably and avoid risks in advance.
In this work, we focus on the risk prediction of aortic dissection surgery. A general scheme of medical data mining is proposed. Based on feature analysis and selection, our proposed decision model can obtain a high accuracy to predict the risk of early postoperative death. The critical factors related to the postoperative mortality of aortic dissection have been revealed, which offers a certain theoretical and practical value. In future work, we will try to integrate medical images and additional research into a more complete prognosis prediction algorithm for aortic dissection.
Funding Statement: This work was supported in part by the Key Research and Development Plan of Hunan Province under Grant 2019SK2022, author H. T, http://kjt.hunan.gov.cn/; in part by the National Natural Science Foundation of Hunan under Grant 2019JJ50866, author L. T, and Grant 2020JJ4140, author Y. T, http://kjt.hunan.gov.cn/.
Conflicts of Interest: The authors declare that they have no conflicts of interest to report regarding the present study.
1. Z. Yang, S. Zhang, Y. Hu, Z. Hu and Y. Huang, “VAE-Stega: Linguistic steganography based on variational auto-encoder,” IEEE Transactions on Information Forensics and Security, vol. 16, no. 1, pp. 880–895, 2020. [Google Scholar]
2. Z. Zhou, J. H. Qin, X. Y. Xiang, Y. Tan, Q. Liu et al., “News text topic clustering optimized method based on TF-IDF algorithm on spark,” Computers, Materials & Continua, vol. 62, no. 1, pp. 217–231, 2020. [Google Scholar]
3. L. Y. Xiang, S. H. Yang, Y. H. Liu, Q. Li and C. Z. Zhu, “Novel linguistic steganography based on character-level text generation,” Mathematics, vol. 8, no. 9, pp. 1558–1576, 2020. [Google Scholar]
4. T. Q. Zhou, B. Xiao, Z. P. Cai and M. Xu, “A utility model for photo selection in mobile crowdsensing,” IEEE Transactions on Mobile Computing, vol. 20, no. 1, pp. 48–62, 2021. [Google Scholar]
5. M. Tayefi, M. Tajfard, S. Saffar, P. Hanachi, A. Amirabadizadeh et al., “Hs-CRP is strongly associated with coronary heart disease (CHDA data mining approach using decision tree algorithm,” Computer Methods and Programs in Biomedicine, vol. 141, no. 1, pp. 105–109, 2017. [Google Scholar]
6. J. Gu, L. Liang, H. Song, Y. Kong, R. Ma et al., “A method for hand-foot-mouth disease prediction using GeoDetector and LSTM model in Guangxi, China,” Scientific Reports, vol. 9, no. 1, pp. 17928, 2019. [Google Scholar]
7. C. Ricciardi, V. Cantoni, G. Improta, L. Iuppariello, I. Latessa et al., “Application of data mining in a cohort of Italian subjects undergoing myocardial perfusion imaging at an academic medical center,” Computer Methods and Programs in Biomedicine, vol. 189, no. 1, pp. 105343–105372, 2020. [Google Scholar]
8. Y. Luo, J. Qin, X. Xiang and Y. Tan, “Coverless image steganography based on multi-object recognition,” IEEE Transactions on Circuits and Systems for Video Technology, 2021. [Online]. Available: https:/10.1109/TCSVT.2020.3033945. [Google Scholar]
9. Y. Tan, J. Qin, H. Tang, X. Xiang, L. Tan et al., “Privacy protection for medical images based on DenseNet and coverless steganography,” Computers, Materials & Continua, vol. 64, no. 3, pp. 1797–1817, 2020. [Google Scholar]
10. Q. Liu, X. Xiang, J. Qin, Y. Tan, J. Tan et al., “Coverless steganography based on image retrieval of DenseNet features and DWT sequence mapping,” Knowledge-Based Systems, vol. 192, no. 2020, pp. 105375–105389, 2020. [Google Scholar]
11. Y. Tan, L. Tan, X. Xiang, H. Tang, J. Qin et al., “Automatic detection of aortic dissection based on morphology and deep learning,” Computer, Materials & Continua, vol. 62, no. 3, pp. 1201–1215, 2020. [Google Scholar]
12. S. Ayyoubzadeh, S. Ayyoubzadeh, H. Zahedi, M. Ahmadi and S. Kalhori, “Predicting COVID-19 incidence using Google Trends and data mining techniques: A pilot study in Iran,” JMIR Public Health and Surveillance, vol. 6, no. 2, pp. 4–14, 2020. [Google Scholar]
13. A. Keshavarzi, “Coronavirus infectious disease (COVID-19) modeling: Evidence of geographical signals,” SSRN Electronic Journal, vol. 4, 2020. [Online]. Available: https:/10.2139/ssrn.3568425. [Google Scholar]
14. M. Jibril, M. Islam, S. Usman and S. Ayon, “Predictive data mining models for novel coronavirus (COVID-19) infected patients’ recovery,” 2020. [Online]. Available: https:/10.21203/rs.3.rs-33247/v1. [Google Scholar]
15. D. Gurwitz, “Repurposing current therapeutics for treating COVID-19: A vital role of prescription records data mining,” Drug Development Research, vol. 81, no. 7, pp. 777–781, 2020. [Google Scholar]
16. M. Marhl, V. Grubelnik, M. Magdic and R. Markovic, “Diabetes and metabolic syndrome as risk factors for COVID-19,” Diabetes & Metabolic Syndrome: Clinical Research & Reviews, vol. 14, no. 4, pp. 671–677, 2020. [Google Scholar]
17. M. Toraih, R. Elshazli, M. Hussein, A. Elgaml, M. Amin et al., “Association of cardiac biomarkers and comorbidities with increased mortality, severity, and cardiac injury in COVID-19 patients: A meta-regression and decision tree analysis,” Journal of Medical Virology, vol. 92, no. 11, pp. 1–16, 2020. [Google Scholar]
18. L. O. Conzelmann, I. Hoffmann, M. Blettner, K. Kallenbach, M. Karck et al., “Analysis of risk factors for neurological dysfunction in patients with acute aortic dissection type A: Data from the German registry for acute aortic dissection type A (GERAADA),” Eur. J. Cardiothorac. Surg., vol. 44, no. 2, pp. 557–565, 2011. [Google Scholar]
19. L. Tan, J. Xiao, X. Zhou, K. Shen, F. Li et al., “Untreated distal intimal tears may be associated with paraplegia after total arch replacement and frozen elephant trunk treatment of acute Stanford type A aortic dissection,” Journal of Thoracic & Cardiovascular Surgery, vol. 9, no. 1, pp. 1–10, 2018. [Google Scholar]
20. T. Chen and C. Guestrin, “XGBoost: A scalable tree boosting system,” in Proc. of the 22nd ACM SIGKDD Int. Conf., San Francisco California, USA, pp. 785–794, 2016. [Google Scholar]
21. G. Ke, Q. Meng, T. Finely, T. Wang, W. Chen et al., “LightGBM: A highly efficient gradient boosting decision tree,” in Neural Information Processing Systems, Long Beach, California, USA, pp. 1–9, 2017. [Google Scholar]
22. A. V. Dorogush, V. Ershov and A. Gulin, “CatBoost: Gradient boosting with categorical features support,” in Workshop on ML Systems at NIPS, Long Beach, California, USA, 2017. [Google Scholar]
 | This work is licensed under a Creative Commons Attribution 4.0 International License, which permits unrestricted use, distribution, and reproduction in any medium, provided the original work is properly cited. |