DOI:10.32604/cmc.2021.017702
| Computers, Materials & Continua DOI:10.32604/cmc.2021.017702 | |
| Article |
A Novel Framework for Multi-Classification of Guava Disease
1College of Applied Computer Sciences, King Saud University (Almuzahmiyah Branch), Riyadh, 11564, KSA
2Department of Computer Science, University of Central Punjab, Lahore, 54000, Pakistan
3Department of CS&SE, International Islamic University, Islamabad, 44000, Pakistan
4Division of Science and Technology, University of Education, Lahore, 54000, Pakistan
5Department of Electrical and Computer Engineering, Dhofar University, Salalah, Oman
*Corresponding Author: Awais Mahmood. Email: mawais@ksu.edu.sa
Received: 08 February 2021; Accepted: 19 April 2021
Abstract: Guava is one of the most important fruits in Pakistan, and is gradually boosting the economy of Pakistan. Guava production can be interrupted due to different diseases, such as anthracnose, algal spot, fruit fly, styler end rot and canker. These diseases are usually detected and identified by visual observation, thus automatic detection is required to assist formers. In this research, a new technique was created to detect guava plant diseases using image processing techniques and computer vision. An automated system is developed to support farmers to identify major diseases in guava. We collected healthy and unhealthy images of different guava diseases from the field. Then image labeling was done with the help of an expert to differentiate between healthy and unhealthy fruit. The local binary pattern (LBP) was used for the extraction of features, and principal component analysis (PCA) was used for dimensionality reduction. Disease classification was carried out using multiple classifiers, including cubic support vector machine, Fine K-nearest neighbor (F-KNN), Bagged Tree and RUSBoosted Tree algorithms and achieved 100% accuracy for the diagnosis of fruit flies disease using Bagged Tree. However, the findings indicated that cubic support vector machines (C-SVM) was the best classifier for all guava disease mentioned in the dataset.
Keywords: Classification; guava disease; image processing; machine learning
Agriculture is a major source of food, and provides a significant contribution to the economy [1]. Guava, known as “the apples of the tropics” is a common fruit of considerable commercial and nutritional value. It is a rich source of vitamin C. Guava leaf supplements, in the form of capsules and leaf teas, are widely used for their medicinal properties. Diseases of these plants can reduce production and cause losses in both the variety and quality of the fruits. The recognition and classification of plant diseases is an important topic of research [2,3]. However, in recent years the production of guava has declined, due to fungal diseases including anthracnose, canker, styler end rot, fruit fly, algal spot, rust, and wilt. When diseases arise on the plants, they cannot be seen with the naked eye. Accurate and fast diagnoses of the diseases, followed by remedial measures, are necessary for sustaining the agro economy and, indirectly, human health. Agricultural experts usually use visual observation to monitor disease [4,5], and this constant requirement for expert oversight may be restrictively expensive in developing countries. In several developing countries, farmers may need to travel long distances to meet agriculture specialists, incurring significant costs [6]. Agriculturists also tend to be ignorant of non-local maladies.
Guava plants are prone to many diseases. In Pakistan, for example, anthracnose is a major problem. In order to protect the plants from disease, it is important to be able to identify the diseases rapidly and accurately, so the use of an automated detection system has many advantages. Our research focused upon the detection and classification of diseases in guava. Images of agricultural value suffer from several issues, such as the automation of plant disease identification, the identification of multiple diseases, variability in the resolution of the images, partial occlusion of plants due to surrounding vegetation, and variability in illumination and lighting conditions. The challenge is to decrease the numbers of false positives and increase the accuracy of detection and classification of infected regions.
The main aim of this work was to develop an automatic technique for identifying and classifying regions of disease in guava plants. The following steps were performed to detect and classify guava diseases using image processing techniques. Images of four types of guava diseases were collected from the field, and labeled by experts to differentiate between healthy and unhealthy fruits. We used YCbCr and red/green/blue (RGB) color representations in the preprocessing phase to improve the contrast of the original image, facilitating the detection of infected regions in the plant image. In the feature extraction phase, we used the LBP method, which is useful for the improvement of the detection process. The color features were extracted from the segmented regions. Feature level image fusion was used to sharpen image resolution and to improve the classification of the image. Finally, we utilized multiple classifiers including C-SVM F-KNN, RUSBoosted, and bag tree algorithms to classify four diseases regarding guava.
Research into the automated detection of plant diseases has been of interest to researchers for many years. Gavhale and Gawande built a model for the identification of different diseases in plants using images of plant leaves. Their approach involved five stages. In step one, they used a camera to capture initial image sets, and preprocessed these images to enhance the images and color space. For segmentation, the infected regions were identified using edge, region, and threshold-based segmentation techniques, and then texture, color features, and shape were calculated. Finally, a neural network classifier was used to create texture feature taxonomy [7]. Deshpande et al. presented an established graded method for automated disease recognition in pomegranate fruit. They processed the images and identified the disease after resizing, enhancing, correcting, and removing shadow from the images. The K-means algorithm was used for the detection of the affected parts of the leaves. Their approach provided good accuracy of identification of the diseases [8]. Thilagavathi et al. [9] proposed a system for guava plant leaf disease detection using image processing techniques, including the use of color transformation to facilitate the detection of diseased areas, followed by classification using SVM and KNN.
Gavhale et al. developed a framework for the identification of disease affected parts of citrus leaves. They recognized the disease using image preprocessing techniques including image enhancement, RGB color vector transformation, and K-means. They focused on feature extraction and recognition to recognize diseases of the leaf. Texture and color feature extraction was done using Gray Level Co-occurrence Matrix (GLCM) methods and an SVM classifier was used for disease detection [10]. Ali et al. [5] presented a technique using color features and histogram of oriented gradients (HOG) features, and achieved significant results for citrus disease. Sannakki et al. [11] presented a model for the diagnosis of grape leaf diseases using machine learning methods. Images of leaves from a digital camera were passed to thresholding, where green pixels were masked. Preprocessing was done using the antistrophic diffusion method to remove noise from the leaf images. Segmentation was performed using K-means clustering. GLCM was used to extract the texture features of the affected portion. Afterwards, an artificial neural network (ANN) was applied to achieve classification accuracy. Phadikar [12] suggested an automatic method for the detection of diseases of rice leaves, which was built on morphological operations. An automatic system was used to recognize the leaf blast and brown scratches of the rice plants. The feature extraction of rice leaves viruses was accomplished by the mean filter pattern. Lastly, the Otsu segmentation method was used to identify the infected part of images. The system produced precisions of 68.1% and 79.5% for SVM and Bayes classifiers, respectively. Dey et al. [13] developed an automatic system for the detection of leaf root disease using color features. Captured images were converted into HSV to differentiate the rotted leaf area from the healthy leaf area. The segmentation of the image was performed using the Otsu method. The threshold value was found on the “H” element of the “HSV” model. To identify the rotted leaf area, the number of white pixels was multiplied by a recognized calibration factor.
Khan et al. [14] proposed a new method for apple disease detection and recognition. Their system comprised three major steps, including image preprocessing, spot segmentation, and extraction of features. The spots on apple leaves were enhanced using a fusion technique, which was a combination of de-correlation, 3D box filtering, 3D-Median filtering, and 3D-Gaussian filtering. In the second step, segmentation was done with the help of the Expectation-Maximization and Strong Correlated Pixels algorithms. Finally, for feature extraction, the color histogram and LBP were used. Rauf et al. [15] collected a data set of healthy and unhealthy citrus fruits and leaves from the Sargodha Region Garden. The author used the data set for the finding and categorization of citrus disease. The whole process consisted of preprocessing, segmentation, feature extraction, and feature selection. In the first step, to enhance the image, Top-hat and Gaussian functions were used. In the second step, segmentation was done by the use of weighted segmentation and saliency maps. The segmented image was transferred to a feature extractor which extracted the color, texture, and geometric features of images. In the next stage feature extraction was done using Principal Component Analysis (PCA), skewness, and entropy. Lastly, the classification was completed, to categorize each image instance according to its disease category. Adeel et al. [16] proposed an automatic system for the identification of grape leaf diseases, and claimed to have produced good results. Arivazhagan et al. [17] delivered a system to identify unhealthy areas of plants based on textures. Initially, the images were transformed into the HSI color space. Features such as energy, homogeneity, prominence, and cluster shade were then extracted. Finally, the extracted features were categorized using an SVM classifier.
A comprehensive description of the major diseases of guava is given in [18].
Anthracnose is a fungal disease. It produces dipped, dark-colored cuts on mature fruit, which may become covered in pink spores. The cuts combine to form large necrotic patches on the surface of the fruit. Fungicides are used to maintain the disease. Fruit affected by anthracnose is shown in Fig.1a.
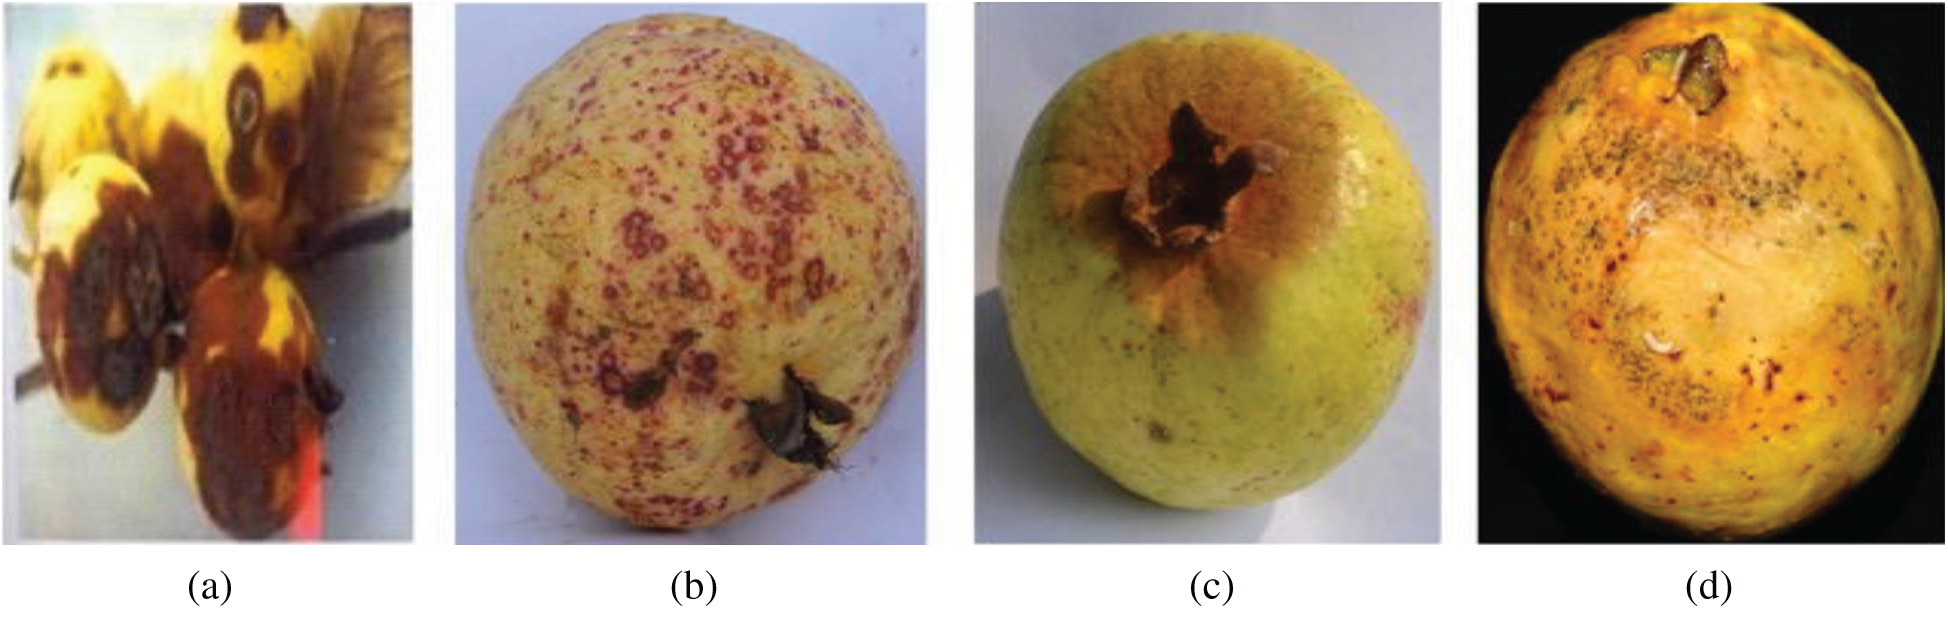
Figure 1: Fruits affected by guava diseases. (a) Anthracnose (b) Algal spot (c) Styler end rot (d) Fruit fly
Algal spot is also fungal. It causes spots on the leaves and fruits, which reduce the photosynthetic capacity of the plant. This disease does not produce major economic losses. Fruit affected due to anthracnose is shown in Fig. 1b.
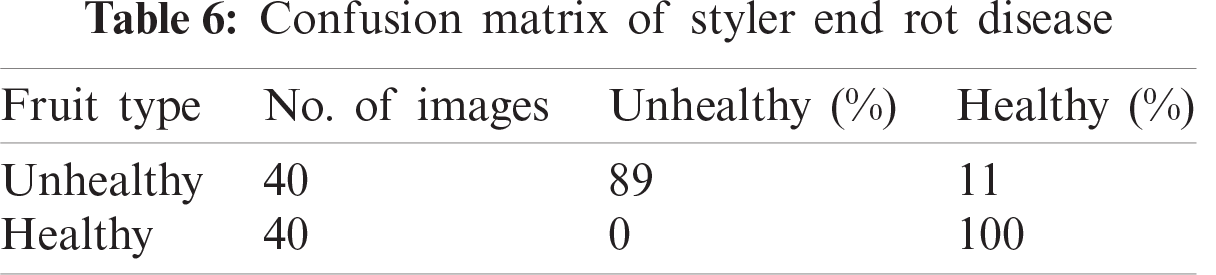
This disease is caused by infection with the ascomycete fungus Phomopsis. The major symptom of this disease is discoloration in the region below the persistent calyx. This area slowly enlarges and becomes dark brown and soft. Alpha naphthol is used to control the disease. Fruit affected by styler end rot is shown in Fig.1c.
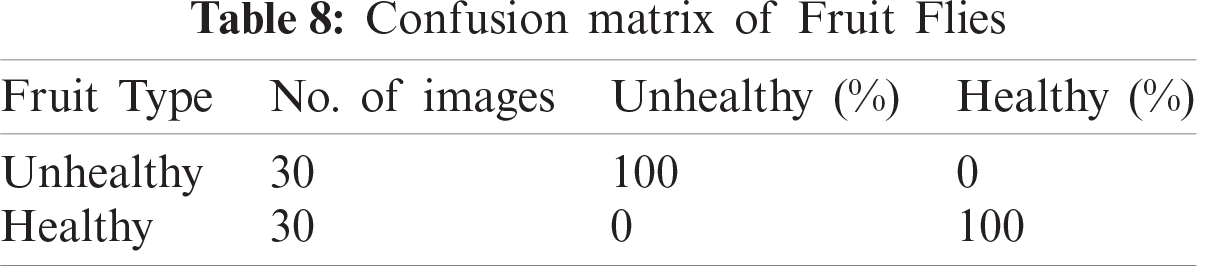
Fruit flies carry a bacterial disease. The symptoms of the disease are depressions in the fruit with dark-colored lesions and soft areas caused by larvae feeding on the fruit. The growth of secondary rots frequently causes fruit to drop from the tree. Fruit affected by fruit fly is shown in Fig. 1d.
Our proposed technique involves the following five stages: image acquisition, image labeling, feature extraction and fusion, feature reduction, and finally classification. Fig. 2 is a graphical representation of our methodology.
Images of guava plants were acquired from the field. Infected leaves and fruit were picked from the plant and placed on a white background. While capturing the image, we adjusted the camera to capture the image with a white background for the fruit and leaf only. Our database comprises 400 images covering four kinds of guava diseases: anthracnose, algal spot, styler end rot, and fruit flies, and images of healthy fruit. Each image has dimensions 520 × 530 at 300 dpi.
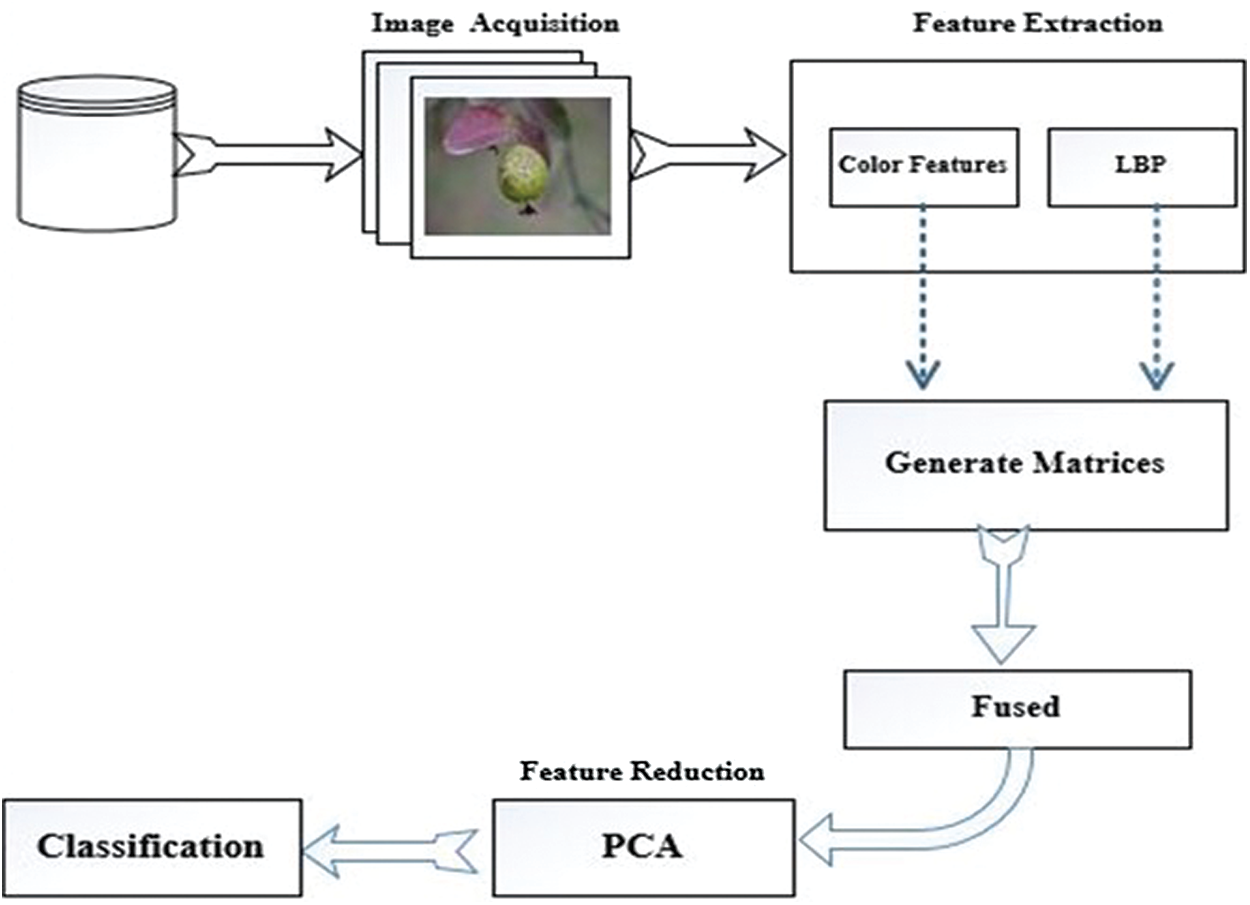
Figure 2: Flow diagram of guava disease classification system
We labeled the images with the help of an expert. Image labeling was done on all images, whether the plants were healthy or not, based on the symptoms produced by each disease.
Feature extraction involves the transformation of raw data into a set of features. Features play an important role in the field of image processing [19,20]. Numerous image preprocessing techniques and methods are applied on raw images, including thresholding [21], normalization [22], binarization, and resizing. In the fields of medical imaging and agricultural science, several kinds of features are used, such as HOG, texture, color and many more [23]. Subsequently, different feature extraction techniques like DCCN [24] are applied to get those features that are useful in the classification and identification of different images. Feature extraction methods are useful and proved to be very helpful in image processing application like face recognition, character recognition etc.
In our methodology, we applied two methods for feature extraction. First, the color features of the image were extracted, and then LBP method was applied to the dataset to obtain matrices of images.
The color features are very useful and more important because each pixel consists of a different color [25]. The color features are calculated from three different types of color spaces: RGB, YCbCr (Y′ is the luma component and CB and CR are the blue-difference and red-difference chroma components), and NTSC (a broader RGB color space). The calculation of mean, skewness, entropy and standard deviation for each color channel is as follows:
The mean was calculated using the following formula:
where
Standard deviation was calculated using the following formula:
where
Skewness was measured by the following formula:
where
Entropy was measured using:
where H(
3.3.2 Local Binary Pattern (LBP)
LBP is a graphic descriptor used in the field of pattern recognition [26,27]. LBP labels each pixel of the selected image by thresholding the neighbors of each value and returning a binary number. In general, LBP takes a 3 × 3 neighborhood of the pixel and assigns 1 as a binary digit if the value of the neighbor of the center pixel is greater than that of the center pixel. The LBP operator generates 0 if the value of the neighboring pixel is less than that of the center pixel. After calculating 0 and 1 value for the neighbors, the eight neighbors of a center pixel are assigned a decimal unsigned integer. The LBP standard method is obtained from the binary process between a neighbor pixel
where
3.4 Principal Component Analysis (PCA)
The resulting features may be very high dimensional in the case when features are fused, and feature reduction algorithms are required to reduce the dimensionality. The traditional approaches usually employed for feature reduction include PCA [28] and linear discriminant analysis (LDA) [29]. PCA is a statistical method that uses an extraneous transformation to convert a dataset of the correlated variables into a set of uncorrelated variables. For images, it creates an uncorrelated feature space that can be used for further processing, instead of the original dataset. PCA is a learning algorithm that is used to minimize the number of features in a dataset. PCA reduce the number of features by finding a new set of features called components. These new features are a mixture of the original features in uncorrelated form. In this method, fused features are input to PCA, the covariance of the data points is found, and then the eigenvector and the corresponding eigenvalues are found and sorted in ascending order. We used the 50 best features. The formula for calculating the covariance is as follows:
where
The selected features were then fed to the classifiers. Five types of classifier that is KNN, M-SVM, RUSBoosted Tree, F-KNN and Bagged Tree classifier [30] were used to classify the images. The general architecture of the classification process is presented in Fig. 3.
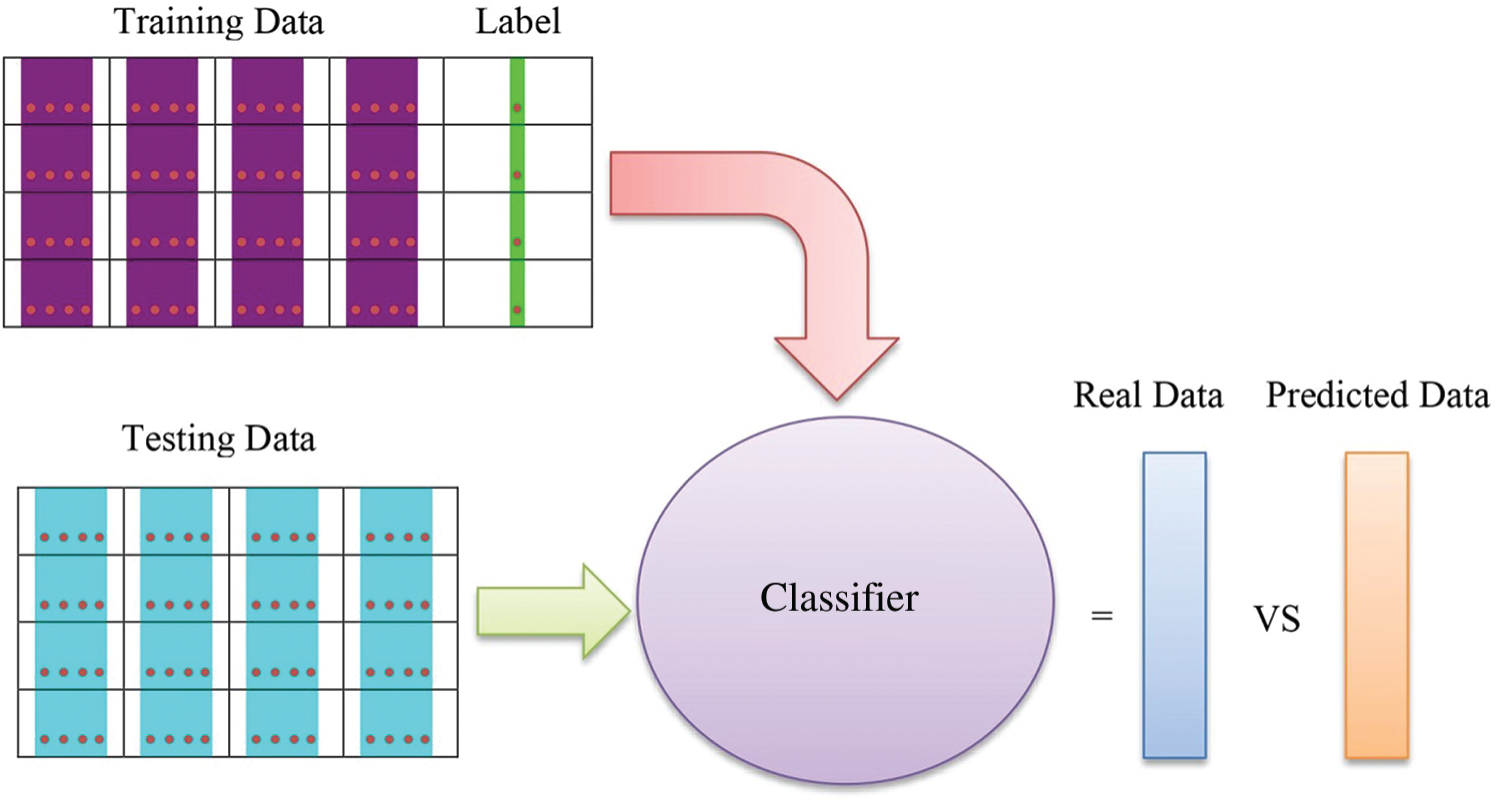
Figure 3: General architecture of the classification process
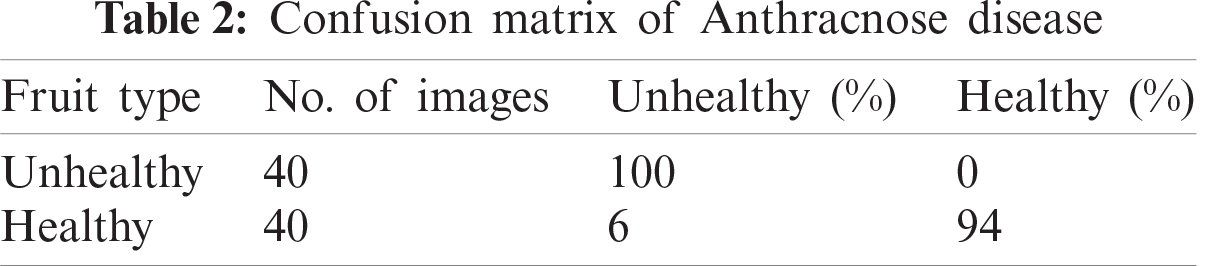
Classification produces four values, true positive (TP), true negative (TN), false positive (FP) and false negative (FN) in the form of a confusion matrix. Following classification, different performance measures can be calculated, including accuracy, True Positive Rate (TPR), FN Tate (miss rate), Positive Predictive Value (PPV) and area under the ROC curve (AUC).
Accuracy is the number of TP and TN results out of the total numbers of instances evaluated [20]. Sensitivity, also known as the TPR, is the number of positive cases which are classified accurately by the classifier.
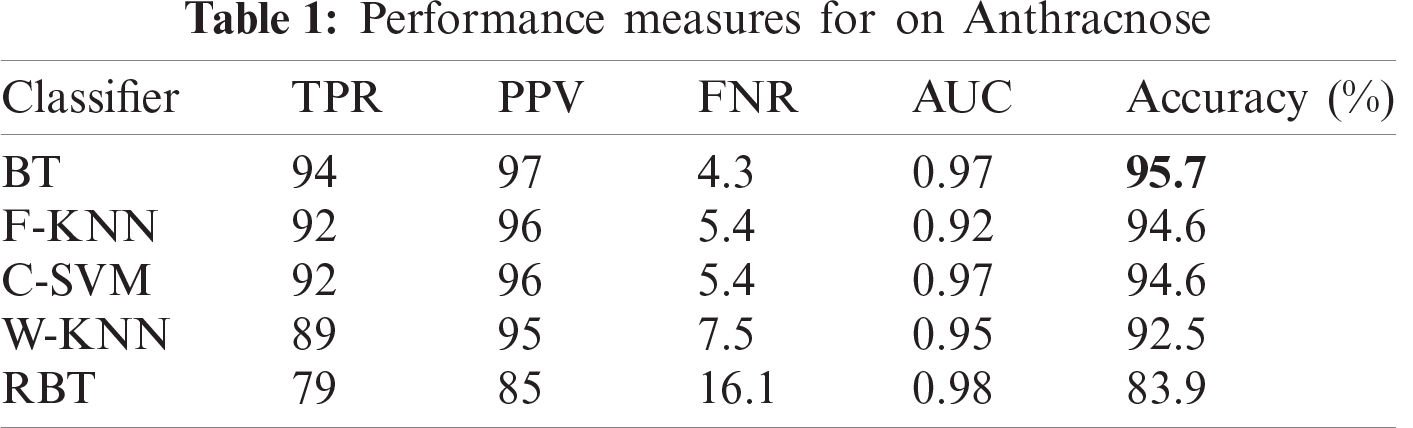
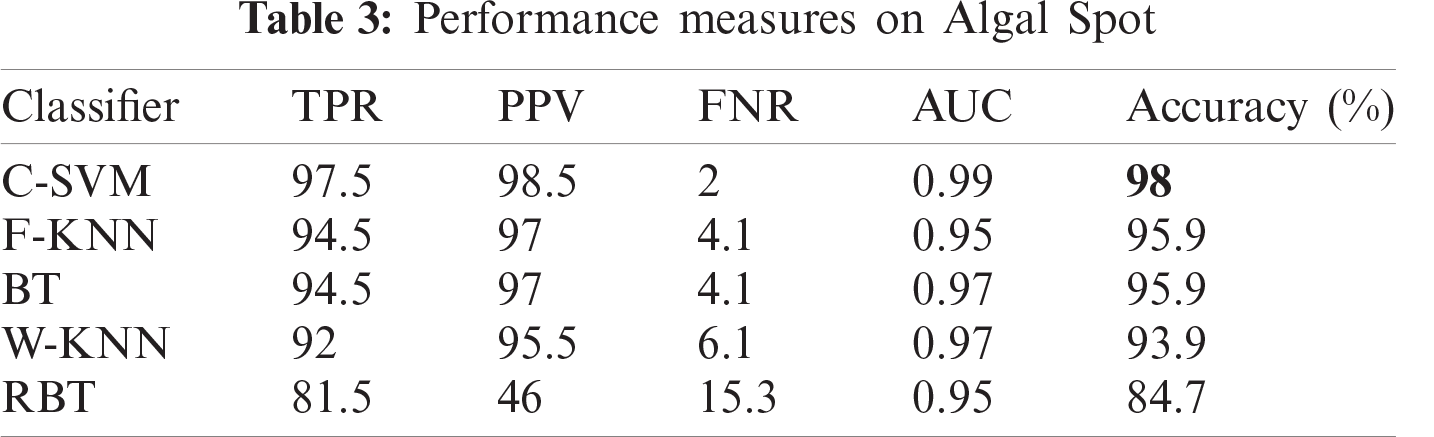
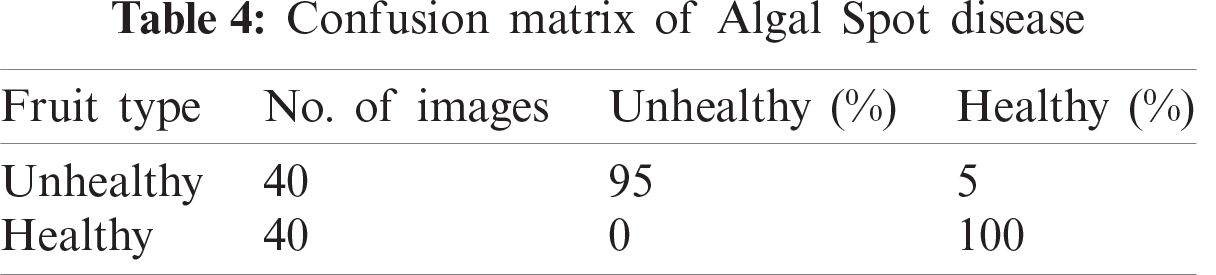
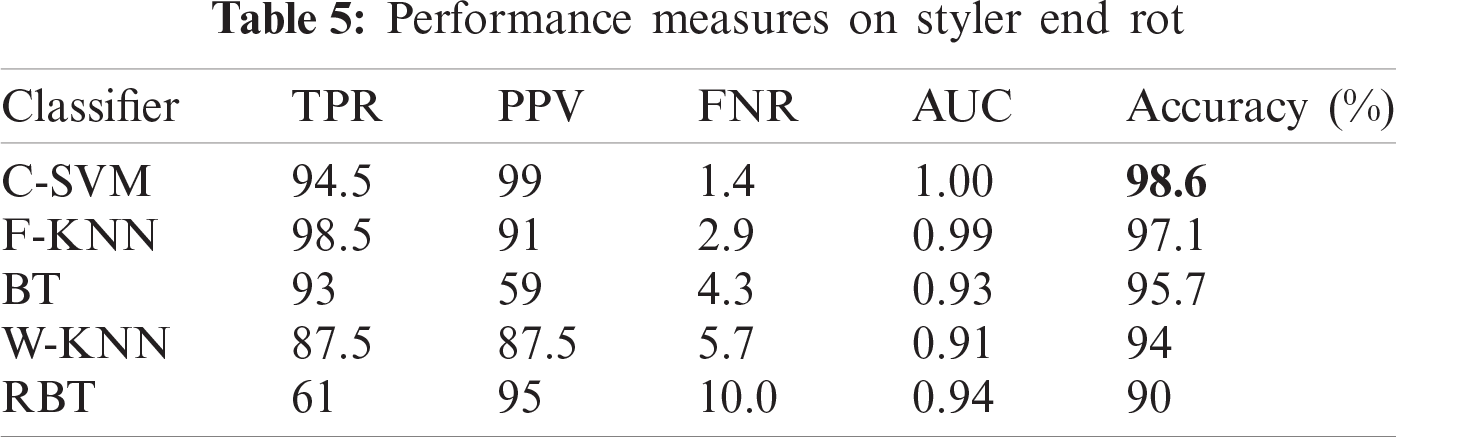
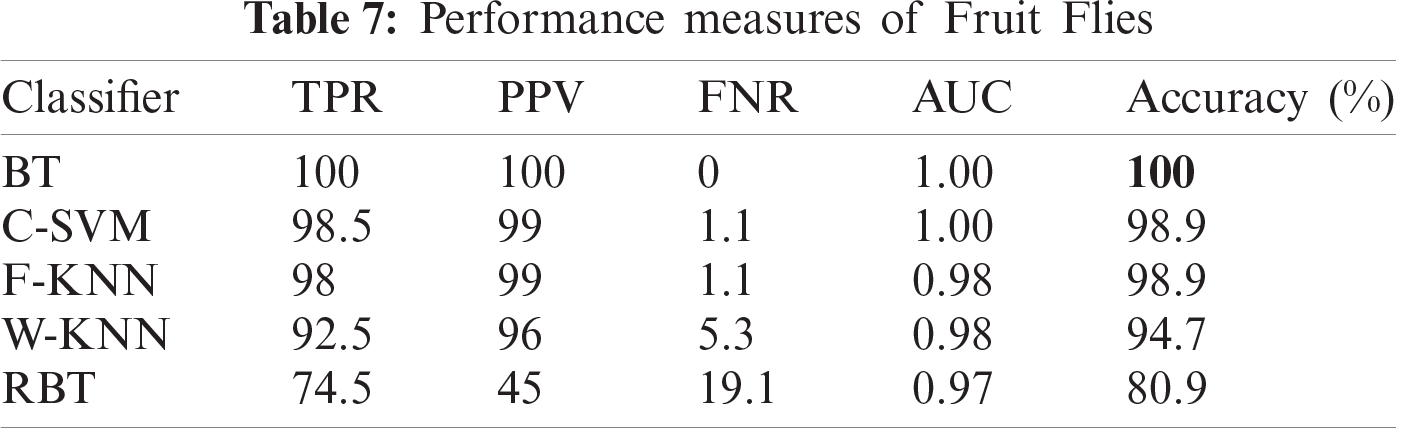
In this section, we present an analysis of the experimental result and review the performance of the approach we developed. In general, the proposed technique focuses on the following five steps i) image collection, ii) labeling, iii) feature extraction, iv) feature reduction and v) classification, as depicted in Fig. 1. For the detection and classification of diseases of guava fruit and leaves, LBP features were computed and passed to the various classifiers. Accuracies of 95.7%, 95.9%, 94%, 95.7%, and 100% were achieved for anthracnose, algal spot, styler end rot, and fruit flies respectively using a Bagged Tree classifier. The performance measures of the proposed technique in term of accuracy are shown in Tabs. 1, 3, 5, and 7 and the confusion matrices are shown in Tabs. 2, 4, 6, and 8. The experiment was done based on a comparison with five state-of-the-art classifiers, and Bagged Tree accomplished better results than other classifiers.
Guava is a product of the tropical areas of the world, and plays an important role in the economy of Asia, especially in Pakistan. The detection of guava plant diseases is an important issue in agriculture. Many classifiers and techniques have been used to detect guava diseases. In this work, we used image processing techniques to detect diseases in guava. An automatic framework was developed to support farmers in the detection and classification of major diseases in guava. We selected four types of guava plant diseases: anthracnose, algal spot, fruit flies, and styler end rot. These images were collected from from the field. The LBP was used for the extraction of features, and principal component analysis was used for dimensionality reduction. The techniques achieved accuracies of 95.7%, 95.9%, 94%, 95.7%, and 100% were achieved for anthracnose, algal spot, styler end rot, and fruit flies respectively using a Bagged Tree classifier. The proposed methodology provides efficient results. The assessment of the classifiers for large datasets, using the present methodology can be attempted in future.
Acknowledgement: The authors extend their appreciation to the Deanship of Scientific Research at King Saud University for funding this work through research Group No. RG-1441-379.
Funding Statement: This work is supported by the Deanship of Scientific Research at King Saud University through research Group No. RG-1441-379.
Conflicts of Interest: The authors declare that they have no conflicts of interest to report regarding the present study.
1. M. A. Beck, C. Y. Liu, C. P. Bidinosti, C. J. Henry, C. M. Godee et al., “An embedded system for the automated generation of labelled plant images to enable machine learning applications in agriculture,” PLoS One, vol. 15, no. 12, pp. e0243923, 2020. [Google Scholar]
2. K. G. Liakos, P. Busato, D. Moshou, S. Pearson and D. Bochtis, “Machine learning in agriculture: A review,” Sensors, vol. 18, no. 8, pp. 2674, 2018. [Google Scholar]
3. V. S. Gutte and M. A. Gitte, “A survey on recognition of plant disease with help of an algorithm,” International Journal of Engineering Science, vol. 6, no. 6, pp. 7101–7103, 2016. [Google Scholar]
4. V. Singh and A. K. Misra, “Detection of plant leaf diseases using image segmentation and soft computing techniques,” Inf. Process Agric., vol. 4, no. 1, pp. 41–49, 2017. [Google Scholar]
5. H. Ali, M. I. Lali, M. Z. Nawaz, M. Sharif and B. A. Saleem, “Symptom-based automated detection of citrus diseases using the color histogram and textural descriptors,” Comput Electron Agric., vol. 138, pp. 92–104, 2017. [Google Scholar]
6. P. Revathi and M. Hemalatha, “Classification of cotton leaf spot diseases using image processing edge detection techniques,” in Int. Conf. on Emerging Trends in Science, Engineering and Technology, Tiruchirappalli, India, pp. 169–173, 2012. [Google Scholar]
7. M. K. R. Gavhale and P. U. Gawande, “An overview of the research on plant leaves disease detection using image processing techniques,” IOSR Journal of Computer Engineering, vol. 16, no. 1, pp. 10–16, 2014. [Google Scholar]
8. T. Deshpande, S. Sengupta and K. S. Raghuvanshi, “Grading & identification of disease in pomegranate leaf and fruit,” International Journal of Computer Science and Information Technologies, vol. 5, no. 3, pp. 4638–4645, 2014. [Google Scholar]
9. M. Thilagavathi and S. Abirami, “Application of image processing in diagnosing guava leaf diseases,” International Journal of Scientific Research and Management, vol. 5, no. 7, pp. 5927–5933, 2017. [Google Scholar]
10. K. R. Gavhale, U. Gawande and K. O. Hajari, “Unhealthy region of citrus leaf detection using image processing techniques,” in Int. Conf. for Convergence of Technology-2014, Pune, India, pp. 1–6, 2014. [Google Scholar]
11. S. S. Sannakki, V. S. Rajpurohit, V. B. Nargund and P. Kulkarni, “Diagnosis and classification of grape leaf diseases using neural networks,” in 4th Int. Conf. on Computing, Communications and Networking Technologies, Tiruchengode, India, pp. 1–5, 2013. [Google Scholar]
12. S. Phadikar, “Classification of rice leaf diseases based on morphological changes,” International Journal of Information and Electronic Engineering, vol. 2, no. 3, pp. 460–463, 2012. [Google Scholar]
13. A. K. Dey, M. Sharma and M. R. Meshram, “Image processing based leaf rot disease, detection of betel vine (Piper BetleL.),” Procedia Comput Sci., vol. 85, pp. 748–754, 2016. [Google Scholar]
14. M. A. Khan, M. I. Lali, M. Sharif, K. Aurangzeb, S. I. Haider et al., “An optimized method for segmentation and classification of apple diseases based on strong correlation and genetic algorithm-based feature selection,” IEEE Access, vol. 7, pp. 46261–46277, 2019. [Google Scholar]
15. H. T. Rauf, B. A. Saleem, M. I. Lali, M. A. Khan, M. Sharif et al., “A citrus fruits and leaves dataset for detection and classification of citrus diseases through machine learning,” Data, in Brief, vol. 26, pp. 104043, 2019. [Google Scholar]
16. A. Adeel, M. A. Khan, M. Sharif, F. Azam, J. H. Shah et al., “Diagnosis and recognition of grape leaf diseases: An automated system based on a novel saliency approach and canonical correlation analysis based multiple features fusion,” Sustain Comput. Inform. Syst., vol. 24, pp. 100349, 2019. [Google Scholar]
17. S. Arivazhagan, R. N. Shebiah, S. Ananthi and S. V. Varthini, “Detection of the unhealthy region of plant leaves and classification of plant leaf diseases using texture features,” Agric. Eng. Int. CIGR J., vol. 15, no. 1, pp. 211–217, 2013. [Google Scholar]
18. A. K. Misra, “Guava disease-their Symptoms, causes and management,” Diseases of Fruits and Vegetables, vol. 2, pp. 81–119, 2004. [Google Scholar]
19. T. Sadad, A. Hussain, A. Munir, M. Habib, S. A. Khan et al., “Identification of breast malignancy by marker-controlled watershed transformation and hybrid feature set for healthcare,” Appl. Sci., vol. 10, no. 6, pp. 1900, 2020. [Google Scholar]
20. T. Sadad, A. Munir, T. Saba and A. Hussain, “Fuzzy C-means and region growing based classification of tumour from mammograms using hybrid texture feature,” J. Comput. Sci., vol. 29, no. 3, pp. 34–45, 2018. [Google Scholar]
21. A. Sinha and R. S. Shekhawat, “Olive spot disease detection and classification using analysis of leaf image textures,” Procedia Comput. Sci., vol. 167, pp. 2328–2336, 2020. [Google Scholar]
22. S. M. Taohidul Islam, M. A. Masud, M. A. Ur Rahaman and M. M. Hasan Rabbi, “Plant leaf disease detection using the mean value of pixels and canny edge detector,” in 2019 Int. Conf. on Sustainable Technologies for Industry 4.0, Dhaka, Bangladesh, pp. 1–6, 2019. [Google Scholar]
23. K. Aurangzeb, F. Akmal, M. A. Khan, M. Sharif and M. Y. Javed, “Advanced machine learning algorithm based system for crops leaf diseases recognition,” in 6th Conf. on Data Science and Machine Learning Applications, Riyadh, Saudi Arabia, pp. 146–151, 2020. [Google Scholar]
24. A. Adeel, M. A. Khan, T. Akram, A. Sharif, M. Yasmeen et al., “Entropy-controlled deep features selection framework for grape leaf diseases recognition,” Expert Syst., pp. 1–17, 2020. [Google Scholar]
25. X. E. Pantazi, D. Moshou and A. A. Tamouridou, “Automated leaf disease detection in different crop species through image features analysis and one-class classifiers,” Comput Electron Agric., vol. 156, no. 13, pp. 96–104, 2019. [Google Scholar]
26. W. Ismail, M. A. Khan, S. A. Shah, M. Y. Javed, A. Rehman et al., “An adaptive image processing model of plant disease diagnosis and quantification based on color and texture histogram,” in 2nd Int. Conf. on Computer and Information Sciences, Sakaka, Saudi Arabia, pp. 1–6, 2020. [Google Scholar]
27. V. A. Gulhane and M. H. Kolekar, “Diagnosis of diseases on cotton leaves using principal component analysis classifier,” in 11th IEEE India Conf.: Emerging Trends and Innovation in Technology, Pune, India, pp. 1–6, 2014. [Google Scholar]
28. C. Lang, D. R. A. Almeida and F. R. C. Costa, “Discrimination of taxonomic identity at species, genus and family levels using Fourier transformed near-infrared spectroscopy (FT-NIR),” For Ecol. Manage., vol. 406, no. 1, pp. 219–227, 2017. [Google Scholar]
29. M. A. Khan, T. Akram, M. Sharif, K. Javed, M. Raza et al., “An automated system for cucumber leaf diseased spot detection and classification using improved saliency method and deep features selection,” Multimedia Tools and Applications, vol. 79, no. 1–2, pp. 1–16, 2020. [Google Scholar]
30. V. Kumar and P. Gupta, “Importance of statistical measures in digital image processing,” International Journal of Emerging Technology and Advanced Engineering, vol. 2, no. 8, pp. 56–62, 2012. [Google Scholar]
 | This work is licensed under a Creative Commons Attribution 4.0 International License, which permits unrestricted use, distribution, and reproduction in any medium, provided the original work is properly cited. |