DOI:10.32604/cmc.2021.017591
| Computers, Materials & Continua DOI:10.32604/cmc.2021.017591 | |
| Article |
Diagnosis of Neem Leaf Diseases Using Fuzzy-HOBINM and ANFIS Algorithms
R.M.D Engineering College, Kavaraipettai, Gummidipoondi, Triuvallur, India
*Corresponding Author: I. Kiruba Raji. Email: kiruba161107@gmail.com
Received: 04 February 2021; Accepted: 20 April 2021
Abstract: This paper proposes an approach to detecting diseases in neem leaf that uses a Fuzzy-Higher Order Biologically Inspired Neuron Model (F-HOBINM) and adaptive neuro classifier (ANFIS). India exports USD 0.28-million worth of neem leaf to the UK, USA, UAE, and Europe in the form of dried leaves and powder, both of which help reduce diabetes-related issues, cardiovascular problems, and eye disorders. Diagnosing neem leaf disease is difficult through visual interpretation, owing to similarity in their color and texture patterns. The most common diseases include bacterial blight, Colletotrichum and Alternaria leaf spot, blight, damping-off, powdery mildew, Pseudocercospora leaf spot, leaf web blight, and seedling wilt. However, traditional color and texture algorithms fail to identify leaf diseases due to irregular lumps and surfaces, and rough ridges, as the classification time involved takes as long as a week. The proposed F-HOBINM algorithm recognizes the leaf intensity through the leaky capacitor, and uses subjective intensity and physical stimulus to interpret the diagnosis. Further, the processed leaf images from the HOBINM algorithm are applied to the ANFIS classifier to identify neem leaf diseases. The experimental results show 92.18% accuracy from a database of 1,462 neem leaves.
Keywords: Higher-order neural network; fuzzy c-means clustering; Mamdani fuzzy inference system; adaptive neuro-fuzzy classifier
Neem is a tree that grows rapidly to a height of about 15 to 20 m in 10 years. A member of the Meliaceae family, its botanical name is Azadirachta indica. Neem is used as a traditional medicine. Neem leaves are unpaired and pinnate, with a leaf length of about 20–30 cm. The leaflets change color from medium to dark green as they grow, and each leaflet consists of a minimum of 31 individual leaves with a length varying between 3 and 8 cm. The terminal leaf is often missing. The leaves are used to treat a wide variety of maladies ranging from skin and eye disorders to cough, fever, loss of appetite, chickenpox, diabetes, heart disease, and malaria. Neem leaf exports from India have significantly boosted the country’s economy, adding up to Rs. 6,500 crore as export revenue. The Indian government actively encourages the fertilizer industry to produce neem based-fertilizer for organic cultivation. Neem cultivation has raised farmers’ earnings in rural areas, with neem trees generating 10–100 tons of dried biomass per hectare. However, leaf yield is based on leaf quality, that is, on disease-free leaves. Neem leaves are affected by disease, regardless of their age, size, and height. Disease-inducing conditions arise in August, when the monsoon commences in southern India, and grows progressively worse until December, ending in the death of trees, in extreme cases.
A grape leaf disease detection system using color, geometric, and local binary pattern (LBP) texture features was developed in [1]. Neighborhood component analysis (NCA) identifies grape leaf disease by removing redundant features from the surface of the leaves. A multiclass support vector machine (SVM) classifier categorizes diseases such as black measles, black rot, and leaf blight. Furthermore, leaf diseases from a variety of plants (Vitis vinifera, Brassica oleracea var. capitata, Capsicum annuum, Cucurbita maxima, Cucurbita pepo, Cucumis melon, Cucumis sativus, Citrullus lanatus, Lagenaria siceraria, Cucurbita moschata, Fragaria ananassa, Pisum sativum, Solanum melongena, Malus pumila and Solanum lycopersicum can be identified through texture features obtained from the LBP algorithm, which classifies diseases through a one-class support vector machine [2]. Diseases affecting coffee leaves have been diagnosed through binary and multiclass classifiers [3]. Paddy leaf diseases have been diagnosed through an optimized deep learning network in [4]. Further, a deep learning network and an SVM classifier were used to determine four types of diseases [5]. A Pyramid Histogram of oriented Gradient (PHoG) algorithm was used to identify disease in maize [6]. Cucumber leaf diseases such as downy mildew, blight, and anthracnose can be identified through local and global features [7] or shape and color features with lesions [8]. Leaf recognition and classification play key roles in leaf disease diagnosis.
Fungi and bacteria cause leaf diseases including Alternaria and Colletotrichum leaf spot and blight [9], Cercospora, Fusarium, Oidium, Ganoderma, Corticium, bacterial blight, damping-off, powdery mildew, Pseudocercospora leaf spot, leaf web blight, and seedling wilt. Leaf disease-causing pathogens have been identified by the symptoms on display [10]. Farmers are unable to spot defects quickly, given that single leaflets are often affected by multiple disorders brought on by fungi or bacteria. Further, there is little support from the agricultural department. Only an expert plant pathologist can identify diseases affecting neem trees. An efficient diagnostic tool is needed to resolve the problem of identifying neem leaf diseases. Therefore, we propose an automatic neem leaf recognition system using soft computing techniques.
Leaf disease in miscellaneous crops and plants is identified through an object recognition algorithm and a classifier. Identifying neem leaf pathosis and symptoms is not as easy as it is for other plants and crops because different bacterial disease of neem leaf present similar symptoms in terms of color, shape, and texture. Fungi and bacteria cause a variety of leaf diseases, and the affected leaves have different shapes and colors. Neem leaf diseases caused by fungi and bacteria need an efficient algorithm that recognizes and classifies them, given the failure of visual interpretation to identify them appropriately. The proposed method circumvents the need for a laboratory-based diagnosis of neem leaf diseases that is both time-consuming and expensive. Nevertheless, the technique, which incorporates the three steps delineated below, plainly differentiates between bacterial and viral infections in the same leaf.
a. The fuzzy C-means (FCM) clustering algorithm segments the neem leaf from the background, depending on the membership value of each image pixel.
b. The Fuzzy-Higher Order Biologically Inspired Neuron Model (F-HOBINM) parameters are optimized using the Mamdani fuzzy inference system built on the entropy for different bacterial leaf diseases, and features are extracted on the basis of the type of infections noted.
c. The adaptive neuro-fuzzy classifier algorithm classifies neem leaf diseases based on its self-learning capability and its automatic adjustment of input and output values, built on the numerical knowledge of the feature vector obtained from the HOBIN network.
The paper is organized as follows. Section 2 describes the materials and methods, and Section 3 deals with the image analysis techniques that identify neem leaf diseases. Section 4 presents the experimental results and discussions, and Section 5 concludes the paper.
2.1 Symptoms of Neem Leaf Diseases
Neem leaf diseases show a similar pattern on the leaf surface [9] because of bacterial infection. Leaf spot and blight of Colletotrichum (caused by the Colletotrichum gloeosporioides fungus) and Alternaria, damping-off, powdery mildew, bacterial and Pseudocercospora leaf spot, leaf web blight, and seedling wilt present identical impressions in the form of spots on the leaf surface, and make an appearance in September and October. Damping-off [11] disease in neem is destructive, leading to seedling loss and impacting tree growth. It is caused by the fungi Fusarium and Rhizoctonia, and powdery mildew by the fungus Oidium azedaraches. The two diseases appear on the leaf surface as white patches.
The two diseases appear on the leaf surface as white patches. Alternaria leaf spot and blight are caused by the Alternaria fungus, and appear as dark brown to black leaf spots on a yellow surface. The disease is contagious and ruins tree growth. Leaf web blight [12], caused by the bacteria Rhizoctonia solani, appears as greyish-brown patches on the leaf surface. The disease-infected areas come together to form a spider web, hence the name web blight. Bacterial leaf spot is caused by the bacteria Xanthomonas azadirachtin and Pseudomonas viticola, and shows up as dark spots on the leaf surface. Seedling wilt, caused by the fungus Fusarium solani, forms small holes on the leaf surface. Fig. 1 shows a photograph of the diseases mentioned.
2.2 Traditional Methods in Neem Leaf Disease Detection and Disadvantages
The disadvantages of neem leaf disease diagnosis through traditional tests in laboratories were analyzed in [13]. A serological test was used to identify neem leaf irregularities through molecular changes, while a polymerase chain reaction test was used to detect deformities after studying the DNA and RNA sequences of fungi and bacteria. A reverse transcription test, done along with a PCR test, was used to detect diseases through sensitivity and specificity [14]. Another traditional method is the fluorescence in situ hybridization (FISH) test [15] to diagnose bacterial diseases in neem leaves. The FISH mechanism, which uses microscopy and hybridized DNA probes to detect fungal diseases, offers high single-cell sensitivity.
Two other techniques include an enzyme-linked immunosorbent assay (ELISA) [16] and immunofluorescence (IF) [17], which is a fluorescence microscopy-based optical technique to analyze neem leaf diseases. The fluorescence detects pathogen infection in neem plant tissue. The FCM test [18] is a laser-based optical technique for cell counting and sorting, biomarker detection, and protein engineering. Traditional neem leaf disease identification methods need a significant number of samples for an accurate diagnosis. Similarly, DNA replication limits the practical applicability of field sampling for disease identification. The PCR test needs about 4 to 5 days for disease diagnosis.

Figure 1: Neem leaf bacterial diseases with similar and dissimilar symptoms (a) Colletotrichum leaf spot and blight (a spot on a large area of the leaf surface with small white patches) (b) Powdery mildew (white patches on the leaf surface) (c) Pseudocercospora leaf spot (a brown blot interspersed with white patches on the leaf surface) (d) Alternaria leaf spot and blight (dark-brown to black circular spots on the yellow area of the leaf) (e) Leaf web blight (a large greyish-brown patch on the leaf surface) (f) Bacterial leaf spot (dark spots with white patches on the leaf surface)
Furthermore, the FISH test has a disadvantage in that its auto fluorescent material results in false negativity, while the ELISA method uses diseased neem leaves with bacterial and fungal enzymes combined. However, the bacteria in the leaves are too few to be tested to produce accurate diagnostic results. Therefore, an image analysis of the neem leaf would be ideal for disease diagnosis and overcoming the problems above.
3 Identify Neem Leaf Diseases Using Image Analysis
Researchers use object recognition techniques to identify plant diseases in the earliest stages and assist in healthy plant growth. The traditional appearance-based leaf object recognition method included measuring the correlation between objects and their structural similarities. The pixel-based feature extraction technique is applied in leaf image recognition. Two leaf images that are considered, for instance, share the same color and background but differ in their orientation and viewing coordinates. Bypassing the techniques mentioned above, a higher-order neural network is used for object recognition in [19] because the inputs are united as a pair. The output is regulated from the weighted sum of the input pairs. The higher-order pulse-coupled neural network (PCNN) extracts feature and converts them into time sequences for images. The PCNN determines information on edges, contours, textures, and pixel arrangements, given its direct pixel operations.
However, the traditional PCNN comprises several parameters, and it takes time to iterate the neurons. To do away with the computational complexity of the PCNN, the HOBIN model is used for leaf species classification. The HOBIN model [20], derived from several visual cortex models, stimulates high sensitivity for dark pixels and low-impulse responses for bright pixels. It combines the advantages of the PCNN [21] and ICM [22]. The HOBIN is applied for feature extraction from images. HOBIN parameters assigned by the trial-and-error method are not appropriate for all images, since each image has a different information entropy, standard deviation, and mean value.
The trial-and-error method is time-consuming and inconvenient in HOBIN parameter determination and results in misinterpreting neem diseases. A change in decay constants affects the grouping of the neighboring image pixels. Intelligent optimization algorithms used for image fusion, segmentation and enhancement are applied to circumvent human interaction in the parameter determination of neurons. The shuffled frog-leaping algorithm [23] is used to optimize PCNN parameters for a brain medical image fusion. Standard deviation, mean gradient, spatial frequency, and information entropy are extracted from the images. The artificial bee colony [24] approach is adopted to optimize PCNN parameters, with the values being passed to the image to adjust image quality. A genetic algorithm is used to optimize PCNN parameters in image retrieval and classification [25], and features are extracted from the images for improved image signatures. The ant colony optimization algorithm [26] is applied to optimize PCNN parameters, and the model is tested with an image segmentation application. All the methods above randomly assign an initial solution space.
In a genetic algorithm (GA), all chromosomes move toward a single solution, though the particles themselves move in a local or global search space in a swarm-based knowledge system. Compared to the GA, the swarm-based intelligent system is computationally fast, and the algorithm initially assigns a random solution. Random solutions do not resolve uncertainties in the problem domain. Given the feasibility of fuzzy-based optimization techniques in controlling problem spaces easily, we propose an optimized fuzzy HOBIN model to extract optimum features to resolve the viewpoint-based geometric invariant leaf object recognition system. HOBIN parameter optimization takes little time for parameter tuning, compared to that of the PCNN, since it only contains three constant values (two decay constants and one scalar value). The image output reveals inconsistent details in the image, with changes in translation, rotation and scaling properties. The fuzzy-based optimization algorithm is applied to optimize the HOBIN parameters and enhance the signature sequences of leaf images. Fig. 2 shows the proposed neem leaf disease recognition system.

Figure 2: The proposed neem leaf disease recognition system
3.1 Stationary Wavelet Transform Structured White Noise Removal
Pre-processing is achieved in neem leaf images through stationary wavelet transformation (SWT) [27] which removes white noise from leaf image. Low and high pass filters of SWT are applied for neem leaf with the same sequence of length without decimation. The information is achieved through various thresholding levels such as 5.587 and 5.533 for soft thresholding. The soft thresholding performs better due to shrinking of non-zero coefficients and leads to zero. Soft thresholding provides better clarity on the spot regions of neem leaves. Fig. 3 shows the white noise removal from images. The soft thresholding removes white noise from high sub bands. SWT filtered image is further segmented through FCM.
.

Figure 3: Structured white noise removal
3.2 FCM Segmentation Algorithm Overlapping
FCM [28] technique is applied to extract the neem leaf image from the background pixels. In soft clustering, each neem leaf image pixel belongs to both the foreground and background pixels. Hard clustering, on the other hand, considers the background pixels as foreground ones, leading to improper segmentation of the leaves. The FCM segmentation algorithm identifies pixel dependency using the membership values and uncertainty in the boundary regions to describe the background and foreground parts of the neem leaf image. The membership function assigns two values to each pixel in the image, one related to the foreground and the other to the background clusters, with varying membership values of the FCM algorithm.
The overlapping of the boundaries between clusters in the FCM algorithm is explained below.
In the FCM algorithm, the fuzzy membership values are designated on the basis of image attributes. In the image, pixel intensity is assigned as an attribute for a membership value; image I is represented as a collection of pixels (i1, i2,…, in) of size P × Q. The leaf image is divided into two clusters: background and foreground.
The following algorithm explains the method used to divide the image into foreground and background clusters. The size of the diseased neem leaf image is P × Q × 3, in which 3 indicates the RGB values of the neem leaf images. All the images are of the same size.

The FCM produces the output as a cluster center and a fuzzy partition matrix, [C × N] = [2 × 192000]
The threshold level is calculated by finding the mean between the minimum value from cluster 2 and the maximum value from cluster 1.
The value is applied on the original image, resulting in a segmented binary image.
The final output image is obtained by taking the dot product between the segmented binary and greyscale images.
In Eq. (1),
A large ‘m’ value increases indistinct cluster portions, so ‘m’ is assigned a value ranging from 1.5 to 3 in order to obtain the highest membership value for the clusters at above 0.9. If the ‘m’ value is greater than 3, it produces an unclear boundary between the clusters. The sum of all the membership function values in the fuzzy partition matrix is equal to 1, and the membership value is between 0 and 1. For example, for cluster 1, the range of membership functions is [0.0071–0.0287] and for cluster 2 it is [0.2055–1.000]. In Eq. (2),

Figure 4: Segmented Results Using Fuzzy C-means Clustering (i) Original Image (1200 × 1600 × 3 pixels) (ii) Segmented Binary Image (1200 × 1600 pixels) (iii) Segmented Grey Scale Image (1200 × 1600 pixels)
3.3 HOBINM and Fuzzy-Based Parameter Optimization
The FCM clustering technique segments the neem leaf. HOBINM model extract unique features of the affected area of neem leaf by adjusting pixel intensity and choosing optimum network parameters using the Mamdani fuzzy inference model.
3.3.1 HOBINM for Extraction of Neem Leaf
The HOBIN, a biologically-inspired neuron model, is based on the pulse-coupled neural network (PCNN). The PCNN, first proposed by [20], is derived from a pig’s visual cortex model. Adaptive network parameters for the PCNN that are most suited to identifying near-duplicate images are proposed [29]. The original model uses a leaky integrator synapse, but we use a constant current discharging capacitor model with a simplified design that improves the firing speed. The feeding input of the synapse is given in Eq. (4). Here, the input decreases constantly, speeding up the firing of the neuron.
The internal activation unit consists of a leaky capacitor, linking input and feeding input; how it works is shown in Eq. (5).
Here
The ‘k’ and ‘l’ values are indices of the neighboring neurons, and
The dynamic threshold value,
The constant ‘h’ is a threshold, which decides the neuron’s output for setting the current threshold.
When the output of the neuron’s internal activation unit,
Eq. (8) gives the time sequence of the image obtained with the network parameters of optimum value.
To compute the leaky capacitor’s impulse response, the constants ‘f’ and ‘g’ are set close to 1. Since these are decay constants, they are to have values less than 1. The values are fixed, based on the following fuzzy optimization method.
3.3.2 Optimizing HOBIN Parameters Using the Mamdani Fuzzy Inference System
The proposed Mamdani fuzzy interference system (MFIS) system contains one input and three outputs. The input is the image entropy, and the output is the parameters (f, g, and h) of the HOBINM network. Given that entropy is a measure of the information present in an image, it is used as a primary measure of parameter optimization in the HOBINM network. The entropy of the grayscale image is computed using Eq. (9). Based on the image entropy, the network parameters, ‘f’, ‘g’, and ‘h’, are optimized using a fuzzy inference method for better feature extraction. The process of parameter optimization using the fuzzy model is explained in Eq. (9),
where ‘E’ is the entropy of the image,
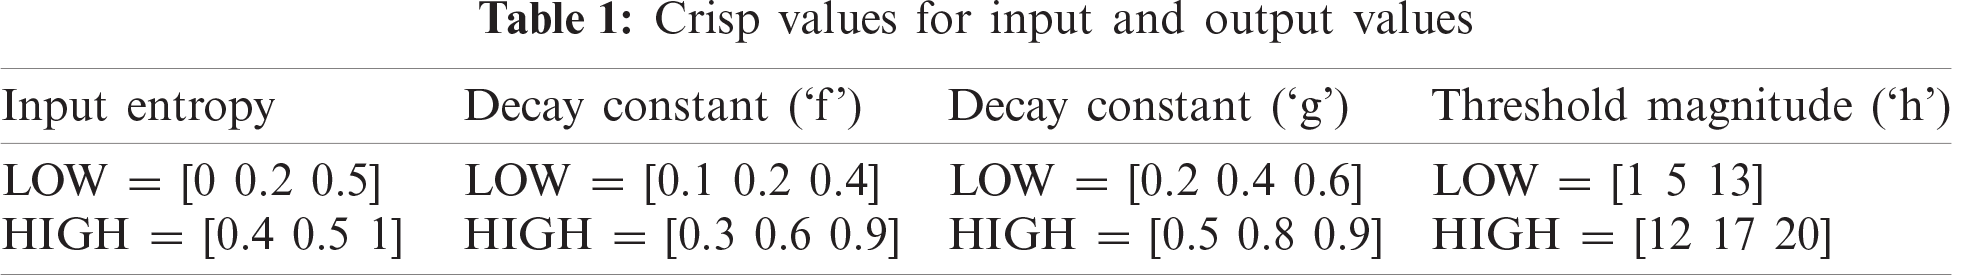
When the entropy of the image is high, that is, the probability distribution of the number of white pixels is high, the decay constant of ‘f’ and ’g’ is correspondingly high and the impulse response of the leaky capacitor good. When the decay constants are low, the impulse response of the leaky capacitor is inadequate. With a high threshold magnitude (‘h’), the neuron fires only one cycle, which is otherwise more than one. Tab. 1 shows the crisp values of the input and output variables.
In the MFIS, the entropy of the fuzzy set, ‘E’, is represented as a pair of the universe of discourse, ‘E’, and ‘μ’ is a degree of the fuzzy membership function. The universe of ‘U’ discourse varies from 0 ≤ U ≤1, and the degree of fuzzy membership, (μ), varies from 0 ≤ μ ≤1. Fuzzy rules are framed using fuzzy IF-THEN statements.
Rule 1: IF entropy is LOW, THEN the decay constant of the internal activation unit ‘f’, the decay constant of the dynamic threshold ‘g’, and the threshold magnitude ‘h’ are all LOW.
Rule 2: IF entropy is HIGH, THEN the decay constant of the internal activation unit ‘f’, the decay constant of the dynamic threshold ‘g’, and the threshold magnitude (h) are all HIGH.
Rule 2 is applied to detect Alternaria and Colletotrichum leaf spot and blight, powdery mildew and Pseudocercospora leaf spot disease. Rule 1 is used to spot bacterial blight, leaf web blight, and healthy neem leaves. Fig. 5 shows the pulse image sequence and time sequence diagrams of neem leaf diseases.

Figure 5: Sample time sequence and pulse. Entropy: 0.7941; Iteration 2: A single brown spot; The decay constant (‘f’): 0.7700; Iteration 8: Two brown spots; The decay constant (‘g’): 0.8100; Iteration 16: Brown spots with yellow texture surface; Threshold magnitude (‘h’): 18.6; Iteration 23: The edges of brown spots
3.3.3 Artificial Neuro-fuzzy Classifier
An adaptive neuro-fuzzy classifier is applied to the leaf after it is processed with HOBIN images. The HOBIN-processed leaf images need a classifier algorithm, given the uncertainties that occur when leaves overlap, coupled with the imprecise nature of the input data information available. The adaptive neuro-fuzzy classifier (ANFIS), implemented to handle leaf object recognition, has the advantage of adaptability in terms of combining both the neural network and fuzzy system. The classifier provides the recognition rate, sensitivity, specificity, false positive rate, and F1 score for healthy and disease-affected neem leaves from the confusion matrix. Tabs. 2 and 3 show the statistical analyses of different classifier models.
True Positive (TP): The model correctly predicts the positive class of neem diseases.
False Positive (FP): The model incorrectly predicts the positive class of neem diseases.
True Negative (TN): The model correctly predicts the negative class of neem diseases.
False Negative (FN): The model incorrectly predicts the negative class of neem diseases.
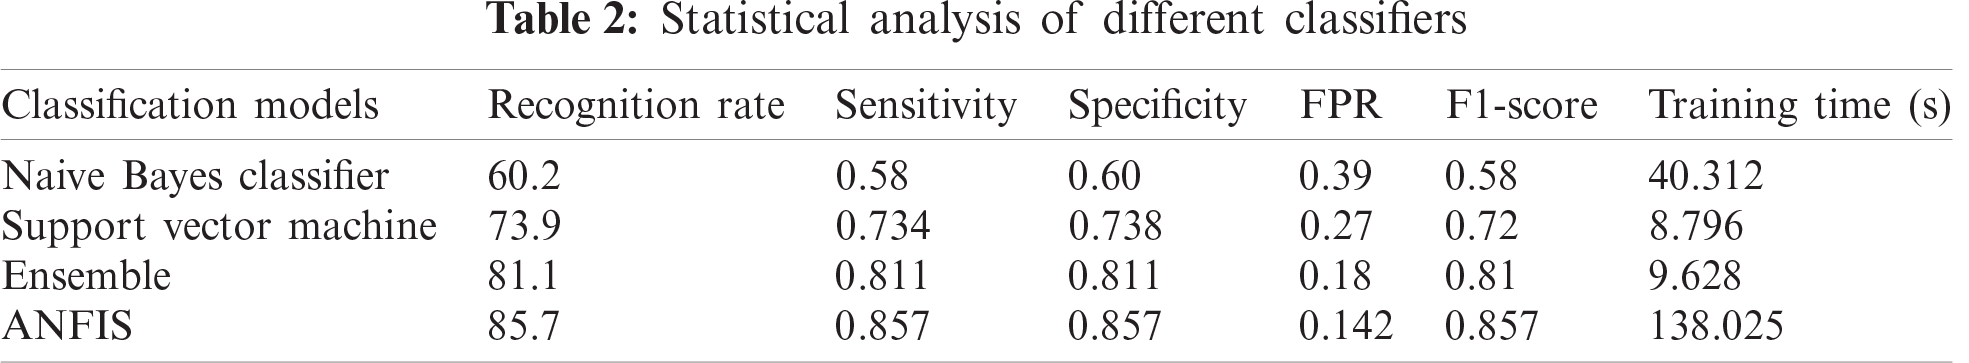
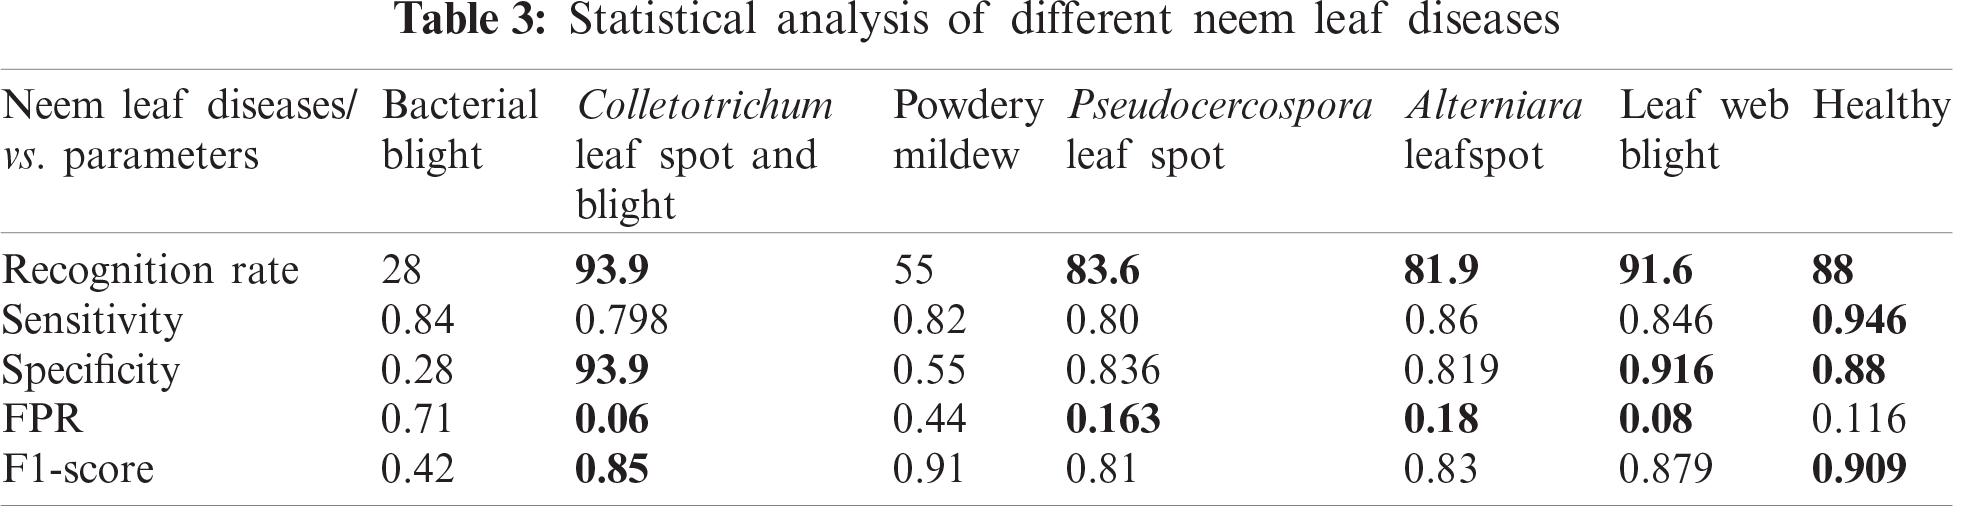
The classifier misclassified powdery mildew and bacterial blight because their symptoms are nearly identical. In the case of powdery mildew, white patches appeared on the neem leaf surface that was examined, but with bacterial blight, the typical dark spot characteristic of the disease appeared between the white patches. The numbers in bold indicate that the proposed neem leaf diagnosis model produces a higher recognition rate and more sensitivity.
4 Experimental Results and Discussion
The proposed method was applied to 1,462 leaf images to diagnose neem leaf disease. The leaves were collected on the basis of seasonal and climatic conditions. They were initially processed with the HOBINM algorithm to extract parameters such as the decay constants of the internal activation unit (‘f’) and dynamic threshold (‘g’), respectively, and the threshold magnitude (‘h’). The parameters were used to fix rules in the fuzzy inference system and obtain the classified image outputs, and a comparison was made with traditional algorithms, as shown in Fig.6. The F-HOBINM classified image was applied to the adaptive neuro-classifier to obtain statistical parameters for each leaf disease, as shown in Tab. 4.

Figure 6: Segmentation results obtained using different methods
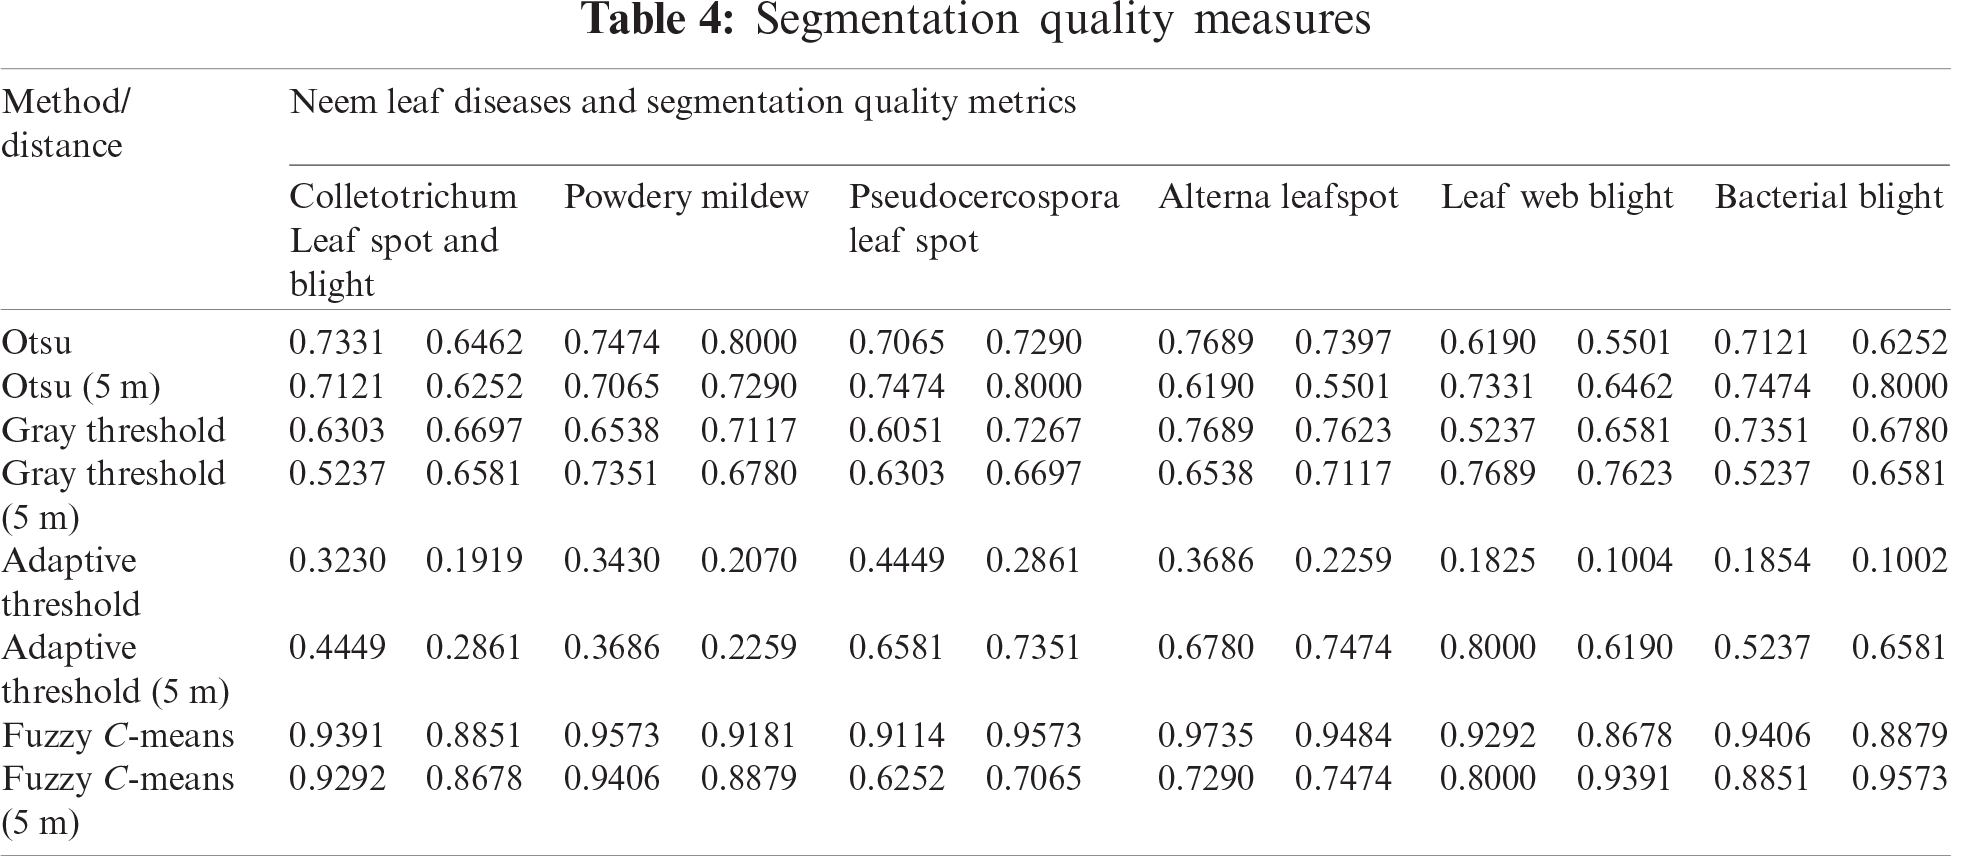
The FCM segmentation algorithm used the Dice and Jaccard quality metrics.
The Jaccard similarity index measures the similarity between the original and segmented images, and the values are between [0, 1]. A similarity index of 1 produces the best image segmentation results.
The Dice similarity index measures the similarity between the original and segmented images, and the values are between [0–1]. A similarity index of 1 produces the best image segmentation results.
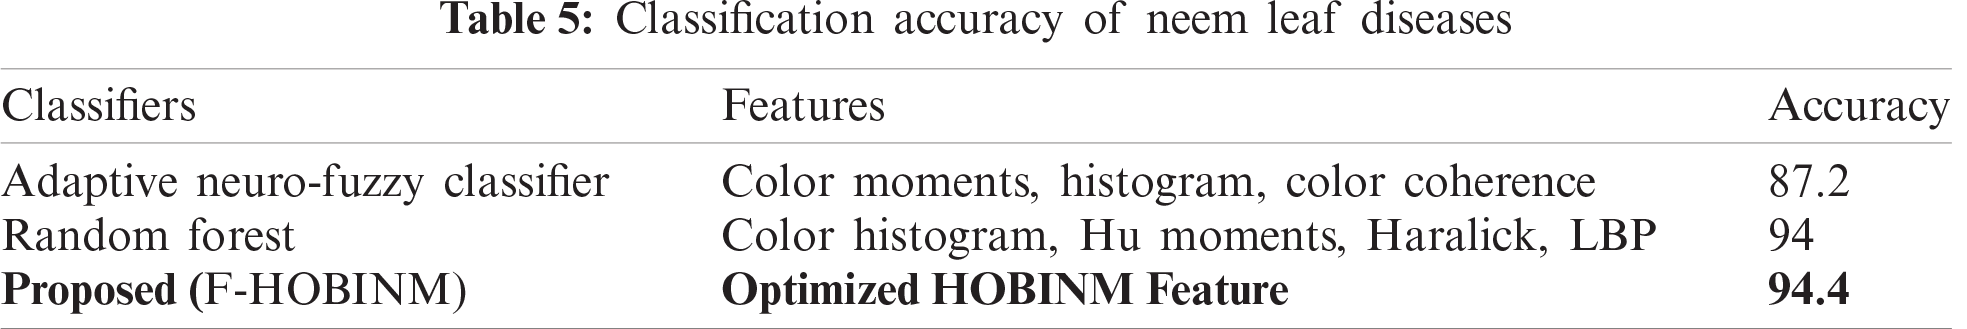
Tab. 5 shows classification accuracy of neem leaf diseases. From Tab. 5, proposed F-HOBINM has produced high classification accuracy compared to other methods.
Neem leaf disease diagnosis calls for image processing, given the nearly-similar symptoms that the different diseases share. The traditional laboratory method is time-consuming and falls short of identifying affected areas on a neem tree, largely because every branch is affected by a different disease. However, it works well at determining disease, assuming it is a single disease that affects the tree in question. This paper proposes establishing neem leaf disease through image processing with the F-HOBINM-ANFIS algorithm. Images were segmented using the FCM and the segmented images passed through the F-HOBINM model for optimal feature extraction. Features were extracted by tuning the decay constants (‘f’, ‘g’) and threshold magnitude (‘h’) parameters of the HOBIN. The laboratory diagnosis was matched with that of the proposed F-HOBINM ANFIS, which identified leaf disease with 92.18% accuracy, owing to the linear discharging capacity of neurons. The proposed F-HOBINM ANFIS algorithm performed well on images acquired using ambient lighting and fluctuating temperatures. However, the ambient noise accumulated in the leaf image during image acquisition needs tuning, particularly in the form of the optimized decay constant and dynamic threshold parameters of the HOBIN neuron model.
Funding Statement: The authors received no specific funding for this study.
Conflicts of Interest: The authors declare that they have no conflicts of interest to report regarding the present study.
1. A. Adeel, M. A. Khan, M. Sharif, F. Azam, J. H. Shah et al., “Diagnosis and recognition of grape leaf diseases: An automated system based on a novel saliency approach and canonical correlation analysis based multiple features fusion,” Sustainable Computing: Informatics Systems, vol. 24, pp. 100349, 2019. [Google Scholar]
2. X. E. Pantazi, D. Moshou and D. Bochtis, “Leaf disease recognition,” in Intelligent Data Mining Fusion Systems in Agriculture. United Kingdom: Academic Press, Ch. No. 7, Sec. No. IV. pp. 241–258, 2020. [Google Scholar]
3. J. Parraga-Alava, K. Cusme, A. Loor and E. Santander, “RoCoLe: A robusta coffee leaf images dataset for evaluation of machine learning based methods in plant diseases recognition,” Data in Brief, vol. 25, no. 17, pp. 104414, 2019. [Google Scholar]
4. S. Ramesh and D. Vydeki, “Recognition and classification of paddy leaf diseases using optimised deep neural network with Jaya algorithm,” Information Processing in Agriculture, vol. 7, no. 2, pp. 249–260, 2020. [Google Scholar]
5. P. K. Sethy, N. K. Barpanda, A. K. Rath and S. K. Behera, “Deep feature based rice leaf disease identification using support vector machine,” Computers and Electronics in Agriulture, vol. 175, no. 1, pp. 105527, 2020. [Google Scholar]
6. S. Zhang, H. Wang, W. Huang and Z. You, “Plant diseased leaf segmentation and recognition by fusion of superpixel, K-means and PHOG,” Optik, vol. 157, no. 2, pp. 866–872, 2018. [Google Scholar]
7. S. Zhang and Z. Wang, “Cucumber disease recognition based on global-local singular value decomposition,” Neurocomputing, vol. 205, no. 5, pp. 341–348, 2016. [Google Scholar]
8. S. Zhang, X. Wu, Z. You and L. Zhang, “Leaf image based cucumber disease recognition using sparse representation classification,” Computers and Electronics in Agriculture, vol. 134, no. 9, pp. 135–141, 2017. [Google Scholar]
9. S. K. Srivastava, “Symptoms of a bacterial disease of neem,” Pest Articles and News Summaries, vol. 16, no. 3, pp. 518–521, 1970. [Google Scholar]
10. S. S. Bhat and K. Girish, “Phomopsis azadirachtae-the die-back of neem pathogen,” Electronic Journal of Biology, vol. 4, no. 3, pp. 112–119, 2008. [Google Scholar]
11. A. Pandey, L. M. S. Palni and K. P. Hebbar, “Suppression of damping-off in maize seedlings by Pseudomonas corrugata,” Microbiological Research, vol. 156, no. 2, pp. 191–194, 2001. [Google Scholar]
12. A. Bhanumathi and V. Ravishankar Rai, “Leaf blight of Syzygium cumini and its management in vitro,” Australasian Plant Disease Notes, vol. 2, no. 1, pp. 117–121, 2007. [Google Scholar]
13. Y. Fang and R. P. Ramasamy, “Current and prospective methods for plant disease detection,” Biosensors, vol. 5, no. 3, pp. 537–561, 2015. [Google Scholar]
14. H. Y. Cai, J. L. Caswell and J. F. Prescott, “Nonculture molecular techniques for diagnosis of bacterial disease in animals: A diagnostic laboratory perspective,” Veterinary Pathology, vol. 51, no. 2, pp. 341–350, 2014. [Google Scholar]
15. J. Jiang, “Fluorescence in situ hybridization in plants: Recent developments and future applications,” Chromosome Reearch, vol. 27, no. 3, pp. 153–165, 2019. [Google Scholar]
16. M. F. Clark and A. N. Adams, “Characteristics of the microplate method of enzyme linked immunosorbent assay for the detection of plant viruses,” Journal of General Virology, vol. 34, no. 3, pp. 475–483, 1977. [Google Scholar]
17. E. Ward, S. J. Foster, B. A. Fraaije and H. A. McCartney, “Plant pathogen diagnostics: Immunological and nucleic acid-based approaches,” Annals of Applied Biology, vol. 145, no. 1, pp. 1–16, 2004. [Google Scholar]
18. L. G. Chitarra and R. W. Van Den Bulk, “The application of flow cytometry and fluorescent probe technology for detection and assessment of viability of plant pathogenic bacteria,” European Journal of Plant Pathology, vol. 109, no. 5, pp. 407–417, 2003. [Google Scholar]
19. L. Spirkovska and M. B. Reid, “Higher-order neural networks applied to 2D and 3D object recognition,” Machine Learning, vol. 15, no. 2, pp. 169–199, 1994. [Google Scholar]
20. I. A. Rybak, N. A. Shevtsova and V. M. Sandler, “The model of a neural network visual preprocessor,” Neurocomputing, vol. 4, no. 1–2, pp. 93–102, 1992. [Google Scholar]
21. K. Zhan, J. Shi, H. Wang, Y. Xie and Q. Li, “Computational mechanisms of pulse-coupled neural networks: A comprehensive review,” Archives of Computational Methods in Engineering, vol. 24, no. 3, pp. 573–588, 2017. [Google Scholar]
22. U. Ekblad and J. M. Kinser, “Theoretical foundation of the intersecting cortical model and its use for change detection of aircraft, cars, and nuclear explosion tests,” Signal Processing, vol. 84, no. 7, pp. 1131–1146, 2004. [Google Scholar]
23. C. Huang, G. Tian, Y. Lan, Y. Peng, E. Y. K. Ng et al., “A new pulse coupled neural network (PCNN) for brain medical image fusion empowered by shuffled frog leaping algorithm,” Frontiers in Neuroscience, vol. 13, no. 210, pp. 1–10, 2019. [Google Scholar]
24. K. Gao, H. Duan, Y. Xu, Y. Zhang and Z. Li, “Artificial bee colony approach to parameters optimization of pulse coupled neural networks,” in IEEE 10th Int. Conf. on Industrial Informatics, Beijing, China, pp. 128–132, 2012. [Google Scholar]
25. M. Mahrous, A. Badr and M. B. Abdelhalim, “Image classification and retrieval using optimised pulse-coupled neural network,” Expert Systems with Application, vol. 42, no. 11, pp. 4927–4936, 2015. [Google Scholar]
26. X. Xu, T. Liang, G. Wang, M. Wang and X. Wang, “Self-adaptive PCNN based on the ACO algorithm and its application on medical image segmentation,” Intelligent Automation and Soft Computing, vol. 23, no. 2, pp. 303–310, 2016. [Google Scholar]
27. X. H. Wang, R. S. H. Istepanian and Y. H. Song, “Microarray image enhancement by denoising using stationary wavelet transform,” IEEE Transaction on Nanobioscience, vol. 2, no. 4, pp. 184–189, 2003. [Google Scholar]
28. L. Guo, L. Chen, Y. Wu and C. L. P. Chen, “Image guided fuzzy C-means for image segmentation,” International Journal of Fuzzy Systems, vol. 19, no. 6, pp. 1660–1669, 2017. [Google Scholar]
29. K. K. Thyagharajan and G. Kalaiarasi, “Pulse coupled neural network based near-duplicate detection of images (PCNN-NDD),” Advances in Electrical and Computer Engineering, vol. 18, no. 3, pp. 87–96, 2018. [Google Scholar]
 | This work is licensed under a Creative Commons Attribution 4.0 International License, which permits unrestricted use, distribution, and reproduction in any medium, provided the original work is properly cited. |