DOI:10.32604/cmc.2021.016298
| Computers, Materials & Continua DOI:10.32604/cmc.2021.016298 | |
| Article |
Sleep Apnea Monitoring System Based on Commodity WiFi Devices
1School of Communication and Information Engineering, Chongqing University of Posts and Telecommunications, Chongqing, 400065, China
2School of Computing Technologies, RMIT University, Melbourne, Victoria, 3001, Australia
*Corresponding Author: Liangbo Xie. Email: xielb@cqupt.edu.cn
Received: 29 December 2020; Accepted: 19 May 2021
Abstract: To address the limitations of traditional sleep monitoring methods that highly rely on sleeping posture without considering sleep apnea, an intelligent apnea monitoring system is designed based on commodity WiFi in this paper. By utilizing linear fitting and wavelet transform, the phase error of channel state information (CSI) of the receiving antenna is eliminated, and the noise of the signal amplitude is removed. Moreover, the short-time Fourier transform (STFT) and sliding window method are combined to segment received wireless signals. Finally, several important statistical characteristics are extracted, and a back propagation (BP) neural network model is built to identify apnea state. Thus, interferences caused by changes of sleeping posture are eliminated. Extensive experimental results demonstrate that the proposed system can identify apnea state with an accuracy of over 95.6%. Furthermore, the accuracy can still reach more than 94.8% when the test environment layout is changed. Therefore, the proposed system can be used as a daily apnea monitoring system at home and provide users with health information.
Keywords: WiFi; channel state information; apnea; neural network
In recent years, researchers have proposed several methods to monitor people’s health through recognizing human behaviors [1–4]. As humans spend about one-third of their life sleeping, detecting sleep quality is particularly significant. Traditional monitoring methods of sleep quality mainly focus on detecting brain waves [5] or heartbeat [6]. However, these methods do not work well, as breathing also plays a very important role in sleep. Some common commercial devices analyze sleep quality from data collected by a headset or wristband worn by the user. Alternatively, some devices use pressure sensor arrays embedded in the mattress to monitor sleeping disorders. These devices still have some shortcomings, such as being uncomfortable to wear, unsuitable for daily use, or quite expensive.
Recently, sleep monitoring devices based on radar have gained more and more attention. Because radar works without physical contact, it is widely used in research on breathing detection. The WiSpiro developed by Nguyen et al. [7] uses frequency modulated continuous wave (FMCW) radar. To reconstruct chest and abdomen movements, it utilizes a phase demodulation algorithm to analyze changes of phase in the continuous wave signal sent by the 2.4 GHz directional antenna. Its main disadvantages are that it requires customized hardware and takes a long time to scan the experimenter. If the experimenter moves frequently during the scanning process, the scanning process will be further affected. The Vital-Radio system proposed by Adib et al. [8] uses a bandwidth of 5.46–7.25 GHz to track the user’s breathing and heart rate, which not only requires additional customized hardware equipment but also has a high operating frequency.
Radio frequency identification (RFID) tags have the advantages of simple structure and reading equipment, so they are often used for vital sign monitoring [9]. The Tagbreathe [10] system attaches a lightweight RFID tag to the user’s clothes to backscatter radio waves. By analyzing the low-level data obtained by the RFID reader, it can track the periodic movements of the chest and abdomen caused by inhalation and exhalation. In addition, it utilizes phase information to estimate the respiratory frequency. However, the security of RFID technology is relatively poor, so tag information can easily be read illegally or tampered with maliciously.
Because WiFi devices are ubiquitous and WiFi signals have almost no effect on the human body, researchers are interested in studying various WiFi-based applications, such as localization [11–13], target detection [14], behavior recognition [15], and industrial Internet of Things (IIoT) [16,17]. The Ubibreathe proposed by Abdelnasser et al. [18] utilizes the received signal strength indication (RSSI) to estimate breathing. The received RSSI signal is filtered with a cut-off frequency of 0.1–0.5 Hz. The discrete wavelet transform is used to remove the noise in the signal, and the fast Fourier transform is used to estimate the respiratory frequency. However, this system is accurate only when the WiFi device is very close to the chest. Compared with RSSI, channel state information (CSI) not only contains carrier amplitude information but also provides phase information of each carrier. Since CSI possesses higher fine-granularity, it provides the potential for more accurate breath detection. Liu et al. [19] developed a technique using CSI amplitude and phase difference to capture the tiny movements caused by breathing and heartbeat. Based on the obtained tiny movements, the respiratory frequency is estimated. Phasebeat, proposed by Wang et al. [20], uses wavelet transform to reconstruct the respiratory signal and heart rate signal to monitor vital signs. TR-BREATH, designed by Chen et al. [21], projects the acquired CSI information into the time-reversed resonance intensity feature space and uses Root-Music and other algorithms to analyze the time-reversed resonance intensity to estimate the respiratory frequency. Mo-Sleep, introduced by Li et al. [22], eliminates the influence of phase error on breathing and uses principal component analysis (PCA) to extract breathing signals.
However, the above-mentioned detection systems have some limitations, such as requiring additional hardware equipment, offering poor privacy, being affected by light intensity, and failing to consider various situations that may occur in actual sleep. Hence, in this study, a new intelligent system is proposed for daily sleep monitoring. By setting two commercial WiFi devices as the transmitter and receiver, a WiFi-based detection system is formed to detect the sleep state of the experimenters. First, the received CSI phase information is corrected. Second, the noise, interference, and outliers of the corrected CSI information are eliminated. Next, a signal segmentation algorithm is designed, and the subcarriers with the most obvious motion changes are selected. Then the CSI signal amplitude is normalized. The time-domain and frequency-domain information is utilized to segment the signal. Finally, the segmented fragments are used to extract features and construct a classifier for detection and recognition. The proposed system does not require the experimenter to carry any equipment, nor does it need to modify the relevant hardware to detect breathing. It is suitable for daily use and features a low cost and excellent privacy.
To simulate the breathing states that may occur during sleeping, the experimenter is required to breathe normally in the test area to simulate normal breathing, hold their breath to simulate the apnea state, and get up and leave the test area to simulate the unmanned state.
Fig. 1 shows the diagram that describes the relationship between chest and abdomen fluctuations caused by breathing and lung capacity. From the intermediate state to the inhalation process, the expansion of the chest and abdomen causes the lung capacity to increase to the maximum. On the contrary, from the intermediate state to the exhalation process, the contraction of the chest and abdomen causes the lung volume to reach a minimum.
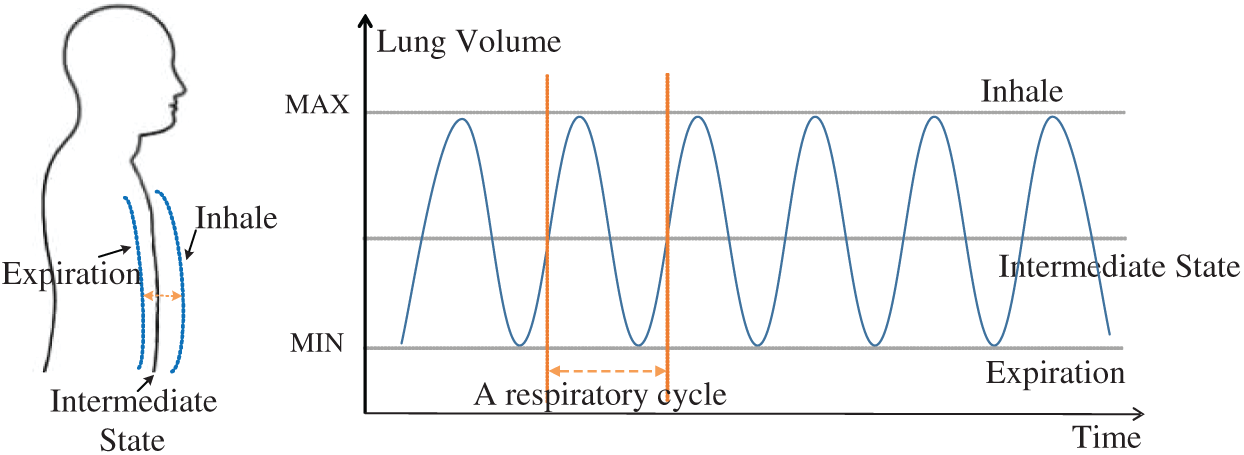
Figure 1: Simulation of the relationship between the undulation of chest and abdomen and lung volume
The proposed WiFi-based sleep-state detection process can be divided into two stages: offline and online, as shown in Fig. 2. In the offline phase, the CSI data of the unmanned state, breathing state, and apnea state are collected separately. Then, the data are preprocessed to eliminate phase errors and noise interference in the environment. After that, the final optimal subcarrier is selected. Finally, the features of the three states are extracted to construct a detection classifier. In the online phase, data are collected and preprocessed, and signal features are extracted in the same way. Finally, the classifier constructed in the offline phase is used to complete the detection of the sleep state, and the time node of each state is recorded.
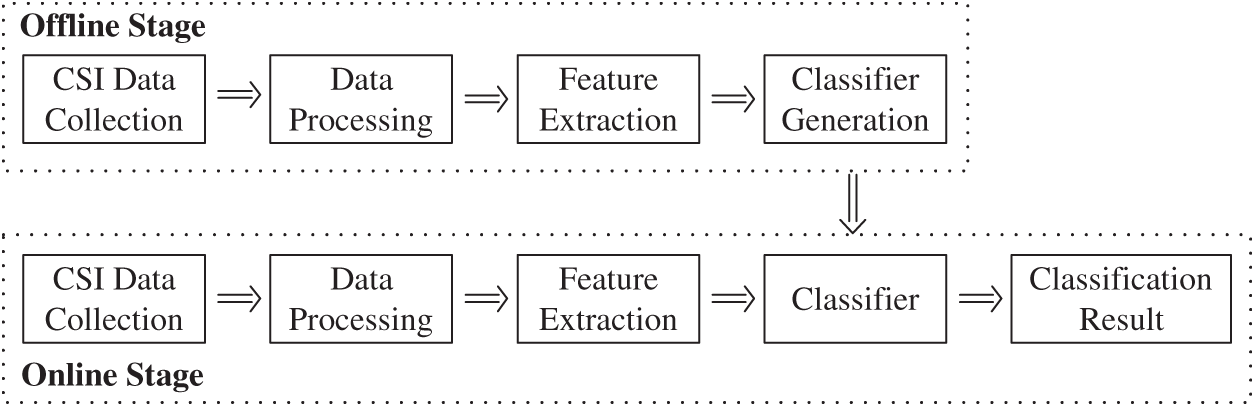
Figure 2: Architecture of the proposed intelligent home WiFi-based detection system for sleep apnea
In IEEE 802.11n/ac, orthogonal frequency division multiplexing (OFDM) is used to measure and analyze CSI from the physical layer. In the frequency domain, the amplitude and phase of subcarriers can be used to characterize wireless channel state information. To characterize multipath propagation, wireless channels are usually modeled with channel impulse response (CIR), which can be expressed as:
where
where
Similarly, the received signal spectrum
CSI is the sampling of CFR. Assuming that there are K subcarriers on one antenna and M packets are received, the CSI can be expressed as a matrix:
where
In the test environment, the clocks of both the sender and the receiver in the WiFi network are not synchronized, and the detection delay of the data packet and the insufficient accuracy of the device will cause problems such as carrier frequency offset and sampling frequency offset. Therefore, the received CSI phase needs to be processed. The received phase consists of the true phase value and the offset value:
where
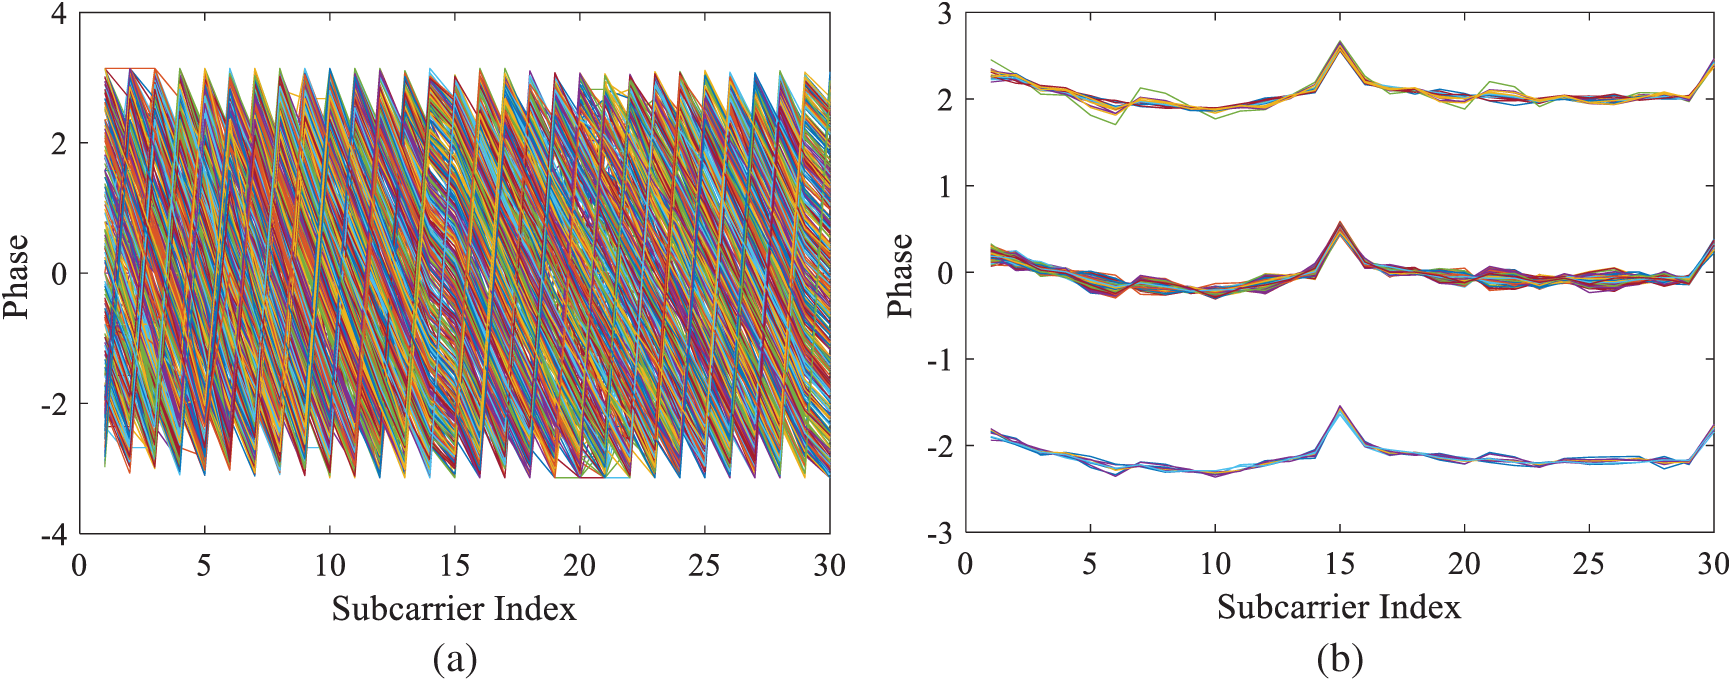
Figure 3: The results before and after the subcarrier phase linearity errors are eliminated: (a) Subcarrier phase before linear errors eliminated; (b) Subcarrier phase after linear error eliminated
Due to the presence of noise, the required useful signal often cannot be extracted for subsequent processing. Since the frequency range of breathing is generally 0.2–0.75 times/s, and there are often a lot of high-frequency noises in the actual received data, it is necessary to use the wavelet denoising method to process the CSI amplitude. In this paper, “db3” is used as the wavelet basis to decompose the signal into five layers. The comparison results before and after denoising are shown in Figs. 4a and 4b. Before denoising, the regularity of signal fluctuation is submerged in noise; after denoising, the waveform becomes smooth, reflecting the regularity of fluctuation of the channel with the change of breathing. The signal frequency cumulative distribution function (CDF) before and after denoising is shown in Fig. 5. Before denoising, the real signal is almost covered by high-frequency noise; after denoising, the signal frequency is nearly concentrated at the low frequency, which can get a better denoising effect.
Due to the different carrier frequencies of subcarriers in OFDM, variations caused by diverse states are also different; therefore, the most obvious subcarrier needs to be extracted. The variation of CSI amplitude is used to quantify the sensitivity of subcarriers to the sleep state. Assuming the signal length (the number of data packets) is M, the variance
where
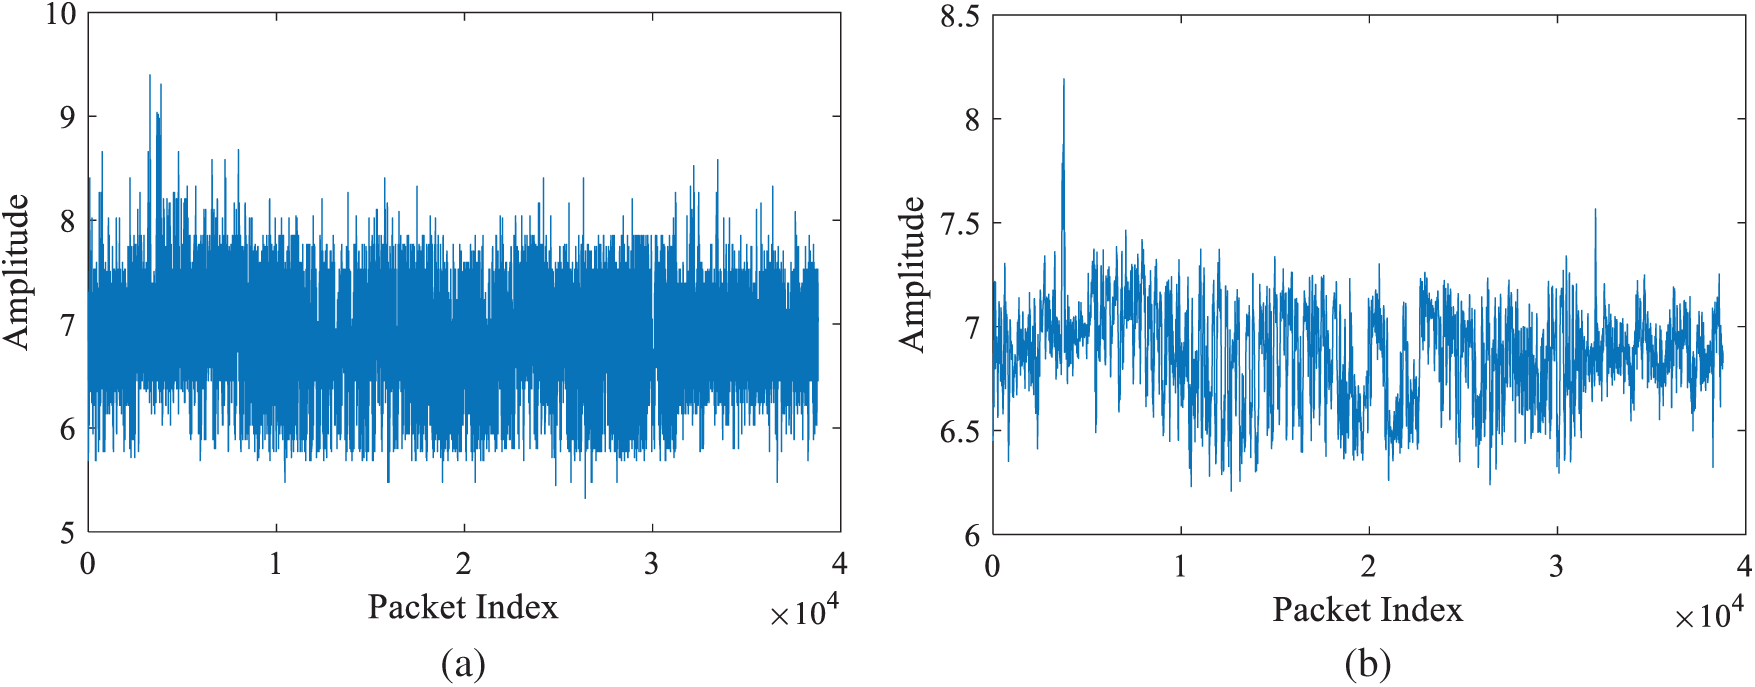
Figure 4: Comparison of CSI amplitude before and after high-frequency noise cancellation: (a) CSI amplitude before removing high-frequency noise; (b) CSI amplitude after removing high-frequency noise
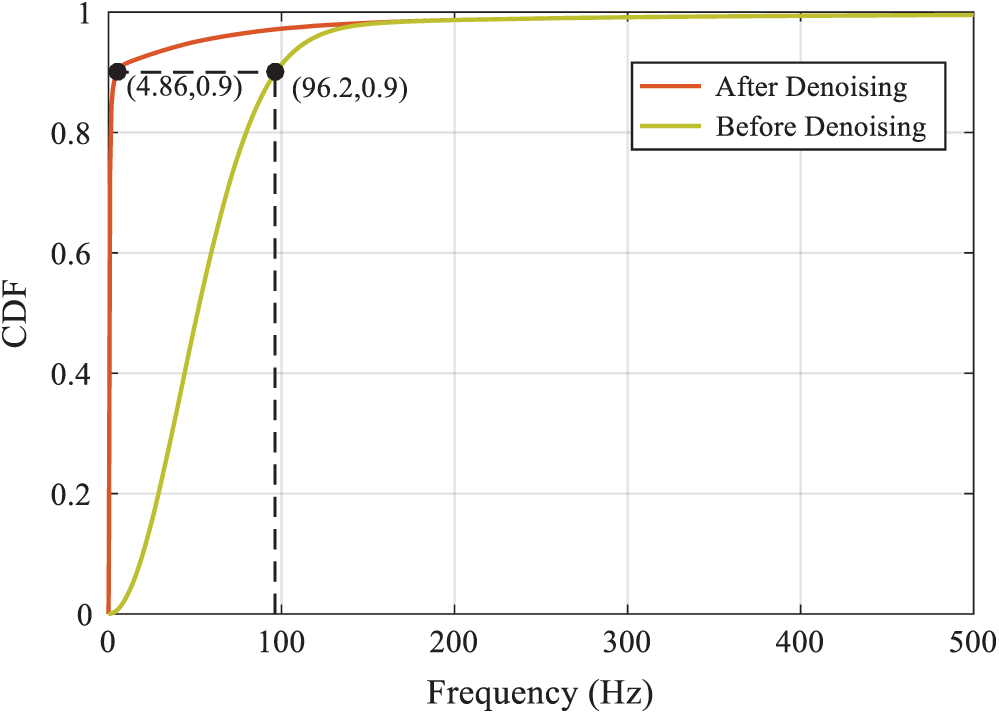
Figure 5: CDF diagram of frequency before and after CSI amplitude noise removal
Since the collected data may contain the situations in which the experimenter is in the apnea state or the experimenter leaves the test area, these segments need to be segmented from the data and judged accurately in order to monitor the sleep state. Therefore, a sliding window-based method [15] is used to segment the signal.
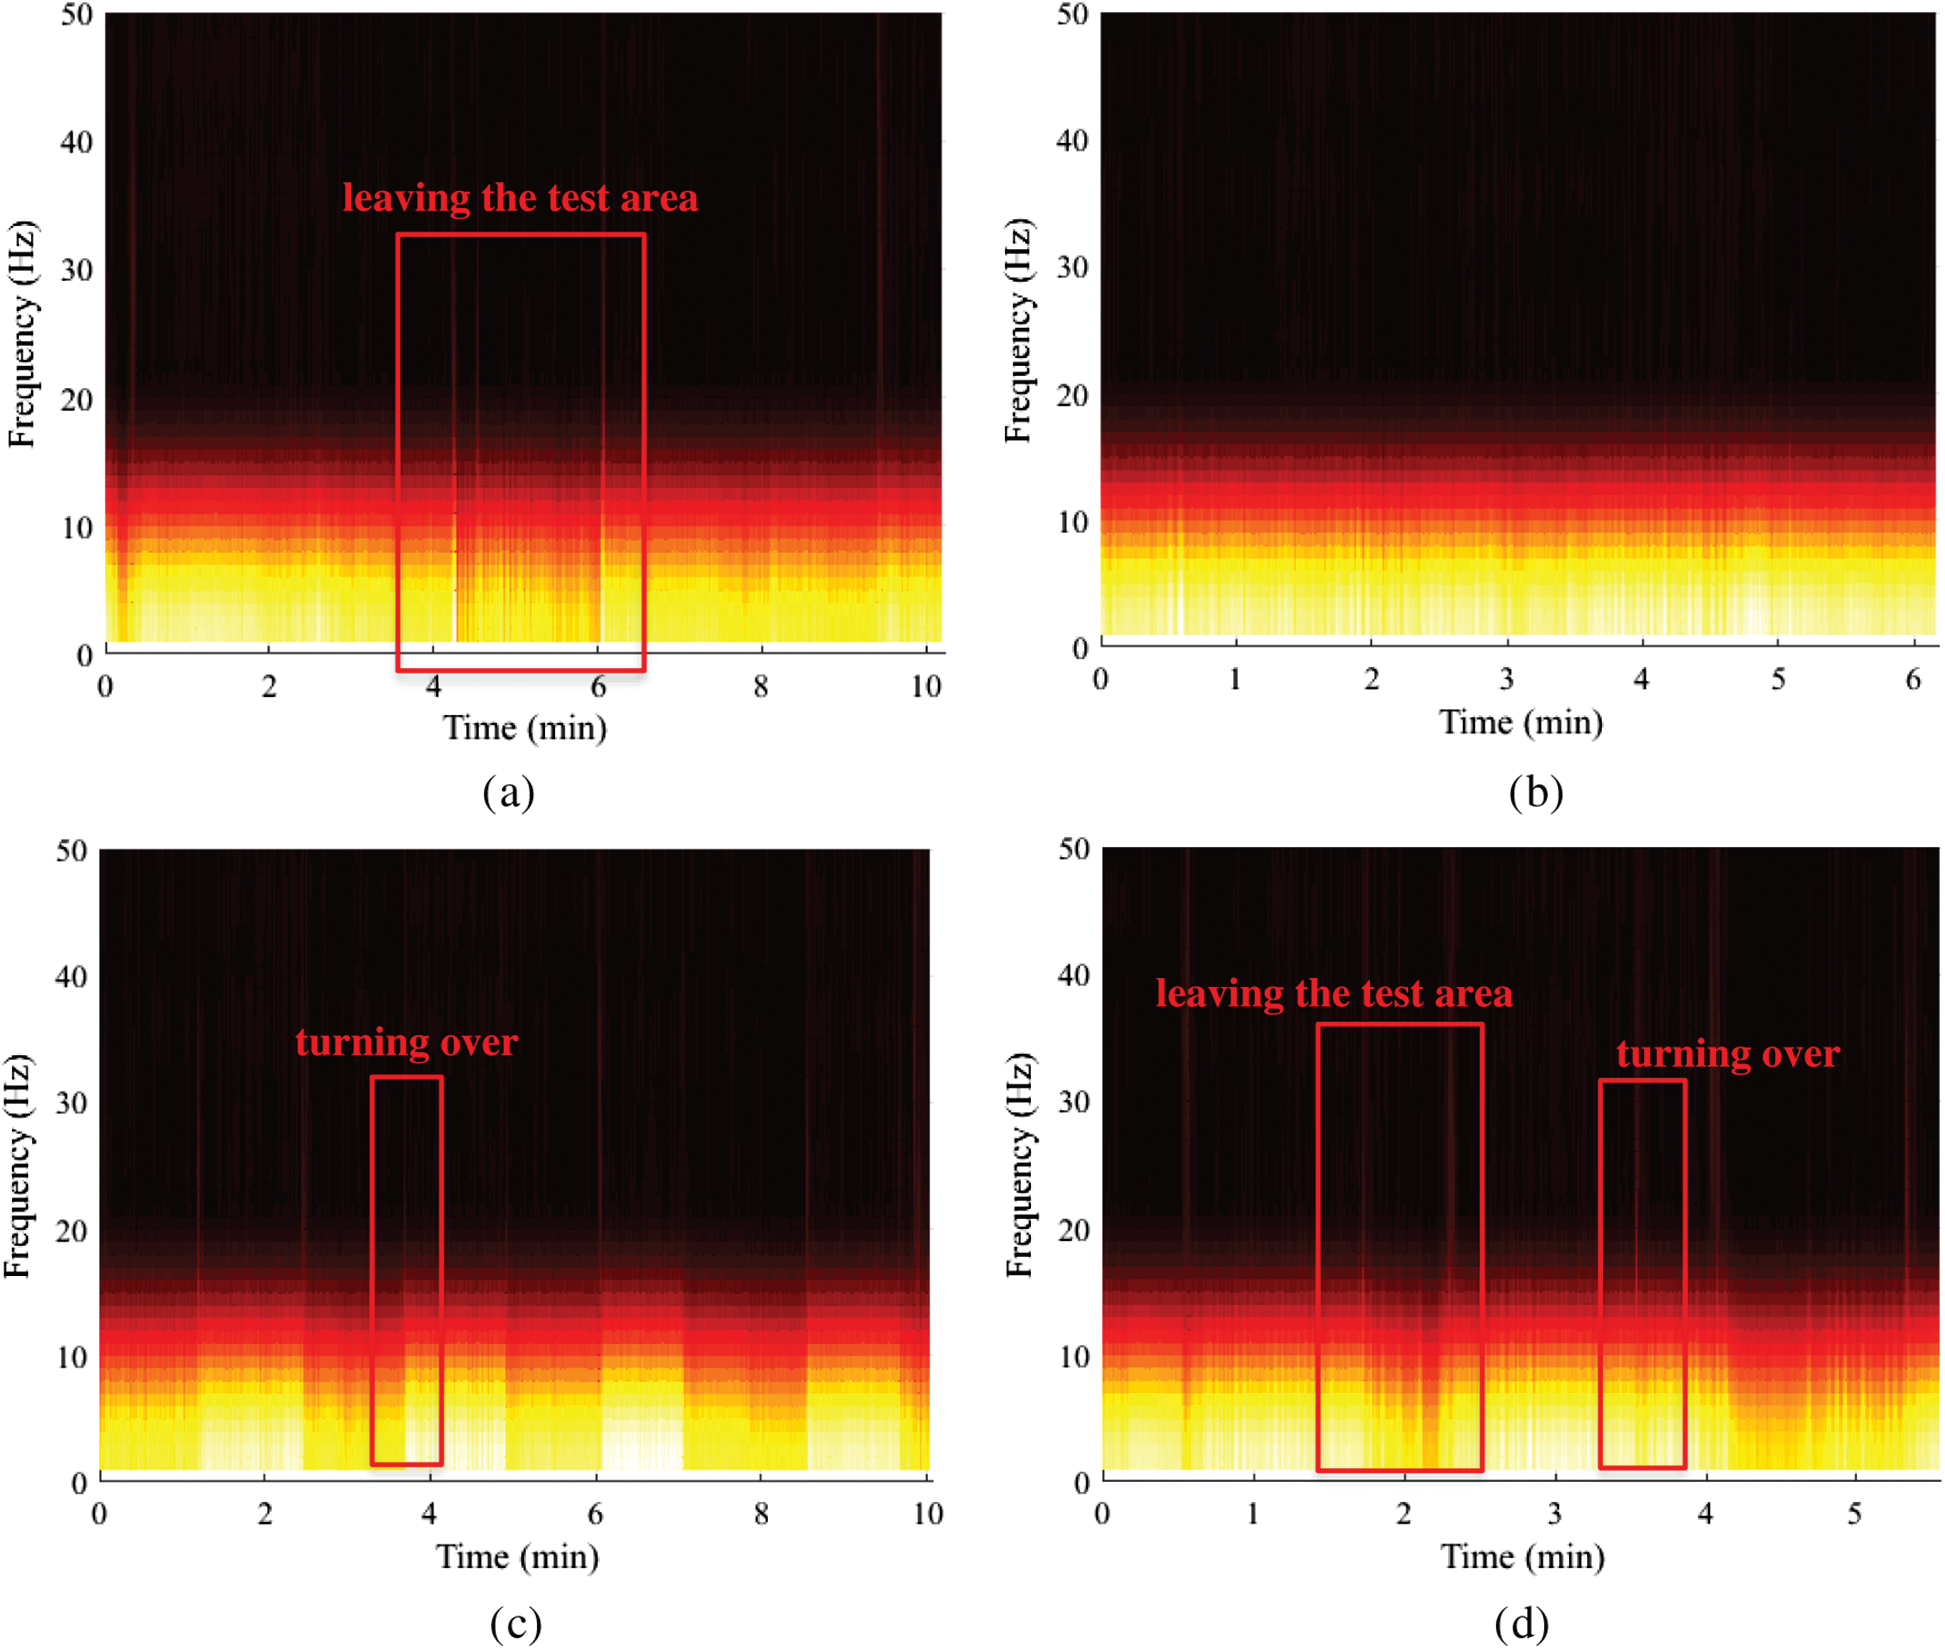
Figure 6: Time-frequency diagram of CSI signal after short-time Fourier transform: (a) Sleep fragment that includes getting up; (b) Sleep fragment that only contains breathing; (c) Sleep fragment that includes turning over; (d) Sleep fragment that includes getting up and turning over
As shown in Fig. 6, a variety of situations may occur in the sleep state. When the experimenter turns around or gets up and leaves the test area, the frequency range is higher than the respiratory rate. Thus, the short-time Fourier transform is used to process the signal. First, the data are cut off from the high frequency to obtain multiple clips without turning over and getting up. Next, assuming that the window length is N and the signal length is M, the variance
In (8), n represents the number of windows and the value range is
The signal is then processed based on the signal segmentation algorithm flow given in Tab. 1.
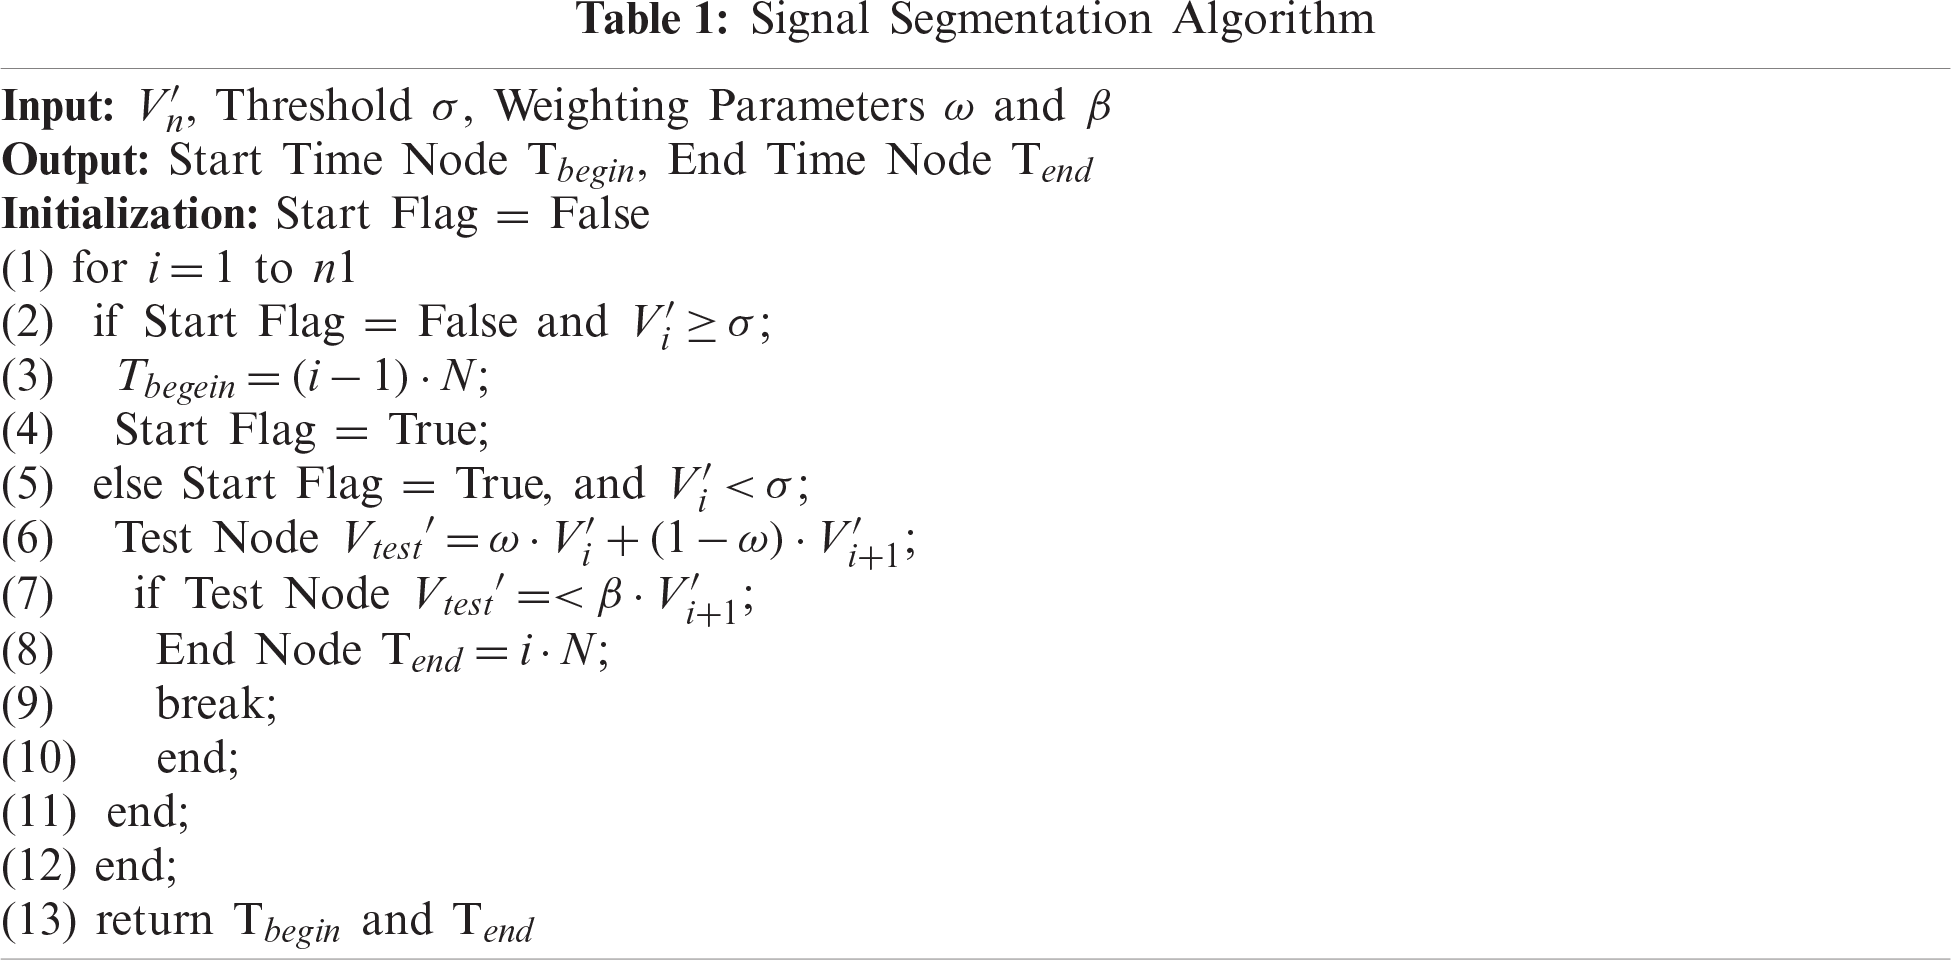
After adjusting the parameters many times, in this paper, the threshold
In this paper, the diversity in the phase difference between antennas in the presence of breathing, apnea state, and unmanned state is used to detect the sleep of the experimenter by calculating the phase difference D between the antennas, and calculating its mean
where
In this paper, the BP neural network is adopted to learn and map the feature set, the structure of which is shown in Fig. 7. It includes three parts: input layer, hidden layer, and output layer. Among them, [F1, F2, …, FI] represents the input feature; [ω1, ω2, …, ωH] represents the weight of the connection between neurons; and [O1, O2, O3] represents the output label. H is set to be 10, which is the number of neurons in the hidden layer.
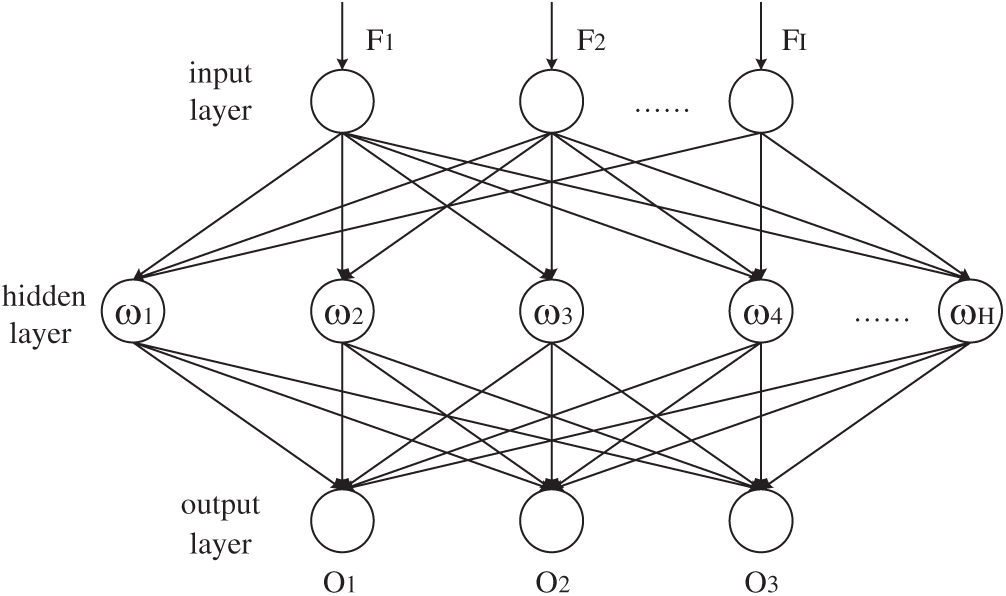
Figure 7: BP neural network structure diagram
6.1 Experimental Environment Design
In this paper, two ProBox23 Mini hosts, each equipped with an Intel 5300 wireless network interface card (NIC), are used as transmitters and receivers, as shown in Fig. 8a. The Linux system is installed on the Mini hosts, and the corresponding CSI acquisition tool is built. The transmitter transmits data with a directional antenna, and the receiver has three antennas for receiving signals. Two layouts are used in the experiments: a typical conference office, shown in Fig. 8b, and a vacant room simulating a relatively empty bedroom, shown in Fig. 8c. In the office, the experimenter lies flat on the desk to imitate the sleep state. In the vacant room, the transmitter and receiver are placed on both sides of the experimenter lying flat on a camp bed to simulate the real sleep state.
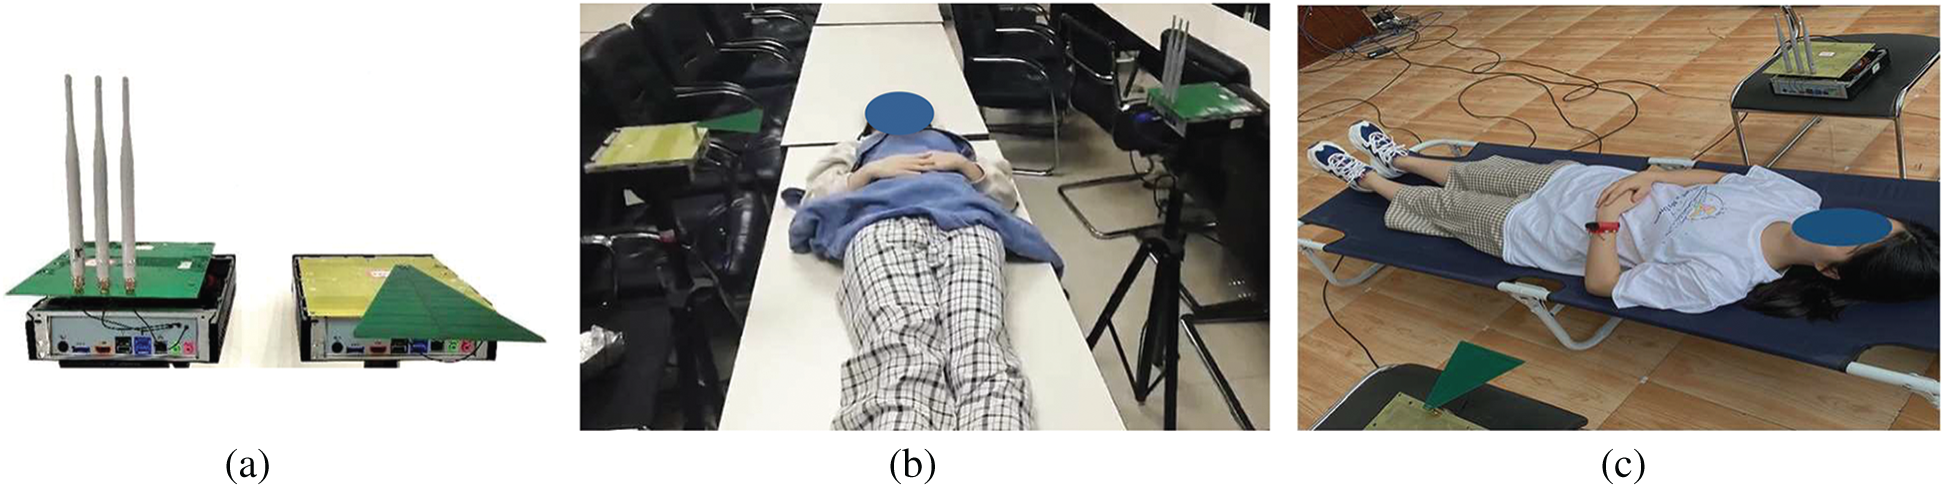
Figure 8: Experimental equipment and scene: (a) Transmitter and receiver; (b) The office circumstance layout; (c) The vacant circumstance layout
Parameters are set as follows: channel 149 with a center frequency of 5.749 GHz is chosen for data transmission and reception; the packet sending rate is set to be 500 packets per second; the data are collected in the form of mobile phone timing; and the training data duration is set to be 10 s per group. Online data simulation sleep states are collected for 3, 5, and 10 min in each of three groups. During that time, the periods of the experimenter getting up and simulating apnea are recorded using mobile phone timing.
In [23], it is proven that the receiver, transmitter, and human chest and abdomen sections in an indoor line of sight (LOS) environment conform to the Fresnel zone of radio wave propagation. When the human body is lying flat, the chest and abdomen fluctuate most obviously with breathing. Therefore, the sending and receiving distances are set to be 90 cm. Over the course of a few months, data on the three states of unmanned, apnea, and human breathing from some experimental persons of different heights and weights are collected. A total of 450 sets of data are collected as offline data. The extracted features constitute the training data set in the offline stage. Features of the segments are extracted to form the test data set after signal segmentation in the online phase. Inevitably, there is a certain degree of packet loss in the actual collection process. After testing, the packet loss rate is very low and hardly affects the detection results of the algorithm. Therefore, the impact of packet loss on the experimental results can be ignored.
For the classification, the performance of the extracted signal features through the feature distribution map is observed, and two of the features are taken randomly to draw the feature distribution scatter diagram, as shown in Fig. 9. It can be seen from Fig. 9a that since apnea is similar to the unmanned state, there is a small amount of confusion between the first feature and the third feature. However, as shown in Fig. 9b, the first feature and the second feature are almost free of confusion and they have a clear distribution area, which can better distinguish the presence of breathing, apnea state, and unmanned state.
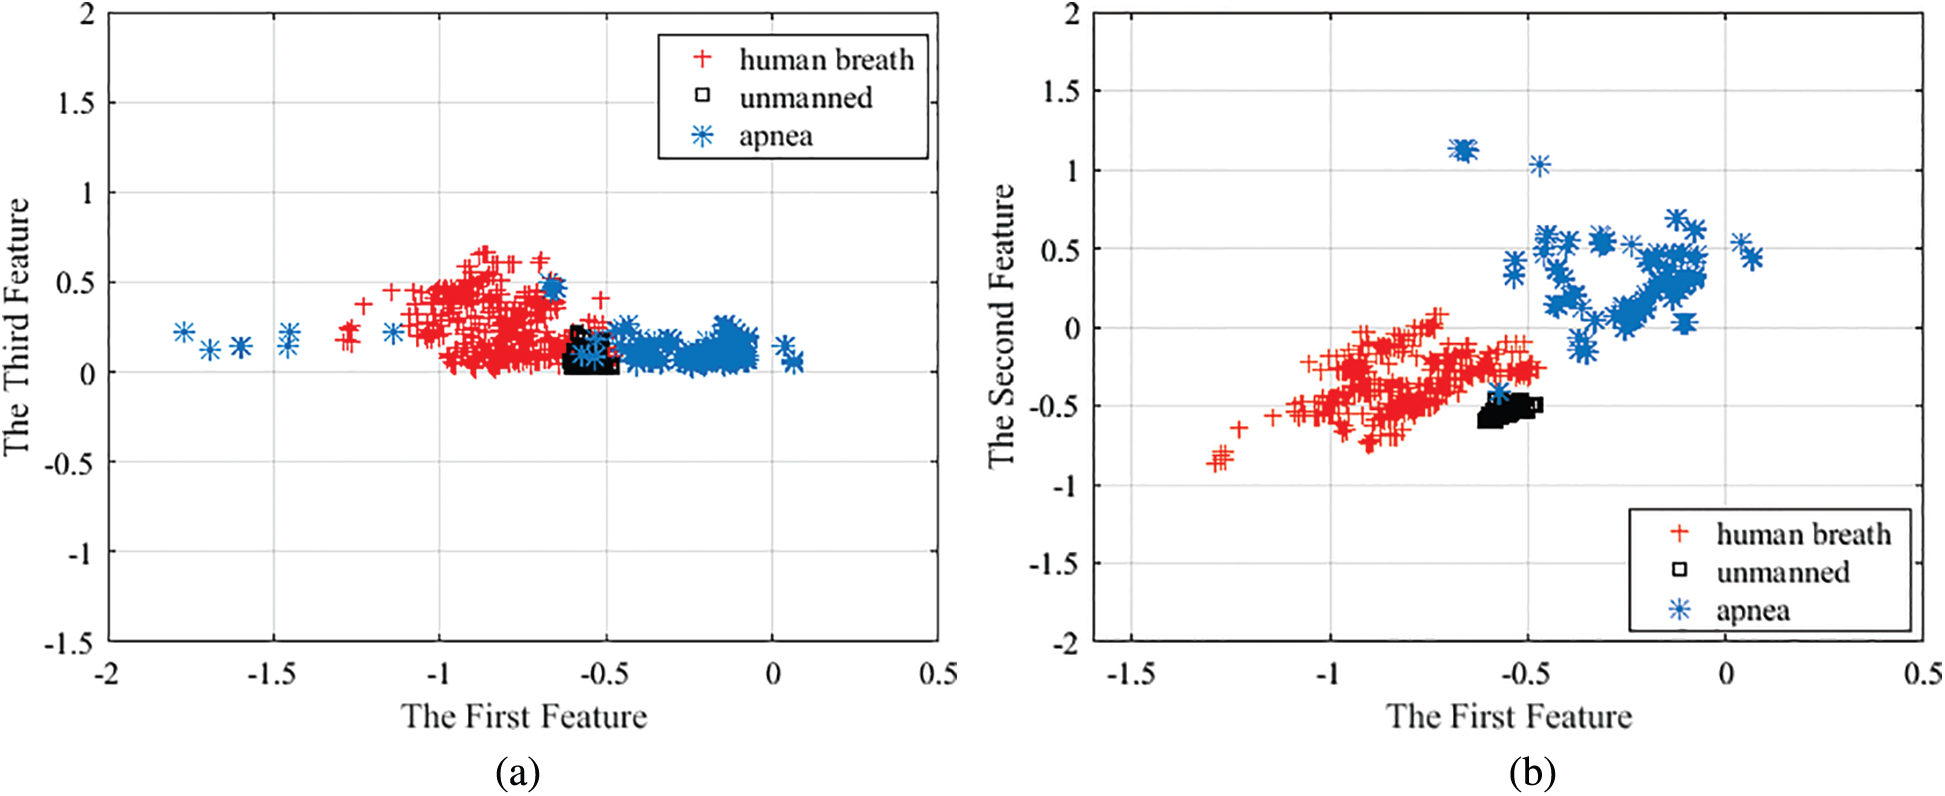
Figure 9: Scatterplot of feature distribution: (a) Scatterplot of the distribution of the first and third features; (b) Scatterplot of the distribution of the first and second features
The confusion matrix in the scene pictured in Fig. 8b obtained after the classification is shown in Fig. 10. Then, its precision and recall are calculated as:

Figure 10: Classification confusion matrix of three states in the scene pictured in Fig. 8b
In (11), TP is defined as “predicted value is positive and the actual value is also positive,” FP is defined as “predicted value is positive, whereas the actual value is negative,” and FN is defined as “predicted value is negative, whereas the actual value is positive.” Combining Figs. 10 and 11, the precision values for the presence of breathing, apnea state, and unmanned state are 96.12%, 98.85%, and 99.33%, respectively, and the recall values are 99.11%, 95.56%, and 99.56%, respectively. Then, macro F1-Score is used as a measurement indicator to perform a weighted average:
According to (12), the macro F1-Score is about 0.98. The greater the values of precision and recall in the macro F1-Score comprehensive model, the higher the quality of the classification model.
6.3 Impact of Environmental Changes
When the detection environment moves from the environment shown in Fig. 8b to the environment shown in Fig. 8c, the detection accuracy of apnea state is 95.1%, and the classification confusion matrix is shown in Fig. 11. After making massive changes to the positions of the table and chair in the environment shown in Fig. 8b, the accuracy rate can still reach 94.8%, and the classification confusion matrix is shown in Fig. 12.

Figure 11: Classification confusion matrix of three states in the scene pictured in Fig. 8c
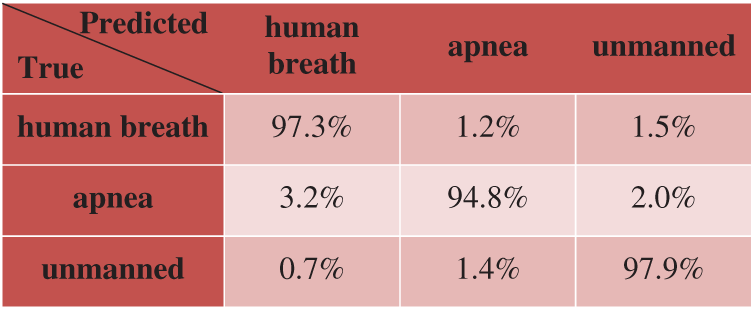
Figure 12: Classification confusion matrix of three states in the scene pictured in Fig. 8c where the position of the furniture is changed
The changes of environment tested in this study do not have a significant impact on the proposed algorithm, which demonstrates the robustness of the proposed system. The reason is that the signal characteristics extracted are based on the phase difference between the antennas of the channel under different conditions, which is a dynamic characteristic. The variation of the indoor environment and the placement of furniture only affect the absolute parameters of the channel, such as the attenuation coefficient or multipath propagation delay, which do not have an effective impact on the experimental results of this article.
In this paper, an intelligent sleep apnea monitoring system is proposed to detect sleep status through commercial WiFi devices. First, a signal model is built, and the received signal is preprocessed. Then, the time-domain and frequency-domain information is combined to design a segmentation algorithm that selects the optimal subcarrier and segments the signal subsequently. Finally, the features of segments are extracted, and a classifier is constructed to detect the presence of breathing, apnea state, and unmanned state. Experimental results show that the proposed system can achieve a recognition accuracy of more than 95.6% for identifying the presence of breathing, apnea state, and unmanned state while eliminating the interference of CSI. Even when the layout of the experiment environment is changed, the detection rate can still reach over 94.8%. The proposed system can be used as a daily apnea monitoring system to provide health information to users. As this system is designed for individual detection, the signal propagation path and the detection accuracy will be affected when there are multiple people in the test area, or the human body is in a non-flat posture. In the future, the scenario with multiple people will be considered.
Funding Statement: This work was supported by the National Natural Science Foundation of China (61771083, 61704015), Science and Technology Research Project of Chongqing Education Commission (KJQN201800625), and Chongqing Natural Science Foundation Project (cstc2019jcyj-msxmX0635).
Conflicts of Interest: The authors declare that they have no conflicts of interest to report regarding the present study.
1. A. M. Jamel and B. Akay, “Human activity recognition based on parallel approximation kernel K-means algorithm,” Computer Systems Science and Engineering, vol. 35, no. 6, pp. 441–456, 2020. [Google Scholar]
2. A. Gumaei, M. Al-Rakhami, H. AlSalman and S. M. M. Rahman, “Dl-har: Deep learning-based human activity recognition framework for edge computing,” Computers, Materials & Continua, vol. 65, no. 2, pp. 1033–1057, 2020. [Google Scholar]
3. M. H. Kabir, K. Thappa, J. Yang and S. Yang, “State-space based linear modeling for human activity recognition in smart space,” Intelligent Automation & Soft Computing, vol. 25, no. 4, pp. 673–681, 2019. [Google Scholar]
4. Z. Liu, X. Wang, C. Sun and K. Lu, “Implementation system of human eye tracking algorithm based on FPGA,” Computers, Materials & Continua, vol. 58, no. 3, pp. 653–664, 2019. [Google Scholar]
5. J. Carrier, I. Viens, G. Poirier and R. Robillard, “Sleep slow wave changes during the middle years of life,” European Journal of Neuroence, vol. 33, no. 4, pp. 758–766, 2015. [Google Scholar]
6. Z. Jia, R. E. Howard, Y. Zhang and P. Zhang, “Demo abstract: HB-phone: A bed-mounted geophone-based heartbeat monitoring system,” in IPSN, Pittsburgh, PA, pp. 275–276, 2017. [Google Scholar]
7. P. Nguyen, X. Zhang, A. Halbower and T. Vu, “Continuous and fine-grained breathing volume monitoring from afar using wireless signals,” in IEEE INFOCOM, 2016-The 35th Annual IEEE Int. Conf. on Computer Communications, San Francisco, CA, pp. 1–9, 2016. [Google Scholar]
8. F. Adib, H. Mao, Z. Kabelac, D. Katabi and R. C. Miller, “Smart homes that monitor breathing and heart rate,” in Proc. of the 33rd Annual ACM Conf. on Human Factors in Computing Systems, New York, NY, pp. 837–846, 2015. [Google Scholar]
9. T. Zhang, L. Yi, X. Cui, A. Behl and F. Dong, “RFID based non-preemptive random sleep scheduling in WSN,” Computers, Materials & Continua, vol. 65, no. 1, pp. 835–845, 2020. [Google Scholar]
10. Y. Hou, Y. Wang and Y. Zheng, “TagBreathe: Monitor breathing with commodity RFID systems,” in 37th IEEE Int. Conf. on Distributed Computing Systems, Atlanta, GA, pp. 404–413, 2017. [Google Scholar]
11. L. Sun, L. Tan, W. Ma and J. Xia, “Research on indoor passive position technology based on WiFi,” Journal of Internet of Things, vol. 2, no. 1, pp. 23–35, 2020. [Google Scholar]
12. J. Wang, Z. Tian, X. Yang and M. Zhou, “TWPalo: Through-the-wall passive localization of moving human with Wi-Fi,” in 2019 IEEE Global Communications Conf., Waikoloa, HI, pp. 1–6, 2019. [Google Scholar]
13. Z. Tian, Y. Lian, M. Zhou, Z. Li and Y. Jin, “Passive target tracking technology based on Wi-Fi multi-dimensional parameter feature,” Tien Tzu Hsueh Pao/Acta Electronica Sinica, vol. 48, no. 8, pp. 1572–1579, 2020. [Google Scholar]
14. X. Yang, S. Wu, M. Zhou, L. Xie, J. Wang et al., “Indoor through-the-wall passive human target detection algorithm,” Journal of Electronics and Information Technology, vol. 42, no. 8, pp. 603–612, 2020. [Google Scholar]
15. X. Wu, Z. Chu, P. Yang, C. Xiang, X. Zheng et al., “TW-See: Human activity recognition through the wall with commodity Wi-Fi devices,” IEEE Transactions on Vehicular Technology, vol. 68, no. 1, pp. 306–319, 2019. [Google Scholar]
16. X. Liu, X. Zhai, W. Lu and C. Wu, “QoS-guarantee resource allocation for multibeam satellite industrial internet of things with NOMA,” IEEE Transactions on Industrial Informatics, vol. 17, no. 3, pp. 2052–2061, 2021. [Google Scholar]
17. X. Liu and X. Zhang, “NOMA-based resource allocation for cluster-based cognitive industrial internet of things,” IEEE Transactions on Industrial Informatics, vol. 16, no. 8, pp. 5379–5388, 2020. [Google Scholar]
18. H. Abdelnasser, K. Harras and M. Youssef, “Ubibreathe: A ubiquitous non-invasive WiFi-based breathing estimator,” in Proc. of the 16th ACM Int. Symp. on Mobile Ad Hoc Networking and Computing, New York, NY, pp. 277–286, 2015. [Google Scholar]
19. J. Liu, Y. Wang, Y. Chen, J. Yang, X. Chen et al., “Tracking vital signs during sleep leveraging off-the-shelf WiFi,” in Proceedings of the 16th ACM Int. Symp. on Mobile Ad Hoc Networking and Computing, New York, NY, pp. 267–276, 2015. [Google Scholar]
20. X. Wang, C. Yang and S. Mao, “PhaseBeat: Exploiting CSI phase data for vital sign monitoring with commodity WiFi devices,” in 2017 IEEE 37th Int. Conf. on Distributed Computing Systems, Atlanta, GA, pp. 1230–1239, 2017. [Google Scholar]
21. C. Chen, Y. Han, Y. Chen, H. Lai, F. Zhang et al., “TR-BREATH: Time-reversal breathing rate estimation and detection,” IEEE Transactions on Biomedical Engineering, vol. 65, no. 3, pp. 489–501, 2017. [Google Scholar]
22. F. Li, C. Xu, Y. Liu, Y. Zhang, Z. Li et al., “Mo-sleep: Unobtrusive sleep and movement monitoring via Wi-Fi signal,” in 2016 IEEE 35th Int. Performance Computing and Communications Conf., Las Vegas, NV, pp. 1–8, 2017. [Google Scholar]
23. D. Zhang, H. Wang and D. Wu, “Toward centimeter-scale human activity sensing with Wi-Fi signals,” Computer, vol. 50, no. 1, pp. 48–57, 2017. [Google Scholar]
 | This work is licensed under a Creative Commons Attribution 4.0 International License, which permits unrestricted use, distribution, and reproduction in any medium, provided the original work is properly cited. |