DOI:10.32604/cmc.2021.018461
| Computers, Materials & Continua DOI:10.32604/cmc.2021.018461 | |
| Article |
Breast Lesions Detection and Classification via YOLO-Based Fusion Models
1Department of Computer Science and Engineering, University of Louisville, Louisville, 40292, KY, USA
2eVida Research Group, University of Deusto, Bilbao, 4800, Spain
*Corresponding Author: Asma Baccouche. Email: asma.baccouche@louisville.edu
Received: 09 March 2021; Accepted: 12 April 2021
Abstract: With recent breakthroughs in artificial intelligence, the use of deep learning models achieved remarkable advances in computer vision, ecommerce, cybersecurity, and healthcare. Particularly, numerous applications provided efficient solutions to assist radiologists for medical imaging analysis. For instance, automatic lesion detection and classification in mammograms is still considered a crucial task that requires more accurate diagnosis and precise analysis of abnormal lesions. In this paper, we propose an end-to-end system, which is based on You-Only-Look-Once (YOLO) model, to simultaneously localize and classify suspicious breast lesions from entire mammograms. The proposed system first preprocesses the raw images, then recognizes abnormal regions as breast lesions and determines their pathology classification as either mass or calcification. We evaluated the model on two publicly available datasets, with 2907 mammograms from the Curated Breast Imaging Subset of Digital Database for Screening Mammography (CBIS-DDSM) and 235 mammograms from INbreast database. We also used a privately collected dataset with 487 mammograms. Furthermore, we suggested a fusion models approach to report more precise detection and accurate classification. Our best results reached a detection accuracy rate of 95.7%, 98.1% and 98% for mass lesions and 74.4%, 71.8% and 73.2% for calcification lesions, respectively on CBIS-DDSM, INbreast and the private dataset.
Keywords: Breast cancer; detection; classification; YOLO; deep learning; fusion
Breast cancer is considered the most common type of cancer that affects women worldwide. Over 279,000 cases were reported in the United States in 2020 with a 15% death rate against other types of cancer [1]. Early detection of breast cancer has become required to reduce the high mortality rate among women; thus, diagnostic systems have been studied to assist radiologists with more precise analysis [2–5]. Mammography screening has been recognized as the most effective tool to reveal abnormalities in the breast tissue, where the most important findings are breast masses and calcifications that may lead to the presence of cancer [6]. To inspect for potential lesions, radiology experts have to read and evaluate the daily screening mammograms, which is considered very challenging due to the highly significant cost and error that may occur due to the variations of abnormalities in terms of location, texture, shape and size [7].
Recently, deep learning technology has been widely adopted in the medical field to support physicians due to the huge number of patients and urgent need to improve the accuracy of their pathology diagnosis over breast lesions detection and classification [8,9]. Accordingly, many computer-aided diagnosis systems (CAD) and similar automatic processes have been developed using deep learning methodologies to provide fast and precise solutions in medical image detection and classification [10–12]. Conventional systems relied on extracting hand-crafted and low-level features to localize and classify potential regions using simple image processing and machine learning techniques [13–15]. So far, these solutions have become inaccurate and resulted in a high false positive rate, and thus have been substituted with the novel deep learning approaches [16,17].
With the increasing number of breast mammograms and enhancement of computational capacity of computers, different deep learning models have been widely implemented to offer a better alternative. They aim to automatically extracting deep and high-level features directly from raw images without knowledge requirement [18]. This helped to improve results of automated systems and maintain a good tradeoff between precision of lesions detection and accuracy of distinguishing between different types of lesions from a simple mammogram [19–22]. Deep learning models have the ability to extract deep and multiple-scaled features, and combine them to assist experts to make the final decision. Accordingly, their strength to adapt to different cases has been proved for objects detection and classification tasks in many applications [23–26]. This resulted in many state-of-the-art models that were proved outstanding success on natural and medical images. These models were evolved from a simple Convolutional Neural Networks (CNNs) model to become other variations such as R-CNNs, Fast CNNs and Faster R-CNNs models [27–29]. These popular models have overcome many limitations of deep learning such as computational time, redundancy, overfitting and parameters size. However, training and implementing most of these models is often time-consuming and requires a high computational memory. Therefore, another variation called You-Only-Look-Once (YOLO), which is characterized with a low-memory dependence, has been recognized as a fast object detection model and suitable for CAD systems [30–36].
In this study, we propose an end-to-end system that is based on the YOLO-based model to simultaneously detect and classify breast lesions into mass tumors or calcification. Our approach contributes a new feature, which is an end-to-end system that can recognize both types of suspicious lesions whether only one type exists in an image or both simultaneously appear in the same image. As the choice of YOLO model was stated earlier, this implementation will also serve as a base for future tasks in order to present a complete breast cancer diagnostic framework (i.e., lesions segmentation and malignancy prediction, etc.). The performance of this prerequisite step was proved on different mammography datasets using deep learning methodologies (i.e., data augmentation, early stopping, hyperparameters tuning and transfer learning). An additional contribution was presented in this paper to boost the lesions detection and classification performance as follows. As the performance varies according to the input data of the model, single evaluation results were first reported over the variations of images, then different fusion models were developed to increase the final detection accuracy rate and join models with different settings. This will help to keep the best detected bounding boxes and remove the bad predictions that can mislead the future diagnostic tasks. The proposed methodology was performed on two most widely used datasets: CBIS-DDSM and INbreast, and also on an independent private dataset. The outcome of this work will justify the performance of the YOLO-based model for deep learning lesion detection and classification on mammography. Furthermore, it will present as a comparative study of YOLO-based model performance using different mammograms.
The rest of the paper is organized as follows. First, the literature review of breast lesion detection and classification using deep learning is introduced in Section 2. In Section 3, details of our methodology are presented, including a description of YOLO-based model architecture and the suggested fusion models approach, followed by details about the used breast cancer datasets and preprocessing techniques. Then, in Section 4, we discuss the hyperparameters tuning applied for training the model, and present experimental results that are compared with other works. We conclude the paper in Section 5 with a discussion about our proposed methodology and future works.
Since the development of machine learning technology, many applications have given more attention in adopting deep learning to solve complex problems, particularly in the fields of computer vision, image recognition, object detection [17–19] and segmentation [30–35]. Many studies showed that traditional techniques have failed to provide highly accurate models due to the limitation of hand-crafted features extracted from raw images. Indeed, traditional CAD systems that were proposed for breast lesions detection and classification could not overcome the huge variations in lesions size and texture, compared to deep learning methods [36–38]. Therefore, numerous CAD systems were successfully developed using deep learning architectures to improve the detection and classification of organs lesions such as liver lesions, lung nodules and particularly breast lesions [39,40].
Researchers have demonstrated the feasibility of regional-based models to build an end-to-end system for detecting and classifying malignant and benign tumors in the INbreast mammograms and achieved a detection rate of 89.4% [41]. The same idea was also presented in a recent work by Peng et al. [42] that introduced an automated mass detection approach, which integrated Faster R-CNN model and multiscale-feature pyramid network. The method yielded a true positive rate of 0.93 on CBIS-DDSM and 0.95 on INbreast dataset.
Accordingly, Al-Antari et al. [43] employed YOLO model for breast masses detection that reported a detection accuracy of 98.96%. The output served after that for mass segmentation and recognition in order to provide a fully integrated CAD system for digital X-ray mammograms. Another work by Al-Antari et al. [44] in 2020 improved the results of the breast lesions detection and classification by adopting first the YOLO model for detection and then compared feedforward CNN, ResNet-50, and InceptionResNet-V2 for classification. Similarly, Al-masni et al. [45] proposed a CAD system framework that first detected breast masses using YOLO model with an overall accuracy of 99.7%, and then classified them into malignant and benign using Fully Connected Neural Networks (FC-NNs) with an overall accuracy of 97%.
Deep convolutional neural networks (DCNN) was also suggested for mammographic mass detection by using transfer learning strategy from natural images [46]. In 2018, a work presented by Ribli et al. [47] proposed a CAD system based on Faster R-CNN framework to detect and classify malignant and benign lesions and obtained an AUC score of 0.95 on INbreast dataset. Another work employed fully convolutional network (FCN) with adversarial learning in an unsupervised fashion to align different domains while conducting mass detection in mammograms [48].
Since breast tumors detection is a crucial step that remains a challenge for CAD systems, many reliable models were used to support this automatic diagnosis. For example, Singh et al. relied on Single Shot Detector (SSD) model to localize tumors in mammograms, and then extracted output boxes to apply segmentation and classification tasks [49]. This yielded sufficient true positive rate of 0.97 on INbreast dataset. Other recent studies proposed using YOLO model to achieve a better performance in detecting bounding boxes surrounding breast tumors. For example, Al-masni et al. [50] presented a YOLO-based CAD system that achieved an overall accuracy of 85.52% on DDSM dataset.
Tumor localization task was conducted in a detection framework for cancer metastasis using a patch-based classification stage and a heatmap-based post-processing stage [51]. This achieved a score of 0.7051 and served for whole slide image classification. Breast tumors detection was also addressed in 2016 by Akselrod-Ballin et al. [52] where images were divided into overlapped patches and fed into a cascaded R-CNN model to first detect masses and then classify them into malignant or benign. In 2015, a work presented by Dhungel et al. [53] relied on a multi-scale Deep Belief Network (DBN) to first extract all suspicious regions from entire mammograms and then filter out the best regions using Random Forest (RF). This technique achieved a true positive rate of 96%. In 2017, a work presented by Akselrod-Ballin et al. [54] developed a three-stage cascade of Faster-RCNN model to detect and classify abnormal regions in mammograms. Their overall detection and classification accuracy reached 72% and 77% on INbreast dataset.
Most of these reviewed works and their diagnosis results showed how artificial intelligence has successfully contributed to solve the challenge of breast cancer detection. However, practical implementation and system evaluation along with the high complexity of memory and time remain a problem to investigate. The majority of these works have tackled the problem of detecting only mass tumors in the entire breast and then classifying them into malignant and benign. Our approach was developed differently to address the task of detection and classification of two types of breast lesions (i.e., mass and calcification). We expand our methodology by presenting fusion models approach that combines predictions of different models to improve the final results.
In this study, we present an end-to-end model for simultaneous detection and classification of breast lesions in mammograms. The process uses a deep learning YOLO-based model that generates suspicious regions from the entire input breast images and classifies the type of lesions as either mass or calcification. We also propose a fusion models approach to improve the model performance and to join different learnings.
Object detection refers to a regression problem that maps right coordinates of images’ pixels to a bounding box that surrounds a specific object. Popular regional-based neural networks models predict multiple bounding boxes and use regions to localize objects within images after being fed into a CNN that generates a convolutional feature map. This approach applies a selective search that extracts most adequate regions from images and then predicts the offset values for the final bounding boxes. Typically, this technique is experimentally slow and memory consuming, therefore a YOLO deep learning network was proposed where a single CNN predicts at the same time bounding boxes allocation and their class label probabilities from entire images. The low-computational aspect of YOLO comes from the fact that it does not require extracting features on sliding windows. In fact, it only uses features from the entire image to directly detect each bounding box and its class label probability.
YOLO architecture, as explained in Fig. 1, is simply based on the fully convolutional neural network (FCNN) design. Particularly, it splits each entire image into m × m grids and for each grid, B bounding boxes are returned with a confidence score and C class probabilities.
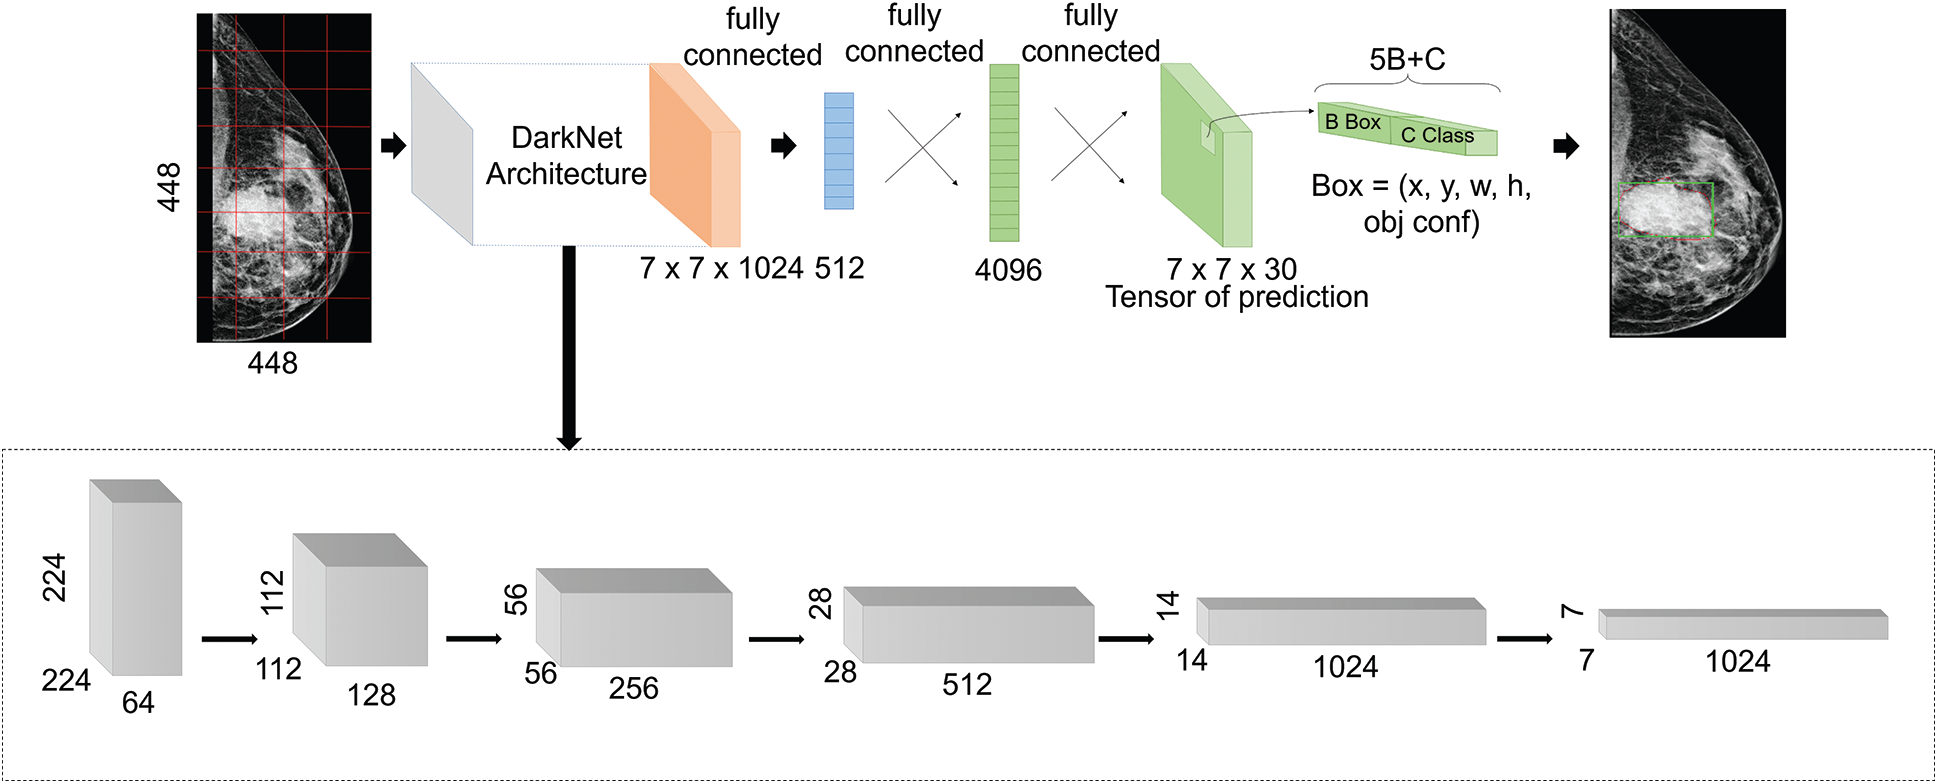
Figure 1: Proposed YOLO-based architecture
Confidence score is computed by multiplying the probability of existing class object with the intersection over the union (IoU) score as detailed in Eq. (1).
In addition, the detected object is classified as mass or calcification according to its class probability and its confidence score for that specific class label as explained below in Eq. (2).
In this work, we adopted YOLO-V3, which is the third improved version of YOLO networks, in order to detect more different scaled object, and it uses multi-scale features extraction and detection. As shown in Fig. 1, the architecture first employs an extraction step that is based on the DarkNet backbone framework [55]. It was inspired by the ResNet architecture and VGG-16, and it presents a new design of 53 layers, as illustrated in the lowest block in Fig. 1, with skip connections in order to prevent gradients from diminishing and vanishing while propagating through deep layers. After that, the extracted features at different scales were fed into the detection part that presents three fully connected layers. After that, it applies the concept of anchor boxes that is borrowed from Faster-RCNNs model. In fact, prior boxes were pre-determined by training a K-means algorithm on the entire images. After that, the output matrixes of multi-scale features were defined as grid cells with anchor boxes. This helps to determine the IoU percentage between the defined ground-truth and anchor boxes. It also ensures selecting the boxes with best scores comparing to a certain threshold. At the end, four offsets values of bounding boxes against each anchor box were predicted with a confidence score and a class label probability. Hence, detection considered correct bounding boxes that had both scores exceeding a certain threshold [56].
According to the generalized YOLO-based model we presented earlier in Fig. 1, bounding boxes that surround suspicious breast lesions are detected with certain confidence score as explained in previous subsection. This score varies with the model settings, the input data fed to the model and with the internal classification step performed by YOLO to determine the class label probability score (i.e., Mass or Calcification). Based on this hypothesis, evaluation of such a model can be expanded to improve the final predictions result.
In this work, we suggested first selecting the best predicted bounding boxes within all augmented images (i.e., rotated, transformed, translated, etc.) according to their IoU score. This helped to determine the best representative mammograms to correctly localize and classify breast lesions. Second, we suggested joining different predictions of the model’s implementation in order to lower the error rate and combine performance of differently configured models. These models were trained and configured differently to finally create a fusion-based model dedicated for best performance.
In fact, we note that Model1, referred as M1, is trained and configured differently for one class targeting either Mass or Calcification. Therefore, the two developed models from M1 are now referenced as M1 (Mass) for Mass class and M1 (Calcification) for Calcification class. Model2, referred as M2, is configured for multi-class training and identification and used for fusion to improve the performance of single-class models. The model M2 will now be identified as M2 (Mass and Calcification) since it targets multiple classes.
After developing and testing each model Mi, our proposed fusion approach is to create a fusion model for Mass class using M1 (Mass) and for Calcification class using M1 (Calcification), while benefiting from the M2 (Mass and Calcification) to improve the performance of the M1 models.
We first report the Mass predictions1 using M1 (Mass) that have IoU score more than threshold1. Next, we select only images with Mass lesions and report their predictions using M2 (Mass and Calcification) and another threshold2. After that, we filter out predicted images that are not within the Mass predictions1 and save them as Mass predictions2. We finally combine the two predictions into final Mass predictions as shown in Fig. 2. We repeat the same logic for Calcification predictions according to the flow in Fig. 2. In all our fusion models, we used a threshold1 to be 0.5 and threshold2 to be 0.35 that yielded satisfying results.
In this study, the CBIS-DDSM and INbreast public datasets were used in our experiments to train and evaluate the proposed methodology. We also evaluated the performance with a small private dataset with different cases.
CBIS-DDSM [57] is an updated and standardized version of the of Digital Database for Screening Mammography (DDSM) dataset, where images were converted from Lossless Joint Photographic Experts Group (LJPEG) to Digital Imaging and Communications in Medicine (DICOM) format. It was reviewed by radiologists after eliminating inaccurate cases and confirmed with the histopathology classification. It contains 2907 mammograms from 1555 patients and it is organized in two categories of pathology: Mass images (50.5%) and Calcification images (49.5%). Mammograms were collected with two different views for each breast (i.e., MLO and CC). Images have average size of 3000 × 4800 pixels and are associated with their pixel-level ground-truth for suspicious regions location and type.

Figure 2: Flow chart of the fusion models approach for final prediction (input mammography images includes single lesions and different lesions cases from the CBIS-DDSM dataset)
INbreast [58] is a public dataset of images acquired using the MammoNovation Siemens full-field digital mammography (FFDM) that are stored in DICOM format. The database contains 410 mammograms where 235 cases include abnormalities in both MLO and CC views from 115 patents, and thus normal mammograms were excluded. Images are also represented with their annotated ground-truth and have average size of 3328 × 4084 pixels. There are 45.5% of images that include Mass lesions and 54.5% of images that include Calcifications lesions.
The private dataset was acquired from the National Institute of Cancerology (INCAN) in Mexico City. It contains 489 mammograms with only stage 3 and 4 breast cancer where 487 cases include abnormal lesions from 208 patients, where 80% of images include Mass lesions and the rest includes Calcifications. Images have average of 300 × 700 pixels collected from CC, MLO, AT and ML views.
All mammograms may have one or multiple lesions with different sizes and locations. Besides, our experimental datasets have different resolution and capture quality, which can be observed visually from Fig. 3, and this is due to the different modality that was used to extract mammograms. Consequently, performance results varied as demonstrated using multiple testsets.

Figure 3: Examples from the public and private mammography datasets, where green box indicates a mass and yellow box indicates a calcification. (a) CBIS-DDSM mammogram example, an MLO view; (b) INbreast mammogram example, an MLO view; (c) Private mammogram example, a CC view
Mammograms were collected using the scanning technique of digital X-ray mammography that usually compresses the breast. This may generates deformable breast regions and degrades the quality of mammography images [59,60]. Therefore, some preprocessing steps should be applied to correct the data and remove additional noise [44,45]. In this work, we applied histogram equalization only on the CBIS-DDSM and the private dataset to enhance any compressed region and create a smooth pixels-equalization that helps distinguishing suspicious regions from the normal regions. We did not enhance the INbreast dataset as it was correctly acquired using the Full Field Digital Mammography (FFDM) and thus its quality is satisfying.
Furthermore, our suggested YOLO-based model requires mammograms and the coordinates of regions of interest (ROI) that surrounds breast lesions. According to the existing ground-truth that represent experts’ annotations, we extracted the lesions coordinates represented in x, y, width and height and the class (mass or calcification). Next, mammograms were resized using a bi-cubic interpolation over 4 × 4 neighborhood. For experimental reasons, we used images sizes of 448 × 448 because the input size should be divisible by 32 according to DarkNet backbone architecture of YOLO-V3, and this size should also fit on the GPU memory.
Training deep learning models requires a large amount of annotated data that helps maintaining its generalization aspect. For medical applications, most of the collected datasets have small number of instances and often suffer from an imbalanced distribution, which remains a challenge for training deep learning models [61]. To overcome this problem, two solutions were recently employed in many studies: data augmentation and transfer learning. Data augmentation offers a process of increasing experimentally size of the dataset [2,8,10,12,18,39,43,45]. In this paper and for the particular detection task, we augmented the original mammograms six times. First we rotated original images with the angles Δθ = 0°, 90°, 180°, 270° } and we transformed them using Contrast Limited Adaptive Histogram Equalization (CLAHE) method [62] with two variations tile grid size of (4, 4) and a contrast threshold of 40, tile grid size of (8, 8) and a contrast threshold of 30 }. Thus, a total of 18.909, 1410, and 2922 mammograms were respectively collected for CBIS-DDSM, INbreast, and the private dataset to train and test the proposed model.
Deep learning models start with initializing the trainable parameters (i.e., weights, bias). To do that, there are two commonly adopted methods: random initialization and transfer learning [2,10,19,43,45,49,63,64]. In our study, we only relied on transfer learning technique by using the weights of a pre-trained model on a larger annotated dataset (i.e., ImageNet, MSCOCO, etc.) and then we re-trained and fine-tuned the new weights on our specific task and augmented dataset. This helped to accelerate the convergence and avoid overfitting problems. Hence, we used the weights that were trained using the DarkNet backbone framework on the MSCOCO dataset. The pre-trained model architecture was originally based on the VGG-16 model.
All experiments using the proposed deep learning model were conducted on a PC with the following specifications: Intel(R) Core (TM) i7-8700K processor with 32 GB RAM, 3.70 GHz frequency, and one NVIDIA GeForce GTX 1090 Ti GPU.
In this study, we used only object detection and classification measures to evaluate the performance of our YOLO-based model. To ensure the true detection of breast lesions in the mammograms, we first measured the intersection over union (IoU) score between each detected box and its ground-truth, and then we tested if it exceeded a particular confidence score threshold that will be discussed later. Eq. (3) details the IoU score formula.
We also relied on another objective measure that considered the predicted class probability of true detected boxes. Inspired by the work [65], we computed the number of true detected masses and calcifications over the total number of mammograms as defined in Eq. (4).
This means we excluded cases having a lower IoU score before computing the final detection accuracy rate. Indeed, predicted boxes that had confidence probability scores equal or greater than the confidence score threshold, were only considered for computing the final detection accuracy rate. We measured the detection accuracy rate globally and for each independent class to evaluate the performance of the simultaneous detection and classification.
The proposed YOLO-based model presents a list of hyperparameters that includes learning rate, number of epochs, dropout rate, batch size, number of hidden units, confidence score threshold and so on. Considering their effect on the model performance, only three hyperparameters were selected for the tuning. For all datasets, we randomly split all mammograms for each class into groups of 70%, 20%, and 10% respectively for training, testing, and validation sets.
In each experiment, trainable parameters were fixed and each hyperparameter was varied. For all experimental datasets, we used Adam as optimizer, and all experiments were reported using the detection accuracy rate. First, we set the learning rate to 0.001, number of epochs to 100 and the batch size to 64 according to the work [45], and then we trained the model with different confidence score thresholds until we report the value that provided satisfying detected objects for further tasks (i.e., segmentation and shape classification). As shown in Fig. 4a, the best confidence score value for all datasets is 0.35 to accept all detected objects the model confident from them by more than 35%. Next, we repeated the experiments but we varied learning rate values to report the best detection accuracy rate for all datasets as shown in Fig. 4b. In addition, the early stopping strategy for the second half of iterations was used to reduce the learning rate by 10% if the loss function did not decrease every 10 epochs. Next, we selected the best learning rate which is 0.001 and we varied the batch size to report the best results for the three datasets as illustrated in Fig. 4c. Finally, we set the learning rate to be 0.001 and batch size to be 16, and we varied the number of epochs until all datasets reported the best performance for 100 epochs as shown in Fig. 4d.

Figure 4: Hyperparameters tuning; (a) confidence score; (b) learning rate; (c) batch size; and (d) number of epochs
Different experiments were conducted to assess the effect of varying input images data and target classes (i.e., mass, calcification) of our suggested YOLO-based model. Furthermore, additional experiments were conducted for the fusion models approach to improve the results.
4.3.1 Single Models Evaluation
The breast lesions detection and classification model was trained differently over the mammography datasets. We varied the input data fed to the model and configured the classification to be with multiple classes using M2. Performance of the model is reported in Tab. 1.
Results show the advantage of data augmentation and resize over the original mammography datasets. In fact, the performance increased with 10% for CBIS-DDSM dataset with almost half of inference time. Similarly, the model achieved a better detection accuracy rate with more than 6.5% and 40% less inference time. The same improvement with 29.6% is noticed on the private dataset with a 28% drop in inference time. Accordingly, using the augmented and resized datasets, we varied the prediction classes by training M1 independently on Mass and Calcification, and M2 on both, and results are reported in Tab. 2 below.
Table 1: Model performance for different configurations
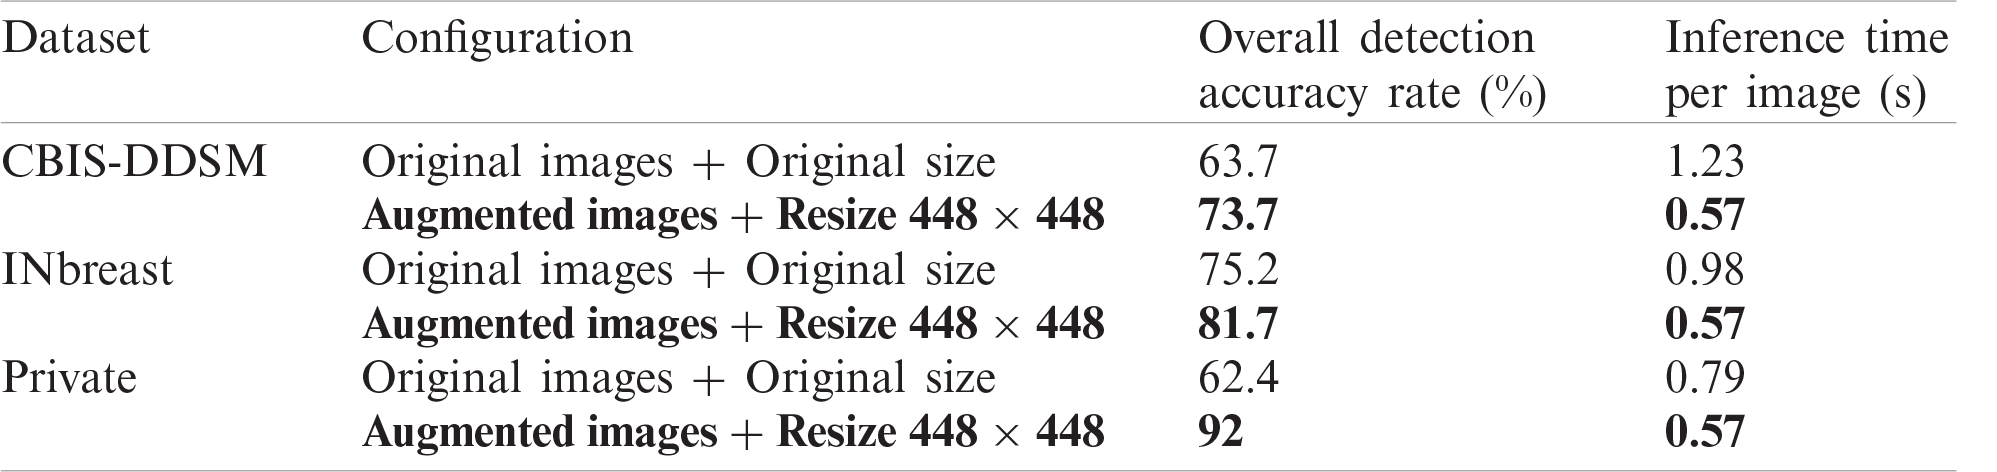
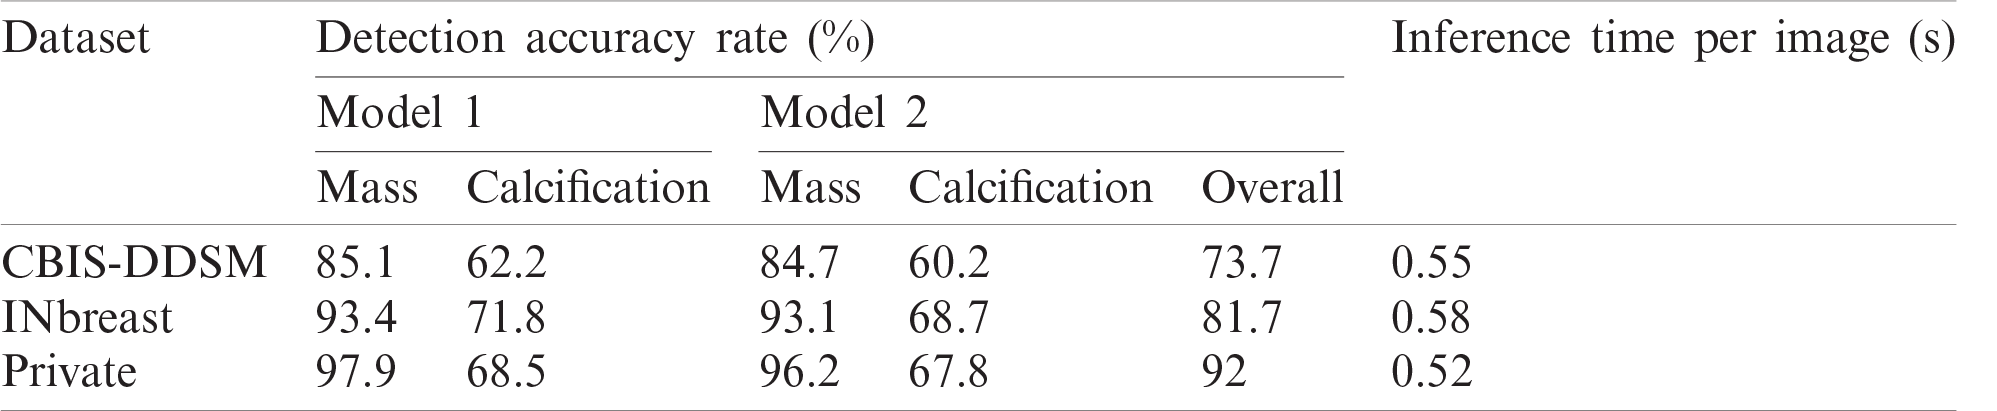
Table 2: Model performance for different prediction classes
Results show that Private dataset had the highest performance comparing with the public datasets and this can be explained with the good resolutions and the easy localization of most of the lesions in those mammograms. Moreover, the public datasets had more deteriorated lesions that are harder to simultaneously detect and classify.
Accordingly, results in Tab. 2 show the clear ability of the YOLO-based model to better detect and classify the mass lesions from the entire mammograms than the calcification lesions. This is aligned with the difference between the two types of lesions in terms of shape, size and texture. In fact, calcifications are often small and randomly distributed in challenging positions within the breast [66]. As shown in Fig. 5, calcifications do not have standard shape and they can be bilateral, thick linear, clustered, pleomorphic and vascular, etc. These varied shapes can limit the detection and classification for this type of lesions and yield more failed cases than for the other lesions. Below in Fig. 5, it shows a case of a coarse-like calcification that has crossed thick lines with irregular size (image on the left, taken from the CBIS-DDSM dataset). Another case shows pleomorphic calcifications that have randomly distribution (image on the middle, taken from the INbreast dataset). In addition, example of clustered calcifications located on the pectoral muscle that presents a challenging case in mammography (image on the right, taken from the Private dataset).
Moreover, we notice that both models have the best results toward mass lesions using the private dataset, and toward calcification lesions using the INbreast dataset. This can be explained with the degraded quality presented in the digitized X-rays mammograms of CBIS-DDSM dataset. Consequently, performance is affected by the image quality and our study proved that detection and classification highly require full-field digital mammography images which involves direct conversion and preserve the shape and textures breast lesions [67].
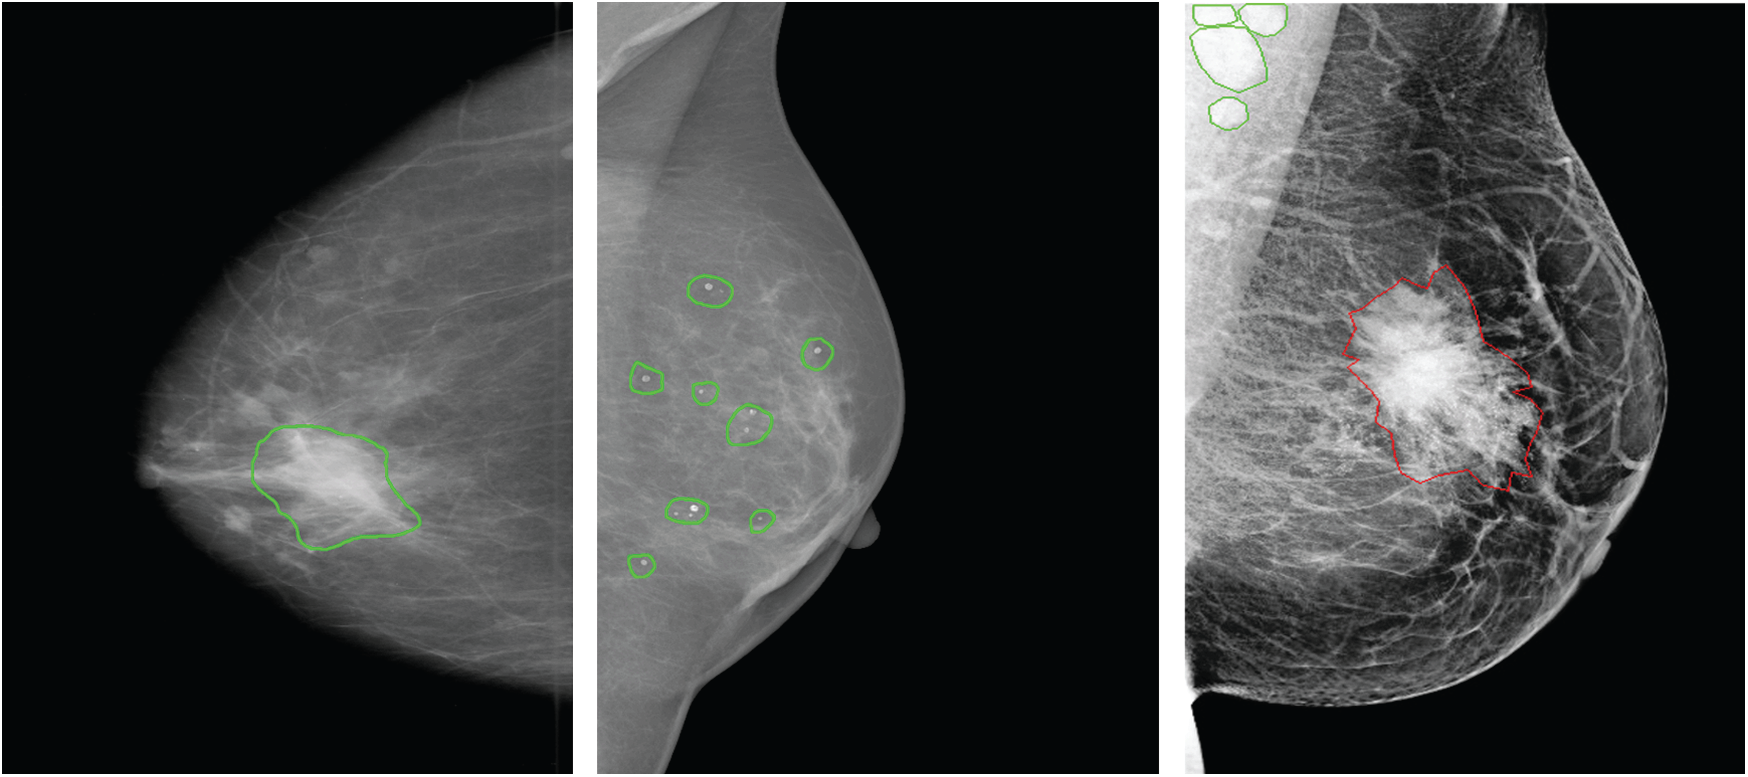
Figure 5: Examples of different calcifications shape and localization (ground-truth of calcification is marked in green, ground-truth of mass is marked in red) for CBIS-DDSM, INbreast and private datasets (from left to right)
Moreover, Tab. 2 demonstrates that training the model on both prediction classes slightly decreased the performance and this can be explained by the inability of YOLO-based model to detect and distinguish some different types of lesions having similar shapes. However, we proved the robustness of our suggested model toward mass detection with a maximum detection accuracy rate of 96.2 using the private dataset. All experiments had similar inference time with a maximum value of 0.58 seconds. Examples from each dataset are illustrated in Fig. 6, and each lesions breast has its confidence score. We clearly notice that multiple lesions were accurately detected in the same mammogram.
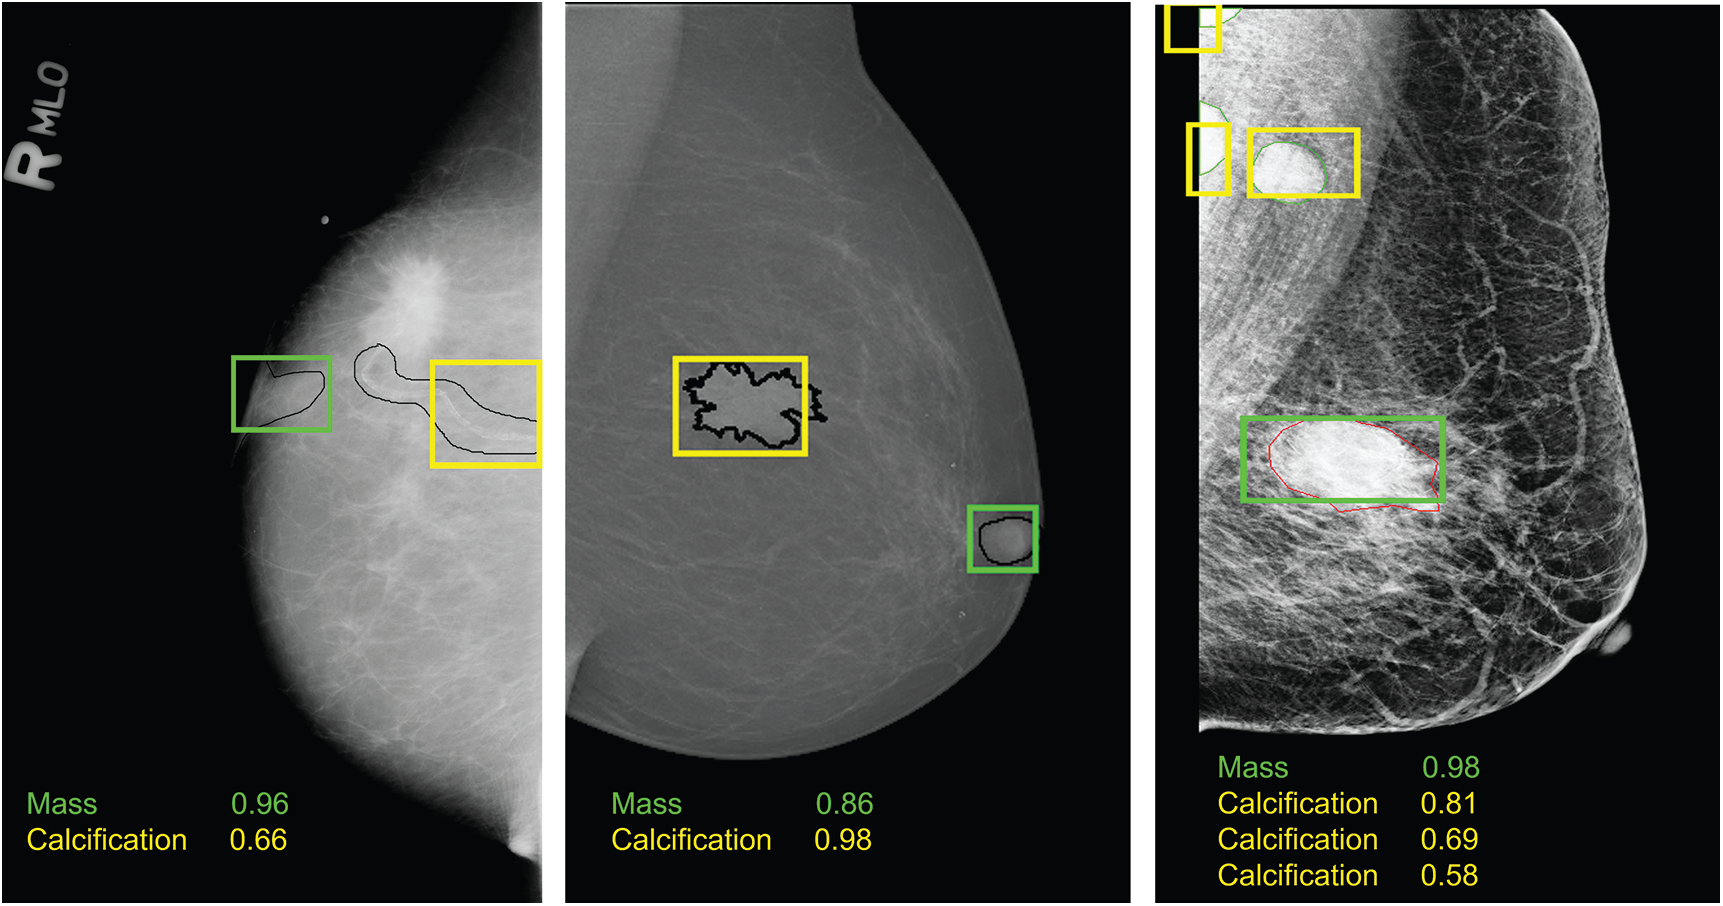
Figure 6: Examples of breast lesions detection and classification results and their confidence score toward different classes on CBIS-DDSM, INbreast and private datasets (from left to right): mass (green boxes) and calcification (yellow boxes)
4.3.2 Fusion Models Evaluation
This study proposed an additional step to evaluate the simultaneous detection and classification model. This presents an expanded evaluation that fuses models trained with different settings as detailed in Section 3.2. In fact, before presenting the results, single models M1 and M2 were first reported over best-selected mammograms from the augmented datasets. This means for every set of predicted mammograms including the original and their five augmented images (i.e., rotated, transformed), we selected the image having the highest IoU score. Next, different models were fused into a new Fusion model, as detailed in Tab. 3, and we measured the detection accuracy rate toward every prediction class.
Table 3: Comparison performance using fusion models approach
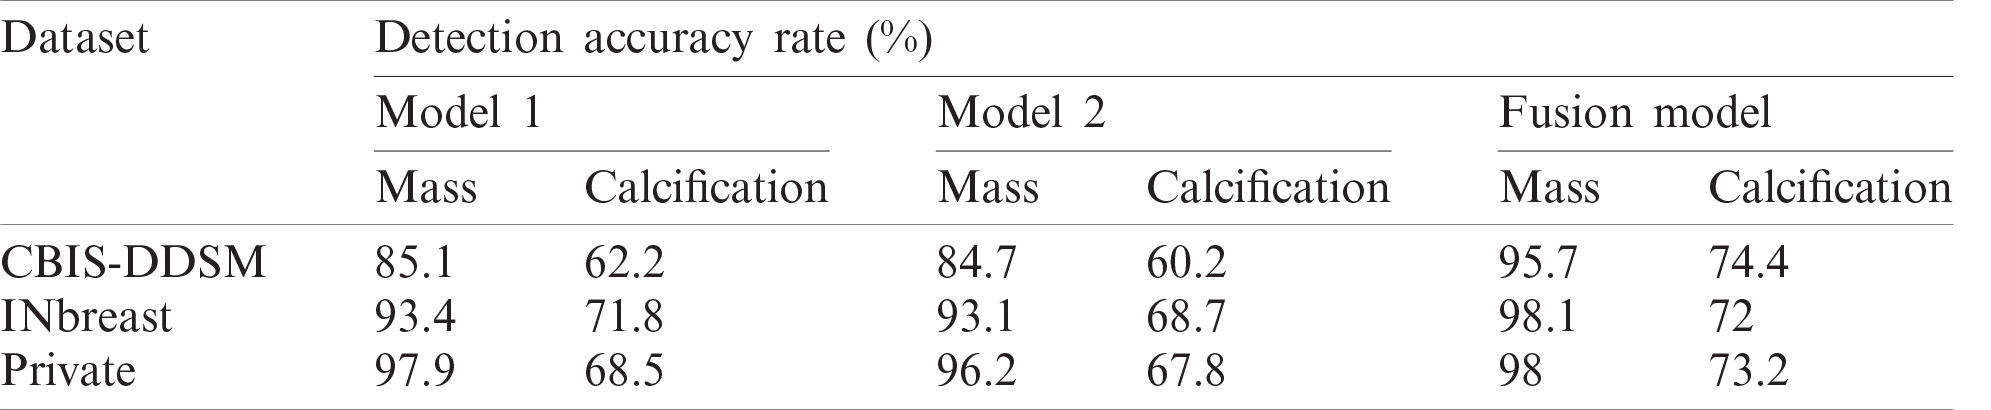
Indeed, performance of detection and classification using the fusion model was increased for each type of breast lesion comparing to the single models. For CBIS-DDSM dataset, mass lesions had a detection accuracy rate of 95.7%, which is higher than 85.1%. Besides, we boosted the performance with 12.2% for calcification lesions. For INbreast dataset, we achieved a final detection accuracy rate of 98.1% for mass lesions and 72% for calcification lesions, which are better than results reported for single experiments in Tab. 2. Similarly, performance was improved for the private dataset with 98% detection accuracy rate for mass lesions and 73.2% for calcification lesions.
It is clearly observed that our suggested fusion models approach improved the results of detection and classification on mammography images. Indeed, fusion strategies were reviewed in the past for medical image segmentation [68–70], and our approach is a new decision-level fusion strategy for object detection and classification that proved the advantage of fusing results of multiple models.
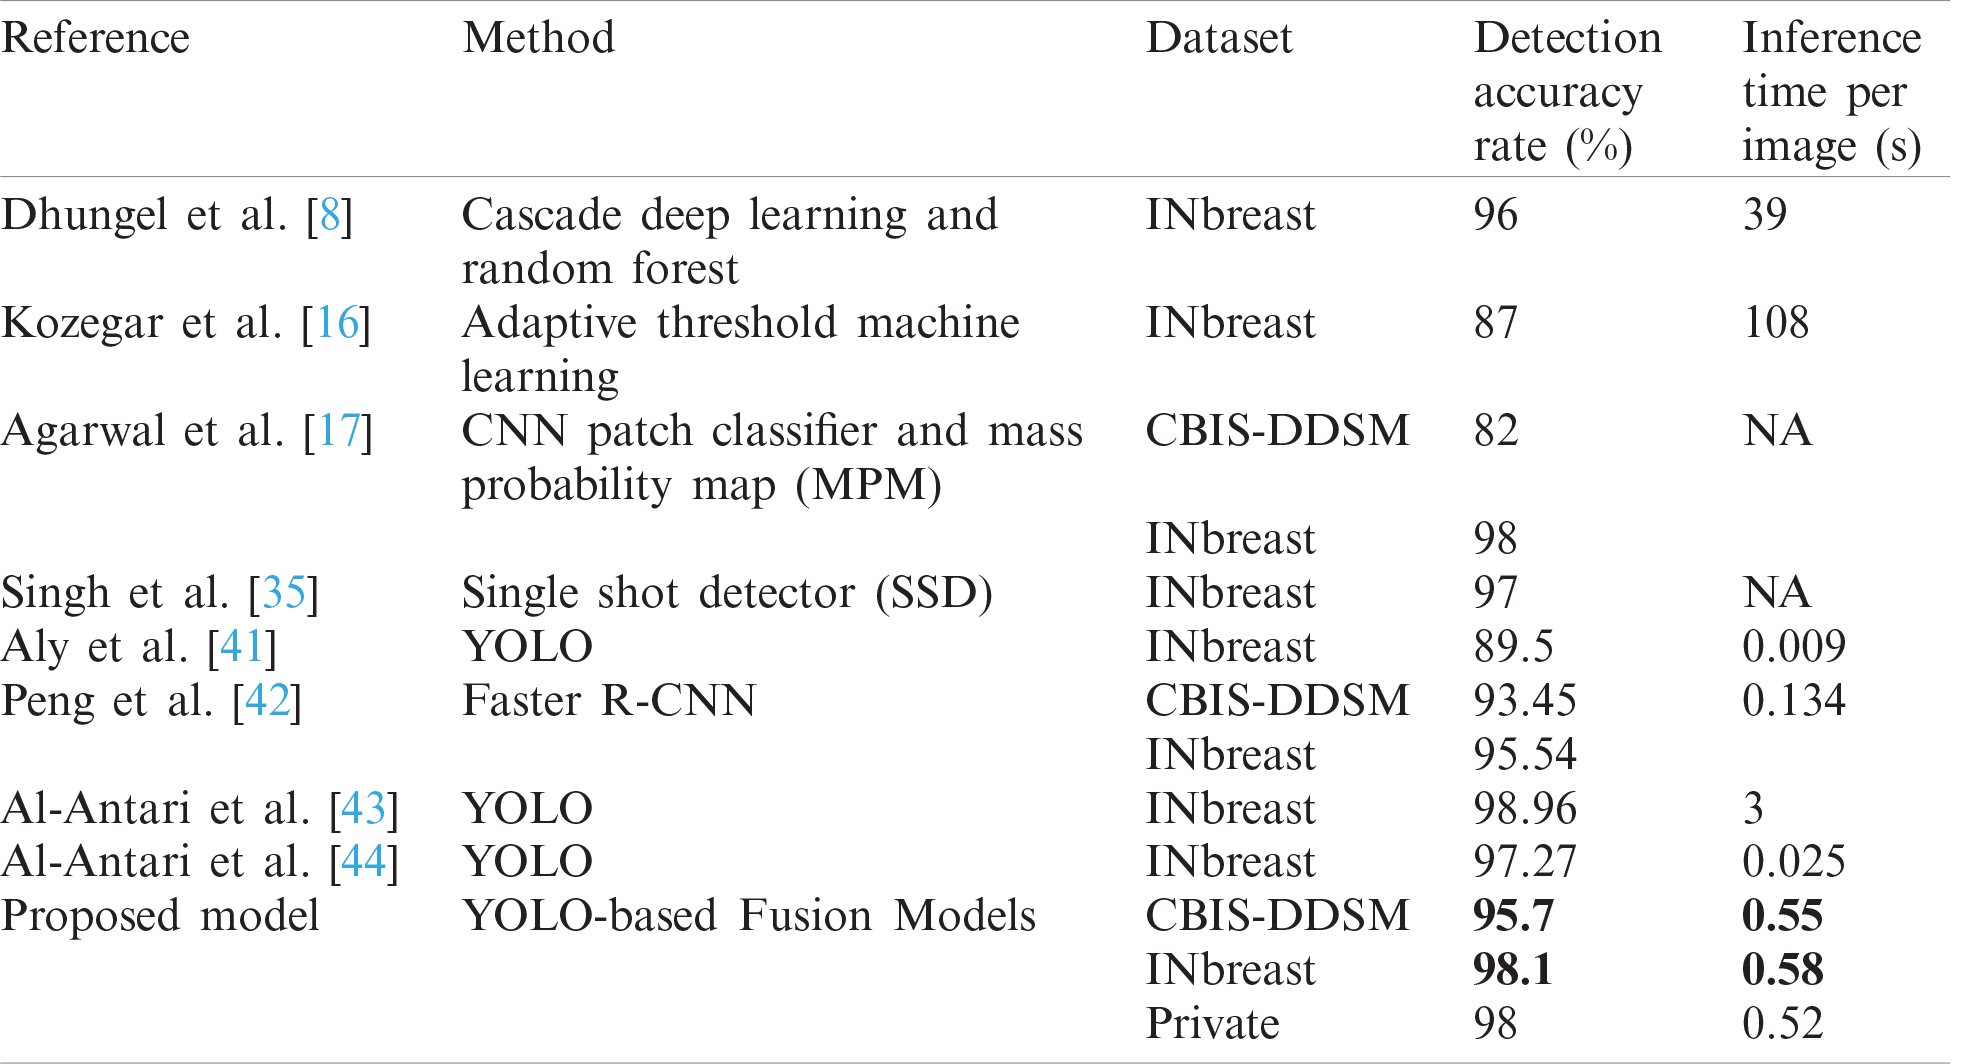
Finally, a comparison of mass detection results of the latest studies and similar methods are listed in Tab. 4. Our implemented method using the fusion models approach is sufficiently fast and accurate. Comparing both detection accuracy rate and inference time with the other works shows that we achieved a better overall performance on the public datasets: CBIS-DDSM with a detection accuracy rate of 95.7% and INbreast with a detection accuracy rate of 98.1%.
It is to notice that comparative results with the state-of-the-art methods relied on both detection accuracy rate and testing inference time, so even though the work by Al-Antari et al. [43] outperformed the detection results for INbreast, but it was more expensive than our implementation in terms of inference time. Additionally, experiments in each work were based on different preprocessing techniques, which can perform differently on both standard datasets.
Table 4: Comparison of mass detection with other works
In this study, we have implemented a deep learning YOLO model to simultaneously detect and classify the suspicious lesions in the breast. Similar works only addressed the problem of mass lesions detection and extracted the regions of interest for further diagnosis. In contrast, our study expands the ability of YOLO-based model to conduct simultaneous detection and classification on mammograms [45], and consequently presents a method that overcomes the problem of predicting location and type of two common findings in the whole mammograms: Mass and Calcification. Results showed the capability of our proposed methodology to accurately achieve state-of-the-art performance.
Furthermore, this approach revealed the advantage of YOLO model as detector and classifier toward different clinical mammographic images (i.e., digitized X-rays, full-field digital mammography, etc.). The quality of predicted images also affirms the robustness of YOLO to successfully identify breast lesions over pectoral muscle, next to breast nipples, or above the dense tissues as shown in Fig. 6. Experimental results showed that training YOLO-based deep learning model is overall fast and accurate, where our results outperform the SSD method [35], the Faster R-CNN model [44], the CNN model [17] and other machine learning techniques [8,16] that had a maximum detection accuracy rate of 98% on INbreast dataset but a significantly high inference time. The comparison revealed that YOLO model is the right choice for mass detection in mammography as presented in other existing YOLO implementations [41,43,44] with a maximum detection accuracy rate of 97.27% on INbreast dataset, and our study enhanced the state-of-the-art results to be 98.1%. However, limitations of the proposed YOLO model can occur in the training configuration that depends on preparing the right format of input data. Thus, input images should be accompanied by the true locations and class labels of the lesions during the training. This requires extracting the coordinates of lesions from the ground truth and consequently YOLO model has an input dependency.
In addition, this paper provided feasible and promising results using the proposed fusion models approach that was considered to join different models and lower the miss-prediction error. Moreover, as the breast lesions detection plays a critical role in the CAD systems and fully-integrated breast cancer diagnosis [32,43,45], our methodology provided an improved detection performance compared with the recent deep learning models. This helps to avoid carrying out additional errors when conducting further diagnosis on the detected lesions.
For a complete clinical application that can assist radiologists, future work aims at extracting the correctly detected masses and calcifications and conducting lesions segmentation, shape and type classification (malignant or benign), and malignancy degree prediction of breast tumors. This will provide an entire framework for breast cancer diagnosis that may also include clinical reports analysis.
Acknowledgement: The authors would especially like to express their gratitude to the National Institute of Cancerology (INCAN) in Mexico City for providing the private mammography dataset. Thanks also to the radiologists Dr. Kictzia Yigal Larios and Dr. Raquel Balbás at FUCAM A. C., and Dr. Guillermo Peralta and Dr. Néstor Piña at Cancer Center Tec100 by MRC International.
Funding Statement: The authors received no specific funding for this study.
Conflicts of Interest: The authors declare that they have no conflicts of interest to report regarding the present study.
1. V. Cokkinides, J. Albano, A. Samuels, M. E. Ward and J. M. Thum, American Cancer Society: Cancer Facts and Figures 2020. Atlanta: American Cancer Society, 2020. [Google Scholar]
2. D. Abdelhafiz, C. Yang, R. Ammar and S. Nabavi, “Deep convolutional neural networks for mammography: Advances, challenges and applications,” BMC Bioinformatics, vol. 20, no. 11, pp. 1–20, 2019. [Google Scholar]
3. M. A. Al-Antari, M. A. Al-Masni, S. U. Park, J. Park, M. K. Metwally et al., “An automatic computer-aided diagnosis system for breast cancer in digital mammograms via deep belief network,” Journal of Medical and Biological Engineering, vol. 38, no. 3, pp. 443–456, 2018. [Google Scholar]
4. P. Xi, C. Shu and R. Goubran, “Abnormality detection in mammography using deep convolutional neural networks,” in IEEE Int. Symp. on Medical Measurements and Applications, Rome, Italy, pp. 1–6, 2018. [Google Scholar]
5. R. K. Samala, H. P. Chan, L. Hadjiiski, M. A. Helvie, J. Wei et al., “Mass detection in digital breast tomosynthesis: Deep convolutional neural network with transfer learning from mammography,” Medical Physics, vol. 43, no. 12, pp. 6654–6666, 2018. [Google Scholar]
6. Y. Celik, M. Talo, O. Yildirim, M. Karabatak and U. R. Acharya, “Automated invasive ductal carcinoma detection based using deep transfer learning with whole-slide images,” Pattern Recognition Letters, vol. 133, no. 7, pp. 232–239, 2020. [Google Scholar]
7. H. D. Couture, L. A. Williams, J. Geradts, S. J. Nyante, E. N. Butler et al., “Image analysis with deep learning to predict breast cancer grade, ER status, histologic subtype, and intrinsic subtype,” NPJ Breast Cancer, vol. 4, no. 1, pp. 1–8, 2018. [Google Scholar]
8. N. Dhungel, G. Carneiro and A. P. Bradley, “A deep learning approach for the analysis of masses in mammograms with minimal user intervention,” Medical Image Analysis, vol. 37, no. 8, pp. 114–128, 2017. [Google Scholar]
9. S. J. S. Gardezi, A. Elazab, B. Lei and T. Wang, “Breast cancer detection and diagnosis using mammographic data: Systematic review,” Journal of Medical Internet Research, vol. 21, no. 7, pp. e14464, 2019. [Google Scholar]
10. G. Carneiro, J. Nascimento and A. P. Bradley, “Automated analysis of unregistered multi-view mammograms with deep learning,” IEEE Transactions on Medical Imaging, vol. 36, no. 11, pp. 2355–2365, 2017. [Google Scholar]
11. D. A. Ragab, M. Sharkas, S. Marshall and J. Ren, “Breast cancer detection using deep convolutional neural networks and support vector machines,” PeerJ, vol. 7, no. 5, pp. e6201, 2019. [Google Scholar]
12. T. Kooi, G. Litjens, B. Van Ginneken, A. Gubern-Mérida, C. I. Sánchez et al., “Large scale deep learning for computer aided detection of mammographic lesions,” Medical Image Analysis, vol. 35, pp. 303–312, 2017. [Google Scholar]
13. M. R. Mohebian, H. R. Marateb, M. Mansourian, M. A. Mañanas and F. Mokarian, “A hybrid computer-aided-diagnosis system for prediction of breast cancer recurrence (HPBCR) using optimized ensemble learning,” Computational and Structural Biotechnology Journal, vol. 15, no. Suppl. 1, pp. 75–85, 2017. [Google Scholar]
14. H. Li, X. Meng, T. Wang, Y. Tang and Y. Yin, “Breast masses in mammography classification with local contour features,” Biomedical Engineering Online, vol. 16, no. 1, pp. 1–12, 2017. [Google Scholar]
15. J. Virmani, N. Dey and V. Kumar, “PCA-PNN and PCA-SVM based CAD systems for breast density classification,” in Applications of Intelligent Optimization in Biology and Medicine, Cham: Springer, pp. 159–180, 2016. [Google Scholar]
16. E. Kozegar, M. Soryani, B. Minaei and I. Domingues, “Assessment of a novel mass detection algorithm in mammograms,” Journal of Cancer Research and Therapeutics, vol. 9, no. 4, pp. 592, 2013. [Google Scholar]
17. R. Agarwal, O. Diaz, X. Lladó, M. H. Yap and R. Martí, “Automatic mass detection in mammograms using deep convolutional neural networks,” Journal of Medical Imaging, vol. 6, no. 3, pp. 31409, 2019. [Google Scholar]
18. L. Shen, L. R. Margolies, J. H. Rothstein, E. Fluder, R. McBride et al., “Deep learning to improve breast cancer detection on screening mammography,” Scientific Reports, vol. 9, no. 1, pp. 1–12, 2019. [Google Scholar]
19. Y. Qiu, S. Yan, R. R. Gundreddy, Y. Wang, S. Cheng et al., “A new approach to develop computer-aided diagnosis scheme of breast mass classification using deep learning technology,” Journal of X-ray Science and Technology, vol. 25, no. 5, pp. 751–763, 2017. [Google Scholar]
20. M. H. Yap, G. Pons, J. Marti, S. Ganau, M. Sentis et al., “Automated breast ultrasound lesions detection using convolutional neural networks,” IEEE Journal of Biomedical and Health Informatics, vol. 22, no. 4, pp. 1218–1226, 2017. [Google Scholar]
21. D. Sierra-Sosa, J. D. Arcila-Moreno, B. Carcia-Zapirain and A. Elmaghraby, “Diabetes type 2: Poincaré data preprocessing for quantum machine learning,” Computers, Materials & Continua, vol. 67, no. 2, pp. 1849–1861, 2021. [Google Scholar]
22. J. Chakraborty, A. Midya and R. Rabidas, “Computer-aided detection and diagnosis of mammographic masses using multi-resolution analysis of oriented tissue patterns,” Expert Systems with Applications, vol. 99, no. 10, pp. 168–179, 2018. [Google Scholar]
23. J. Dai, H. Qi, Y. Xiong, Y. Li, G. Zhang et al., “Deformable convolutional networks,” in Proc. of the IEEE Int. Conf. on Computer Vision, Venice, Italy, pp. 764–773, 2017. [Google Scholar]
24. K. Sun, Y. Zhao, B. Jiang, T. Cheng, B. Xiao et al., “High-resolution representations for labeling pixels and regions,” arXiv e-preprints, arXiv: 1904.04514, 2019. [Google Scholar]
25. C. Farabet, C. Couprie, L. Najman and Y. LeCun, “Learning hierarchical features for scene labeling,” IEEE Transactions on Pattern Analysis and Machine Intelligence, vol. 35, no. 8, pp. 1915–1929, 2012. [Google Scholar]
26. K. He, X. Zhang, S. Ren and J. Sun, “Spatial pyramid pooling in deep convolutional networks for visual recognition,” IEEE Transactions on Pattern Analysis and Machine Intelligence, vol. 37, no. 9, pp. 1904–1916, 2015. [Google Scholar]
27. W. Li, F. Li, Y. Luo and P. Wang, “Deep domain adaptive object detection: A survey,” in IEEE Sym. Series on Computational Intelligence, IEEE, pp. 1808–1813, 2020. [Google Scholar]
28. Z. Zou, Z. Shi, Y. Guo and J. Ye, “Object detection in 20 years: A survey,” ArXiv, vol. abs/1905.05055, 2019. [Google Scholar]
29. J. Gao, Q. Jiang, B. Zhou and D. Chen, “Convolutional neural networks for computer-aided detection or diagnosis in medical image analysis: An overview,” Math. Biosci. Eng., vol. 16, no. 6, pp. 6536–6561, 2019. [Google Scholar]
30. A. Rodríguez-Ruiz, E. Krupinski, J. J. Mordang, K. Schilling, S. H. Heywang-Köbrunner et al., “Detection of breast cancer with mammography: Effect of an artificial intelligence support system,” Radiology, vol. 290, no. 2, pp. 305–314, 2019. [Google Scholar]
31. D. Sierra-Sosa, S. Patino-Barrientos, B. Garcia-Zapirain, C. Castillo-Olea and A. Elmaghraby, “Exploiting deep learning techniques for colon polyp segmentation,” Computers, Materials & Continua, vol. 67, no. 2, pp. 1629–1644, 2021. [Google Scholar]
32. A. S. Eltrass and M. S. Salama, “Fully automated scheme for computer-aided detection and breast cancer diagnosis using digitised mammograms,” IET Image Processing, vol. 14, no. 3, pp. 495–505, 2019. [Google Scholar]
33. D. T. Nguyen, C. K. Mummadi, T. P. N. Ngo, T. H. P. Nguyen, L. Beggel et al., “Self: Learning to filter noisy labels with self-ensembling,” ArXiv, vol. abs/1910.01842, 2019. [Google Scholar]
34. J. C. M. Van Zelst, T. Tan, B. Platel, M. De Jong, A. Steenbakkers et al., “Improved cancer detection in automated breast ultrasound by radiologists using computer aided detection,” European Journal of Radiology, vol. 89, pp. 54–59, 2017. [Google Scholar]
35. V. K. Singh, H. A. Rashwan, S. Romani, F. Akram, N. Pandey et al., “Breast tumor segmentation and shape classification in mammograms using generative adversarial and convolutional neural network,” Expert Systems with Applications, vol. 139, no. 12, pp. 112855, 2020. [Google Scholar]
36. S. Y. Siddiqui, I. Naseer, M. A. Khan, M. F. Mushtaq, R. A. Naqvi et al., “Intelligent breast cancer prediction empowered with fusion and deep learning,” Computers, Materials & Continua, vol. 67, no. 1, pp. 1033–1049, 2021. [Google Scholar]
37. H. Qian, X. Zhou and M. Zheng, “Abnormal behavior detection and recognition method based on improved resnet model,” Computers, Materials & Continua, vol. 65, no. 3, pp. 2153–2167, 2020. [Google Scholar]
38. S. Albahli, T. Nazir, A. Irtaza and A. Javed, “Recognition and detection of diabetic retinopathy using densenet-65 based faster-RCNN,” Computers, Materials & Continua, vol. 67, no. 2, pp. 1333–1351, 2021. [Google Scholar]
39. E. Vorontsov, M. Cerny, P. Regnier, L. Di Jorio, C. J. Pal et al., “Deep learning for automated segmentation of liver lesions at CT in patients with colorectal cancer liver metastases,” Radiology: Artificial Intelligence, Radiological Society of North America, vol. 1, no. 2, pp. 180014, 2019. [Google Scholar]
40. J. George, S. Skaria, V. V. V. and S. Ramachandran, “Using YOLO base deep learning network for real time detection and localization of lung nodules from low dose CT scans,” Medical Imaging 2018: Computer-Aided Diagnosis, vol. 10575, pp. 1057511, 2018. [Google Scholar]
41. G. H. Aly, M. Marey, S. A. El-Sayed and M. F. Tolba, “YOLO based breast masses detection and classification in full-field digital mammograms,” Computer Methods and Programs in Biomedicine, vol. 200, pp. 105823, 2020. [Google Scholar]
42. J. Peng, C. Bao, C. Hu, X. Wang W. Jian et al., “Automated mammographic mass detection using deformable convolution and multiscale features,” Medical & Biological Engineering & Computing, vol. 58, no. 7, pp. 1405–1417, 2020. [Google Scholar]
43. M. A. Al-Antari, M. A. Al-Masni, M. T. Choi, S. M. Han and T. S. Kim, “A fully integrated computer-aided diagnosis system for digital X-ray mammograms via deep learning detection, segmentation, and classification,” International Journal of Medical Informatics, vol. 117, no. 1, pp. 44–54, 2018. [Google Scholar]
44. M. A. Al-Antari, S. M. Han and T. S. Kim, “Evaluation of deep learning detection and classification towards computer-aided diagnosis of breast lesions in digital X-ray mammograms,” Computer Methods and Programs in Biomedicine, vol. 196, pp. 105584, 2020. [Google Scholar]
45. M. A. Al-Masni, M. A. Al-Antari, J. M. Park, G. Gi, T. Kim et al., “Simultaneous detection and classification of breast masses in digital mammograms via a deep learning YOLO-based CAD system,” Computer Methods and Programs in Biomedicine, vol. 157, pp. 85–94, 2018. [Google Scholar]
46. S. Suzuki, X. Zhang, N. Homma, K. Ichiji, N. Sugita et al., “Mass detection using deep convolutional neural network for mammographic computer-aided diagnosis,” in 55th Annual Conf. of the Society of Instrument and Control Engineers of Japan, Tsukuba, Japan, pp. 1382–1386, 2016. [Google Scholar]
47. D. Ribli, A. Horváth, Z. Unger, P. Pollner and I. Csabai, “Detecting and classifying lesions in mammograms with deep learning,” Scientific Reports, vol. 8, no. 1, pp. 1–7, 2018. [Google Scholar]
48. R. Shen, J. Yao, K. Yan, K. Tian, C. Jiang et al., “Unsupervised domain adaptation with adversarial learning for mass detection in mammogram,” Neurocomputing, vol. 393, no. 2, pp. 27–37, 2020. [Google Scholar]
49. W. Liu, D. Anguelov, D. Erhan, C. Szegedy, S. Reed et al., “SSD: Single shot multibox detector,” in European Conf. on Computer Vision, Amsterdam, The Netherlands, pp. 21–37, 2016. [Google Scholar]
50. M. A. Al-Masni, M. A. Al-Antari, J. M. Park, G. Gi, T. Y. Kim et al., “Detection and classification of the breast abnormalities in digital mammograms via regional convolutional neural network,” in 39th Annual Int. Conf. of the IEEE Engineering in Medicine and Biology Society, Korea, pp. 1230–1233, 2017. [Google Scholar]
51. D. Wang, A. Khosla, R. Gargeya, H. Irshad and A. H. Beck, “Deep learning for identifying metastatic breast cancer,” ArXiv, vol. abs/1606.05718, 2016. [Google Scholar]
52. A. Akselrod-Ballin, L. Karlinsky, S. Alpert, S. Hasoul, R. Ben-Ari et al., “A region based convolutional network for tumor detection and classification in breast mammography,” in Deep Learning and Data Labeling for Medical Applications, Athens, Greece, pp. 197–205, 2016. [Google Scholar]
53. N. Dhungel, G. Carneiro and A. P. Bradley, “Automated mass detection in mammograms using cascaded deep learning and random forests,” in Int. Conf. on Digital Image Computing: Techniques and Applications, Adelaide, Australia, pp. 1–8, 2015. [Google Scholar]
54. A. Akselrod-Ballin, L. Karlinsky, A. Hazan, R. Bakalo, A. B. Horesh et al., “Deep learning for automatic detection of abnormal findings in breast mammography,” in Deep Learning in Medical Image Analysis and Multimodal Learning for Clinical Decision Support, Quebec, Canada, pp. 321–329, 2017. [Google Scholar]
55. J. Redmon and A. Farhadi, “Yolov3: An incremental improvement,” ArXiv, vol. abs/1804.02767, 2018. [Google Scholar]
56. D. Wang, C. Li, S. Wen, Q. L. Han, S. Nepal et al., “Daedalus: Breaking nonmaximum suppression in object detection via adversarial examples,” IEEE Transactions on Cybernetics, pp. 1–14, 2021. [Google Scholar]
57. R. S. Lee, F. Gimenez, A. Hoogi, K. K. Miyake, M. Gorovoy et al., “A curated mammography data set for use in computer-aided detection and diagnosis research,” Scientific Data, vol. 4, no. 1, pp. 1–9, 2017. [Google Scholar]
58. I. C. Moreira, I. Amaral, I. Domingues, A. Cardoso, M. J. Cardoso et al., “Inbreast: Toward a full-field digital mammographic database,” Academic Radiology, vol. 19, no. 2, pp. 236–248, 2021. [Google Scholar]
59. M. Kallenberg and N. Karssemeijer, “Comparison of tilt correction methods in full field digital mammograms,” in Int. Workshop on Digital Mammography. Berlin, Heidelberg, pp. 191–196, 2010. [Google Scholar]
60. M. Mehmood, E. Ayub, F. Ahmad, M. Alruwaili, Z. A. Alrowaili et al., “Machine learning enabled early detection of breast cancer by structural analysis of mammograms,” Computers, Materials & Continua, vol. 67, no. 1, pp. 641–657, 2021. [Google Scholar]
61. G. Litjens, T. Kooi, B. E. Bejnordi, A. A. A. Setio, F. Ciompi et al., “A survey on deep learning in medical image analysis,” Medical Image Analysis, vol. 42, no. 13, pp. 60–88, 2017. [Google Scholar]
62. G. Yadav, S. Maheshwari and A. Agarwal, “Contrast limited adaptive histogram equalization based enhancement for real time video system,” in Int. Conf. on Advances in Computing, Communications and Informatics, Noida, India, pp. 2392–2397, 2014. [Google Scholar]
63. Y. Wang, D. Tao, X. Gao, X. Li and B. Wang, “Mammographic mass segmentation: Embedding multiple features in vector-valued level set in ambiguous regions,” Pattern Recognition, vol. 44, no. 9, pp. 1903–1915, 2011. [Google Scholar]
64. L. Yu, H. Chen, Q. Dou, J. Qin and P. A. Heng, “Automated melanoma recognition in dermoscopy images via very deep residual networks,” IEEE Transactions on Medical Imaging, vol. 36, no. 4, pp. 994–1004, 2016. [Google Scholar]
65. F. Samuelson and C. Abbey, “Using relative statistics and approximate disease prevalence to compare screening tests,” The International Journal of Biostatistics, vol. 12, no. 2, pp. 104, 2016. [Google Scholar]
66. P. A. Hernández, T. T. Estrada, A. L. Pizarro, M. L. D. Cisternas and C. S. Tapia, “Breast calcifications: Description and classification according to bi-rads,” Rev. Chil. Radiol., vol. 22, pp. 80–91, 2016. [Google Scholar]
67. P. T. Rajendran, V. Krishnapillai, S. Tamanang and K. K. Chelliah, “Comparison of image quality criteria between digital storage phosphor plate in mammography and full-field digital mammography in the detection of breast cancer,” The Malaysian Journal of Medical Sciences, vol. 19, no. 1, pp. 52–59, 2012. [Google Scholar]
68. T. Zhou, S. Ruan and S. Canu, “A review: Deep learning for medical image segmentation using multi-modality fusion,” Array, vol. 3, pp. 100004, 2019. [Google Scholar]
69. N. Antropova, B. Q. Huynh and M. L. Giger, “A deep feature fusion methodology for breast cancer diagnosis demonstrated on three imaging modality datasets,” Medical Physics, vol. 44, no. 10, pp. 5162–5171, 2017. [Google Scholar]
70. Z. Wang, M. Li, H. Wang, H. Jiang, Y. Yao et al., “Breast cancer detection using extreme learning machine based on feature fusion with CNN deep features,” IEEE Access, vol. 7, pp. 105146–105158, 2019. [Google Scholar]
 | This work is licensed under a Creative Commons Attribution 4.0 International License, which permits unrestricted use, distribution, and reproduction in any medium, provided the original work is properly cited. |