DOI:10.32604/cmc.2021.018280
| Computers, Materials & Continua DOI:10.32604/cmc.2021.018280 | |
| Article |
Oversampling Method Based on Gaussian Distribution and K-Means Clustering
1Department of Computer Science, University of Zakho, Duhok, 42001, Kurdistan Region, Iraq
2Department of Information Technology, Duhok Polytechnic University, Duhok, 42001, Kurdistan Region, Iraq
*Corresponding Author: Adel Sabry Eesa. Email: adel.eesa@uoz.edu.krd
Received: 01 March 2021; Accepted: 03 April 2021
Abstract: Learning from imbalanced data is one of the greatest challenging problems in binary classification, and this problem has gained more importance in recent years. When the class distribution is imbalanced, classical machine learning algorithms tend to move strongly towards the majority class and disregard the minority. Therefore, the accuracy may be high, but the model cannot recognize data instances in the minority class to classify them, leading to many misclassifications. Different methods have been proposed in the literature to handle the imbalance problem, but most are complicated and tend to simulate unnecessary noise. In this paper, we propose a simple oversampling method based on Multivariate Gaussian distribution and K-means clustering, called GK-Means. The new method aims to avoid generating noise and control imbalances between and within classes. Various experiments have been carried out with six classifiers and four oversampling methods. Experimental results on different imbalanced datasets show that the proposed GK-Means outperforms other oversampling methods and improves classification performance as measured by F1-score and Accuracy.
Keywords: Class imbalance; oversampling; gaussian; multivariate distribution; k-means clustering
Machine learning methods aim to discover information from known empirical data, build suitable models for the phenomenon, and eventually use the model and the information they learn to make a prediction for the future unknown data [1]. There are two main types of machine learning, namely supervised and unsupervised. In supervised learning, the dependent target class (outcome) is known in advance; and the main task of learning is to explore the relationship between other independent features and the target class. Whereas, in unsupervised learning, input data does not have any dependent target class, and the learning method is used to explore hidden patterns in data [2].
There are many different classification algorithms exist in the literature, such as Decision Tree (DT), Support Vector Machines (SVM), K-Nearest Neighbor method (KNN), Naive Bayes (NB), Logistic Regression (LR), and Artificial Neural Networks (ANN). Many of these classification algorithms usually give high classification accuracy. However, such high prediction accuracy cannot be seen in solving every problem [3]. One of the most important reasons for this is the class imbalance in the distribution of data. The problem of imbalanced datasets occurs when the number of instances in one class (called majority) is significantly higher than the number of instances in the other class (called minority). In such problems, the amount of data in the minority classes cannot be represented sufficiently represented to extract enough information from data compared to the other majority classes. Furthermore, the prediction error is usually very high for imbalanced dataset. Traditional classification methods usually assume that there is a relatively balanced class distribution in general, to minimize the overall error rate of the entire training set. However, since the minority classes have little contribution to the classification task, the classifier does not perform well on imbalanced data. To illustrate this problem, suppose a given dataset contains 100 samples, 90 samples labeled as class A and 10 samples as class B. Next, suppose a specific classifier predicted all data as class A. In this case, it would achieve an accuracy of 90% even though the classifier was not able to correctly classify any sample in class B. From this example, it is obvious how the classifier with imbalanced data might result in wrong predictions and hence wrong decisions [4].
In general, the approaches to handle the class imbalance problem are divided into two main types: algorithms-based and data-based approaches. Algorithms-based approaches aim to replace the existing machine learning algorithms, or developing new ones to address the class imbalance problem and improve the classification performance. On the other hand, data-based approaches usually change the distribution of the imbalanced datasets to stabilize class imbalance, and then give the resulting balanced datasets to the classifier to increase the detection rate of the minority class. An example of data-based approaches is re-sampling method, which is a popular solution for the problem of class imbalance to balance the class distribution of the dataset. The resampling methods are also categorized into two groups: over-sampling of the minority class and under-sampling of the majority class [5].
In this paper, we propose a new oversampling method for imbalanced data based on a Multivariate Gaussian distribution and K-means clustering (GK-means) to improve the prediction accuracy of all classes, particularly minority classes. The proposed method aims to achieve a balance between all classes by changing the distributions of minority classes so that the size of their samples does not differ much from the majority classes. This is performed by generating new samples for the minority classes using GK-means algorithm. The motivation behind proposing GK-means method is to provide a simple method for oversampling. The reason behind using the Gaussian distribution is to produce synthetic data that shares an approximately similar probability distribution with the original minority data. While the reason behind using the K-means clustering algorithm is to further divide the minority class into different clusters that have the same properties and extract more information from each cluster to find hidden patterns or grouping in data.
The rest of the paper is organized as follows. Section 2 reviews some related recent approaches to class imbalance problem in general and oversampling in particular. Section 3 provides a brief background on current oversampling methods, along with general background on classification algorithms and model performance metrics. Section 4 presents the proposed method in detail. Section 5 exhibits the experimental results with discussions. Finally, Section 6 concludes the study with the main conclusions and suggests some future works.
There are different approaches exist in the literature for dealing with class imbalance problem. This section reviews recent methods and techniques used for balancing data.
Kamalov [6] proposed a technique called Kernel Density Estimation (KDE) for oversampling imbalanced dataset. Here, the Gaussian function was used as a kernel in KDE due to its wide popularity in the literature. Experimental results showed that this proposed method can provide higher performance when compared to other related methods. The SVM, KNN and MLP algorithms were used for evaluating the classification performance on 14 various datasets.
Last et al. [7] used K-means clustering algorithm with SMOTE method for oversampling to cope with misbalancing problem. In their proposed method, they followed three main steps: clustering, filtering, and oversampling. Clustering was used to divide the dataset into groups based on the value of K using K-means algorithm. Filtering was then used to select clusters for oversampling based on the minority class samples. Finally, the SMOTE method was applied for oversampling to balance the dataset. They claimed that their proposed method improved the performance of the classification. They used LR, KNN and Gradient Boosting Machine GBM algorithms in their investigation on 71 different datasets.
Santos et al. [8] applied K-means clustering algorithm to deal with the noisy problem before applying any synthetic sampling. Firstly, they used Gap statistic method to automatically select the number of clusters K, and hence using the K-means method to select centroids automatically instead of selecting them randomly. Secondly, they used the SMOTE for oversampling clusters. The LR and ANN were used for evaluating the classification performance on hepatocellular carcinoma (HCC) dataset.
Pereira [9] used K-means clustering algorithm with some different methods for oversampling: random method, SMOTE method, Borderline SMOTE method, and G-SMOTE method. The KNN, LR, DT algorithms were used for evaluating the classification performance on 13 datasets. Gradient Boosting Classifier (GBC) was used as an ensemble technique for classification. Their results showed that when the K-means algorithm was combined with the oversampling method, the performances of the models have significantly improved.
Aditsania et al. [10] used Adaptive Synthetic Sampling (ADASYN) method for oversampling with ANN Backpropagation algorithm to examine the efficiency of the new method. Their experimental results showed that the ADASY method can increase classification performance.
Mustafa et al. [11] proposed a new method for balancing data called FD_SMOTE (Farther Distance Based on SMOTE). Their method is based on combining the Principle Component Analysis (PCA) with the SMOTE method. The FD_SMOTE approach can increase the performance of the classification models when used on a variety of biomedical data. The ANN, KNN, SVM, Bagging, Random Forest and Naïve Bayes algorithms were used for checking the classification performance on 3 medical datasets.
Zhang et al. [12] proposed a method for oversampling imbalanced dataset based on Gaussian distribution. Their approach generates samples with expected mean and variance from the distribution of the minority class. The NB, DT and ANN algorithms were used to examine the classification performance on 8 datasets. Their experimental results showed that the Gaussian-based method provided higher performance in most of the datasets used when compared with the SMOTE and Random methods.
From our literature survey discussed above, we have seen that the most popular method used for oversampling imbalanced datasets is the SMOTE method. However, this method has some drawbacks. First, it generates noise when creating synthetic data because it does not consider neighboring examples from other classes. Second, it is only beneficial with low-dimensional data, and it is not effective for high-dimensional data [7]. These two issues were addressed in the literature as follows. To solve the noisy problem, the K-means algorithm is used, and the feature selection algorithms are applied to figure out the high dimensionality issue. Another disadvantage of the SMOTE method is that it is time-consuming, especially in large datasets, because it uses the nearest neighbor samples during oversampling [13,14].
The main drawback of ADASYN method is that it does not take care of noisy instances, and thus it is sensitive to outliers in the dataset. While the problem with Gaussian oversampling in [12] is that the Gaussian distribution was only used for the whole minority class that is not suitable for class (sample) space. This is because the mean can easily be affected by excessive outliers. If the data contain some very high or low values, the mean will not be suitable for representing data as a central measurement.
In this section, we have addressed the shortcomings of the current available methods, and we have proposed a new oversampling method that is our main contribution in this study. The proposed method combines the Gaussian distribution with the K-means clustering algorithm. The minority class will be divided into K clusters. For each new cluster, a local empirical distribution will be defined as Gaussian, and the parameters of the underlying distribution will be estimated from data in each cluster. Then the required number of sampling for each synthetic cluster will be generated until data are balanced. Before presenting the new method in Section 4, we will briefly review the existing methods in the next section.
This section reviews some existing well-known resampling methods and the model evaluation metrics.
Resampling is one of the basic approaches for class imbalance learning. It is a data-level technique that directly adjusts the distribution of data. Resampling does over-sample by adding new samples to the minority class, or under-sample by removing existing samples from the majority class [15]. In other words, over-sampling increases the number of samples in the minority class until imbalance disappears. While under-sampling removes some instances of the majority class until the dataset is relatively stable. These methods directly replace the previous distributions of the majority and minority classes [16]. Three over-sampling methods are used in this paper to be compared with our proposed method. These methods are:
SMOTE: Synthetic Minority Oversampling Technique is one of the most common and effective oversampling method in many application domains [17,18]. It creates synthetic samples by analyzing the data of the existing minority class. The SMOTE method creates a synthetic sample, which is linear combinations of two samples from the minority class (
where
ADASYN: Adaptive Synthetic Sampling Approach is another oversampling method based on the SMOTE. The main idea of this method is to produce minority class samples according to their distribution. ADASYN is similar to SMOTE and derived from it, but has only one important difference. It deflects the sample gap (that is, the probability of selecting any specific point for coupling) to points that are not found in homogeneous neighborhoods [19]. For more information about this method, readers are referred to [20].
GD: Gaussian Distribution is another oversampling method based on normal distribution, which used by [12] for dealing with imbalanced data. The GD-Sampling generates samples that are based on mean and variance from the distribution of the minority class without knowing the real distribution of data. The features are independent of each other. The main advantage of GD-Sampling is that it creates synthetic data that share an almost similar probability distribution with the original minority data [12].
Clustering is one of the unsupervised learning algorithms, which means that no information is given beforehand [21]. In general, it deals with finding a structure in a collection of uncategorized data [21]. Clustering is the problem of grouping a set of objects. In such problem, objects in the same cluster must be more similar to each other than the objects in other clusters. Similarities are high in the same cluster and low between clusters. In this paper, K-means clustering is used, which is briefly described below.
K-means Clustering Algorithm: It is one of the most popular unsupervised learning methods [22], which is based on dividing samples into K sets. The essence of the algorithm is based on the idea that similar data are grouped in the same cluster. The term similarity in the algorithm is determined by the distance between the data. In fact, if the distance between data is low, it means the similarity is high, and vice-versa. K-means clustering is based on applying Euclidean distance [23,22], with the following steps.
a) The number of clusters,
b) The cluster center is initialized randomly.
c) Samples outside the center are classified according to their distances.
d) Determining new centers according to classification made (or shifting old centers to new centers).
e) Repeat Steps 3 and 4 until the stability is reached [24].
The numerical breakdown of the observation values held about any event is called distribution [25]. The probability realization of these observation values is called the probability distribution [26]. Any probability distribution is either discrete or continuous. A discrete distribution means that the random variable can assume one of a countable (finite) number of values. Whereas a continuous distribution means that the random variable can assume one of an infinite (uncountable) number of different values.
Gaussian Distribution: Gaussian (or Normal) distribution is a continuous probability distribution, which is the most important distribution and very popular because it is assumed that the events observed in our daily lives usually correspond to this distribution. Gaussian distribution is very crucial and it is often used in nature, pure and social science to represent real-values random variables. There are many examples of random variables that follows this distribution, such as monthly returns of an investment, weights of produced products, height, lengths, and IQ test results. It is also used as a basic distribution in statistical inferences [12]. The general formula for its probability density function is as follows [27]:
where
where
Multivariate Gaussian Distribution (MGD): it is the generalization of the combined distribution of two or more dependent variables. Multivariate Gaussian density function is a general representation of Gaussian distribution in d-dimension. The formula of MGD is defined as follows.
where
Covariance is a concept that measures the change of linear relationship between two variables. A positive result indicates an increasing linear relationship, a negative indicates a decreasing linear relationship, and a zero indicates that there is no relationship [28]. The formula of covariance between any two variables
where
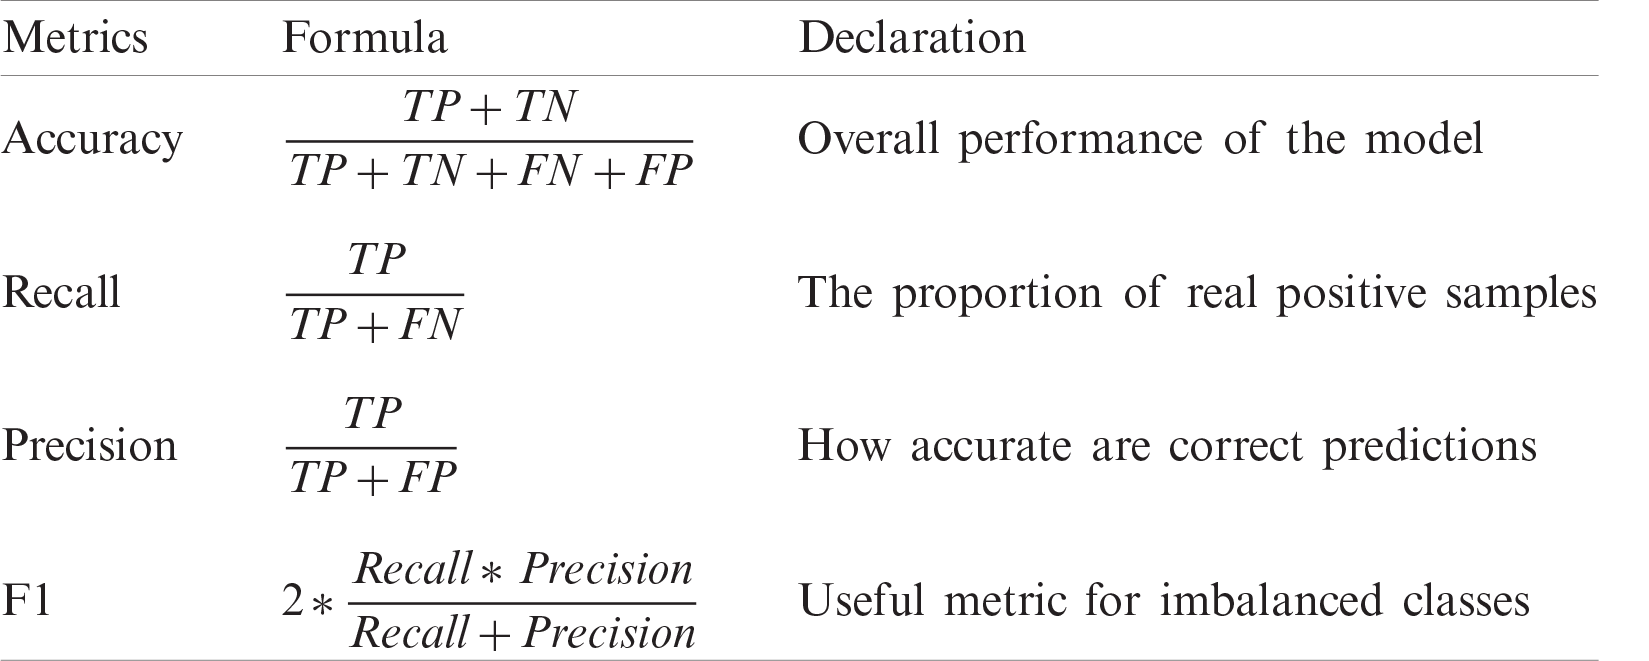
Once a machine learning algorithm is applied, the next step is to find the performance of the algorithm to see how efficient is the model to be used for prediction. Different evaluation metrics are used to measure the performance of the classifiers used. Accuracy is a classic measure that calculates the difference between the predicted model output and the actual class label. In general, high accuracy means better classification model, but other evaluation metrics such as Recall, Precision, and F1 score are also important for class imbalance [29]. Tab. 1 shows these evaluation metrics, which are derived from confusion matrix.
Table 1: Model evaluation metrics
4 The Proposed Method (GK-Means)
Unlike other oversampling methods which take the whole minority class as one group of data to be oversampled, our method aims to further divide data into different groups (clusters) based on the underlying groups exist in the minority class. Our method aims to generate more realistic synthetic data using Gaussian distribution in conjunction with the K-means clustering to rebalance skewed datasets.
The main difference between the new suggested method (GK-means) and the previous methods is that the GK-means is able to extract hidden patterns exist in the minority class before creating any synthetic data. In other words, our method can detect any unseen patterns in the original data and can handle it via fitting an empirical distribution to each pattern, hence taking these different patterns in the oversampling process. Fig. 1 describes the main steps of the proposed method (GK-means) which consists of the following steps:
a) Choose minority class from dataset to be oversampled. The minority class is addressed to be further investigated so that the whole dataset can be balanced prior to applying any classification algorithm.
b) Put the minority class into the K-means clustering algorithm to be divided into K groups (clusters). The proposed method aims to further divide the minority class into different groups (clusters) based on the underlying groups and hidden features exist in the minority class.
c) Calculate
d) Create a vector of means (
e) Choose the ratio size to create the number of samples. After randomly generating a number of ratio sizes, they were used to create a numerical model for optimizing the ratios of the minority classes. Each instance was assigned in the test dataset for the classification, and the best ratio was chosen.
f) Identify the required samples in each cluster. Based on the ratio size chosen from the previous step, the number of samples required for balancing the data in each cluster is identified.
g) Use Gaussian distribution to create synthetic samples in each cluster using its underlying (
h) Combine the new synthetic data with the raw dataset. After randomly generating all the required samples for balancing data in each cluster, these synthetic data are then combined with the raw data to create a new balanced dataset.
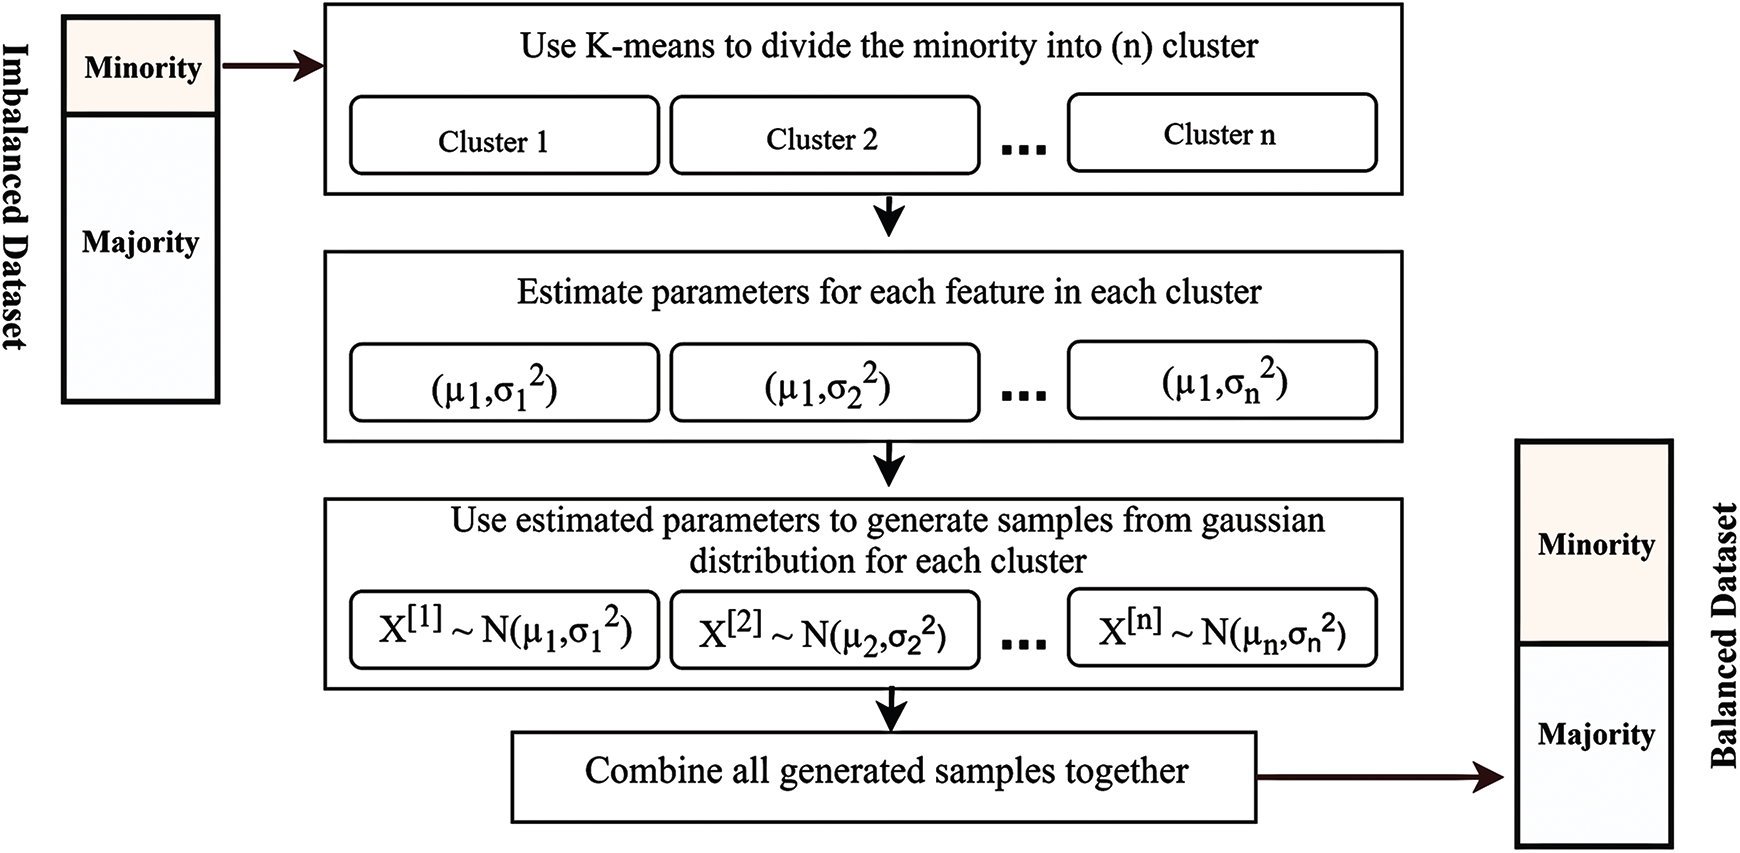
Figure 1: Diagram of the proposed method (GK-Means)
5 Experimental Results and Discussions
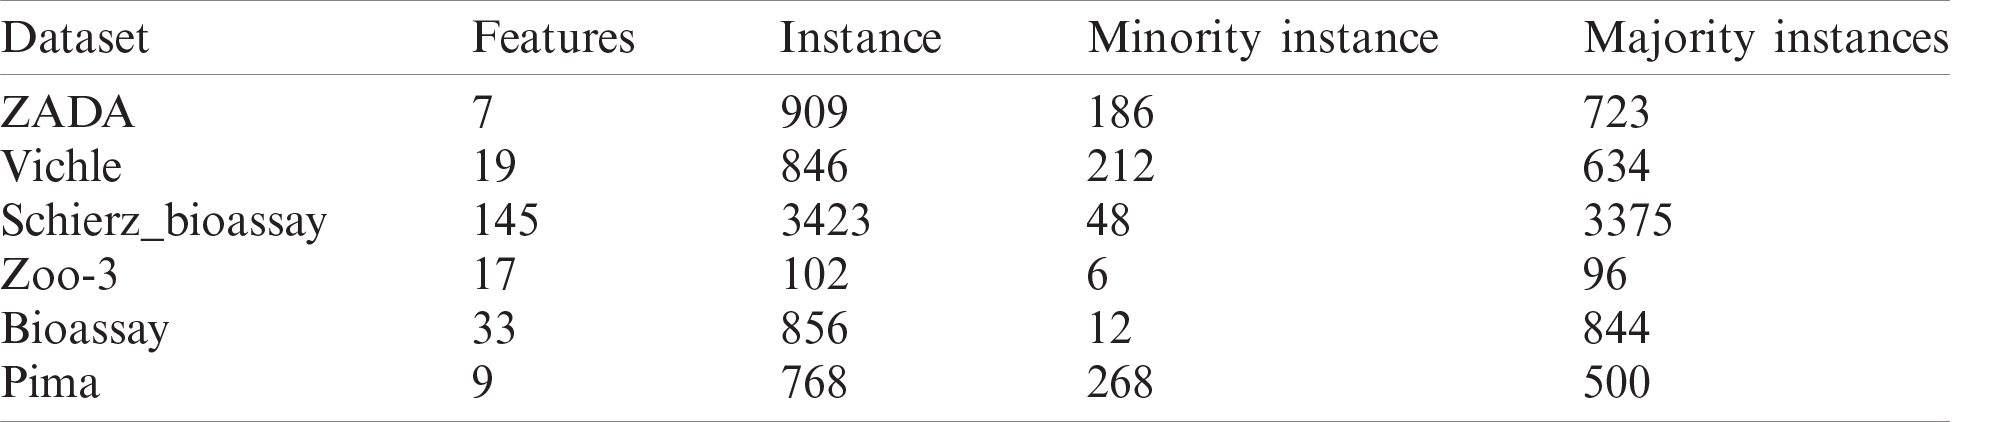
In order to check the performance of the proposed method (GK-means), we applied it using different classification algorithms on six imbalanced datasets from different application areas. General characteristics of the six datasets are shown in Tab. 2. The ZADA is a newly created dataset collected from Shaker laboratory in Zakho city, Iraq. Other five datasets were collected from the www.kaggle.com, which are freely available. To further assess the efficiency of the proposed method, three other well-known oversampling methods, namely SMOTE, ADASYN and GD, were also applied, and the results were compared. All the experiments in this section were based on an oversampling ratio of 100% for each dataset. The six classifiers used in our investigation are: KNN, DT, NB, LR, SVM, and ANN. Furthermore, for evaluating the performance of each method, two common metrics (Accuracy and F1) were used and compared. As the K-means clustering algorithm was used to cluster the minority class, different number of
Table 2: General characteristics of six datasets
5.1 Experiment 1: Impact of K-Means Clustering
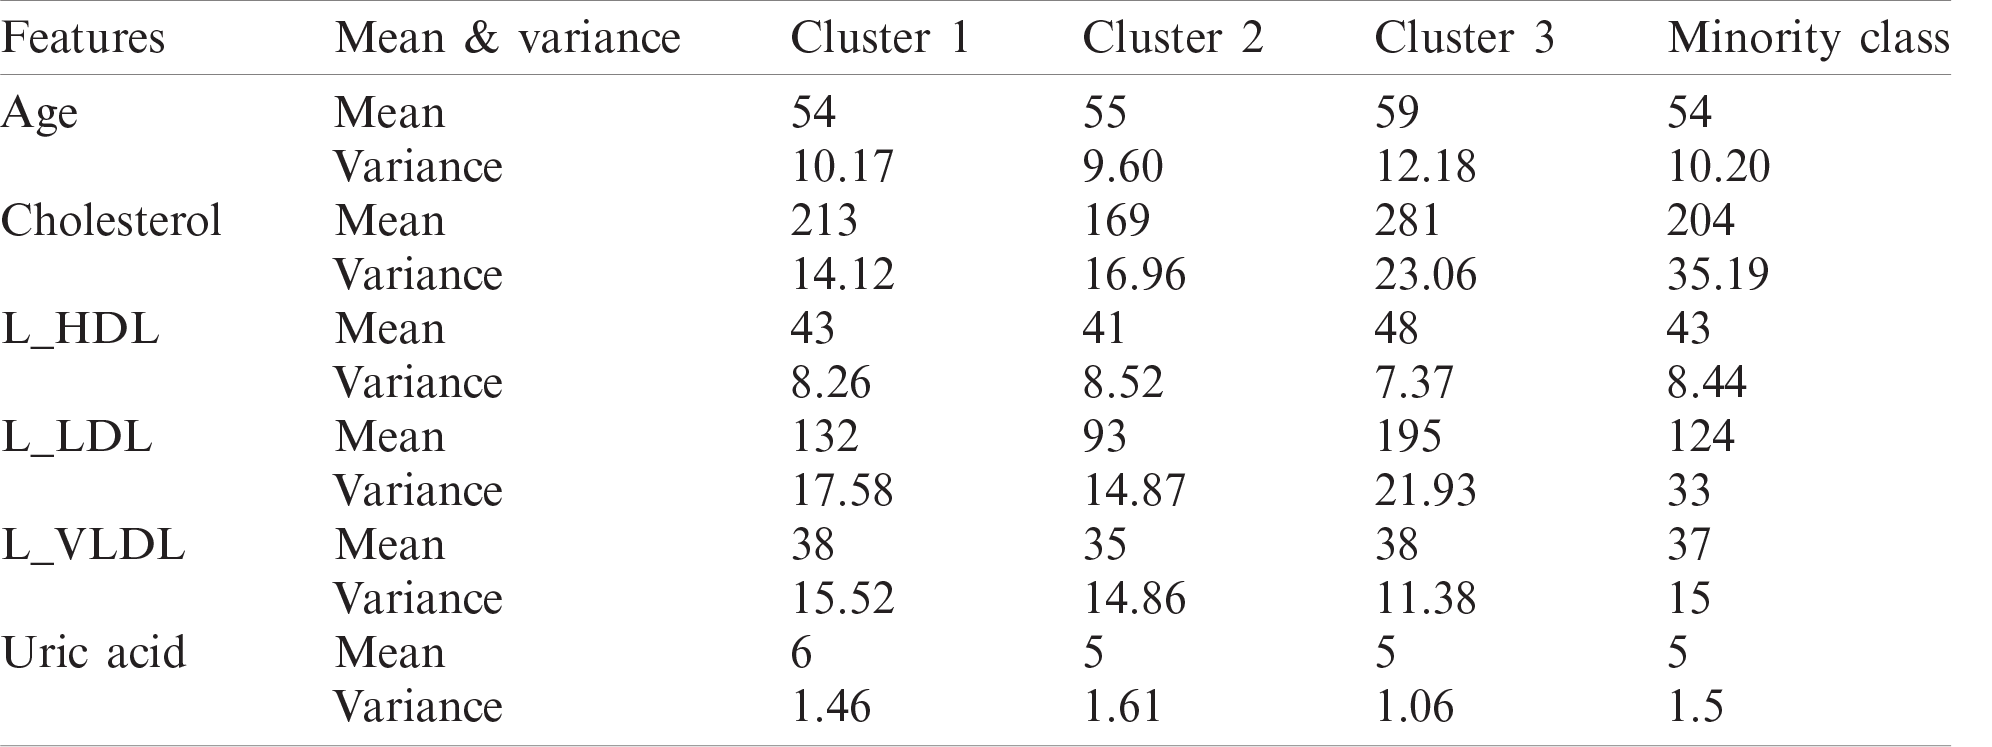
In order to show the impact of clustering on the minority class, the K-means clustering is applied on ZADA dataset to split the minority class into 3 clusters. Results in Tab. 3 show that when clustering the minority class, for some features, there is a significant difference between the estimated parameters (mean and variance) from one cluster to another compared to the overall parameters of the minority class. For example, for Cholesterol feature, the mean of clusters varies from 169 to 281, and the variance also varies from 14.12 to 23.06. This indicates that even within the same class (minority class), there is a possibility of some extra grouping of data, and this should be taken into account when oversampling. Therefore, using clustering for the minority class is crucial before applying oversampling method.
Table 3: Mean and variance of different clusters of ZADA dataset
5.2 Experiment 2: Test the Performance of GK-Means in Both Cases Correlated and Uncorrelated Features
In this experiment, the proposed GK-means oversampling method is applied on several datasets to create synthetic data in order to handle the imbalance class problem. Tabs. 4 and 5 show the performance of the six classification algorithms using GK-means on the six datasets in both cases (correlated and uncorrelated features) according to F1 metric (see Tab. 4) and Accuracy metric (see Tab. 5).
Table 4: Performance of the six classifiers based on GK-means for three imbalanced datasets method using F1 metric. Co.F and Uco.F indicate correlated and uncorrelated features
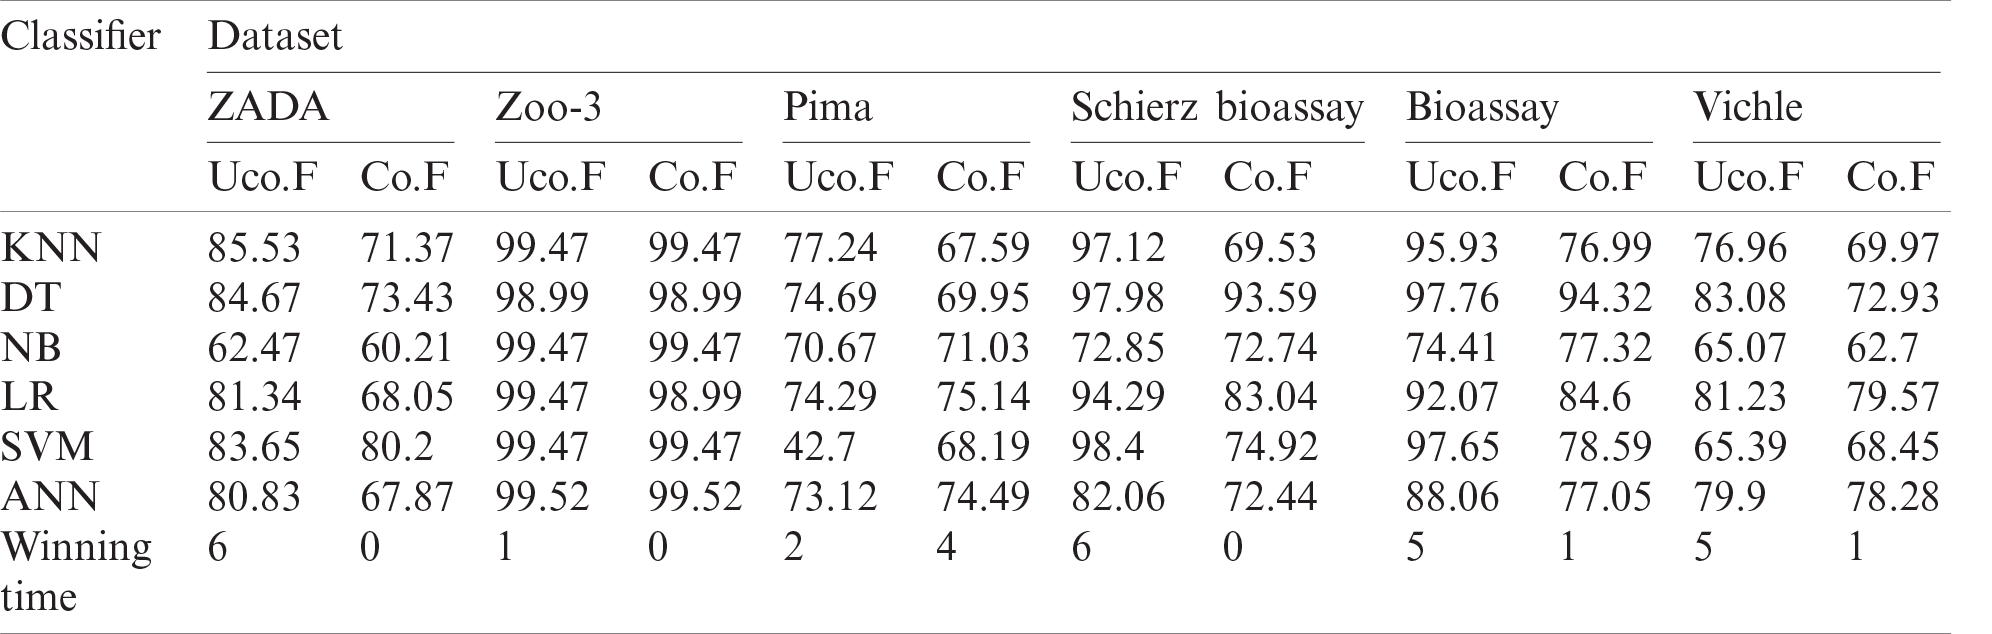
From the results in Tabs. 4 and 5, we can see that the performance of the classification algorithms with the GK-means method is higher when oversampling with uncorrelated features from multivariate Gaussian distribution. According to the winning times for correlated and uncorrelated features, we can see that the uncorrelated synthetic data generated from GK-means performed better and provided higher Accuracy and F1 in almost all algorithms and datasets used.
Table 5: Performance of the six classifiers based on GK-means for three imbalanced datasets method using Accuracy metric. Co.F and Uco.F indicate correlated and uncorrelated features
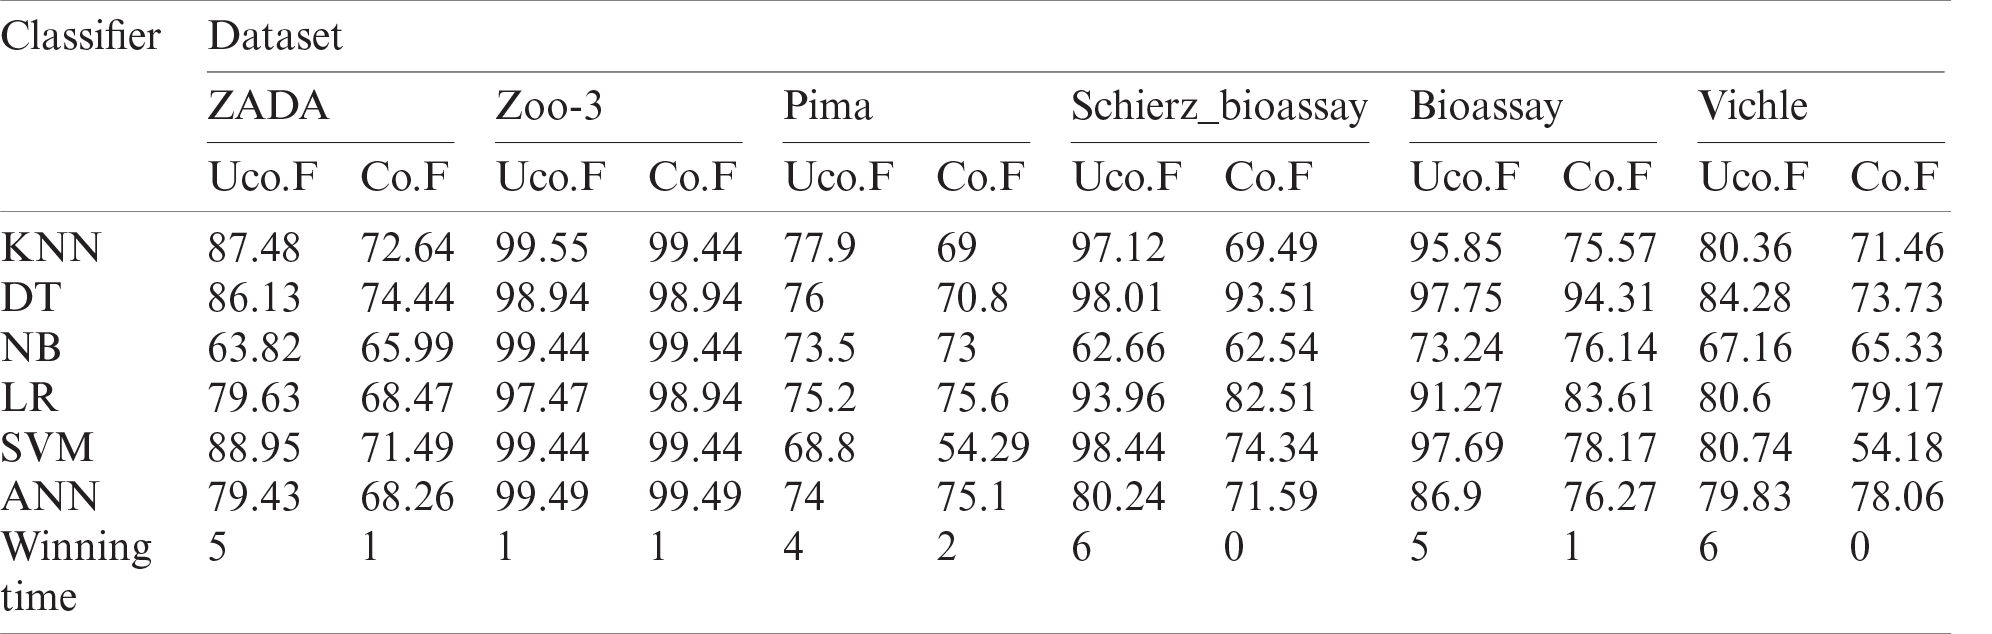
From our experimental results discussed above, we can see that oversampling with uncorrelated features from multivariate Gaussian distribution provided better and more accurate results. Therefore, we make the assumption that features are independent, thus we chose the uncorrelated features of GK-means method to be compared with SMOTE, ADASYN and GD oversampling methods which will be discussed next.
5.3 Experiment 3: Comparing Performance of GK-Means with Other Oversampling Methods
Tabs. 6–11 and Figs. 2–7 show the results of our proposed method along with the three other oversampling methods using the six datasets (ZADA, Schierz_Bioassay, Vichle, Zoo-3, Bioassay and Pima) with six classification algorithms, respectively. From the mentioned Tables and Figures, it can be seen clearly that classification with the original data (without resampling) has obtained good performance according to the Accuracy measure, but it obtained very bad results according to the F1 measure. This is because when data are imbalanced, the accuracy measure is confusing and unreliable as it only calculates how many samples are correctly classified without taking into account the number of instances in both majority and minority classes. However, unlike the Accuracy, the F1 measure takes into account the number of samples correctly classified in both classes. This indicates that relying only on the Accuracy metric will lead to misclassification, and the results will not be reliable. This situation is clearly viewed in all Figs. 2–7. On the other hand, when the oversampling methods were used, the performances of the classifiers, in terms of F1 measure, have improved when compared with the original data. This is because the number of samples in the minority class is increased, and data are balanced.
Looking at the results of the Pima dataset (Tab. 11 and Fig. 7) in more detail, we can see that the proposed method has not provided good classification results in terms of Accuracy and F1. The reason behind providing such bad results for this dataset is because the GK-Means method is based on the assumption that the features are uncorrelated. However, experiment 2 showed that only for this specific dataset, the proposed method has performed better when generating correlated features from the GK-Means method (see results in Tabs. 4 and 5 for Pima dataset). This indicates that the proposed method is sensitive to the pattern of data whether they are correlated or not. Nevertheless, the GK-Means is flexible to adapt itself with the nature of data before applying it for oversampling. In other words, if the data are already correlated, the GK-Means will generate correlated features from Gaussian distribution, and vise-versa.
Table 6: Classification performance of GK-means with three other methods for ZADA dataset

Table 7: Classification performance of GK-means with three other methods for Schierz_bioassay
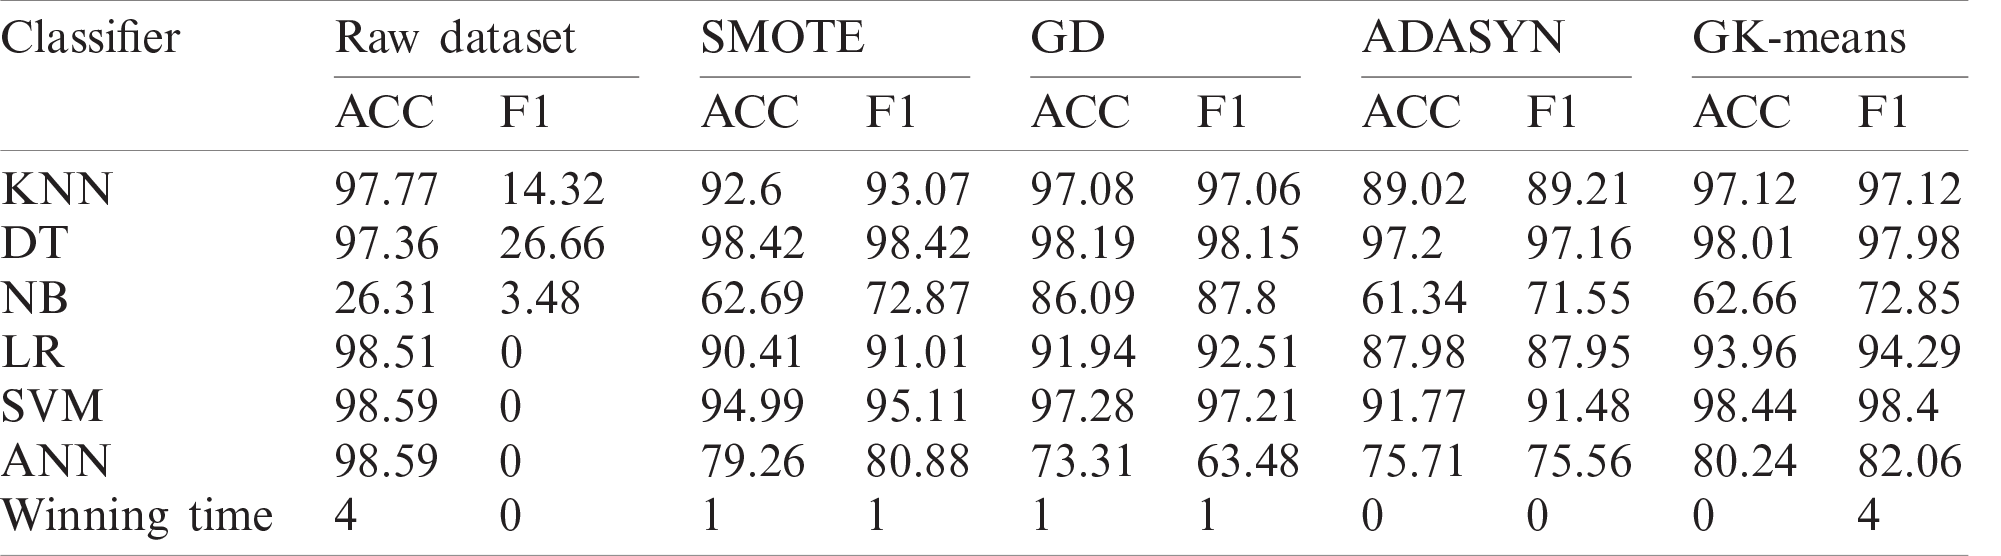
Table 8: Classification performance of GK-means with three other methods for Vichle dataset

Table 9: Classification performance of GK-means with three other methods for Zoo-3 dataset

Table 10: Classification performance of GK-means with three other methods for Bioassay dataset
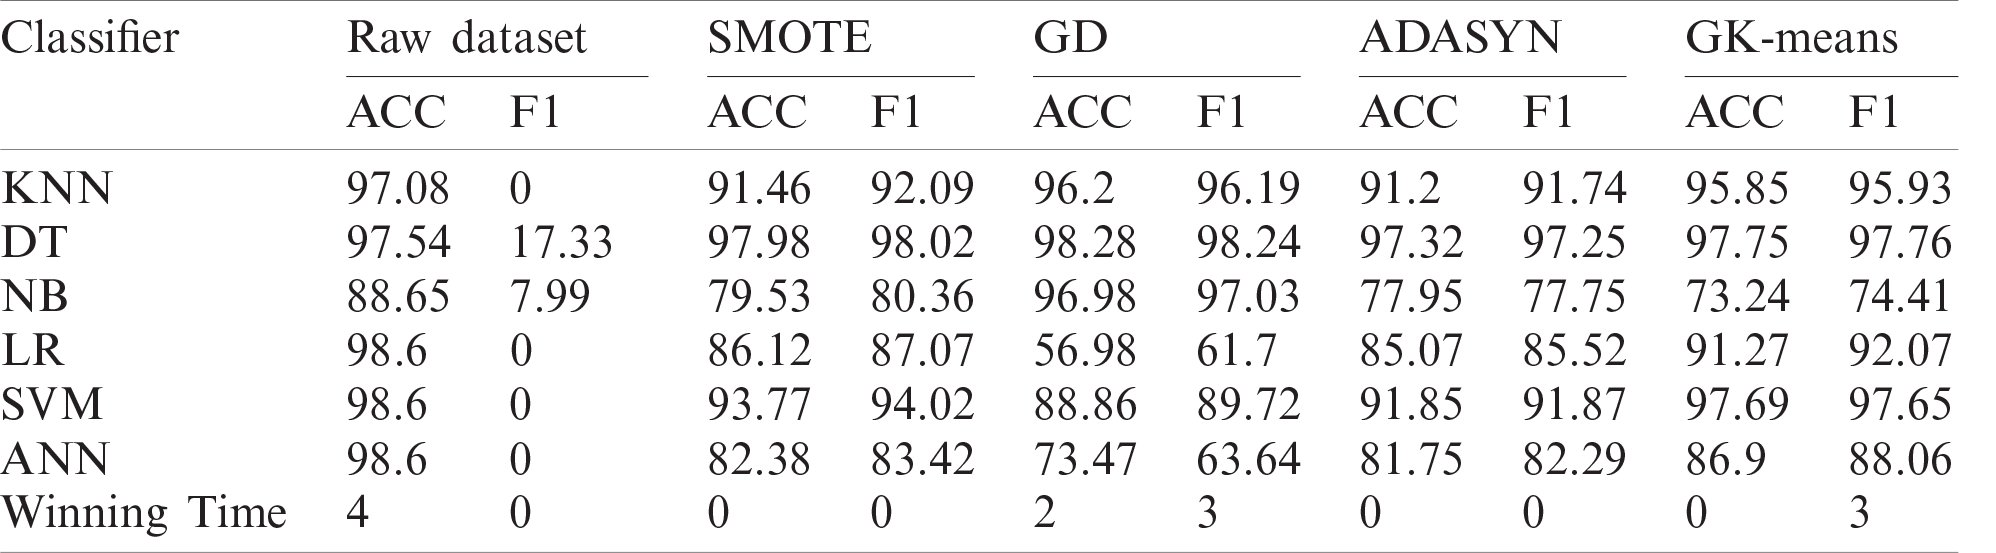
Table 11: Classification performance of GK-means with three other methods for Pima dataset
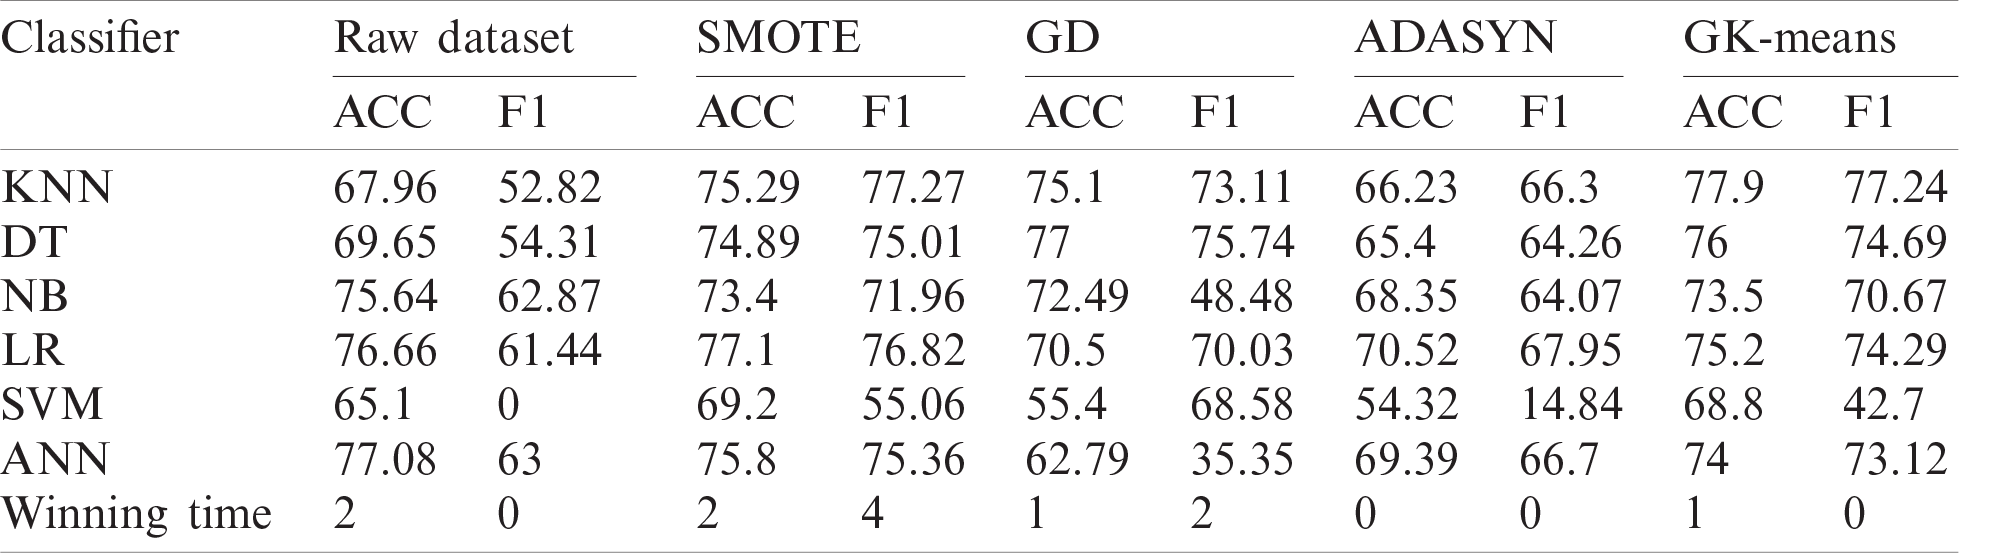
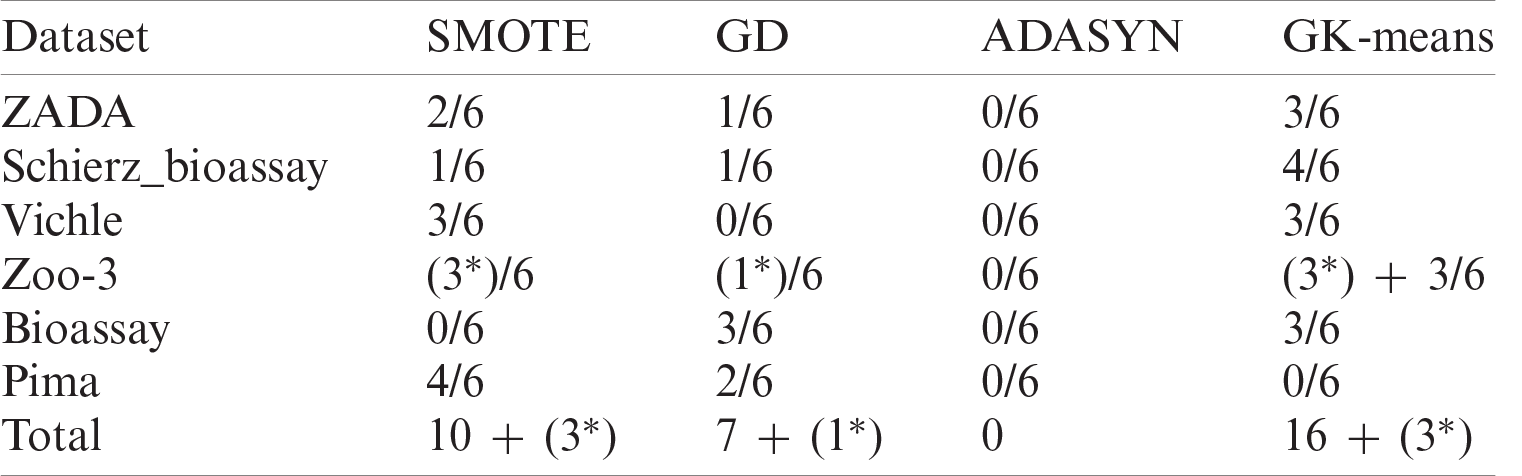
Tab. 12 summarize the performances in term of wining-time of the six classifiers using one of the four oversampling methods for each dataset. The first value 2/6 in Tab. 12 means that when applying the SMOTE method on the ZADA dataset, it performs better than other methods in two classifiers out of six, while the terms (3*) and (1*) means that at least 2 methods have obtained the same result using the same classifiers. From the results in Tab. 12, it can be seen clearly that the proposed method (GK-Means) has performed better than all other oversampling methods in all datasets except for the results of the Pima dataset, where the SMOTE method has performed better. The second-best performance has obtained with the SMOTE method while the worst results have obtained when the ADASYN method is used. In total, amongst the six datasets used with the six classification algorithms, the proposed method has performed better than other oversampling methods 16 times and has shared 3 times the same results with the SMOTE method and one similar result with the GD method. Therefore, our proposed method has significantly improved the performance results of the classification algorithms in terms of accuracy and F1 criteria when compared with other three methods. This indicates that GK-Means method can be used as a new oversampling method for handling the class imbalance problem.
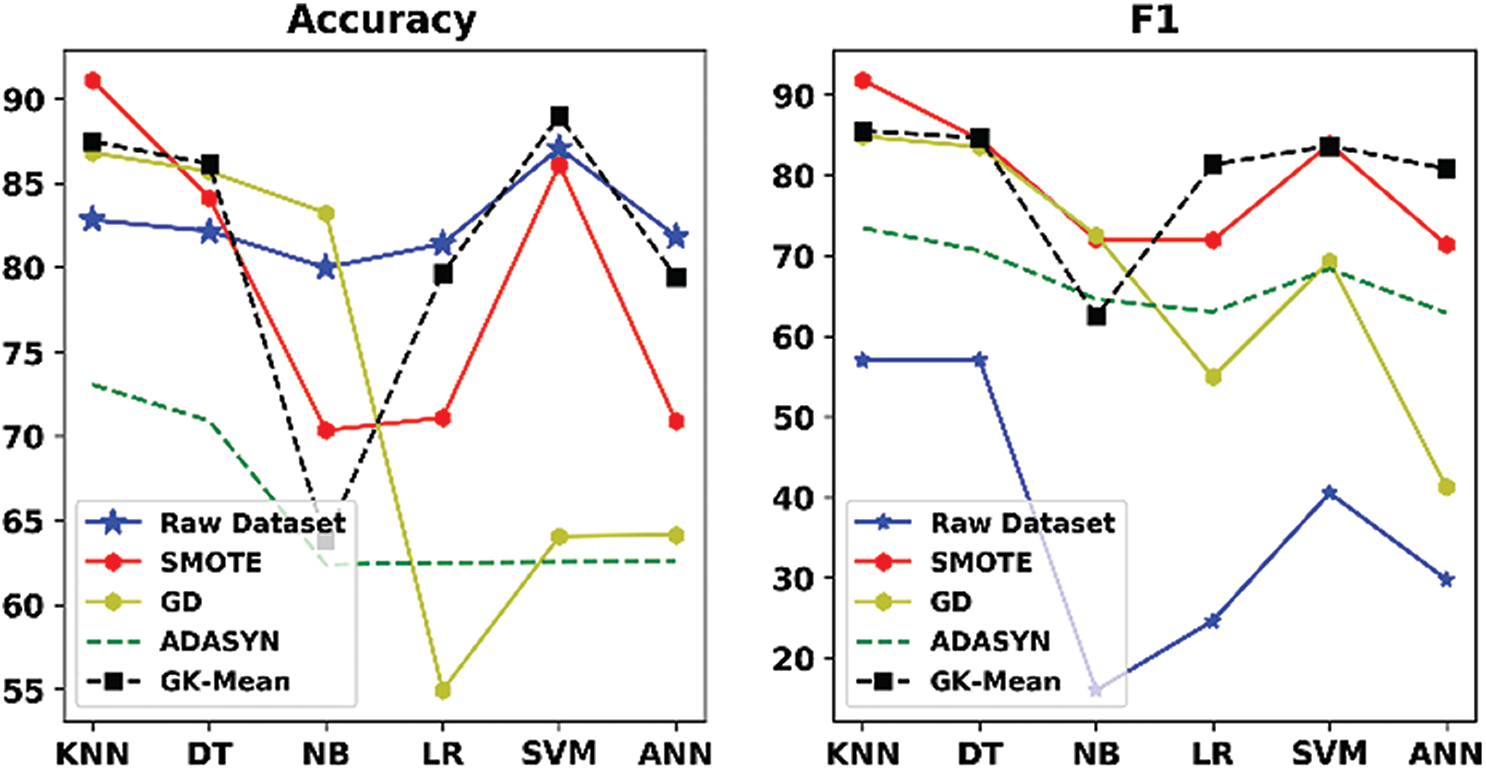
Figure 2: Accuracy and F1 measures for GK-means with the three other methods for ZADA dataset
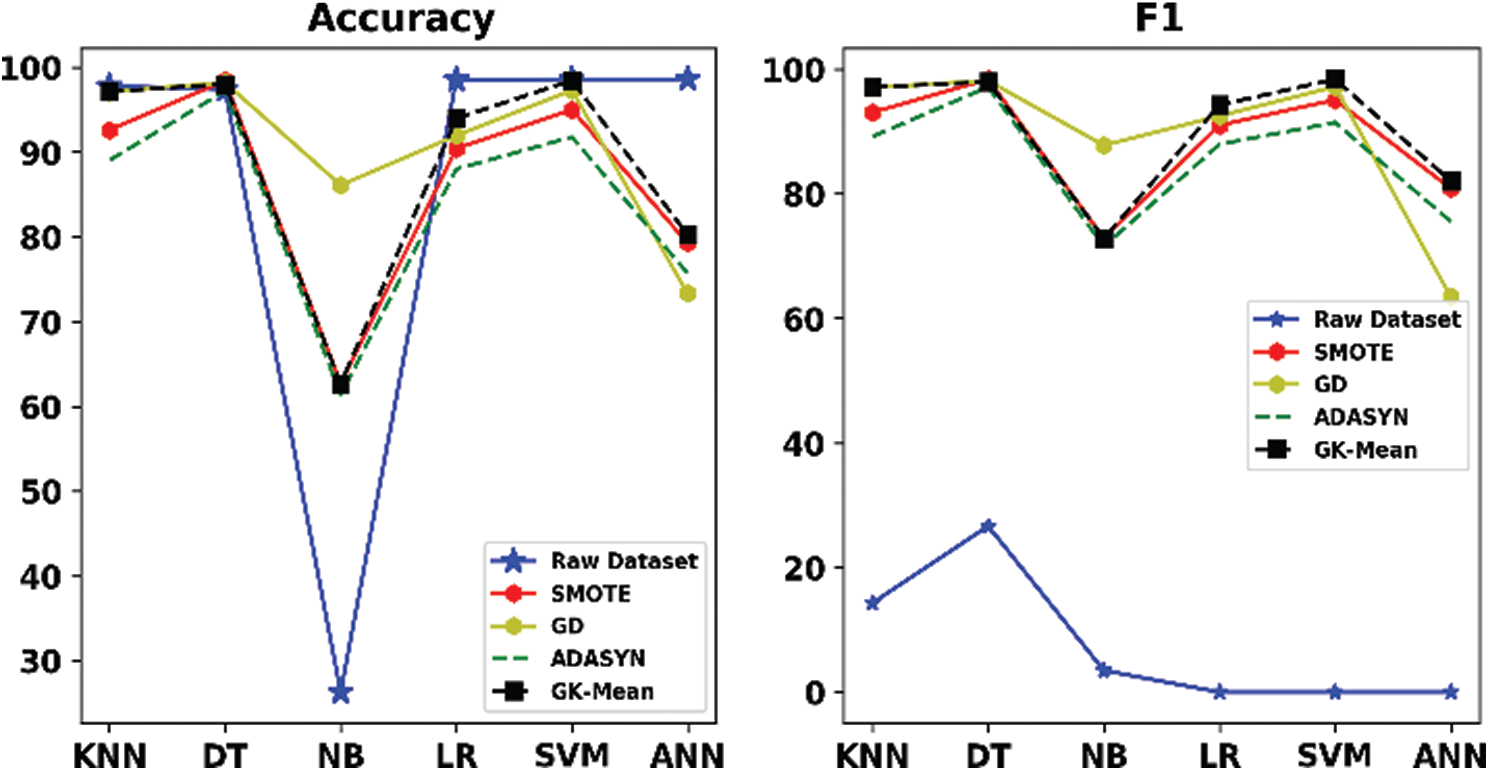
Figure 3: Accuracy and F1 for GK-means with the three other methods for Schierz_bioassay dataset
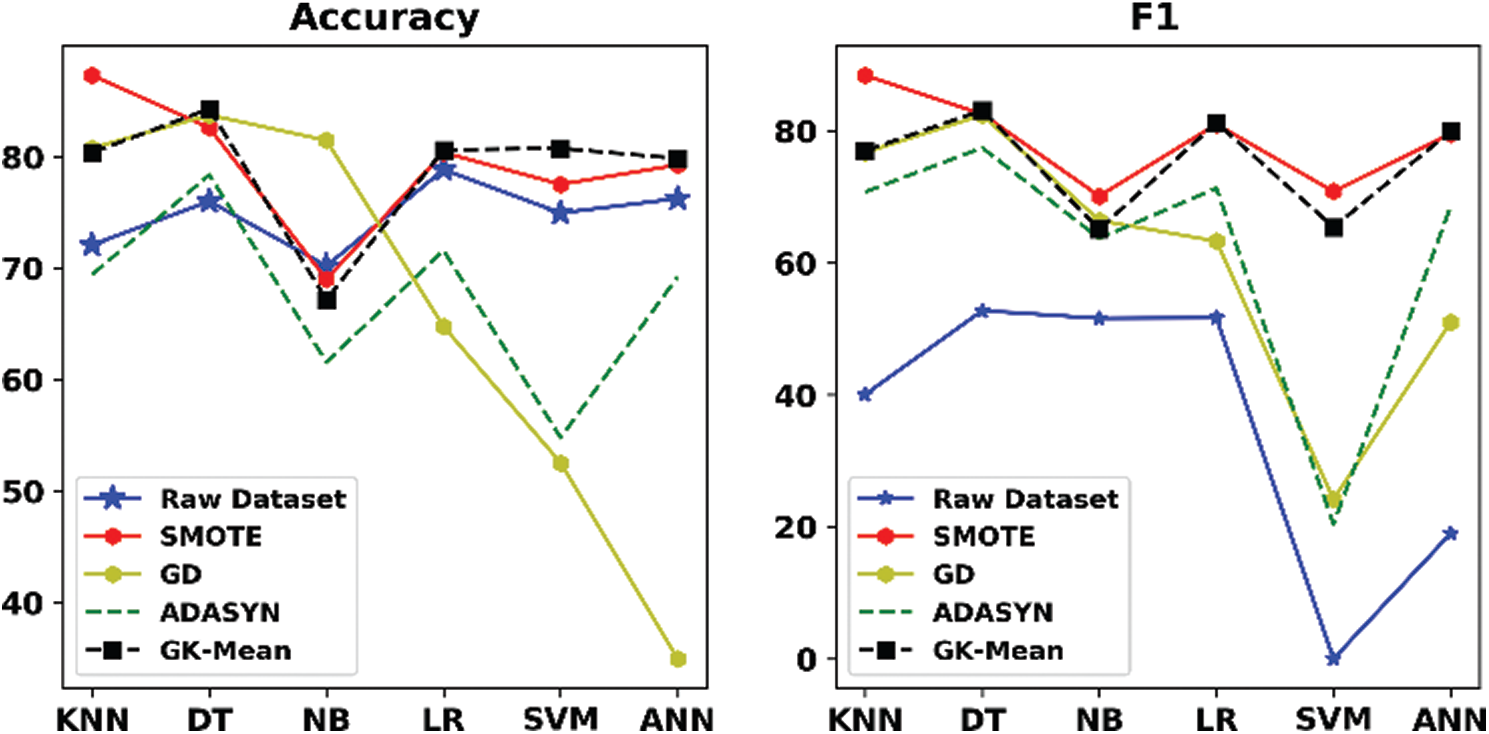
Figure 4: Accuracy and F1 measures for GK-means with the three other methods for Vichle dataset
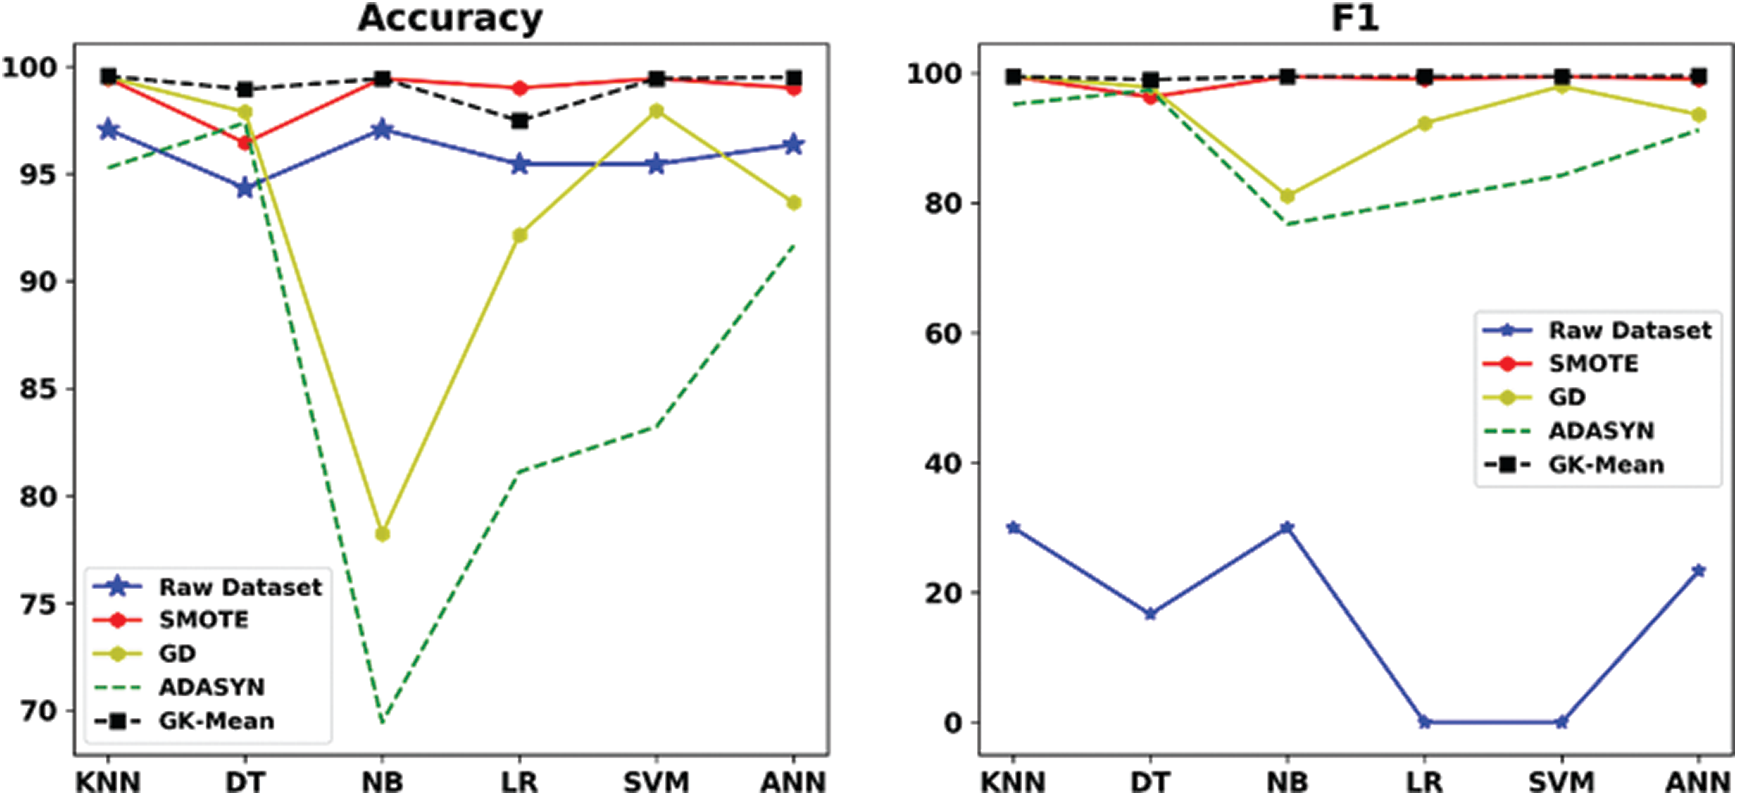
Figure 5: Accuracy and F1 measures for GK-means with the three other methods for Zoo-3 dataset
From the experimental results above, we conclude that our methodology is sensitive to the pattern of data. For example, if the features in dataset is already uncorrelated, then the GK-Means method will perform better with uncorrelated features generated from Gaussian distribution, and vice-versa. In addition, we observed that even when the number of samples in the minority class is very low, the new method has performed very well. To investigate this situation, we referred to data, and we have realised that the samples were significantly different from each other which helps the K-Means clustering to better split the minority class into different clusters. Thus, generated samples from each cluster will better represent the original data. This is because the number of generated samples will be based on the size of each cluster. For instance, if one cluster has 20% of samples and the other has 80%, the final generated samples will also have the same percentages. That means cluster one and two will generate 20% and 80%, respectively.
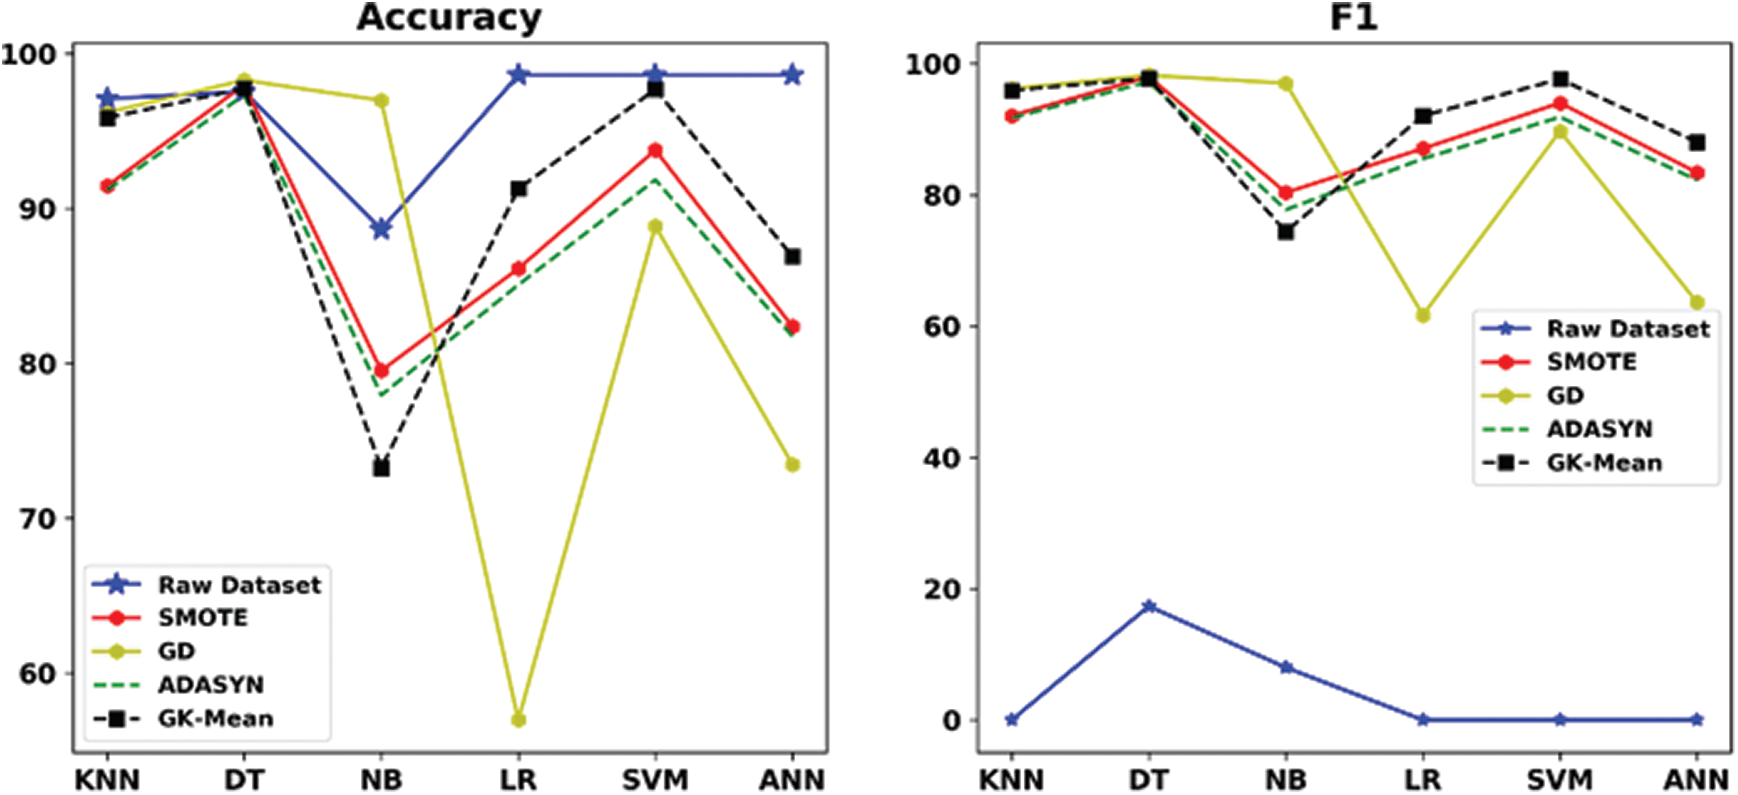
Figure 6: Accuracy and F1 measures for GK-means with the three other methods for Bioassay dataset
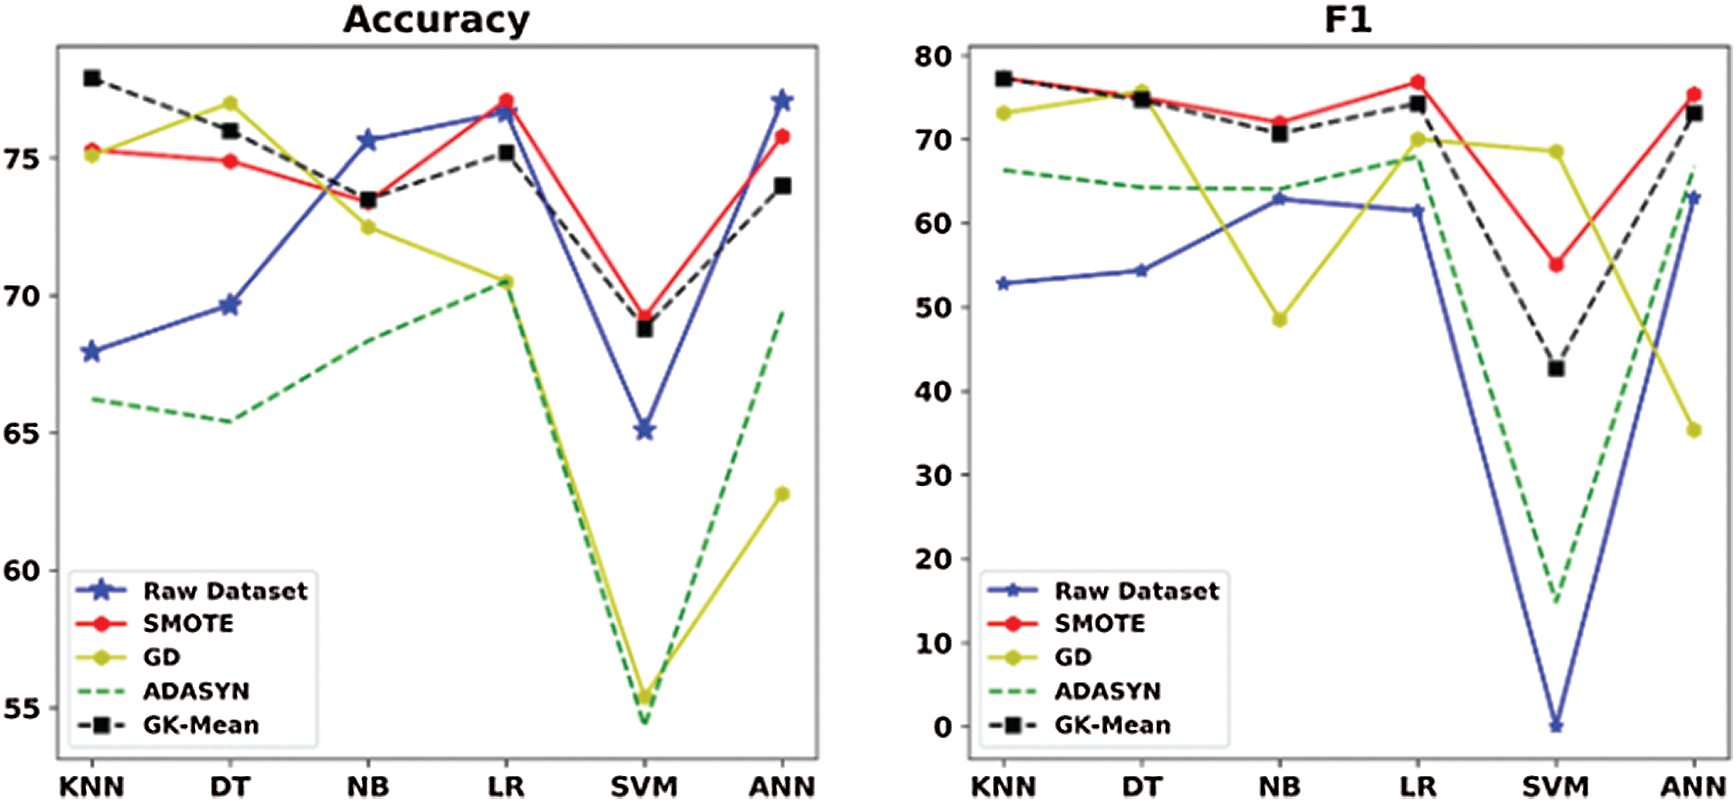
Figure 7: Accuracy and F1 measures for GK-means with the three other methods for Pima dataset
Table 12: Overall winning times for all six datasets
In this study, a new oversampling method, called GK-means, is proposed based on Multivariate Gaussian distribution and K-means clustering algorithm. The main advantage of GK-means method is its simplicity, efficiency, and flexibility in generating synthetic samples for the minority class. The performance of the new method was compared with three standard benchmark methods: SMOTE, ADASYN, and GD using six well-known classification algorithms. Experimental results on different datasets show that GK-means method has demonstrated a very good efficiency to solve the class imbalance problem, and it has the ability to outperform other standard oversampling methods. GK-means method has provided equal or better results than the SMOTE, ADASYN, and GD in terms of the accuracy and F1 metrics. We conclude that GK-means can be used as a potential tool to solve the class imbalance problem.
This study is only a starting point for further investigations on the proposed GK-means method. Future work may thus concentrate on applying this method to other real-world problems. One can also replace the K-means with other clustering methods used in our proposed method to further investigate the existing clusters in the minority class. The components of GK-means (Gaussian Distribution and K-means clustering) are freely available in many programming languages, which allows researchers and specialists to easily execute and utilize the proposed method in their favored environment. Additionally, finding ideal estimations of hyperparameter
The newly created ZADA dataset was used for the first time, and it has not been used in any other machine learning applications. As a future work, one can use our dataset for other machine learning applications, such as regression and clustering algorithms to further extract the hidden patterns of the data. For example, it can be used for regression to find the relationship between the independent features in ZADA dataset with a view to predict Fasting_Blood_Sugar feature. Moreover, the ZADA dataset was labeled manually by diabetes experts; one can use different clustering algorithms, such as Mean-Shift and Agglomerative Hierarchical Clustering, to automatically label the data for further investigations.
Funding Statement: The author(s) received no specific funding for this study.
Conflicts of Interest: The authors declare that they have no conflicts of interest to report regarding the present study.
1. M. Mohammed, M. B. Khan and E. B. M. Bashie, Machine Learning: Algorithms and Applications, CRC Press, 2016. [Google Scholar]
2. O. Simeone, “A very brief introduction to machine learning with applications to communication systems,” IEEE Transactions on Cognitive Communications and Networking, vol. 4, no. 4, pp. 648–664, 2018. [Google Scholar]
3. A. C. Lorena, L. P. F. Garcia, J. Lehmann, M. C. P. Souto and T. K. A. M. Ho, “How complex is your classification problem?: A survey on measuring classification complexity,” ACM Computing Surveys, vol. 52, no. 5, pp. 1–34, 2019. [Google Scholar]
4. D. Brzezinski and J. Stefanowski, “Chapter 3 ensemble classifiers for imbalanced and evolving,” Worldscientific, vol. 83, pp. 44–68, 2018. [Google Scholar]
5. P. Kaur and A. Gosain, “Comparing the behavior of oversampling and undersampling approach of class imbalance learning by combining class imbalance problem with noise,” In: A. Saini, A. Nayak, and R. Vyas (Eds.) ICT Based Innovations. Advances in Intelligent Systems and Computing, Singapore, Springer, vol. 653, pp. 23–30, 2018. [Google Scholar]
6. F. Kamalov, “Kernel density estimation based sampling for imbalanced class distribution,” Information Sciences, vol. 512, no. 1, pp. 1192–1201, 2020. [Google Scholar]
7. F. Last, G. Douzas and F. Bacao, “Oversampling for imbalanced learning based on K-Means and SMOTE,” Information Sciences, vol. 465, pp. 120, 2017. https://doi.org/10.1016/j.ins.2018.06.056. [Google Scholar]
8. M. S. Santos, P. H. Abreu, P. J. García-Laencina, A. Simão and A. Carvalho, “A new cluster-based oversampling method for improving survival prediction of hepatocellular carcinoma patients,” Journal of Biomedical Informatics, vol. 58, no. 10, pp. 49–59, 2018. [Google Scholar]
9. M. M. Pereira, “Comparing the performance of oversampling techniques in combination with a clustering algorithm for imbalanced learning,” Universidade Nova de Lisboa, vol. 652, pp. 22–30, 2018. [Google Scholar]
10. A. Aditsania, Adiwijaya and A. L. Saonard, “Handling imbalanced data in churn prediction using ADASYN and backpropagation algorithm,” in Proceeding-2017 3rd Int. Conf. on Science in Information Technology: Theory and Application of IT for Education, Industry and Society in Big Data Era, ICSI Tech, Bandung, Indonesia, vol. 2018, pp. 533–536, 2018. [Google Scholar]
11. N. Mustafa, J. Li, R. A. Memon and M. Z. Omer, “A classification model for imbalanced medical data based on PCA and farther distance based synthetic minority oversampling technique,” International Journal of Advanced Computer Science and Applications, vol. 8, no. 1, pp. 61–67, 2017. [Google Scholar]
12. H. Zhang and Z. Wang, “A normal distribution-based over-sampling approach to imbalanced data classification,” Lecture Notes in Computer Science (Including Subseries Lecture Notes in Artificial Intelligence and Lecture Notes in Bioinformatics), vol. 7120 LNAI, no. PART 1, pp. 83–96, 2011. [Google Scholar]
13. D. Elreedy and A. F. Atiya, “A comprehensive analysis of synthetic minority oversampling technique (SMOTE) for handling class imbalance,” Information Sciences, vol. 505, no. 1, pp. 32–64, 2019. [Google Scholar]
14. S. Maldonado, J. López and C. Vairetti, “An alternative SMOTE oversampling strategy for high-dimensional datasets,” Applied Soft Computing Journal, vol. 76, no. 2, pp. 380–389, 2019. [Google Scholar]
15. R. G, A. K. Tyagi and V. K. Reddy, “Performance analysis of under-sampling and over-sampling techniques for solving class imbalance problem,” SSRN Electronic Journal, pp. 1305–1315, 2019. https://doi.org/10.2139/ssrn.3356374. [Google Scholar]
16. T. Le, M. T. Vo, B. Vo, M. Y. Lee and S. W. Baik, “A hybrid approach using oversampling technique and cost-sensitive learning for bankruptcy prediction,” Complexity, vol. 2019, no. 2, pp. 1–12, 2019. [Google Scholar]
17. M. M. Hassan and N. N. Amiri, “Classification of imbalanced data of diabetes disease using machine learning algorithms,” in IV. Int. Conf. on Theoretical and Applied Computer Science and Engineering, Istanbul, Turky, 2019. [Google Scholar]
18. A. J. Mohammed, M. M. Hassan and D. H. Kadir, “Improving classification performance for a novel imbalanced medical dataset using smote method,” International Journal of Advanced Trends in Computer Science and Engineering, vol. 9, no. 3, pp. 3161–3172, 2020. [Google Scholar]
19. J. L. P. Lima, D. MacEdo and C. Zanchettin, “Heartbeat anomaly detection using adversarial oversampling ,” in Proc. of the 2019 Int. Joint Conference on Neural Networks, Budapest, Hungary, pp. 1–7, 2019. https://doi.org/10.1109/IJCNN.2019.8852242. [Google Scholar]
20. Q. Wang, W. Cao, J. Guo, J. Ren, Y. Cheng et al., “DMP_MI: An effective diabetes mellitus classification algorithm on imbalanced data with missing values,” IEEE Access, vol. 7, pp. 102232–102238, 2019. [Google Scholar]
21. M. Caron, P. Bojanowski, A. Joulin and M. Douze, “Deep clustering for unsupervised learning of visual features,” In: V. Ferrari, M. Hebert, C. Sminchisescu and Y. Weiss (Eds.) Computer Vision ECCV 2018. ECCV 2018. Lecture Notes in Computer Science, Springer, Cham, LNCS, vol. 11218, pp. 139–156, 2018. [Google Scholar]
22. A. S. Eesa and Z. Orman, “A new clustering method based on the bio-inspired cuttlefish optimization algorithm,” Expert Systems, vol. 37, no. 2, pp. 75, 2020. [Google Scholar]
23. M. Q. Duong, L. H. Lam, B. T. M. Tu, G. Q. Huy and N. H. Hieu, “A combination of K-mean clustering and elbow technique in mitigating losses of distribution network,” GMSARN International Journal, vol. 13, no. 4, pp. 153–158, 2019. [Google Scholar]
24. P. Fränti and S. Sieranoja, “K-means properties on six clustering benchmark datasets,” Applied Intelligence, vol. 48, no. 12, pp. 4743–4759, 2018. [Google Scholar]
25. W. Wuensch, A. Degiovanni, S. Calatroni, A. Korsbäck, F. Djurabekova et al., “Statistics of vacuum breakdown in the high-gradient and low-rate regime,” Physical Review Accelerators and Beams, vol. 20, no. 1, pp. 1–11, 2017. [Google Scholar]
26. R. D. Lee and E. J. Dudewicz, “Introduction to statistics and probability,” The Mathematical Gazette, vol. 61, no. 417, pp. 235, 2019. [Google Scholar]
27. M. M. Hassan, “Bayesian sensitivity analysis to quantifying uncertainty in a dendroclimatology model,” in ICOASE 2018-Int. Conf. on Advanced Science and Engineering, Duhok, Irag, pp. 363–368, 2018. https://doi.org/10.1109/ICOASE.2018.8548877. [Google Scholar]
28. A. Aubry, A. De Maio and L. Pallotta, “A geometric approach to covariance matrix estimation and its applications to radar problems,” IEEE Transactions on Signal Processing, vol. 66, no. 4, pp. 907–922, 2018. [Google Scholar]
29. Q. Zou, S. Xie, Z. Lin, M. Wu and Y. Ju, “Finding the best classification threshold in imbalanced classification,” Big Data Research, vol. 5, no. 9, pp. 2–8, 2016. [Google Scholar]
 | This work is licensed under a Creative Commons Attribution 4.0 International License, which permits unrestricted use, distribution, and reproduction in any medium, provided the original work is properly cited. |