DOI:10.32604/cmc.2021.018236
| Computers, Materials & Continua DOI:10.32604/cmc.2021.018236 | |
| Article |
An E-Business Event Stream Mechanism for Improving User Tracing Processes
1College of Computers and Information Sciences, Jouf University, Sakaka, 72314, Saudi Arabia
2Faculty of Computers and Informatics, Zagazig University, Zagazig, 44519, Egypt
3College of Computer Science and Engineering, Taibah University, Medina, 42353, Saudi Arabia
*Corresponding Author: Ayman Mohamed Mostafa. Email: amhassane@ju.edu.sa
Received: 01 March 2021; Accepted: 02 April 2021
Abstract: With the rapid development in business transactions, especially in recent years, it has become necessary to develop different mechanisms to trace business user records in web server log in an efficient way. Online business transactions have increased, especially when the user or customer cannot obtain the required service. For example, with the spread of the epidemic Coronavirus (COVID-19) throughout the world, there is a dire need to rely more on online business processes. In order to improve the efficiency and performance of E-business structure, a web server log must be well utilized to have the ability to trace and record infinite user transactions. This paper proposes an event stream mechanism based on formula patterns to enhance business processes and record all user activities in a structured log file. Each user activity is recorded with a set of tracing parameters that can predict the behavior of the user in business operations. The experimental results are conducted by applying clustering-based classification algorithms on two different datasets; namely, Online Shoppers Purchasing Intention and Instacart Market Basket Analysis. The clustering process is used to group related objects into the same cluster, then the classification process measures the predicted classes of clustered objects. The experimental results record provable accuracy in predicting user preferences on both datasets.
Keywords: Business transactions; event stream; log file; tracing parameters; clustering-based classification
E-business becomes an international business that covers and extends all over the world. It is necessary to find a suit framework and form to preserve the stakeholder’s rights and ethics. Financial institutions should support E-business processes to maximize profits while maintaining a degree of ethics. Ethics is a set of behaviors and principles that focus on values and moral feels, while morality is the implementation and translation of ethics into tangible acts and activities [1]. The rising number of available web services results in the need to facilitate web service presented to consumers to specify their required specification services. Different platforms are required to publish, view and compare services in order to enhance organizational profit [2]. Different semantic web services are proposed to define the automatic services by providing semantic descriptions with additional mechanisms to model services.
Social network sites provide a large dataset to predict major opportunities, challenges and enhancing interactive online business operations [3]. Through the revolution of technologies, E-business applications become the most important and popular way to share data between users [4]. The rapid development in technical and production mechanisms and processes, lead to update and develop the E-business and engineering activities.
Enhancing and predicting E-business operations depends mainly on managing and organizing the web server log of the E-business framework. Organizing the web server log operations can enhance and improve the process of user tracing to predict user behavior.
The web server log files collect webpage request history information in chronological order. Typically, the collected and stored information includes client IP, client name, request date and time, server site name, server computer name, server IP, server port, client server method, client serves URL stream, client server URL query, server client status, server client win32 status, server client bytes, the client server bytes, time taken, client server version, client server host, user agent, cookies, and the referring URL. In [5], these data are divided into different classes that are general statistics, software warning and system failure, safety instructions, approval of program execution, and Time-based functions. In [6], the challenges associated with that information have been identified. These challenges include merging extraneous information with useful ones, generating multiple server requests by a single user action, and the lack of recording local activities. The general characteristics of web log files are mentioned in [7].
This paper proposes a set of satisfaction relations to formalize rules that can trace and record different E-business processes. An event universe of quintuple parameters is presented to determine a complete tracing mechanism for predicting user behavior. The organization of the paper is as follows: Section 2 presents a set of related work in the field of E-business. In Section 3, we propose satisfaction relations to be applied to the log file. In Section 4, we present an event universe mechanism to trace all user actions with a set of formula patterns. In Section 5, we present a counting methodology based on the proposed event universe to record the frequency of the performed user actions that can lead to better user behavior prediction. In Section 6, the methodology for improving the user tracing processes is presented. In Section 7, we conduct the experimental results using clustering and classification algorithms on different data sets. In Section 8, the conclusion with recent points to be used in future works is introduced.
The role of E-business engineering in developing a new framework can provide more facilities to improve the cooperation between the company and consumer. E-business engineering can improve and develop systems optimization, security, privacy, and trust in systems. The main risks and challenges that may be faced are how to preserve the quality of services during its growth with respect to some security challenges or risks about keeping user’s data and information safe and preserving their privacy. As a result, the more accurate forecasting gives a more effective strategy and ameliorates the predicted situation [8]. Managers play a huge role in improving the firms of their business, by well understanding and evaluating the true market value of a firm’s security activity that will help them make the right market decisions [9]. The main important and required factor is how to formalize the log file so that all user records can be traced which can lead to a better expectation of user behavior [10].
To improve the performance, elasticity, maintainability, reusability, and scalability of the E-business, a three-layer E-business architecture is established. These layers are the presentation layer, business logic layer, and data layer; each layer has its responsibilities and role [11]. As well, they are used to record all user operations into a web server log or a log file.
The following subsections highlight key aspects of the web server log regarding its role and classifications, state-of-the-art mechanisms for analyzing the web server log, and the most recent researches that apply data mining and machine learning techniques to enhance prediction from data in the web server log.
A log file is an automatically generated plain text data file that works on events, processes, activities, actions, tasks, messages, and communication for an operating system, application, or server. According to where the log files are located, they are classified into three types: web server log files, proxy server log files, and client browser log files [12–14]. The major drawbacks of these server-side logs, proxy-side logs, and client-side logs are described in [15]. In [16], web server log files are described as a many-to-one relationship; multiple users visit a single website. The proxy server log files are considered to be many-to-many relationships where one user can access many websites and many users can visit one website. Whereas, the client browser log files are in the form of one-to-many relationships; a particular user visits many websites.
Indeed, the web log file act as the visitor’s logbook. Moreover, they have the ability to answer some important questions such as which webpages are getting the most and the least traffic, which webpages are requested, when the webpages are requested, who requested them, where they were referred from, which browsers and operating systems are used to access a website, and when search robots and directory editors visit a web site.
Analyzing web log data is like looking for diamonds in a coal mine. Indeed, web log files assist in gaining a serious idea of a user. Some of the primary benefits of analyzing web log files from a user’s point of view include capturing the knowledge of user’s behavior, determining user satisfaction, satisfying user expectations, building user sessions, predicting the intention of the user, inferring user demographics to apply market segmentation, improving user attraction, improving user retention, enhancing advertisements cross-sales, and gathering information about user navigation patterns. Various research papers for web log files are presented to explain its main idea and recent methodologies in enhancing the web server log.
Suneetha et al. [15] provide a web log data analysis for the NASA website. The analysis has the ability to determine the total number of Hit ratio and the potential visitors to the site either the number of visitors per day or the total number of unique visitors. Moreover, the occurred system errors, corrupted and broken links are determined to assist system administrators and web designer to arrange website. As shown in [17], another analysis methodology for NASA web server log is executed using one of the Hadoop data analytics tools called Apache Pig. The main goal of that research is to analyze NASA big data for enhancing the prediction of data. Verma et al. [6] provide a statistical analysis of web log files for the NASA website. The authors analyzed the data for August 1995 using web log software to describe and visualize the behavioral aspects of users such as the number daily visitors, types of daily error, and user activity by day of the week. The daily error types include 404 not found, 403 forbidden, 400 bad request, and 500 internet server error.
As presented in [18], a stochastic mechanism is provided for the modeling of an intention of purchase. The authors use the Hidden Markov Model (HMM) to predict user browsing behavior with the intent to purchase from an E-commerce site. In [19], the user behavior toward advertisements from E-commerce data is modeled by using a combination of HMM and Logistic Regression. The main objectives of this research are to determine the effect of advertising on the user’s purchasing behavior, to capture the influence of both the advertisement properties and the user’s internal state on the user’s purchase behavior prediction, to assess which advertisements are most likely to produce purchases from a specific user, and to provide acceptable advertisements to a particular user.
As shown in [20], online web log data is analyzed for a blogging website created by authors. The analysis process is used to improve the site’s structure and generate insights into the behavior of viewers who have visited the site for two weeks. The viewers’ behavior is measured by identifying the page that attracts the user’s interest, the page that ensures the visitor continues to browse the site, the page that accessed mostly by visitors, and the hourly traffic analysis over the course of two weeks of website activity. Another analysis mechanism for the web server log is introduced in [13]. The author’s goal is to determine system errors, user preferences, user behaviors, website popularity, technical information about users, as well as corrupted and broken links. The authors provide statistical information about most visited pages, popular paths through the site, length of stay of the visitor, visits per hour in a day, most used search engines, phrases used by visitors, and the most common server errors. The authors of [21] perform various analyzes to judge the interest and behavior of users from the web server logs of an academic institutional website. The authors utilize the Aw-stats WM tool to collect web log data in various aspects. Additionally, they use the WEKA tool to visualize the extracted patterns.
Sujatha et al. [7] propose a model named PUCC, to predict user’s navigation patterns from web log data using clustering and classification. In the PUCC model, the graph partitioning clustering algorithm is used to assign a user to a predefined labeled category when the user’s data contain more features similar to that category. The Longest Common Subsequence (LCS) classification algorithm is used to separate web log data into groups of users with similar navigation. Based on the extracted patterns from the clustering and classification process, the user’s future requests could be predicted. As shown in [22], an analysis of behavioral patterns and users’ profiles are applied for an educational institution web log data within one day. The authors utilize the web log expert tool to extract activities such as total hits, number of visitors, users’ IP addresses, page views, consumed bandwidth, most popular page, and most downloaded files.
Another statistical analysis method is conducted using association rules-based analysis to the web log file for a bookstore website [23]. The analysis is carried out for exploring the dependencies between the various characteristics of a user’s visit to the online store’s website and the likelihood that they will end up purchasing. The authors divide the user behavior into three categories. These categories are anonymous users visiting only one page without logging in and purchasing, users who logged in but did not purchase anything, and users who decided to make a purchase. Murata et al. [24] provide a method for analyzing users’ web-watching behaviors and extracting users’ interests from augmented web audience measurement data. The analysis is conducted to represent the data as a graph structure of sites and keywords. This representation is due to the fact that the visited websites and search keywords are related to each other in a chronological sequence. The page rank ranking algorithm is used to evaluate the quality of the extracted interests.
As shown in [25], an analysis of web user behavior is performed by applying the business process management (BPM) technique to an online travel and booking agency. The basic idea is to treat user clicks that are extracted from the web log file as an unstructured process. Then, using process mining algorithms to discover user behavior after classifying and transforming URLs into events. As presented in [26], a graph partitioning-based approach is proposed to a cluster of user’s web navigation behavior by generating an undirected graph that is based on the connection between each pair of the web pages. The authors use the web log file to model user navigation patterns and predict future user request.
2.3 Machine Learning on E-Business Applications
Clustering and classification algorithms are considered major methods for analyzing and measuring the performance of E-business applications. As presented in [27], an E-business framework is presented by clustering information networks to discover the optimal clusters given from different datasets. Most E-business applications are based on small and medium-sized enterprises that require high analysis of their business processes. As shown in [28], a random forest classification algorithm is used to determine the preferences of E-business applications. Based on the experimental results stated in this research, different recommendations can be taken to enhance the structure of small-medium enterprises. Another E-business process management based on classification algorithms is presented in [29]. In this research, a predictive analysis using 20 classifiers is proposed to evaluate the classifier’s accuracy and performance on different event logs. The log traces should be also secured from security breaches and attacks. The authors of [30] propose two classification approaches to provide secure tracing processes. The first approach is model-driven which is based on behavioral activities of event logs while the second approach is example-driven which is based on the sequence of events.
As shown in [31], web data mining is applied to E-commerce using the linear regression algorithm to obtain frequent access patterns from the web log data and provide valuable information about users’ interests. The linear regression algorithm is used to calculate the accuracy of the output by representing the customer’s user ID and the number of times the product is searched as input variables while the searched product is used as the single output variable.
2.4 LTL Model Checking Approach
The Linear-Temporal Logic (LTL) technique is used as an alternative to data mining to analyze the sequence of the actions performed by users from the E-business Web log files. The basic idea is to define different predefined queries to transfer web log records into event logs for capturing the users’ behavior. LTL is based on a set of mathematical formulas that can determine a set of constraints based on activities’ orders. The LTL defines a set of finite or infinite formula patterns for user processes and activities in order to predict future paths. Based on the prediction processes, the tracing processes can be enhanced and the user behavior can be predicted in future browsing processes.
As presented in [32], a set of formula patterns with a set of definitions are identified. The LTL formulas are applied for ordered and non-ordered browsing processes within a specific period of time to record an even stream of users. As presented in [33] one action at a specific period of time. As shown in [34], the LTL is applied to a real case study of an online Spanish provider of scraping products website called Up & Scrap website. The LTL patterns are used to analyze user behavior in the website by dividing the website into the main section and secondary sections where the main section represents the homepage of the website while the secondary sections represent the subsections for a set of products.
In the E-business architecture, there are different processes or operations that can be executed during user transactions. For predicting user behavior, a log file is created based on different event actions. As presented in [35], most of the systems do not fully utilize the web serve log that contains all previously recorded information of user activities. As presented in Tab. 1, all user processes are recorded in the pre-defined log file based on different event categories. The browsing process (B) is based on viewing different items in the E-business structure levels. The action process is based on revising (R), payment (P), and executing (E) user transactions. Returning items (RI) are considered a major action in the E-business structure if there are defects in the items. There are other main actions to the administrator of the web service such as adding, removing, and modifying posts (AP), (RP), and (MP) respectively on the web service.
Table 1: E-business user processes

For recording all user actions in the log file, a set of satisfaction processes should be defined for recording user operations. These satisfaction processes are considered an extension to [32,36] that proposed different LTL formula patterns for enhancing E-business structure performance. A satisfaction relation
Let
Let
Rule 1:
Rule 2:
Rule 3: If
Rule 4:
Information systems-related application of E-business is applied based on event logs for determining the number of occurrences that an action may be performed by a user. In an event log, each executed process constitutes a condition. All actions related to this condition will be traced and recorded in the log file. To record all event actions, an event universe e is defined based on the following definition:
Definition 1 (Event Universe e): an event universe e based on quintuple parameters is presented in the following formula:
where:
• u is the user of the action under consideration.
• c is the category of the items presented in the E-business web service.
• l is the level of the items being traced.
As presented in [36], the E-business structure is based on different levels for presenting items and sub-items.
• t is the time of the performed action.
• a is the action in the event universe e.
Based on the presented event universe and the several user processes, the statistical analysis of the overall processes will be based on the following definitions:
Definition 2 (Browsing Analysis): the percentage of browsing process (Bi) in the E-business web service is based on identifying the browsing process in the event universe e.
Definition 3 (Revise Analysis): the overall revise processes (Ri) must be analyzed based on the formula:
Definition 4 (Payment Analysis): the payment process (Pi) must be executed once the revise process is true. No payment process can be executed without revising processes. As a result, the payment must be executed with intersecting revise with browsing, revising, and payment processes based on the formula:
Definition 5 (Execute Analysis): as proposed in previous definitions, the execute process (Ei) must be followed by browsing, revise, payment processes based on the following formula:
Definition 6 (Rollback Analysis): the returning item (RIi) mechanism has a Boolean parameter whether the item may be returned back or not. The RIi must satisfy the condition that all preceding processes must be executed based on the formula:
Based on the previous definitions, different activities can be traced as part of the event stream. As shown in Fig. 1, a visual event stream is proposed for analyzing user actions. Each trace Id represents a set of subsequent activities based on the quintuple parameters
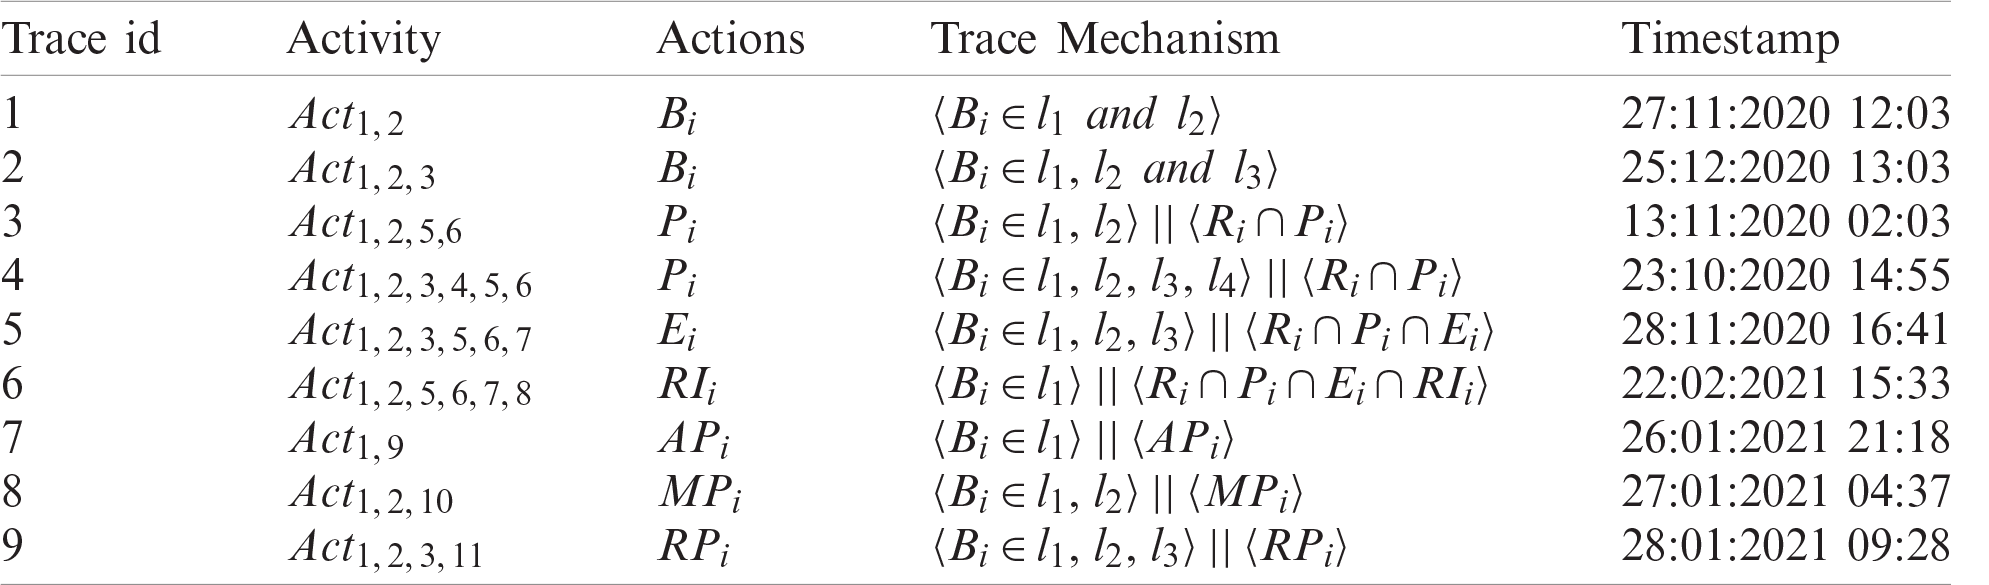
Assuming that the E-business structure is based on four levels of categories, each browsing level k must be preceded by a browsing level i. As presented in Tab. 2, a set of event log tracing processes is recorded. Each distinct event log is called a trace with different activities based on the structure of the web service. As shown in Tab. 2, each trace process has a trace id, and the sequence of corresponding activities. Each activity is associated with the final action of the user behavior. For example, for a user who performs an E-business process until execution action, the user can perform different browsing processes, then perform the payment actions as shown in trace id 7 and 8. A timestamp is added to view the specific time for each tracing mechanism.
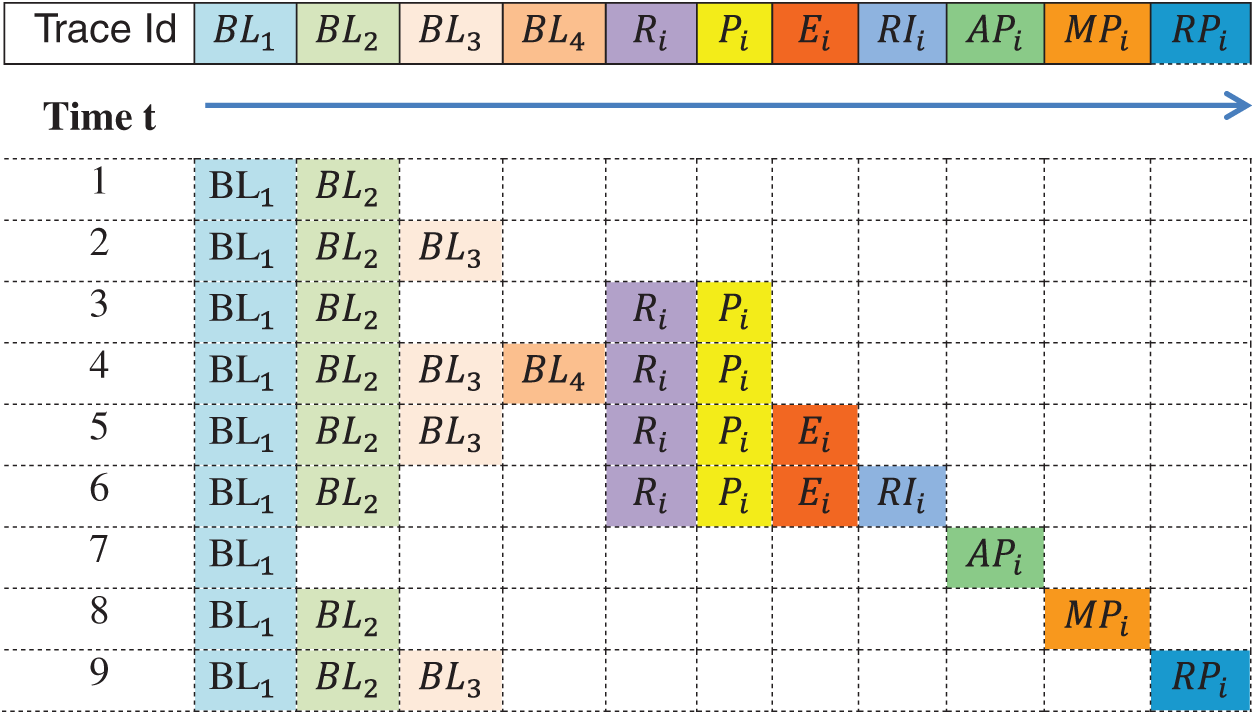
Figure 1: Visual event stream for event universe
Table 2: Event log tracing mechanism
The web server log is converted into a set of web event logs and is conceptually divided into event blocks (EB) with a width w such that:
where: p is the total number of processes in the event log and len is the length parameter.
The basic structure of the user process counting is a set of entries of the form
• e is an event action of the log stream that can be categorized based on the user behavior.
• u is the user of the event who performing the action.
•
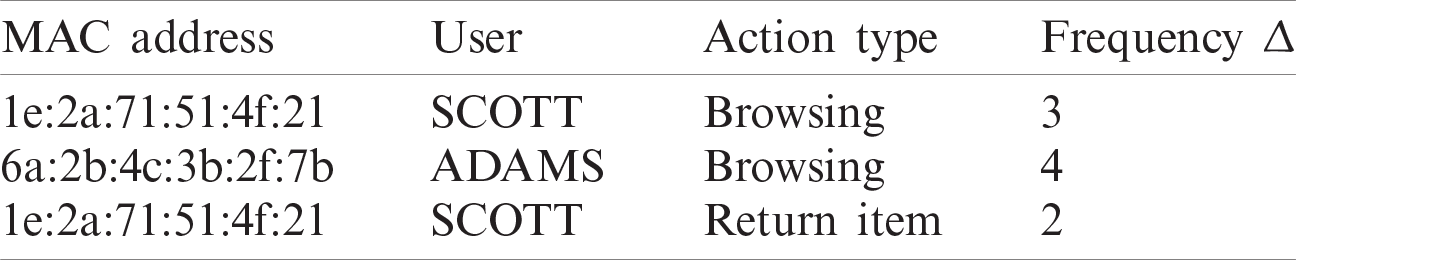
As shown in Tab. 3, a user process counting mechanism is performed to record all user behavior on behalf of the frequency of each E-business process. The MAC address is recorded with the username of the user, the action type, and the action frequency
Table 3: User behavior prediction
The main objective of this paper is to improve the quality of predicting user activities based on the event log of two different data sets. These datasets are the Online Shoppers Purchasing Intention [37,38] and the Instacart Market Basket Analysis dataset of Kaggle [39]. As presented in Fig. 2, the proposed mechanism is based on applying different clustering algorithms such as density-based clustering, farthest first cluster, EM cluster and K-mean cluster. These methods groups similar objects into the same cluster. After applying the clustering algorithms, a set of classifications algorithms are applied to measure the predicted classes on the clustered data.
As presented in Fig. 2, the event log tracing is applied on both datasets and a clustering process is performed before the classification process for enhancing the performance of the user tracing process over infinite user transactions. The objective of applying clustering algorithms is to determine similar objects into a set of groups called clusters. The objects that are similar to each other are grouped into the same cluster for maximizing the intra-class similarity. In order to validate the proposed mechanism, two distinct datasets are applied on the clustering and classification algorithms to measure the accuracy of the algorithms in predicting and enhancing user behavior tracing activities. The first clustering-classification mechanism is applied by performing the clustering process using the Farthest First cluster algorithm [40], Expectation Maximization (EM) cluster algorithm [41], and K-mean cluster algorithm [42]. The clustered results are applied on eight classification algorithms: Bayes Net [43], Naïve Bayes [43], K* [44], Filtered Classifier [45], Decision Table [43], JRip algorithm [46], J48 [47], and Logistic Model Tree (LMT) [48]. The second clustering-classification mechanism is applied by performing the clustering process using density-based clustering [49]. The clustered results are embedded with five classification algorithms: Support Vector Machine (SVM) [50], Logistic Regression (LR) [51], K-nearest neighbor (KNN) [52], Random Forest (RF) [53], and Logistic Model Tree (LMT) [48]. Different performance metrics are used to measure and compare all clustering-classification results. The True Positive (TP) rate is used to measure the predicted classes correctly while the False Positive (FP) rate is incorrectly predicting the positive classes. The TP and FP are presented in Eqs. (8) and (9) as follows:
where, TPR is the prediction of true positive classes into which the true positive classes are divided by the sum of both true positive and false negative classes.
where, FPR is the prediction of false positive classes into which the false positive classes are divided by the sum of both false positive and true negative classes.
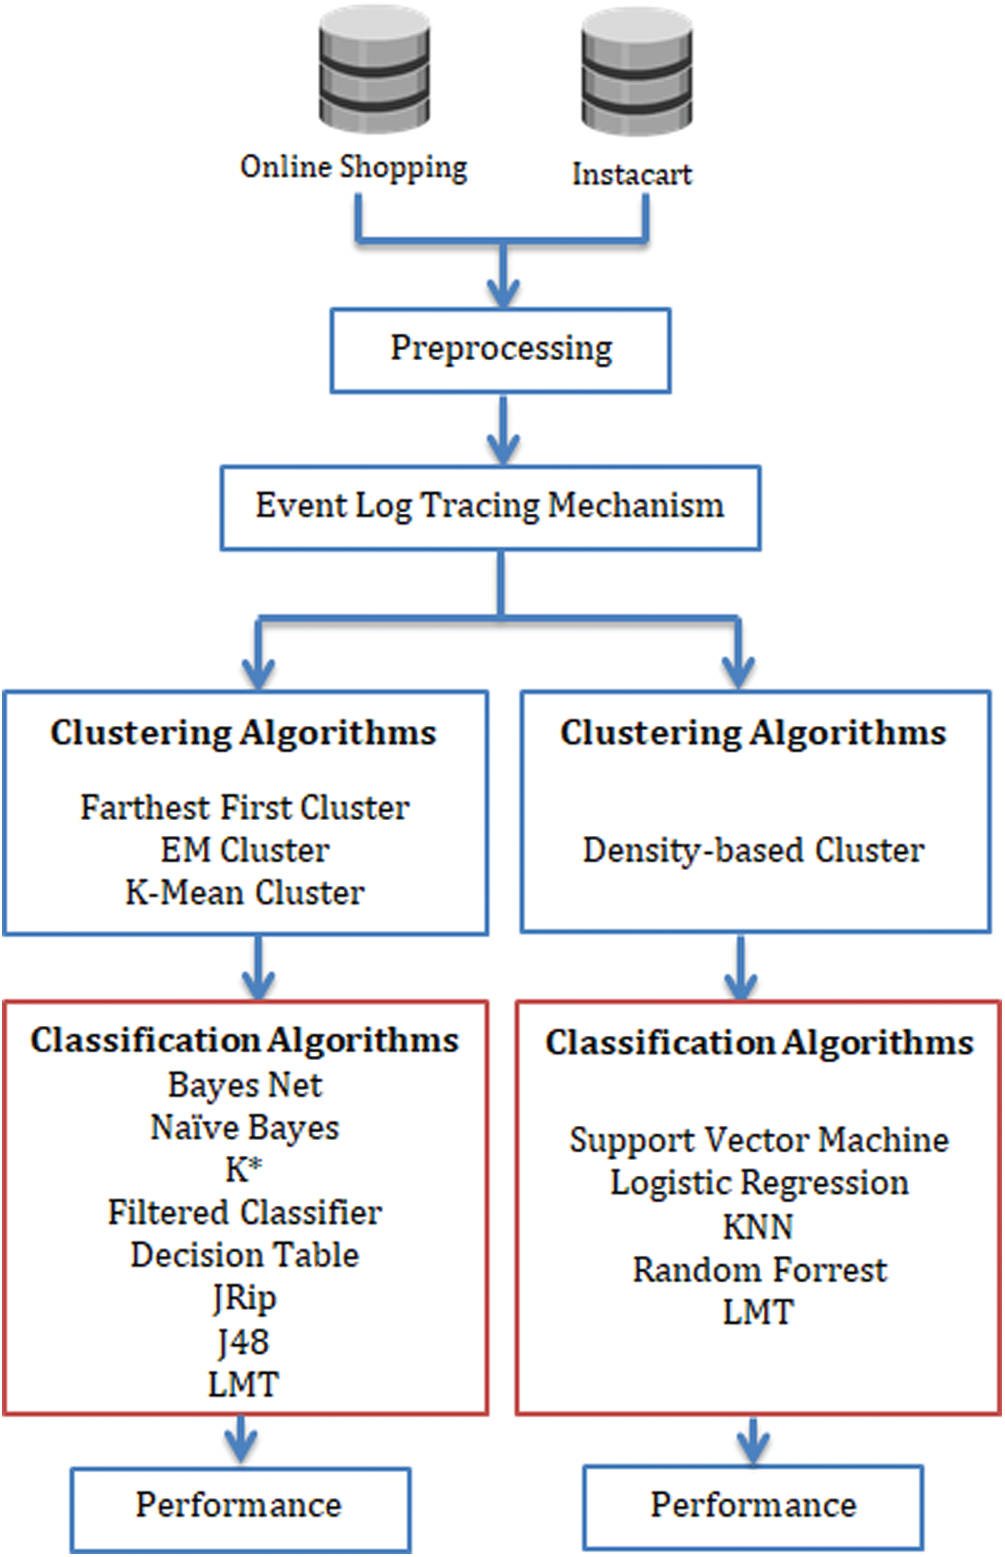
Figure 2: Clustering and classification framework for different datasets
The Precision of the dataset is measured by dividing the true positive predictions by the true positive and false positive predictions as shown in Eq. (10):
The Recall of the dataset is measured by dividing the true positive predictions by the true positive and false negative predictions as shown in Eq. (11):
The F1-Measure ratio is measured using the mean of both precision and recall as shown in Eq. (12):
The classifier accuracy is measured by the percentage of classes that were predicted correctly while the classifier error rate is the percentage of incorrect predicted classes as shown in the Eqs. (13) and (14).
The experimental results are conducted on two datasets: Online Shoppers and Instacart. Different clustering and classification algorithms are applied to measure the performance and accuracy of predicting user behavior and user tracing processes. The results are explained as follows:
7.1 Online Shoppers Purchasing Intention Dataset Performance
The Online Shoppers dataset is applied on three clustering algorithms before performing the classification process. The three clustering algorithms are Farthest First cluster, EM cluster, and K-mean cluster. The three clustering algorithms are used as a previous stage before performing the classification process using eight classification algorithms. As presented in Fig. 3, the true positive rate (TPR) is measured on all clustered-classification algorithms. The EM clustering algorithm with the LMT classification algorithm achieved the best true positive result with 100%. The K-mean clustering algorithm with also LMT classification algorithm achieved 99% true positive rate while the best Farthest First cluster algorithm achieved 93% true positive rate with the LMT classification algorithm.
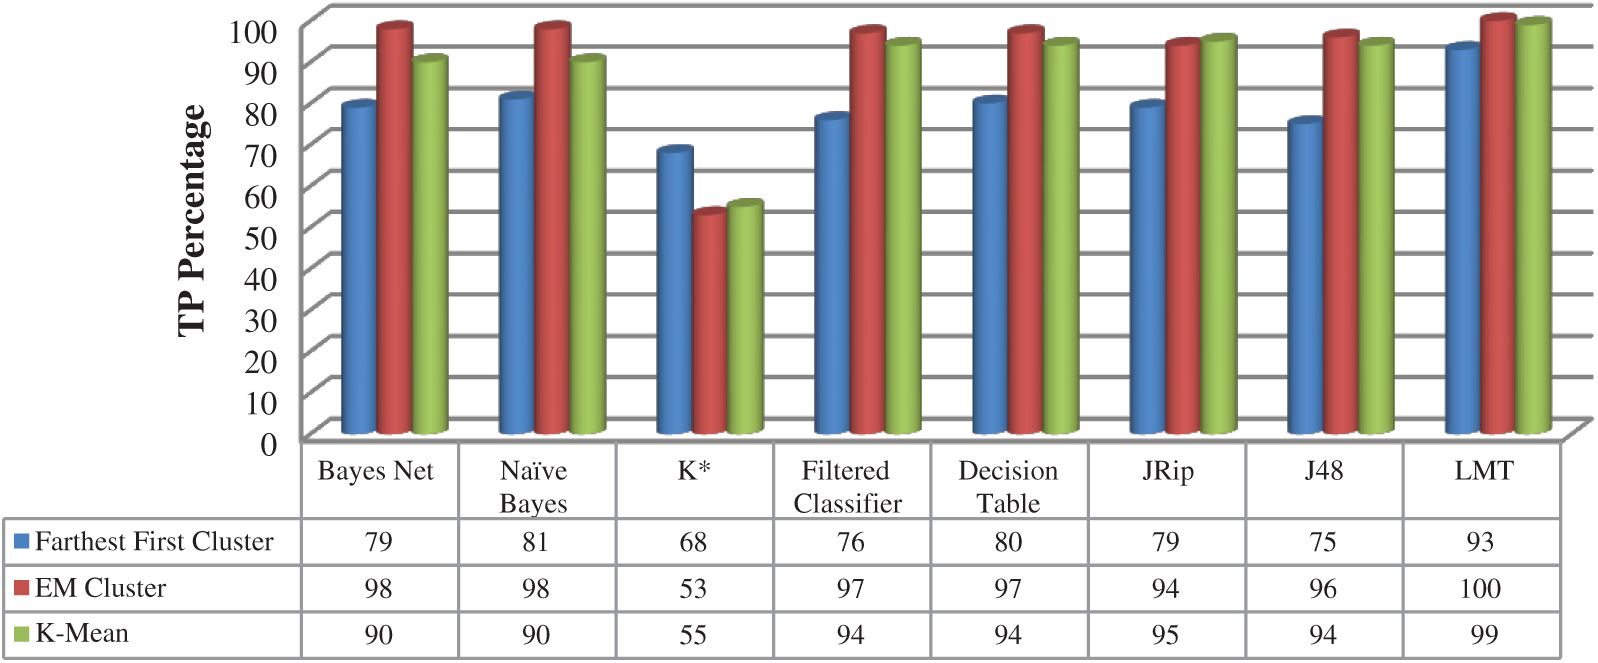
Figure 3: True positive rate—Online shoppers dataset
As presented in Fig. 4, the LMT classification algorithm achieved the minimum false positive rate (FPR) on all clustering algorithms: Farthest First, EM, and K-mean with 15%, 0%, and 0.6% respectively.
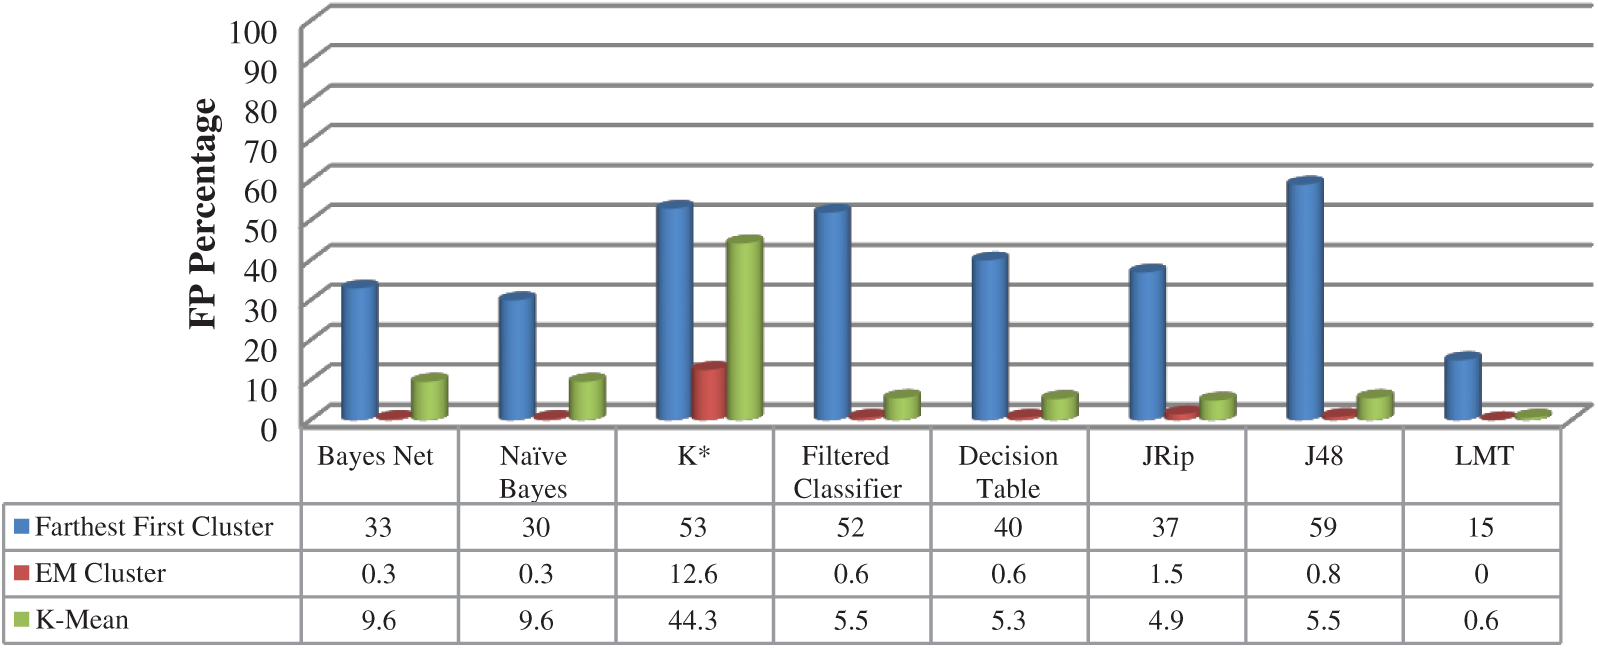
Figure 4: False positive rate—Online shoppers dataset
As shown in Figs. 5 and 6, the LMT classification algorithm achieved the best precision and recall results with all clustering algorithms with 93%, 100%, and 99% using Farthest First, EM, and K-mean clustering algorithms respectively. The EM clustering algorithm achieved high precision on both Bayes Net and Naïve Bayes classification algorithms with 98% on both algorithms.
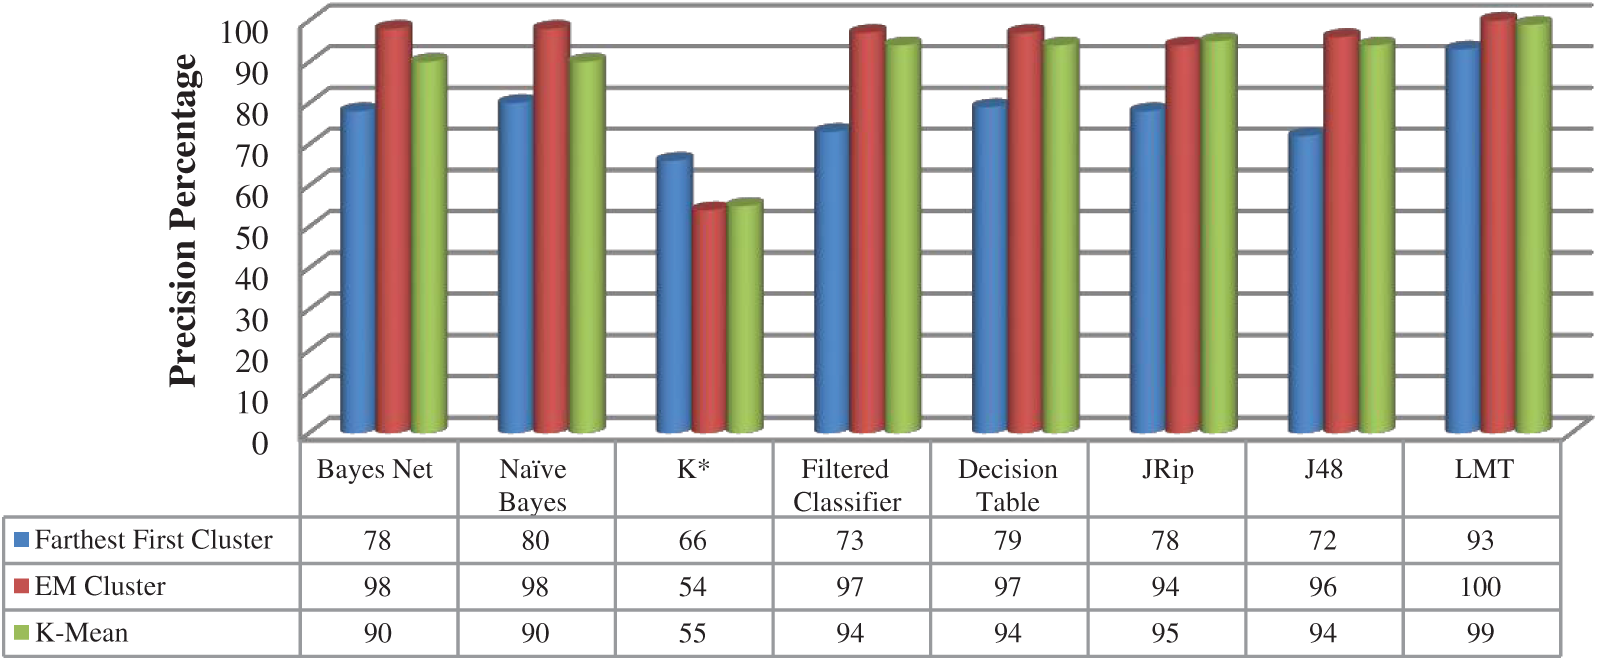
Figure 5: Precision—Online shoppers dataset
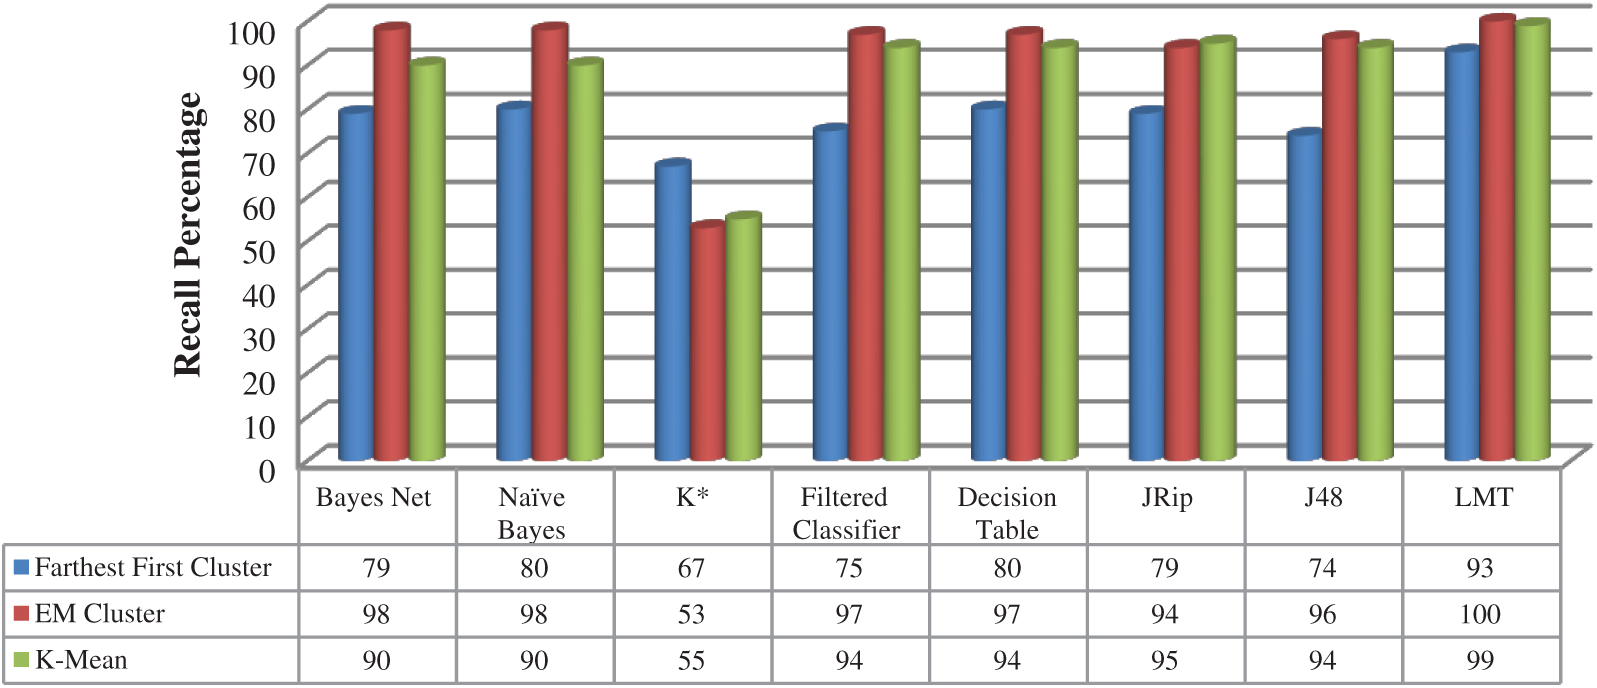
Figure 6: Recall—Online shoppers dataset
In Fig. 7, the F1-Measure of the Online Shoppers dataset achieved high results using an LMT classification algorithm with Farthest First, EM, and K-mean clustering algorithms with 92%, 100%, and 99% respectively.
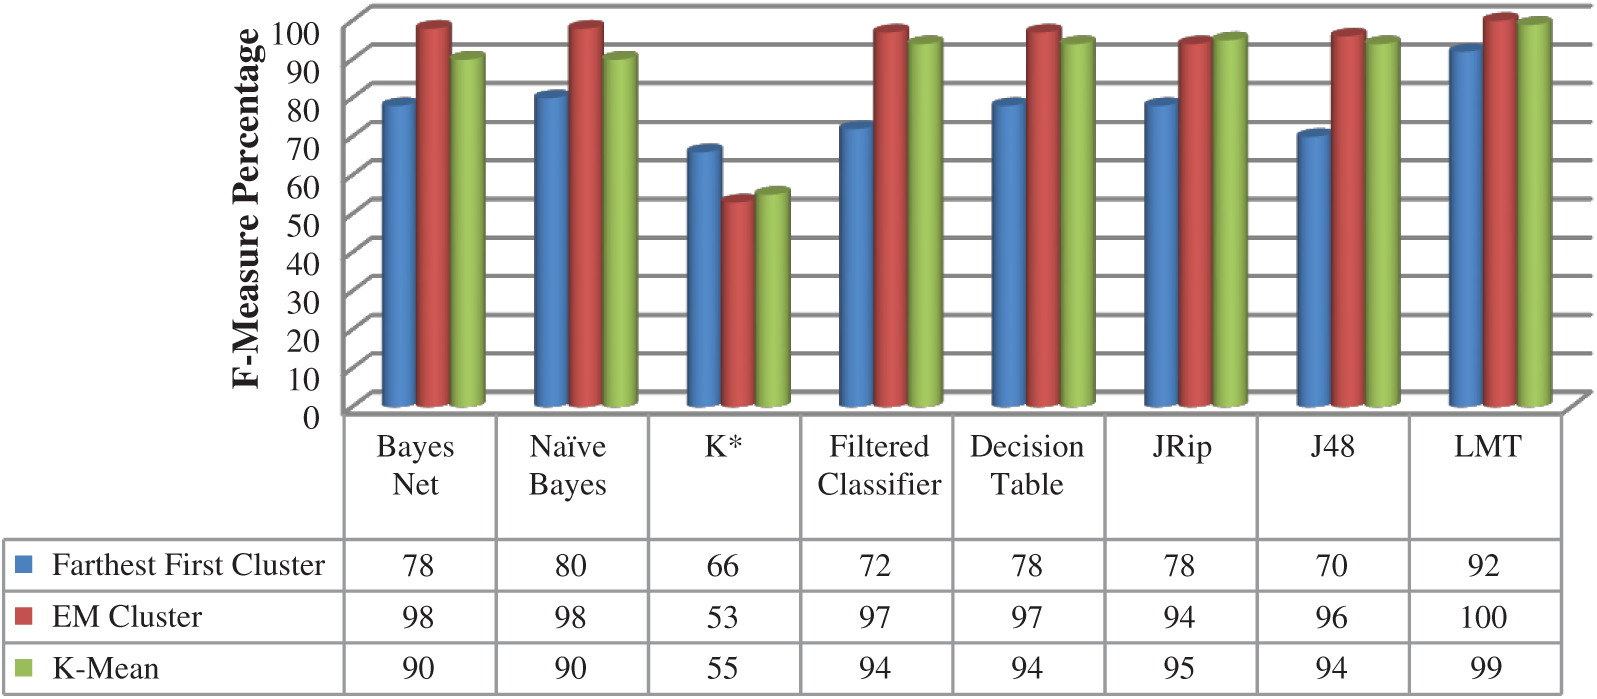
Figure 7: F1-measure—Online shoppers dataset
7.2 Instacart Dataset Performance
The Instacart dataset is tested to measure the performance using density-based clustering with five classification algorithms: SVM, Logistic Regression, KNN, Random Forest, and LMT. As shown in Fig. 8, the true positive rate (TPR) achieved high results in all classification algorithms with 100% except the LMT classification algorithm with 99.4%. The false positive rate (FPR) achieved 0% with all clustering-classification algorithms except the LMT classification algorithm with a 0.4% false positive rate.
As shown in Fig. 9, the precision, recall, and F1-Measure achieved similar results with 100% on all clustering—classification algorithms except the LMT classification algorithm that achieved 99.4%. The experimental results were repeated again by interchanging the clustering-classification algorithms with the Online Shoppers and Instacart datasets to prove the capability of each clustering-classification algorithms in predicting user behavior and improving the user tracing mechanism. The accuracy and error rate of all clustering and classification algorithms are measured on both Online Shoppers and Instacart datasets as shown in Tab. 4.
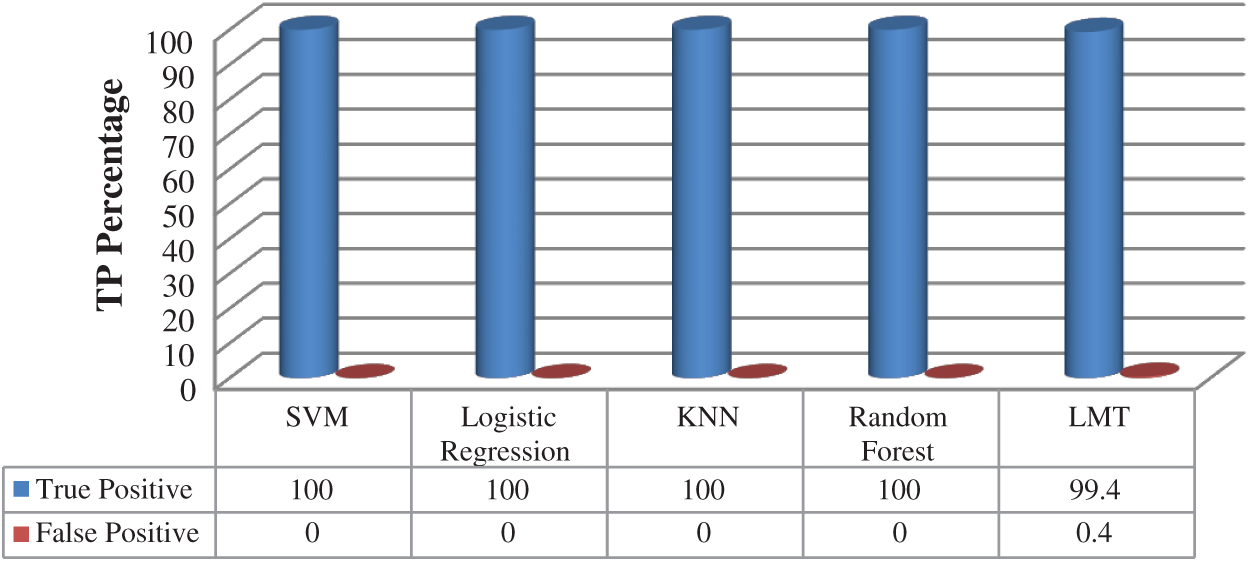
Figure 8: True positive and false positive rates—Instacart dataset
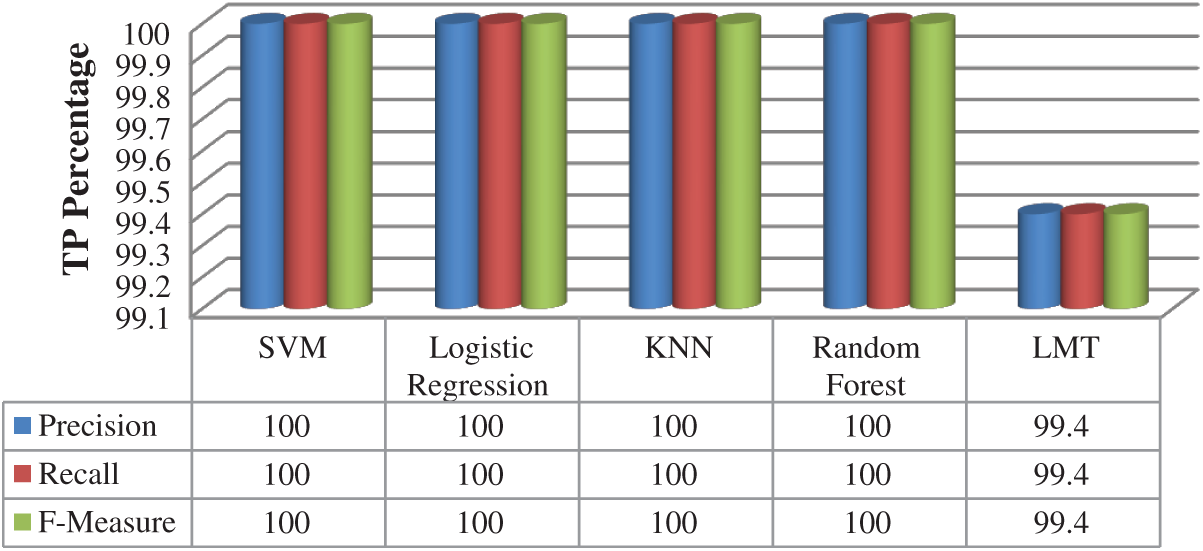
Figure 9: Precision, recall, and F-measure—Instacart dataset
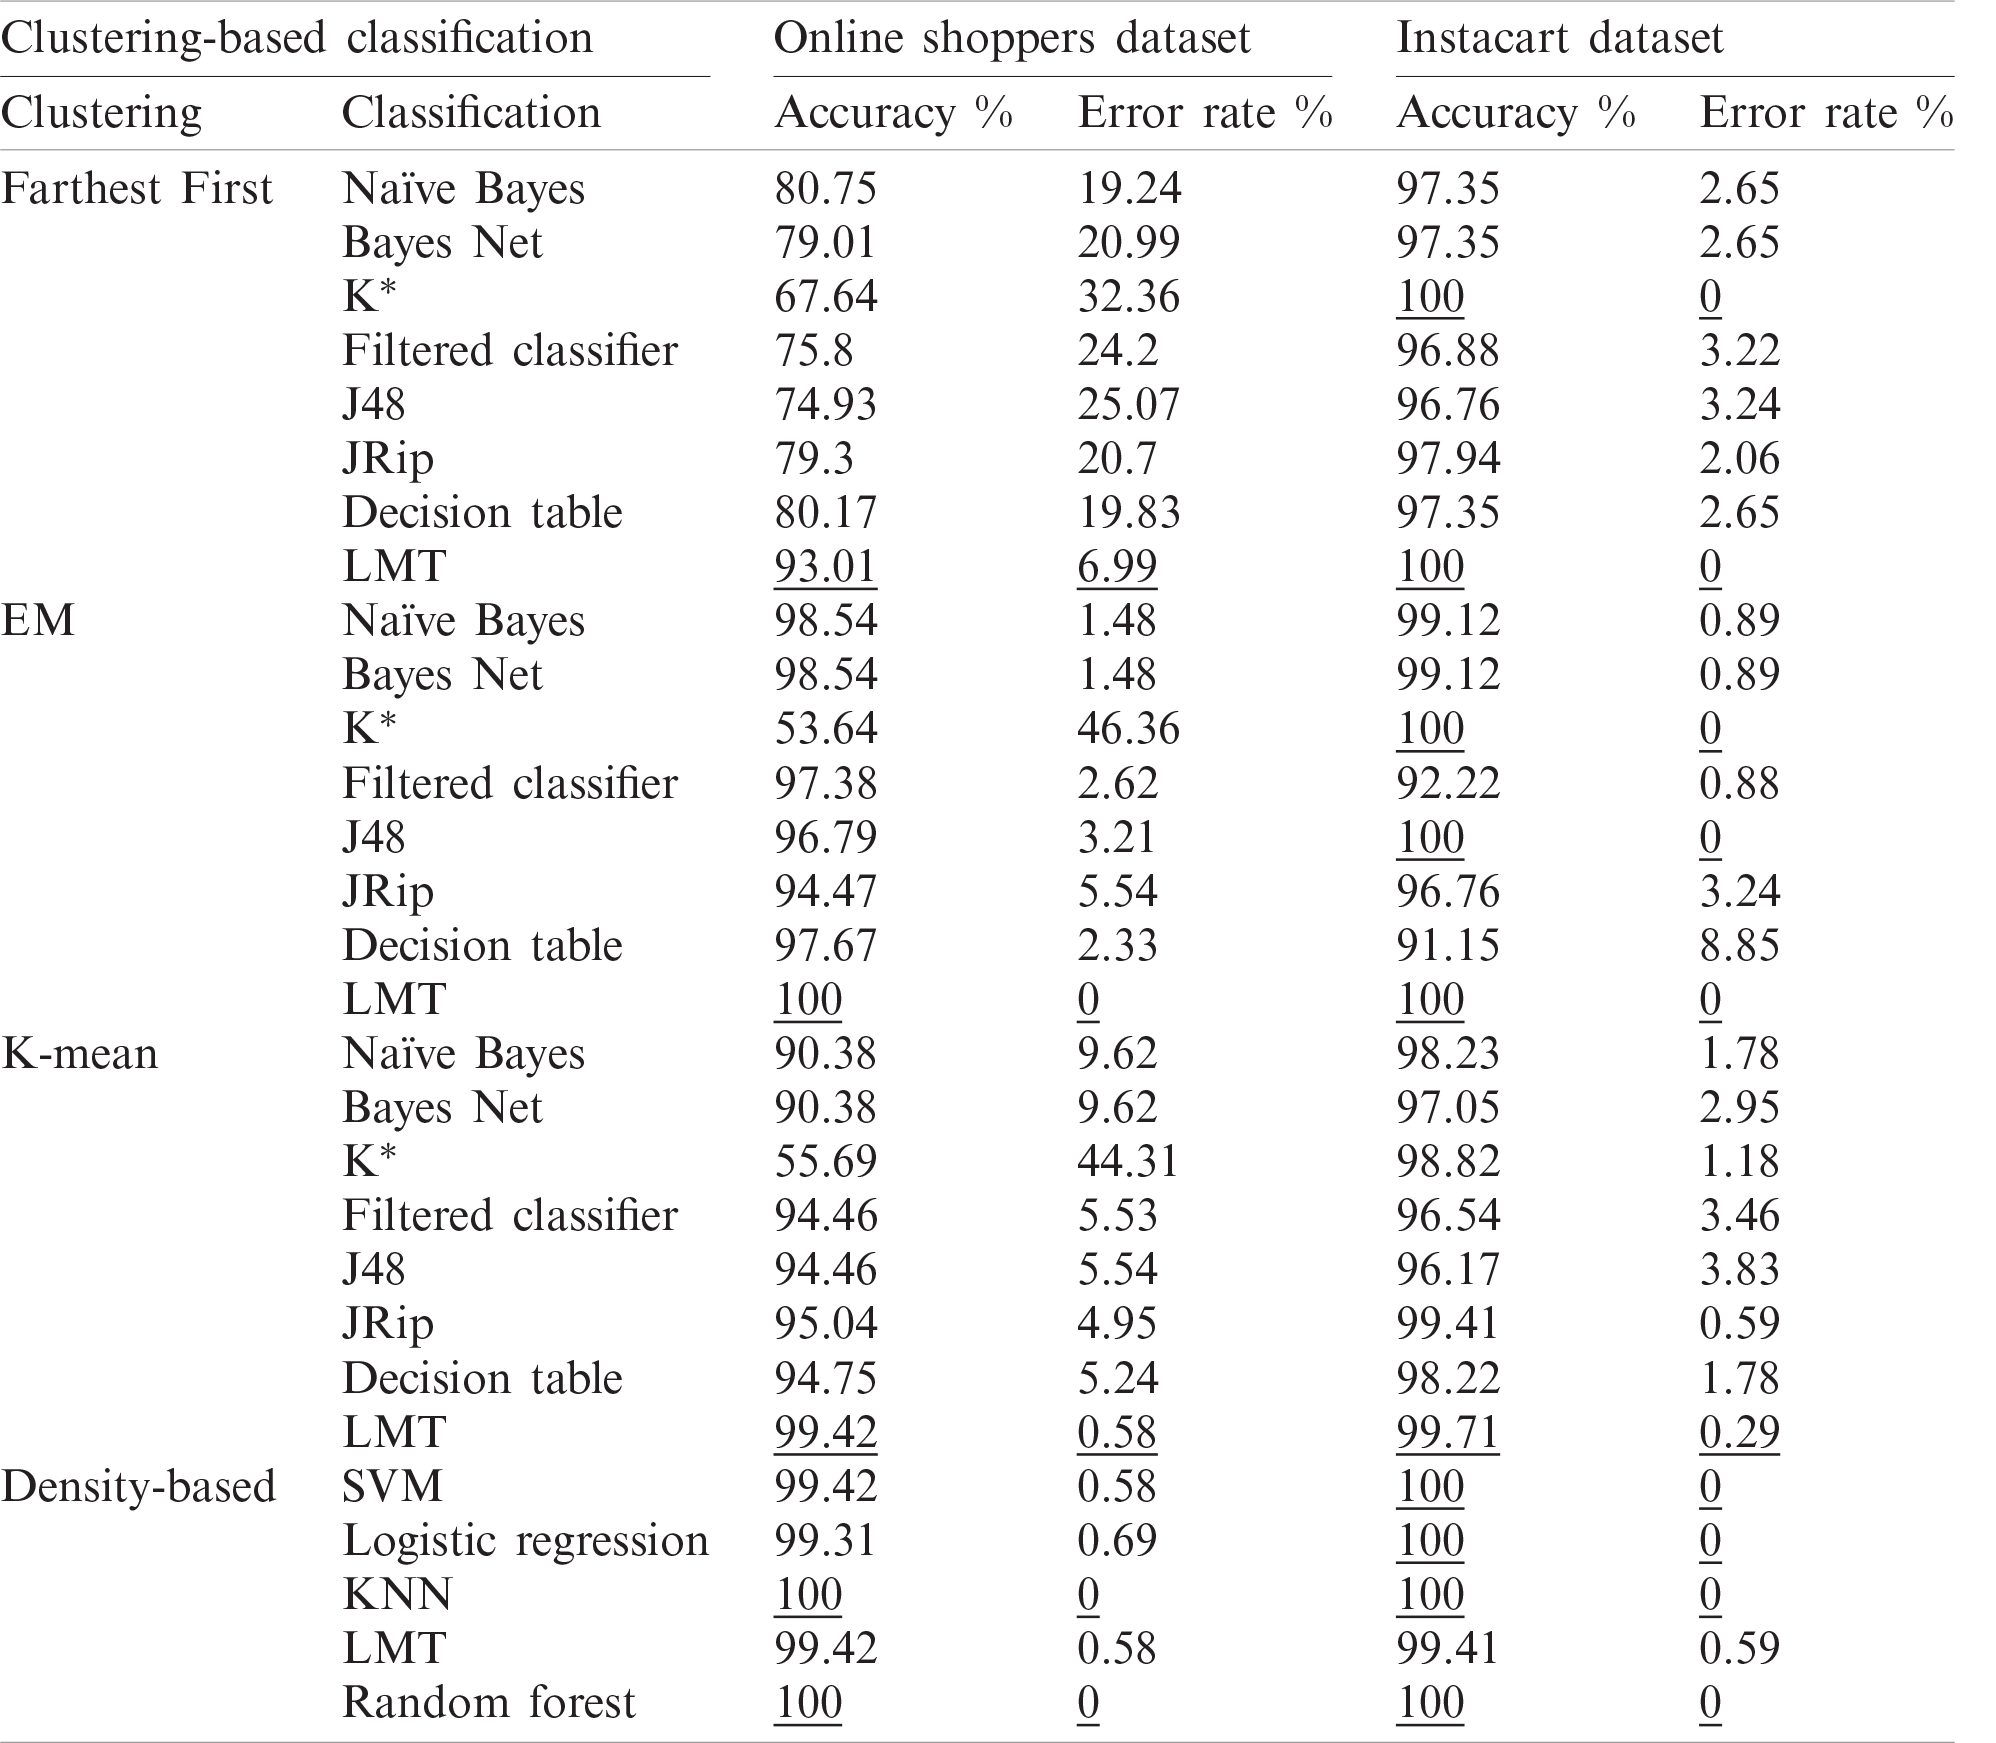
In order to validate the proposed mechanism, two distinct datasets are applied on the clustering and classification algorithms to measure the accuracy of the algorithms in predicting and enhancing user behavior tracing activities. As presented in Tab. 4, the Farthest First clustering algorithm with LMT classification algorithm achieved the best accuracy on the Online Shoppers dataset with 93.01%, while on the Instacart dataset the farthest first algorithm achieved 100% accuracy with both LMT and K* classification algorithms. Using the EM clustering algorithm, the LMT classification algorithm achieved 100% accuracy on both online shopping and Instacart datasets while K* and J48 achieved an accuracy of 100% on the Instacart dataset only. Using the K-mean clustering algorithm, the LMT classification algorithm still provides provable accuracy with 99.42% and 99.71% of online shopping and Instacart datasets respectively. When the density-based clustering is applied, different classification algorithms recorded high accuracy with a low error rate. Random forest and KNN classification algorithms recorded 100% accuracy of the Online Shoppers dataset. Using the Instacart dataset, the random forest, KNN, Logistic Regression, and SVM achieved high accuracy with 100%. The LMT classification algorithm still recorded high accuracy with 99.42% and 99.41% on both online shopping and Instacart datasets. The error rate on density-based clustering achieved the lowest results when compared to the remaining clustering techniques; farthest first, EM, and K-mean.
Table 4: Clustering-based classification accuracy
E-business transactions are now necessary during the development of information systems and their related technologies. With the increasing need to develop different methods to deal with the intensity of business transactions, the log file that records all user processes must be well formulated to best utilize all transactions in the shortest possible time. Many research papers enhance the E-business structure in explaining business services without developing and enhancing a well-designed web server log that can record all user records. This paper proposed an event stream mechanism that can organize and record user and customer transactions based on a set of formula patterns. The paper visualizes an even stream to explore the overall enhanced tracing mechanism. The proposed mechanism is based on applying different clustering algorithms such as density-based clustering, farthest first cluster, EM cluster and K-mean cluster. After applying the clustering algorithms, a set of classifications algorithms are applied to measure the predicted classes on the clustered data. The experimental results proved high efficiency in improving user tracing processes and predicting user behavior in acquiring future products. Some enhancements can be applied to the proposed mechanism by adding mean-shift and agglomerative hierarchical clustering algorithms with the same classification algorithms and datasets to verify the efficiency of the user tracing processes.
Funding Statement: The authors received no specific funding for this study.
Conflicts of Interest: The authors declare that they have no conflicts of interest to report regarding the present study.
1. P. H. Gaughan and R. G. Javalgi, “A framework for analyzing international business and legal ethical standards,” Business Horizons, vol. 61, no. 6, pp. 813–822, 2018. [Google Scholar]
2. C. Y. Yoon, “Measurement systems of individual E-business competency in an E-business management environment,” in Proc. 4th Int. Conf. on Computer Applications and Information Processing Technology, pp. 1–4, 2017. [Google Scholar]
3. Y. A. Solangi, Z. A. Solangi, A. Raza, M. B. S. A. Aziz, M. S. B. Hamzah et al., “Social commerce in e-business of Pakistan: Opportunities, challenges and solutions,” in Proc. Int. Conf. on Information and Communication Technology for the Muslim World, Kuala Lumpur, Malaysia, pp. 126–131, 2018. [Google Scholar]
4. C. W. Holsapple, S. H. Hsiao and R. Pakath, “Business social media analytics: Characterization and conceptual framework,” Decision Support Systems, vol. 110, no. 6, pp. 32–45, 2018. [Google Scholar]
5. M. Thakur, P. Anadure and H. Saini, “Log file analyzer,” Jaypee University of Information Technology, 2019. [Online]. Available: http://ir.juit.ac.in/123456789/22855. [Google Scholar]
6. V. Verma, A. K. Verma and S. S. Bhatia, “Comprehensive analysis of web log files for mining,” International Journal of Computer Science Issues, vol. 8, no. 6, pp. 199–202, 2011. [Google Scholar]
7. V. Sujatha and Punithavalli, “Improved user navigation pattern prediction technique from web log data,” Procedia Engineering, vol. 30, pp. 92–99, 2012. [Google Scholar]
8. A. James, “Optimization, security, privacy and trust in e-business systems,” Journal of Computer and System Sciences, vol. 81, no. 6, pp. 941–942, 2015. [Google Scholar]
9. V. Chang, Y. H. Kuo and M. Ramachandran, “Cloud computing adoption framework: A security framework for business clouds,” Future Generation Computer Systems, vol. 57, no. 1, pp. 24–41, 2016. [Google Scholar]
10. P. Álvarez, J. Fabra, S. Hernández and J. Ezpeleta, “Alignment of teacher’s plan and students’ use of LMS resources. analysis of Moodle logs,” in Proc. 15th Int. Conf. on Information Technology Based Higher Education and Training, Istanbul, Turkey, pp. 1–8, 2016. [Google Scholar]
11. N. B. Vasilyevna, “Security design for e-business applications,” in Proc. Int. Symp. on Ubiquitous Multimedia Computing, Hobart, TAS, Australia, pp. 248–251, 2008. [Google Scholar]
12. L. K. J. Grace, V. Maheswari and D. Nagamalai, “Analysis of web logs and web user in web mining,” International Journal of Network Security & Its Applications, vol. 3, no. 1, pp. 99–110, 2011. [Google Scholar]
13. M. A. Eltahir and A. F. A. Dafa-Alla, “Extracting knowledge from web server logs using web usage mining,” in Proc. Int. Conf. on Computing, Electrical and Electronic Engineering, Khartoum, Sudan, pp. 413–417, 2013. [Google Scholar]
14. A. V. Srinivas, “A survey on preprocessing of web-log data in web usage mining,” International Journal for Modern Trends in Science and Technology, vol. 3, no. 2, pp. 35–41, 2017. [Google Scholar]
15. K. R. Suneetha and R. Krishnamoorthi, “Identifying user behavior by analyzing web server access log file,” International Journal of Computer Science and Network Security, vol. 9, no. 4, pp. 327–332, 2009. [Google Scholar]
16. T. Hussain, S. Asghar and N. Masood, “Web usage mining: A survey on preprocessing of web log file,” in Proc. Int. Conf. on Information and Emerging Technologies, Karachi, Pakistan, pp. 1–6, 2010. [Google Scholar]
17. N. Niraula, “Web log data analysis: Converting unstructured web log data into structured data using Apache Pig,” M. S. dissertation, Cloud State University, 2017. [Online]. Available: https://repository.stcloudstate.edu/csit_etds/19. [Google Scholar]
18. C.-J. Lin, F. Wu and I.-H. Chiu, “Using hidden Markov Model to predict the surfing user’s intention of cyber purchase on the web,” Journal of Global Business Management, vol. 5, no. 2, pp. 1–6, 2009. [Google Scholar]
19. N. Mohammadifard, Modeling User Behavior from E-Commerce Data with Hidden Markov Models and Logistic Regression. McGill University: M. S., School of Computer Science, pp. 1–46, 2013. [Google Scholar]
20. S. Mowla and N. P. Shetty, “Analysis of web server logs to understand internet user behavior and develop digital marketing strategies,” International Journal of Engineering and Technology, vol. 7, no. 4.41, pp. 15–20, 2018. [Google Scholar]
21. M. U. Hassan, K. Shaukat, D. Niu, S. Mahreen, Y. Ma et al., “Web-logs prediction with web mining,” in Proc. 2nd IEEE Advanced Information Management, Communicates, Electronic and Automation Control Conf., Xian, China, pp. 1295–1299, 2018. [Google Scholar]
22. M. Kumar and Meenu, “Analysis of visitor’s behavior from web log using web log expert tool,” in Proc. Int. Conf. of Electronics, Communication and Aerospace Technology, Coimbatore, India, vol. 2, pp. 296–301, 2017. [Google Scholar]
23. G. Suchacka and G. Chodak, “Practical aspects of log file analysis for E-commerce,” in Proc. Int. Conf. on Computer Networks, Heidelberg, Berlin, pp. 562–572, 2013. [Google Scholar]
24. T. Murata and K. Saito, “Extracting users’ interests from web log data,” in Proc. IEEE/WIC/ACM Int. Conf. on Web Intelligence, Hong Kong, China, pp. 343–346, 2006. [Google Scholar]
25. N. Poggi, V. Muthusamy, D. Carrera and R. Khalaf, “Business process mining from E-commerce web logs,” in Proc. 11th Int. Conf. on Business Process Management, Beijing, China, pp. 65–80, 2013. [Google Scholar]
26. M. Jalali, N. Mustapha, M. Ali Mamat and B. S. Nasir, “Web user navigation pattern mining approach based on graph partitioning algorithm,” Journal of Theoretical and Applied Information Technology, vol. 4, no. 11, pp. 1125–1130, 2008. [Google Scholar]
27. Y. Zheng, R. Hu, S. Fung, C. Yu and G. Long, “Clustering social audiences in business information networks,” Pattern Recognition, vol. 100, pp. 1–37, 2020. [Google Scholar]
28. N. M. S. Iswari, E. K. Budiardjo, H. B. Santoso and Z. A. Hasibuan, “E-business application recommendation for SMEs based on organization profile using random forest classification,” in Proc. Int. Seminar on Research of Information Technology and Intelligent Systems, Yogyakarta, Indonesia, pp. 522–527, 2019. [Google Scholar]
29. B. A. Tama and M. Comuzzi, “An empirical comparison of classification techniques for next event prediction using business process event logs,” Expert Systems with Applications, vol. 129, no. 12, pp. 233–245, 2019. [Google Scholar]
30. B. Fazzinga, F. Folino, F. Furfaro and L. Pontieri, “An ensemble-based approach to the security-oriented classification of low-level log traces,” Expert Systems with Applications, vol. 153, no. 2, pp. 1–25, 2020. [Google Scholar]
31. S. N. Chaurasia, P. Sharma and V. Jain, “Analysis of web log server files of E-commerce websites to study customer behavior pattern,” International Journal for Research in Applied Science and Engineering Technology, vol. 5, no. 4, pp. 1390–1397, 2017. [Google Scholar]
32. A. M. Mostafa, J. Alroudhan and M. M. Hassan, “LTL formula patterns for enhancing the performance analysis of E-business structure,” Journal of Theoretical and Applied Information Technology, vol. 97, no. 8, pp. 2429–2439, 2019. [Google Scholar]
33. G. De Giacomo, R. De Masellis and M. Montali, “Reasoning on LTL on finite traces: Insensitivity to infiniteness,” in Proc. Twenty-Eighth AAAI Conf. on Artificial Intelligence, Quebec, Canada, pp. 1027–1033, 2014. [Google Scholar]
34. S. Hernández, P. Álvarez, J. Fabra and J. Ezpeleta, “Analysis of users’ behavior in structured e-commerce websites,” IEE Access, vol. 5, pp. 11941–11958, 2017. [Google Scholar]
35. L. C. Milton and A. Memon, “Intruder detector: A continuous authentication tool to model user behavior,” in Proc. IEEE Conf. on Intelligence and Security Informatics, Tucson, AZ, USA, pp. 286–291, 2016. [Google Scholar]
36. A. M. Mostafa, “Design and implementation of secured E-business structure with LTL patterns for user behavior prediction,” in Proc. Int. Conf. on Computing, Riyadh, Saudi Arabia, pp. 185–200, 2019. [Google Scholar]
37. C. O. Sakar and Y. Kastro, Online Shoppers Purchasing Intention. 2018. [Online]. Available: https://archive.ics.uci.edu/ml/datasets/Online+Shoppers+Purchasing+Intention+Dataset. [Google Scholar]
38. C. O. Sakar, S. O. Polat, M. Katircioglu and Y. Kastro, “Real-time prediction of online shoppers’ purchasing intention using multilayer perceptron and LSTM recurrent neural networks,” Neural Computing and Applications, vol. 31, no. 10, pp. 6893–6908, 2019. [Google Scholar]
39. Kaggle, “Instacart Market Basket Analysis,” 2018. [Online]. Available: https://www.kaggle.com/c/instacart-market-basket-analysis/data. [Google Scholar]
40. K. Shyamala and S. Kalaivani, “An effective web page reorganization through heap tree and farthest first clustering approach,” in Proc. IEEE Int. Conf. on Power, Control, Signals and Instrumentation Engineering, Chennai, India, pp. 2259–2262, 2017. [Google Scholar]
41. M. Nilashi, O. bin Ibrahim, N. Ithnin and N. H. Sarmin, “A multi-criteria collaborative filtering recommender system for the tourism domain using expectation maximization (EM) and PCA-ANFIS,” Electronic Commerce Research and Applications, vol. 14, no. 6, pp. 542–562, 2015. [Google Scholar]
42. E. Zhu, Y. Zhang, P. Wen and F. Liu, “Fast and stable clustering analysis based on grid-mapping K-means algorithm and new clustering validity index,” Neurocomputing, vol. 363, no. 2, pp. 149–170, 2019. [Google Scholar]
43. C. Vaghela, N. Bhatt and D. Mistry, “A survey on various classification techniques for clinical decision support system,” International Journal of Computer Applications, vol. 116, no. 23, pp. 14–17, 2015. [Google Scholar]
44. W. Wiharto, H. Kusnanto and H. Herianto, “Intelligence system for diagnosis level of coronary heart disease with K-star algorithm,” Healthc Inform. Res., vol. 22, no. 1, pp. 30–38, 2016. [Google Scholar]
45. G. N. Chandrika and E. S. Reddy, “An efficient filtered classifier for classification of unseen test data in text documents,” in Proc. IEEE Int. Conf. on Computational Intelligence and Computing Research, Coimbatore, India, pp. 1–4, 2017. [Google Scholar]
46. P. Amornsinlaphachai, “Efficiency of data mining models to predict academic performance and a cooperative learning model,” in Proc. 8th Int. Conf. on Knowledge and Smart Technology, Chiang Mai, Thailand, pp. 66–71, 2016. [Google Scholar]
47. R. Patil and V. M. Barkade, “Class-specific features using J48 classifier for text classification,” in Proc. Fourth Int. Conf. on Computing Communication Control and Automation, Pune, India, pp. 1–5, 2018. [Google Scholar]
48. H. Nematallah, S. Rajan and A. Cretu, “Logistic model tree for human activity recognition using smartphone-based inertial sensors,” in Proc. IEEE SENSORS, Montreal, QC, Canada, pp. 1–4, 2019. [Google Scholar]
49. V. Vu and H. Do, “Density-based clustering with side information and active learning,” in Proc. 9th Int. Conf. on Knowledge and Systems Engineering, Hue, Vietnam, pp. 166–171, 2017. [Google Scholar]
50. B. Alghofaily and C. Ding, “Meta-feature based data mining service selection and recommendation using machine learning models,” in Proc. IEEE 15th Int. Conf. on E-Business Engineering, Xi’an, China, pp. 17–24, 2018. [Google Scholar]
51. K. Ghazvini, M. Yousefi, F. Firoozeh and S. Mansouri, “Predictors of tuberculosis: Application of a logistic regression model,” Gene Reports, vol. 17, no. 1, pp. 1–4, 2019. [Google Scholar]
52. C.-X. Nie and F. T. Song, “Analyzing the stock market based on the structure of KNN network,” Chaos, Solitons & Fractals, vol. 113, no. 1, pp. 148–159, 2018. [Google Scholar]
53. J. L. Speiser, M. E. Miller, J. Tooze and E. Ip, “A comparison of random forest variable selection methods for classification prediction modeling,” Expert Systems with Applications, vol. 134, no. 10, pp. 93–101, 2019. [Google Scholar]
 | This work is licensed under a Creative Commons Attribution 4.0 International License, which permits unrestricted use, distribution, and reproduction in any medium, provided the original work is properly cited. |